Independence Contract Drilling Inc
Independence Contract Drilling — Enercom: The Oil and Gas Conference 2021
32 slides from Independence Contract Drilling's conference presentation, Aug 17, 2021
Slide 1: Enercom: The Oil and Gas Conference August 16-18, 2021
Enercom: The Oil and Gas Conference August 16-18, 2021
Slide 2: Preliminary Matters
2 Preliminary Matters Various statements contained in this presentation, including those that express a belief, expectation or intention, as well as those that are not statements of historical fact, are forward-looking statements. These forward-looking statements may include projections and estimate
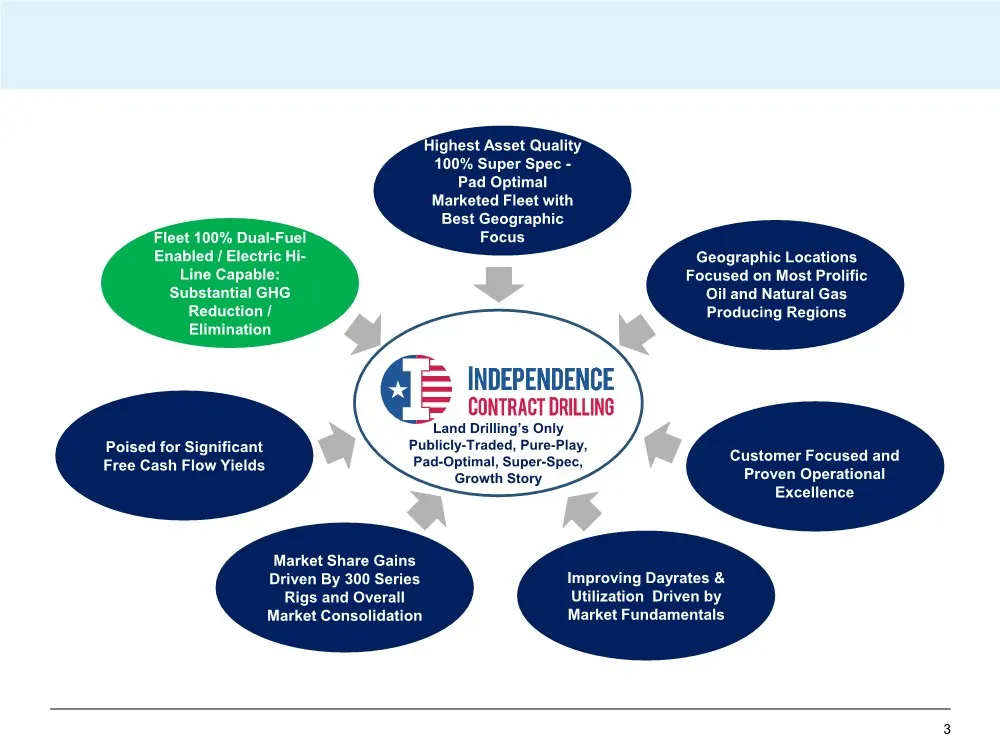
Slide 3: Land Drilling's Only Publicly-Traded, Pure-Play, Pad-Optimal, Super-Spec, Growth Story
3 Land Drilling’s Only Publicly-Traded, Pure-Play, Pad-Optimal, Super-Spec, Growth Story Highest Asset Quality 100% Super Spec - Pad Optimal Marketed Fleet with Best Geographic Focus Improving Dayrates & Utilization Driven by Market Fundamentals Market Share Gains Driven By 300 Series Rigs and Overa
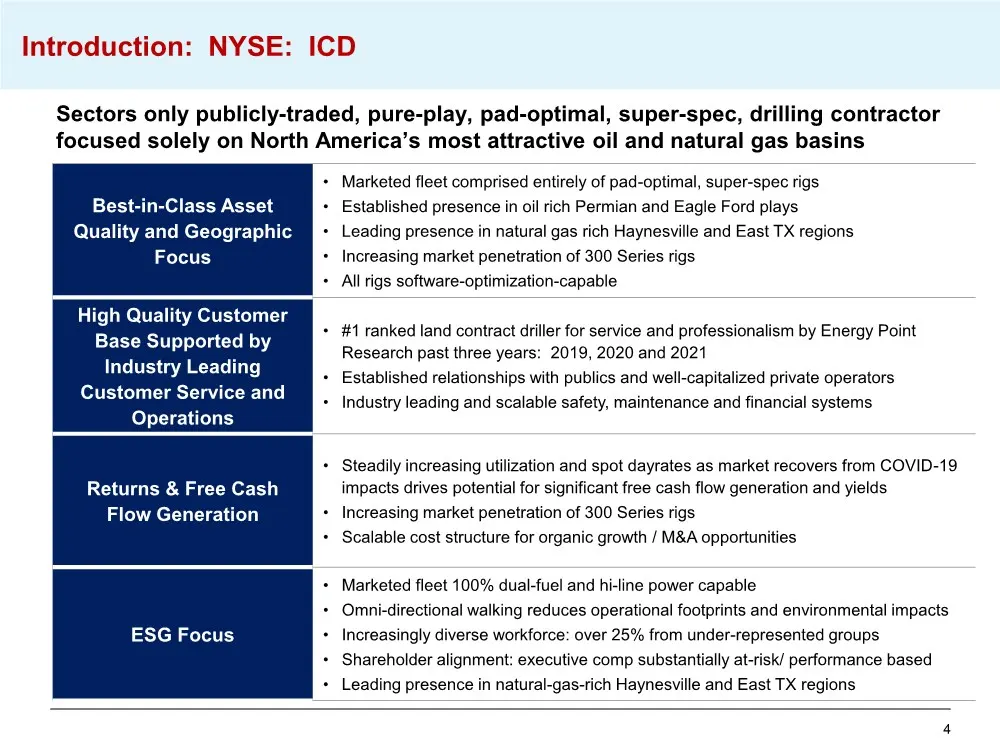
Slide 4: Introduction: Best-in-Class Asset Quality and Geographic Focus
4 Introduction: NYSE: ICD Best-in-Class Asset Quality and Geographic Focus • Marketed fleet comprised entirely of pad-optimal, super-spec rigs • Established presence in oil rich Permian and Eagle Ford plays • Leading presence in natural gas rich Haynesville and East TX regions • Increasing market pe
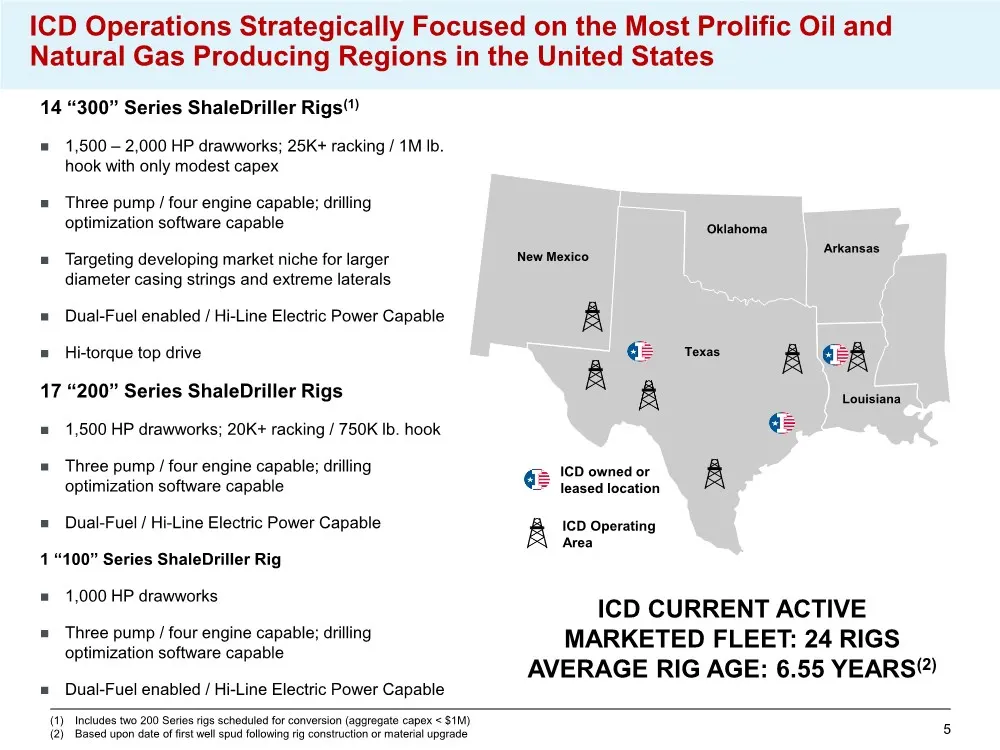
Slide 5: "300" Series ShaleDriller Rigs
5 14 “300” Series ShaleDriller Rigs(1) ◼ 1,500 – 2,000 HP drawworks; 25K+ racking / 1M lb. hook with only modest capex ◼ Three pump / four engine capable; drilling optimization software capable ◼ Targeting developing market niche for larger diameter casing strings and extreme laterals ◼ Dual-Fuel en
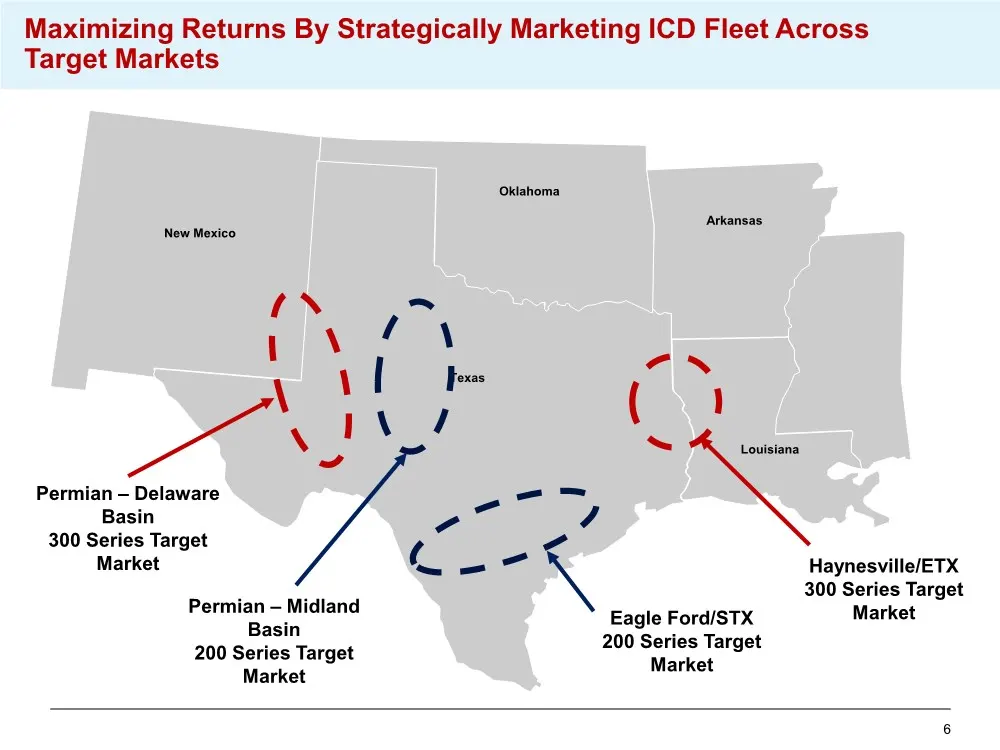
Slide 6: Maximizing Returns By Strategically Marketing ICD Fleet Across Target Markets
6 Maximizing Returns By Strategically Marketing ICD Fleet Across Target Markets Texas Oklahoma Arkansas Louisiana New Mexico Haynesville/ETX 300 Series Target Market Permian – Delaware Basin 300 Series Target Market Permian – Midland Basin 200 Series Target Market Eagle Ford/STX 200 Series Target Ma
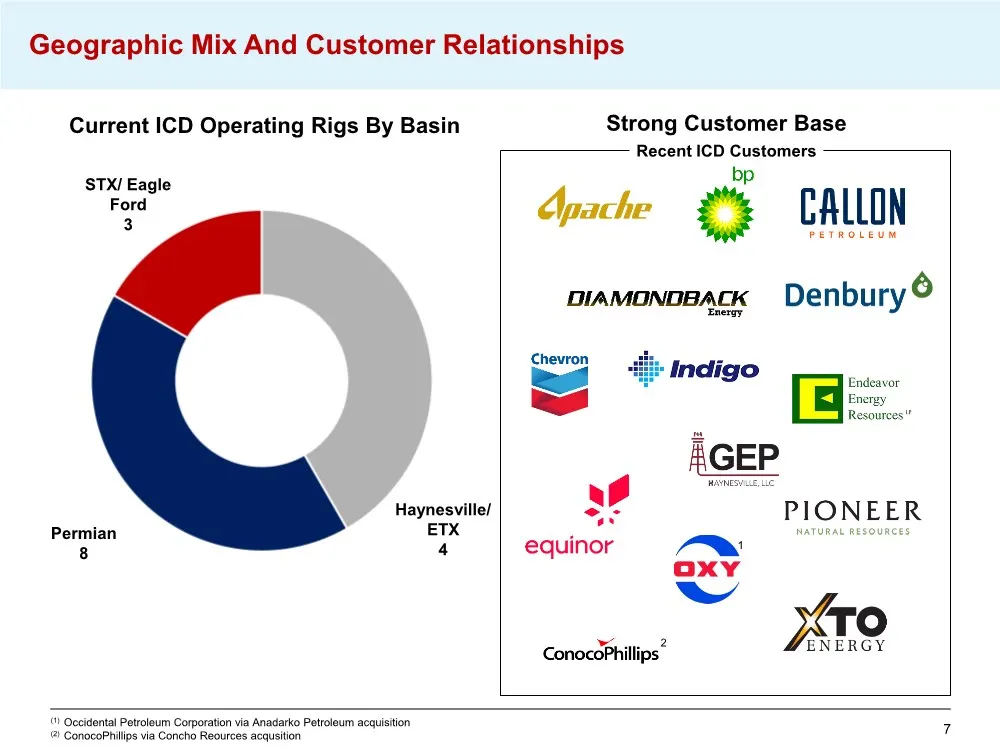
Slide 7: Geographic Mix And Customer Relationships
7 Geographic Mix And Customer Relationships Recent ICD Customers Strong Customer Base Current ICD Operating Rigs By Basin (1) Occidental Petroleum Corporation via Anadarko Petroleum acquisition (2) ConocoPhillips via Concho Reources acqusition Permian 7 Permian 8 STX/ Eagle Ford 3 Haynesville/ ETX 4
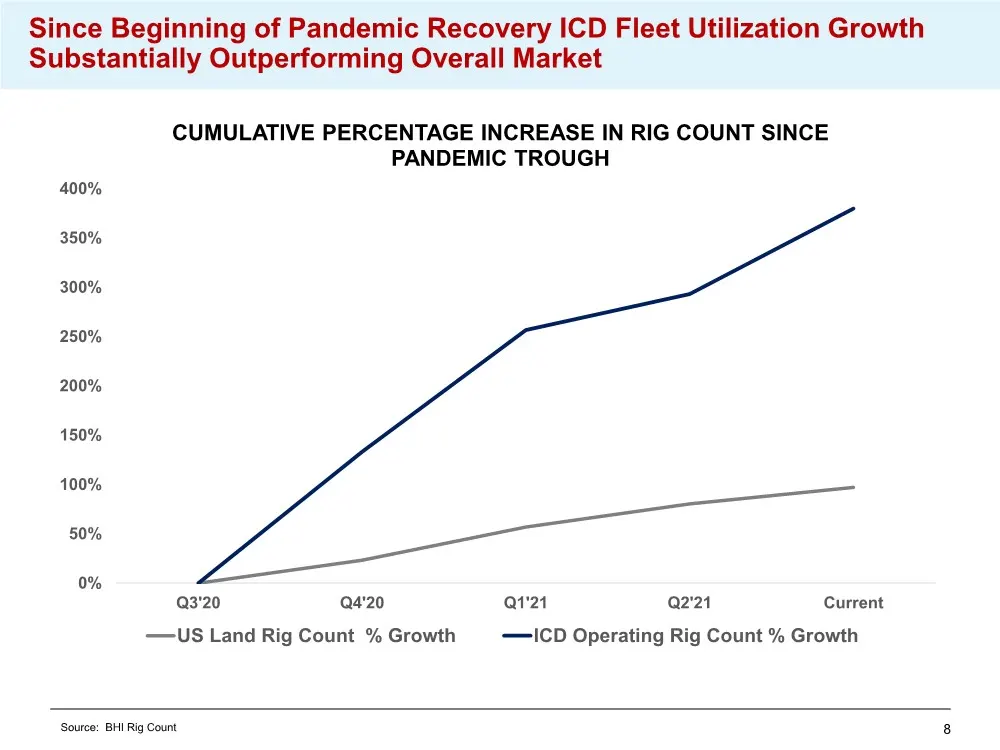
Slide 8: ICD Fleet Utilization Growth Substantially Outperforming Overall Market
8 0% 50% 100% 150% 200% 250% 300% 350% 400% Q3'20 Q4'20 Q1'21 Q2'21 Current CUMULATIVE PERCENTAGE INCREASE IN RIG COUNT SINCE PANDEMIC TROUGH US Land Rig Count % Growth ICD Operating Rig Count % Growth Since Beginning of Pandemic Recovery ICD Fleet Utilization Growth Substantially Outperforming Over
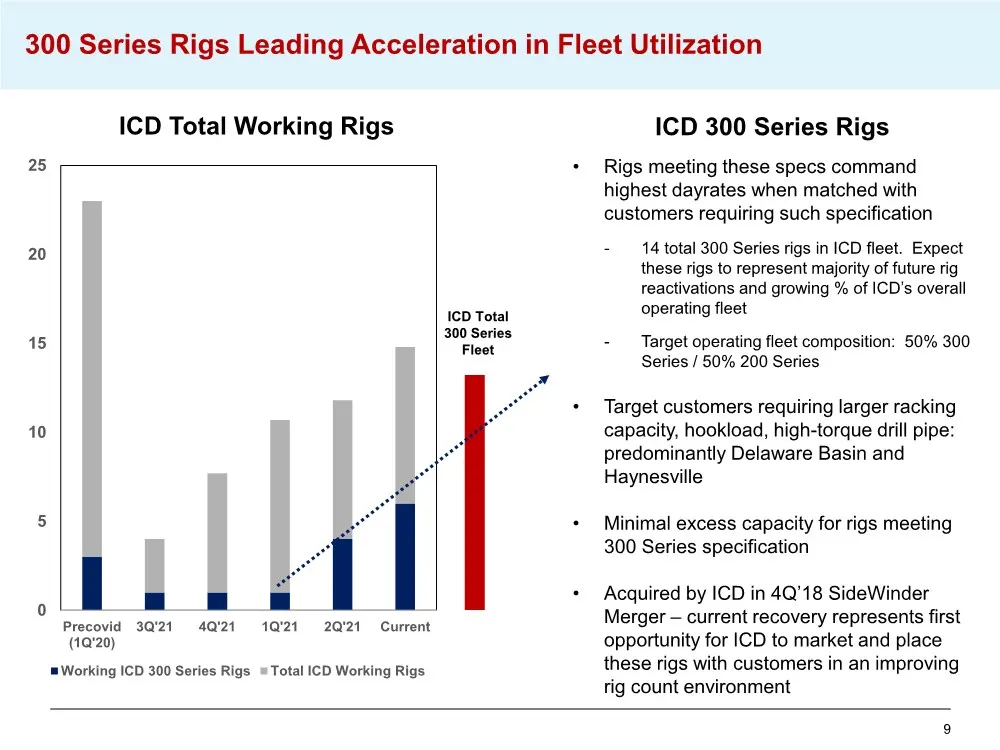
Slide 9: 300 Series Rigs Leading Acceleration in Fleet Utilization
9 0 5 10 15 20 25 Precovid (1Q'20) 3Q'21 4Q'21 1Q'21 2Q'21 Current Working ICD 300 Series Rigs Total ICD Working Rigs 300 Series Rigs Leading Acceleration in Fleet Utilization ICD Total Working Rigs ICD Total 300 Series Fleet ICD 300 Series Rigs • Rigs meeting these specs command highest dayrates wh
Slide 10: ICD Performance Meeting and Exceeding Customer Expectations
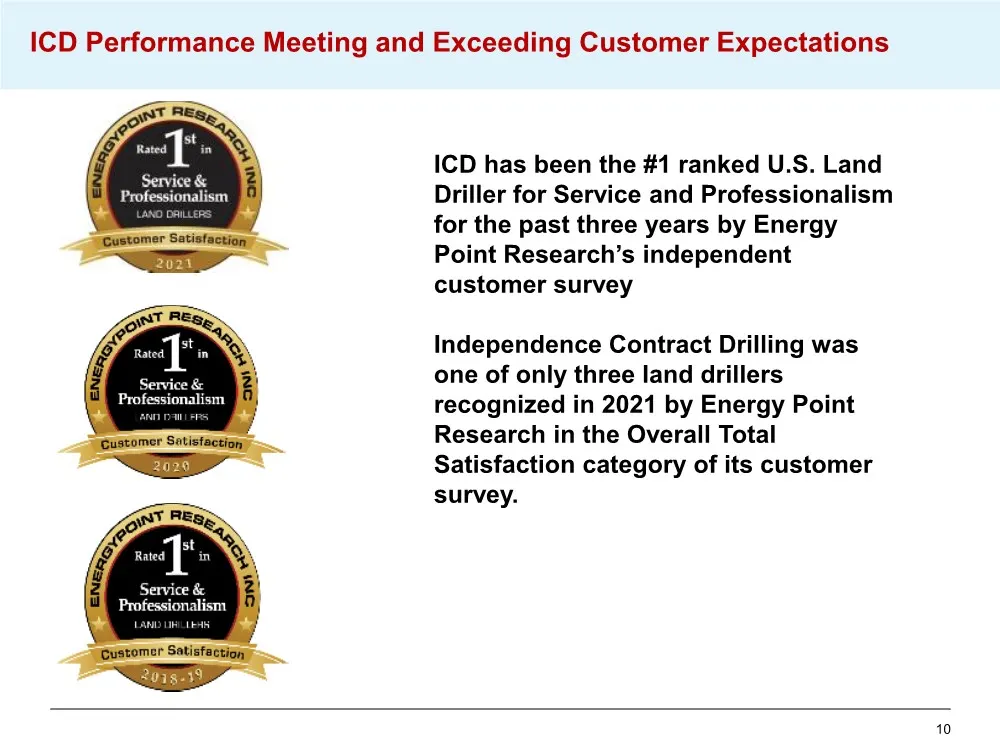
10 ICD Performance Meeting and Exceeding Customer Expectations ICD has been the #1 ranked U.S. Land Driller for Service and Professionalism for the past three years by Energy Point Research’s independent customer survey Independence Contract Drilling was one of only three land drillers recognized in
Slide 11: Defining a Pad-Optimal Super-Spec Rig
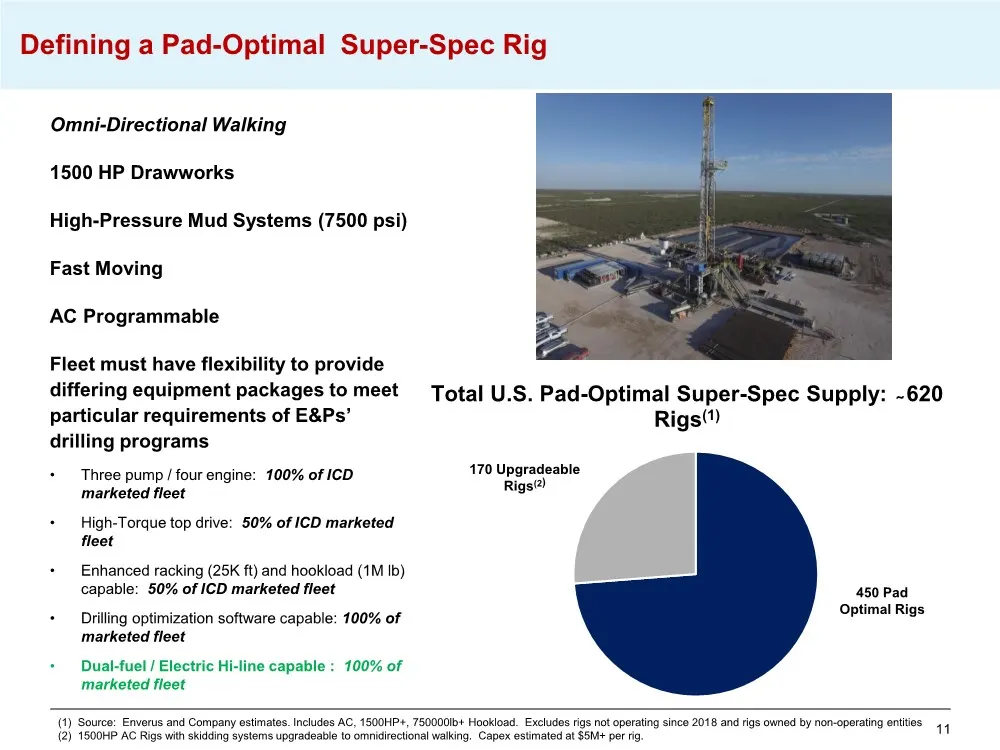
11 Defining a Pad-Optimal Super-Spec Rig Omni-Directional Walking 1500 HP Drawworks High-Pressure Mud Systems (7500 psi) Fast Moving AC Programmable Fleet must have flexibility to provide differing equipment packages to meet particular requirements of E&Ps’ drilling programs • Three pump / four engi
Slide 12: Drivers for Expected Improvements in Pad-Optimal Utilization / Dayrates
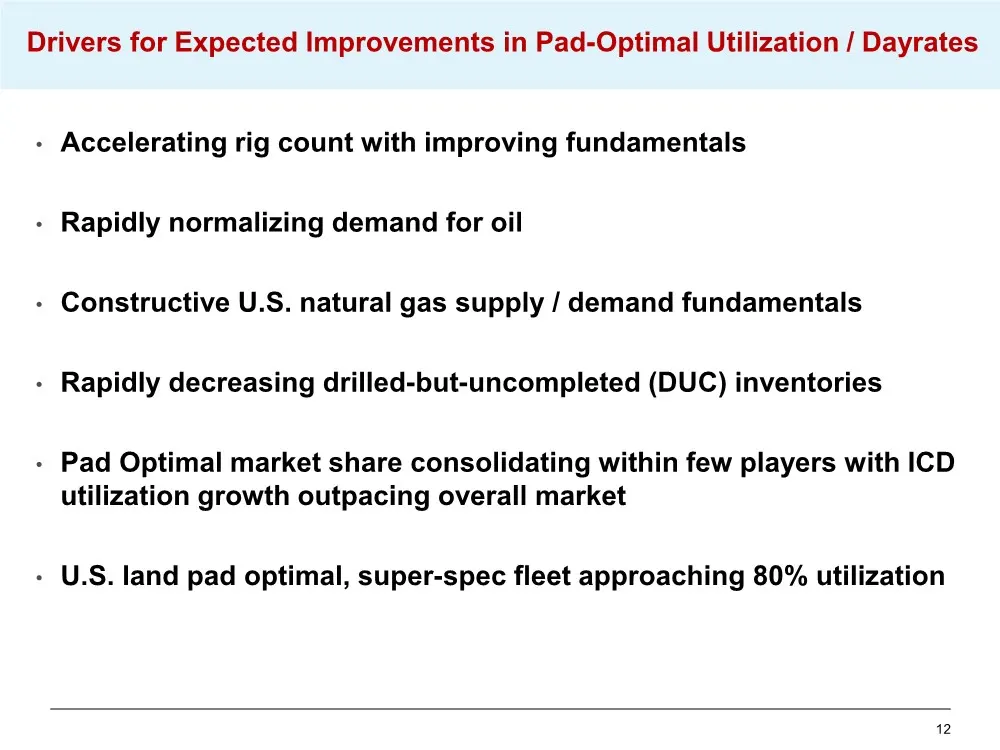
12 Drivers for Expected Improvements in Pad-Optimal Utilization / Dayrates • Accelerating rig count with improving fundamentals • Rapidly normalizing demand for oil • Constructive U.S. natural gas supply / demand fundamentals • Rapidly decreasing drilled-but-uncompleted (DUC) inventories • Pad Optim
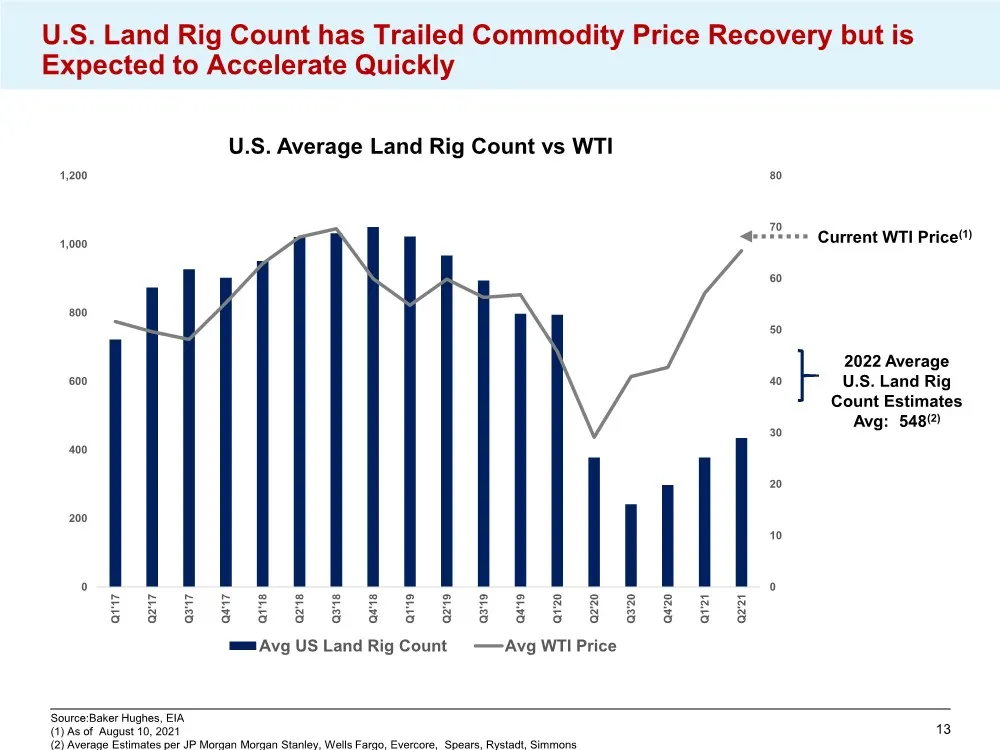
Slide 13: U.S. Land Rig Count has Trailed Commodity Price Recovery but is Expected to Accelerate
13 U.S. Land Rig Count has Trailed Commodity Price Recovery but is Expected to Accelerate Quickly 0 10 20 30 40 50 60 70 80 0 200 400 600 800 1,000 1,200 Q1'17 Q2'17 Q3'17 Q4'17 Q1'18 Q2'18 Q3'18 Q4'18 Q1'19 Q2'19 Q3'19 Q4'19 Q1'20 Q2'20 Q3'20 Q4'20 Q1'21 Q2'21 U.S. Average Land Rig Count vs WTI Avg
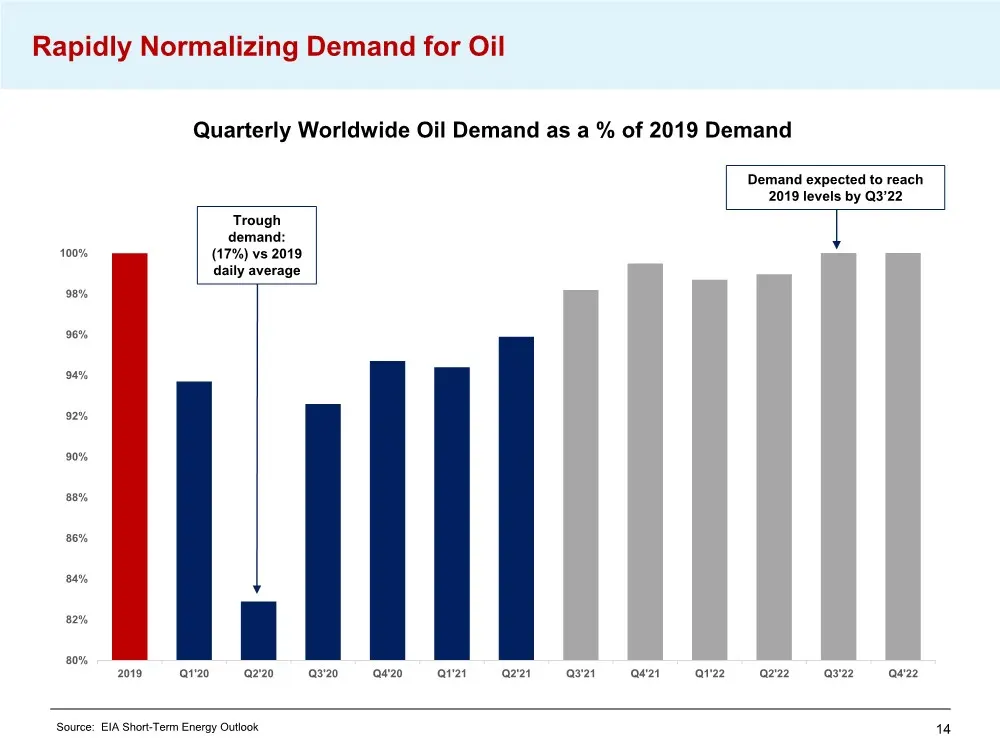
Slide 14: Rapidly Normalizing Demand for Oil
14 Rapidly Normalizing Demand for Oil Source: EIA Short-Term Energy Outlook 80% 82% 84% 86% 88% 90% 92% 94% 96% 98% 100% 2019 Q1'20 Q2'20 Q3'20 Q4'20 Q1'21 Q2'21 Q3'21 Q4'21 Q1'22 Q2'22 Q3'22 Q4'22 Quarterly Worldwide Oil Demand as a % of 2019 Demand Trough demand: (17%) vs 2019 daily average Demand
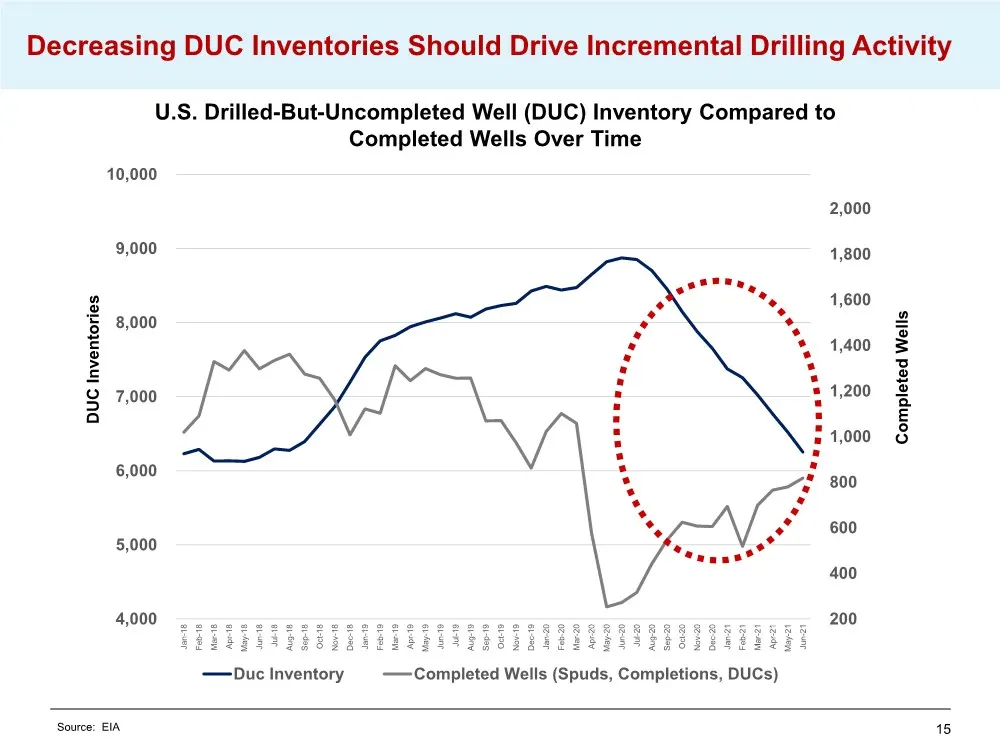
Slide 15: Decreasing DUC Inventories Should Drive Incremental Drilling Activity
15 Decreasing DUC Inventories Should Drive Incremental Drilling Activity 200 400 600 800 1,000 1,200 1,400 1,600 1,800 2,000 4,000 5,000 6,000 7,000 8,000 9,000 10,000 Jan-18 Feb-18 Mar-18 Apr-18 May-18 Jun-18 Jul-18 Aug-18 Sep-18 Oct-18 Nov-18 Dec-18 Jan-19 Feb-19 Mar-19 Apr-19 May-19 Jun-19 Jul-19
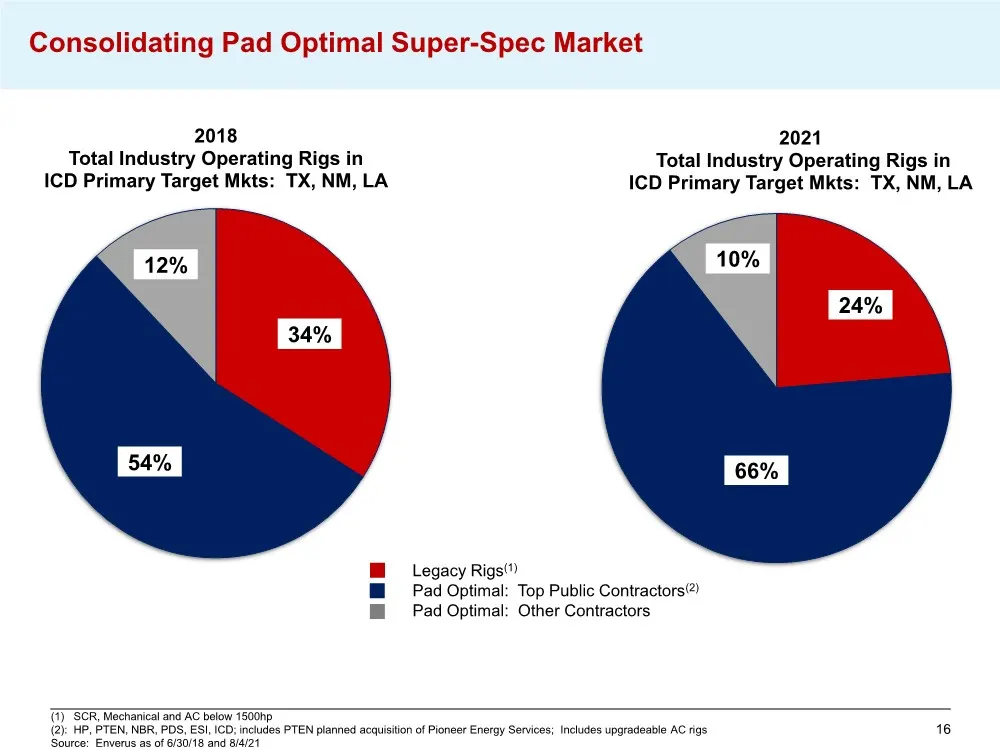
Slide 16: Consolidating Pad Optimal Super-Spec Market
16 Consolidating Pad Optimal Super-Spec Market ICD 34% 54% 12% 2018 Total Industry Operating Rigs in ICD Primary Target Mkts: TX, NM, LA 24% 66% 10% 2021 Total Industry Operating Rigs in ICD Primary Target Mkts: TX, NM, LA (1) SCR, Mechanical and AC below 1500hp (2): HP, PTEN, NBR, PDS, ESI, ICD; in
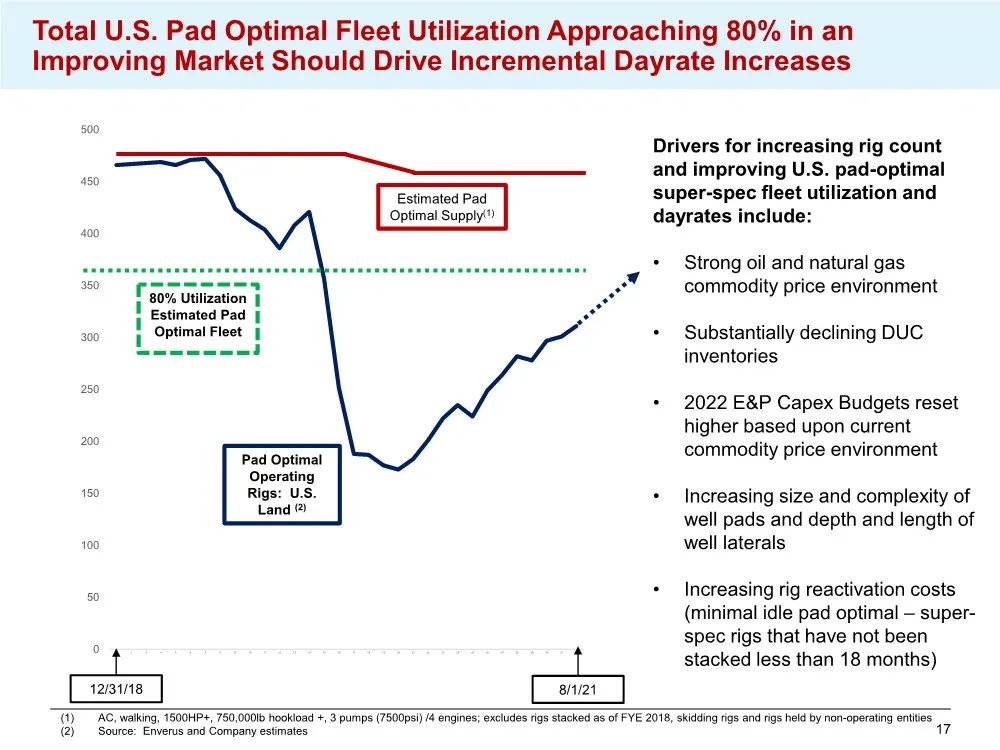
Slide 17: Total U.S. Pad Optimal Fleet Utilization Approaching 80% in an Improving Market
17 Total U.S. Pad Optimal Fleet Utilization Approaching 80% in an Improving Market Should Drive Incremental Dayrate Increases 8/16/2021 0 50 100 150 200 250 300 350 400 450 500 1 2 3 4 5 6 7 8 9 10 11 12 13 14 15 16 17 18 19 20 21 22 23 24 25 26 27 28 29 30 31 32 80% Utilization Estimated Pad Optima
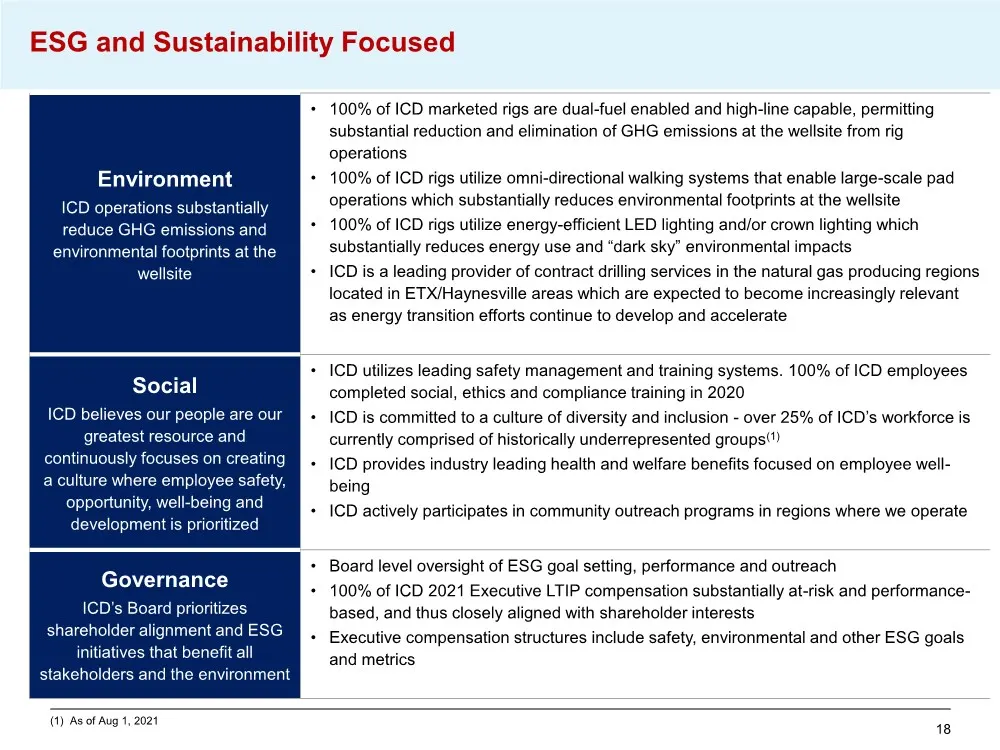
Slide 18: ESG and Sustainability
18 ESG and Sustainability Focused Environment ICD operations substantially reduce GHG emissions and environmental footprints at the wellsite • 100% of ICD marketed rigs are dual-fuel enabled and high-line capable, permitting substantial reduction and elimination of GHG emissions at the wellsite from
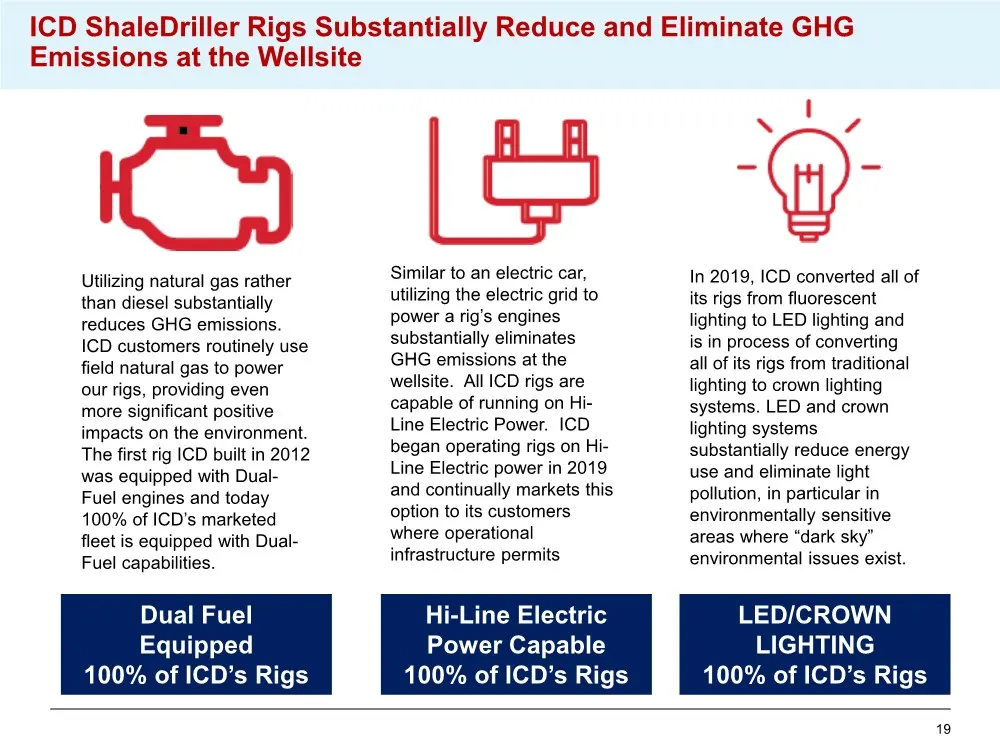
Slide 19: ICD ShaleDriller Rigs Substantially Reduce and Eliminate GHG Emissions at the Wellsite
19 ICD ShaleDriller Rigs Substantially Reduce and Eliminate GHG Emissions at the Wellsite Utilizing natural gas rather than diesel substantially reduces GHG emissions. ICD customers routinely use field natural gas to power our rigs, providing even more significant positive impacts on the environment
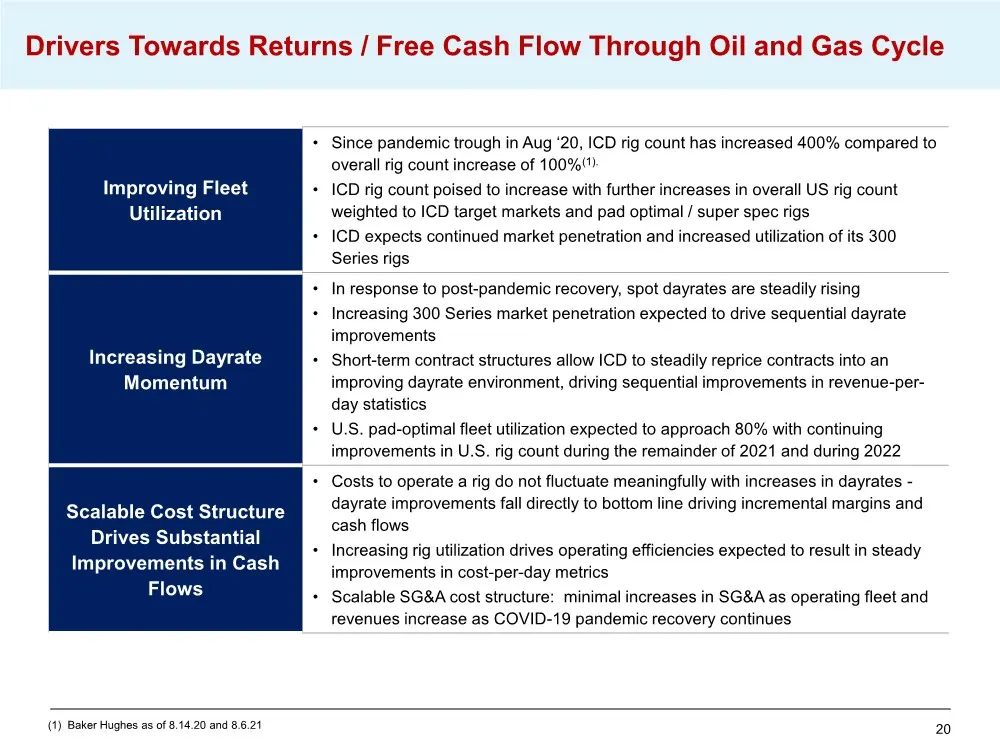
Slide 20: Drivers Towards Returns / Free Cash Flow Through Oil and Gas Cycle
20 Drivers Towards Returns / Free Cash Flow Through Oil and Gas Cycle Improving Fleet Utilization • Since pandemic trough in Aug ‘20, ICD rig count has increased 400% compared to overall rig count increase of 100%(1). • ICD rig count poised to increase with further increases in overall US rig count
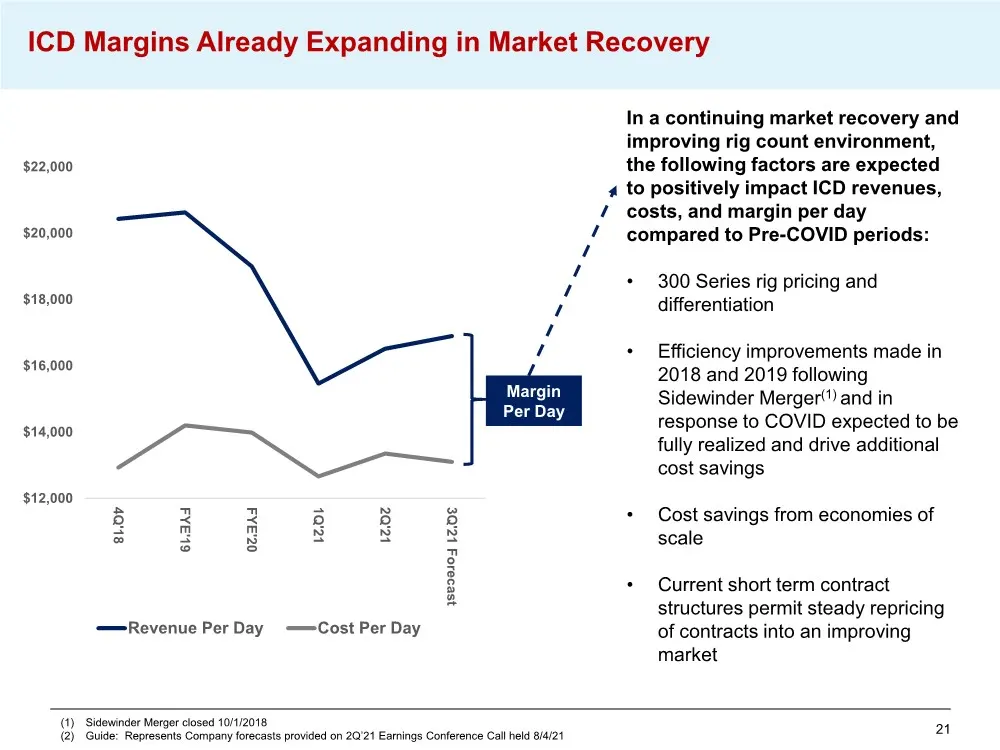
Slide 21: ICD Margins Already Expanding in Market Recovery
21 ICD Margins Already Expanding in Market Recovery In a continuing market recovery and improving rig count environment, the following factors are expected to positively impact ICD revenues, costs, and margin per day compared to Pre-COVID periods: • 300 Series rig pricing and differentiation • Effic
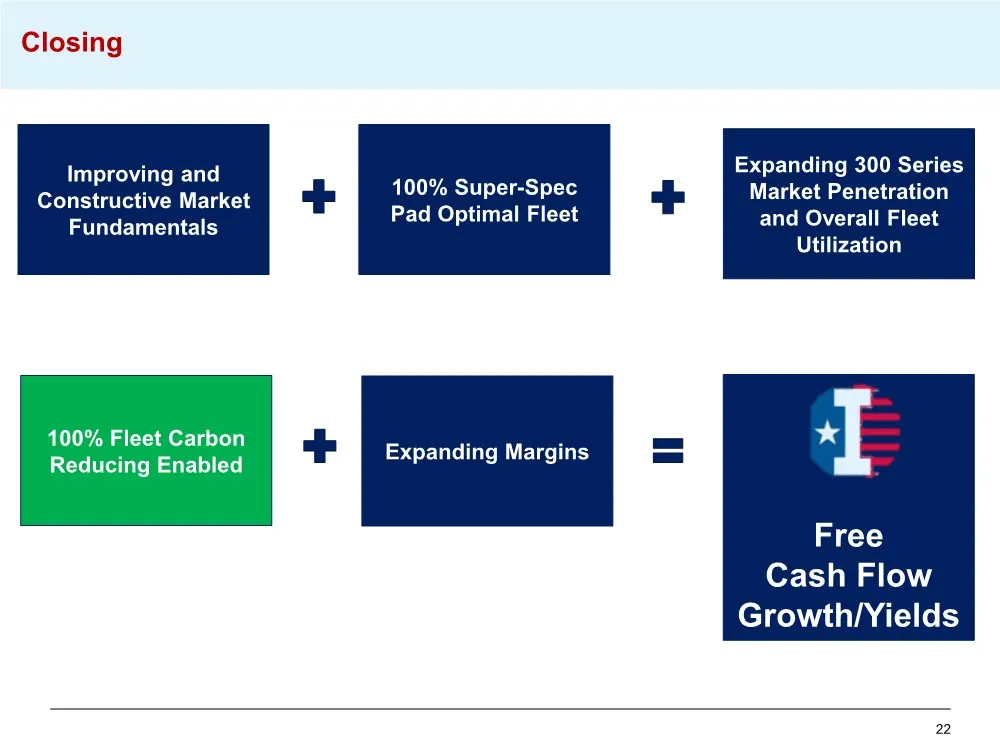
Slide 22: Closing: Improving and Constructive Market Fundamentals
22 Closing Improving and Constructive Market Fundamentals 100% Super-Spec Pad Optimal Fleet Expanding 300 Series Market Penetration and Overall Fleet Utilization Free Cash Flow Growth/Yields 100% Fleet Carbon Reducing Enabled Expanding Margins
Slide 23: 23
23
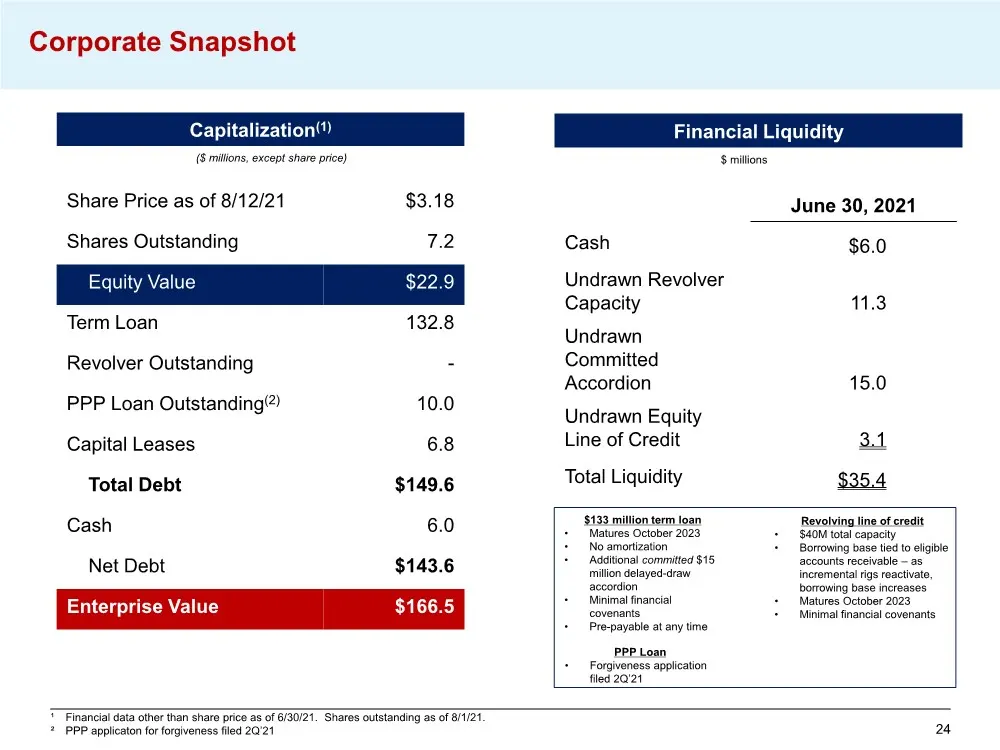
Slide 24: Corporate Snapshot
24 Corporate Snapshot Capitalization(1) ($ millions, except share price) ¹ Financial data other than share price as of 6/30/21. Shares outstanding as of 8/1/21. ² PPP applicaton for forgiveness filed 2Q’21 Financial Liquidity June 30, 2021 Cash $6.0 Undrawn Revolver Capacity 11.3 Undrawn Committed A
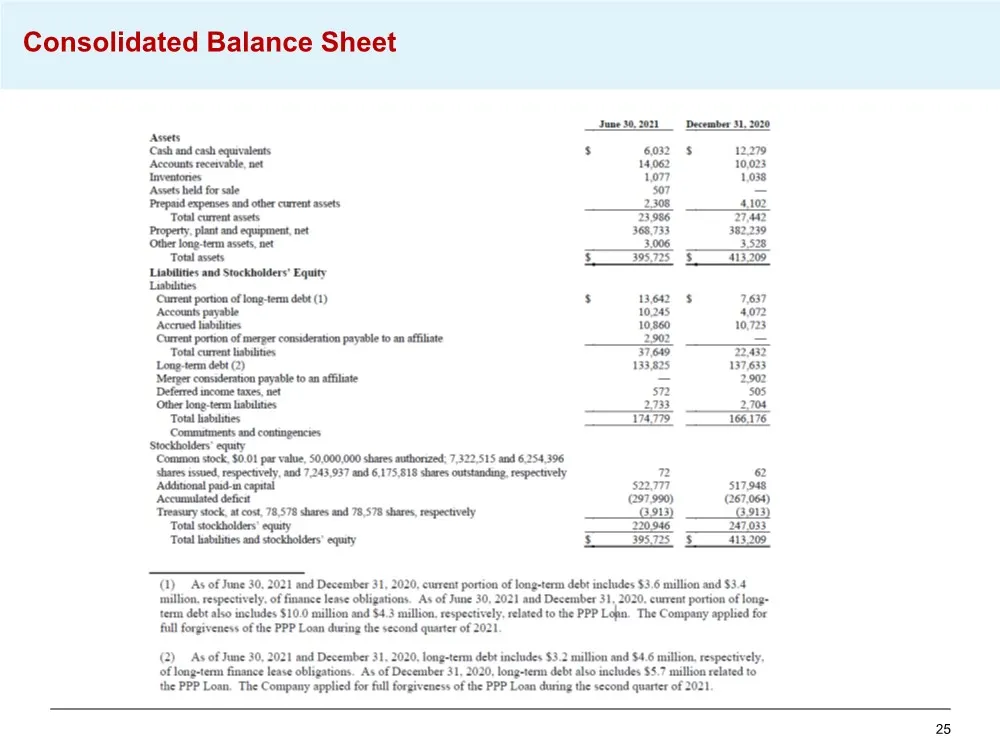
Slide 25: Consolidated Balance Sheet
25 Consolidated Balance Sheet
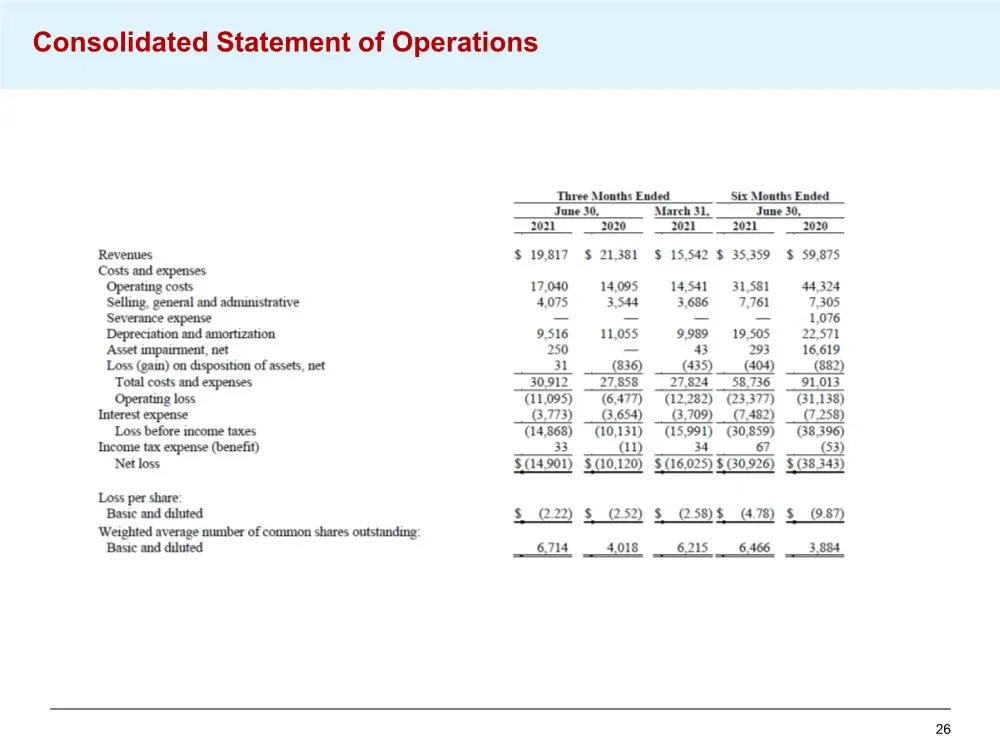
Slide 26: Consolidated Statement of Operations
26 Consolidated Statement of Operations
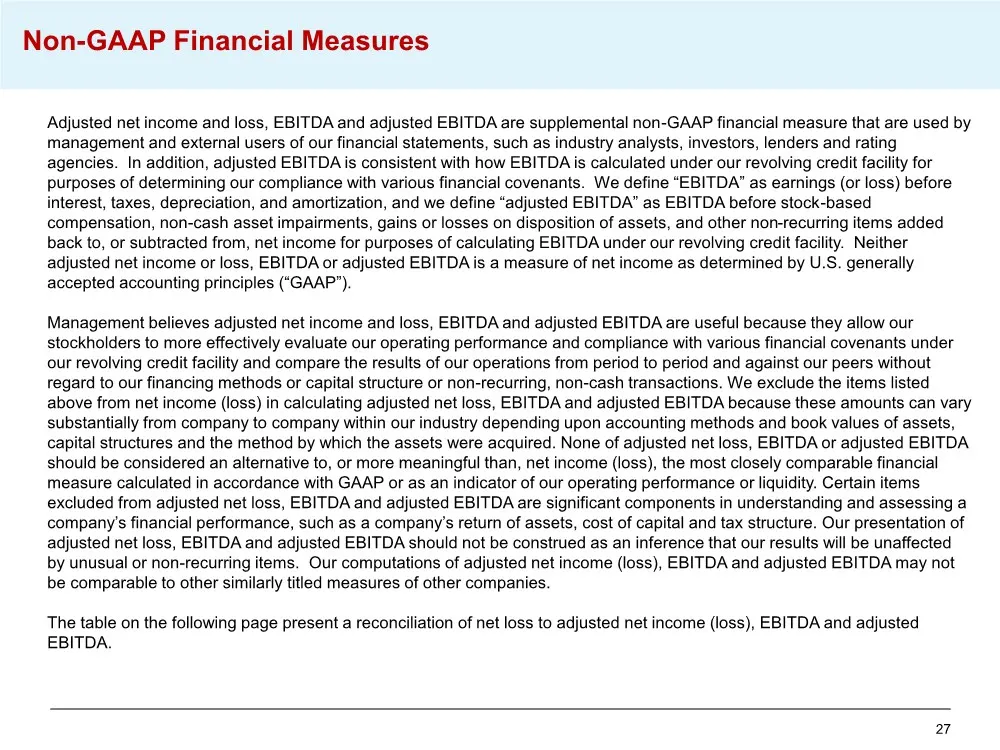
Slide 27: Non-GAAP financial measures definitions
27 Adjusted net income and loss, EBITDA and adjusted EBITDA are supplemental non-GAAP financial measure that are used by management and external users of our financial statements, such as industry analysts, investors, lenders and rating agencies. In addition, adjusted EBITDA is consistent with how E
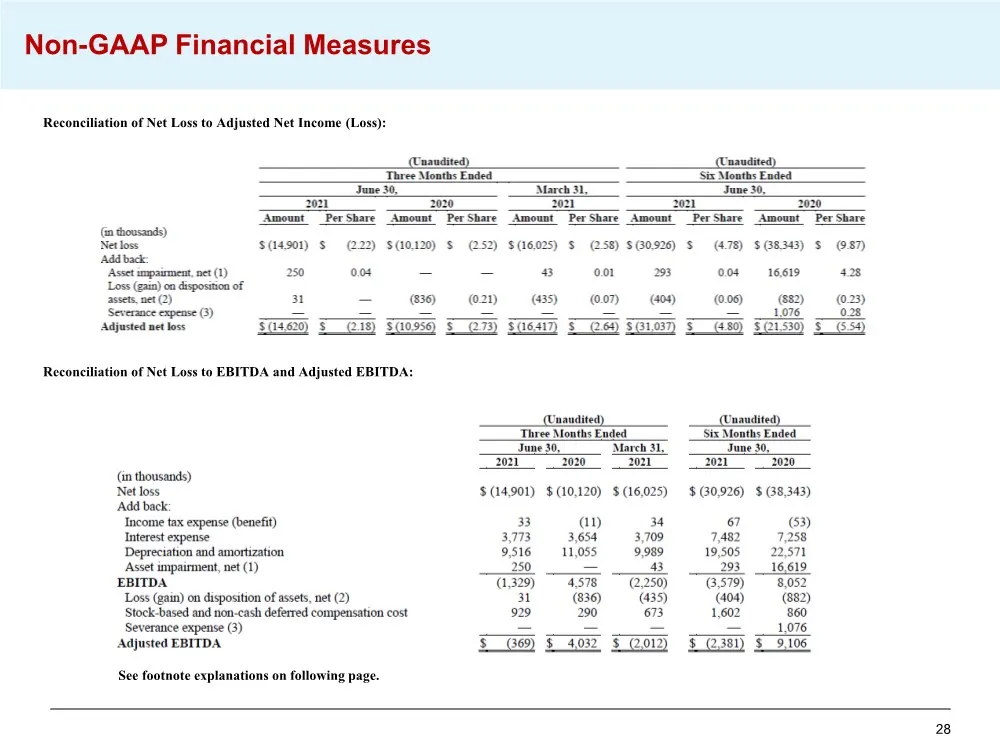
Slide 28: Reconciliation of Net Loss to Adjusted Net Income and Adjusted EBITDA
28 Reconciliation of Net Loss to Adjusted Net Income (Loss): Reconciliation of Net Loss to EBITDA and Adjusted EBITDA: See footnote explanations on following page. Non-GAAP Financial Measures
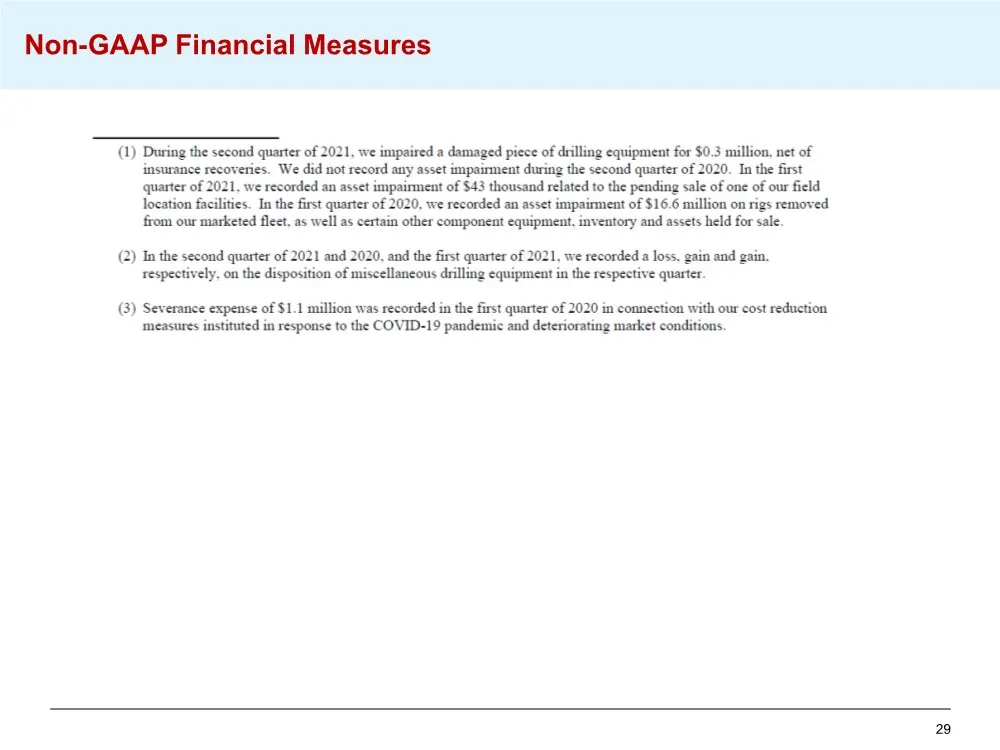
Slide 29: Non-GAAP Financial Measures
29 Non-GAAP Financial Measures
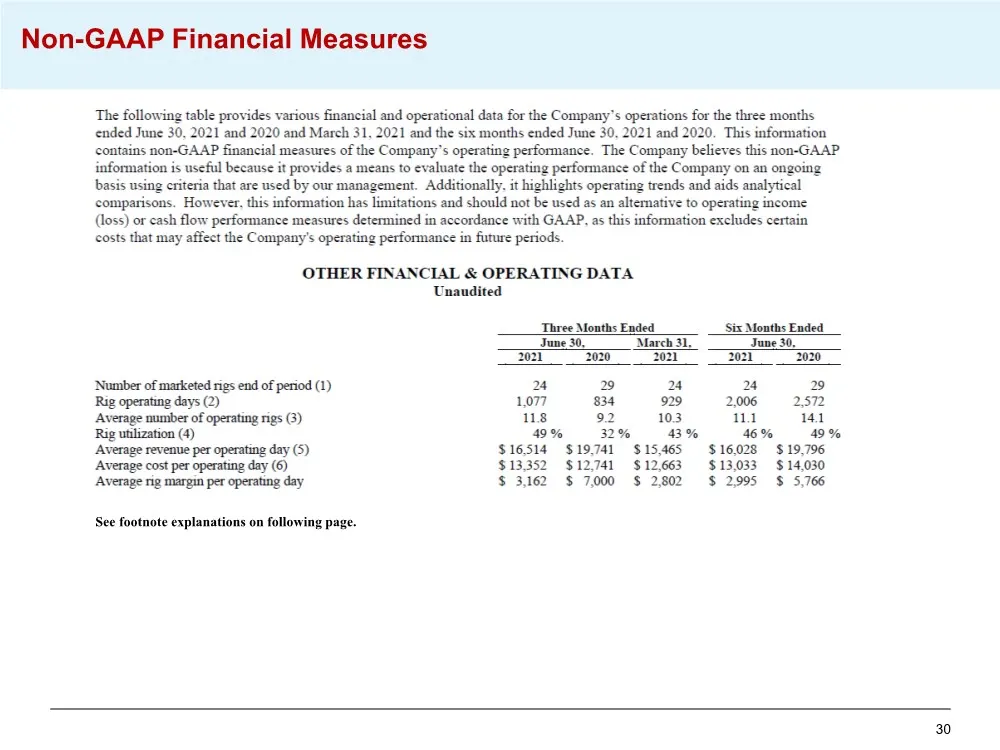
Slide 30: Non-GAAP Financial Measures
30 Non-GAAP Financial Measures See footnote explanations on following page.
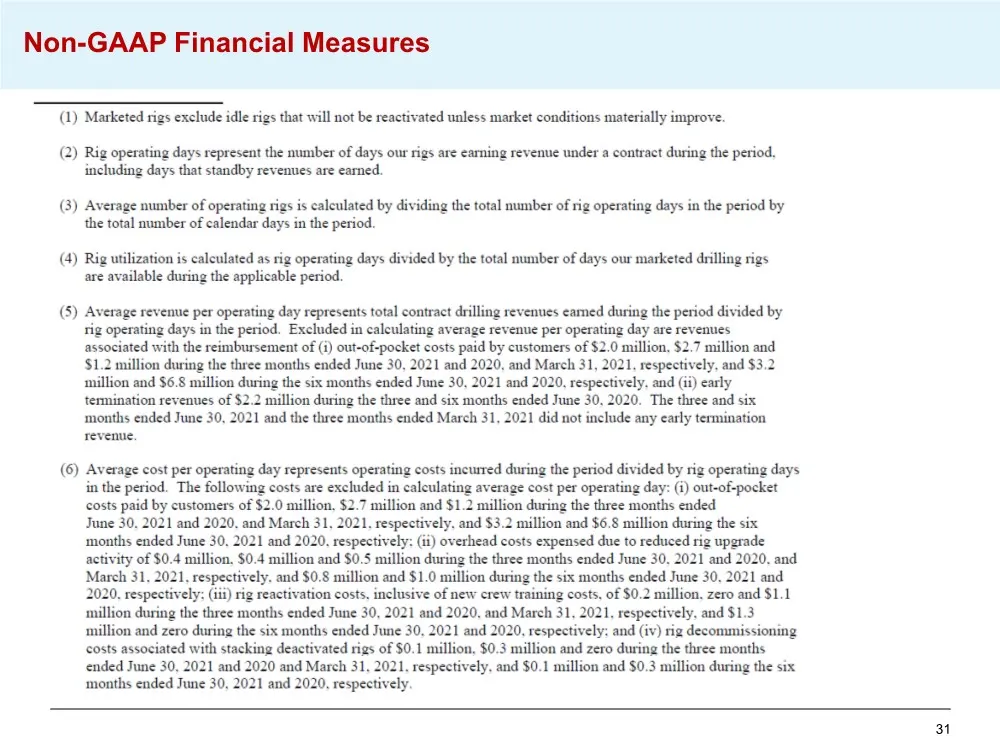
Slide 31: Non-GAAP Financial Measures
31 Non-GAAP Financial Measures
Slide 32: 32
32
Source: SEC EDGAR · 8-K filed Aug 17, 2021
More decks from Independence Contract Drilling Inc
 Presentation (December 2024)15 slides · Dec 3, 2024
 Emerging Growth Conference (November 2023)31 slides · Nov 2, 2023
 Sidoti MicroCap Conference (August 2023)32 slides · Aug 16, 2023
 Emerging Growth Conference (June 2023)38 slides · Jun 14, 2023
 Investor Presentation (March 2023)41 slides · Mar 2, 2023
 Investor Presentation (November 2022)47 slides · Nov 1, 2022