PHX Minerals — Panhandle Oil & Gas — Investor Presentation (February 2020)
26 slides from PHX Minerals's investor presentation, Feb 11, 2020
Slide 1: February 2020 Corporate Presentation
February 2020 Corporate Presentation EXHIBIT 99.2
Slide 2: Cautionary Statement Regarding Forward-Looking Statements
Cautionary Statement Regarding Forward-Looking Statements This presentation includes “forward-looking statements” within the meaning of Section 27A of the Securities Act of 1933 and Section 21E of the Securities Exchange Act of 1934. All statements, other than statements of historical fact, included
Slide 3: Company Snapshot
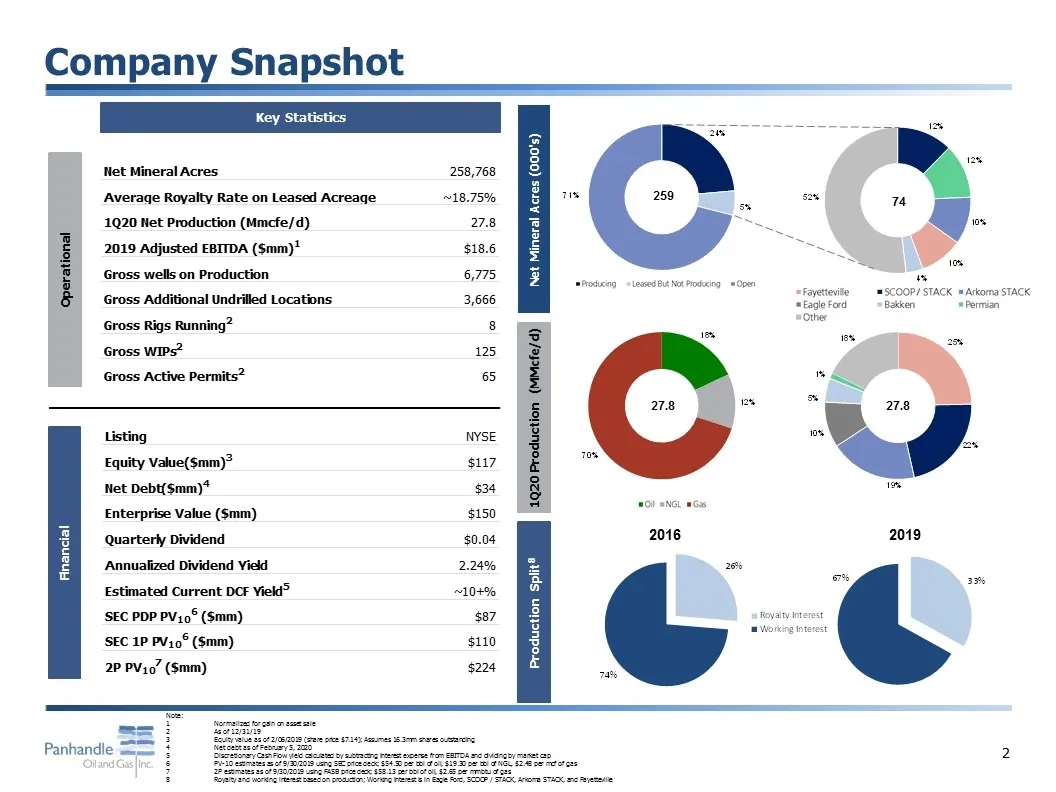
Company Snapshot 2016 2019 Operational Financial Key Statistics Note: 1Normalized for gain on asset sale 2As of 12/31/19 3Equity value as of 2/06/2019 (share price $7.14); Assumes 16.3mm shares outstanding 4Net debt as of February 5, 2020 5Discretionary Cash Flow yield calculated by subtracting inte
Slide 4: Why Invest in PHX?
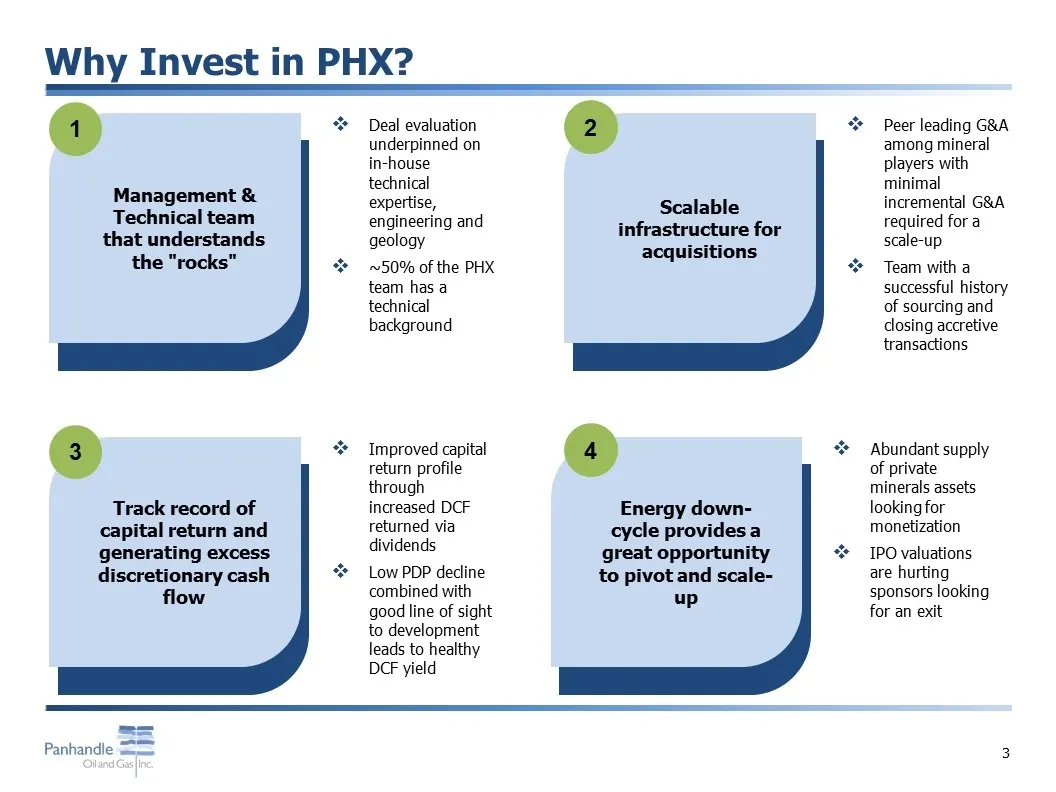
Why Invest in PHX? Scalable infrastructure for acquisitions Peer leading G&A among mineral players with minimal incremental G&A required for a scale-up Team with a successful history of sourcing and closing accretive transactions Management & Technical team that understands the "rocks" Deal evaluati
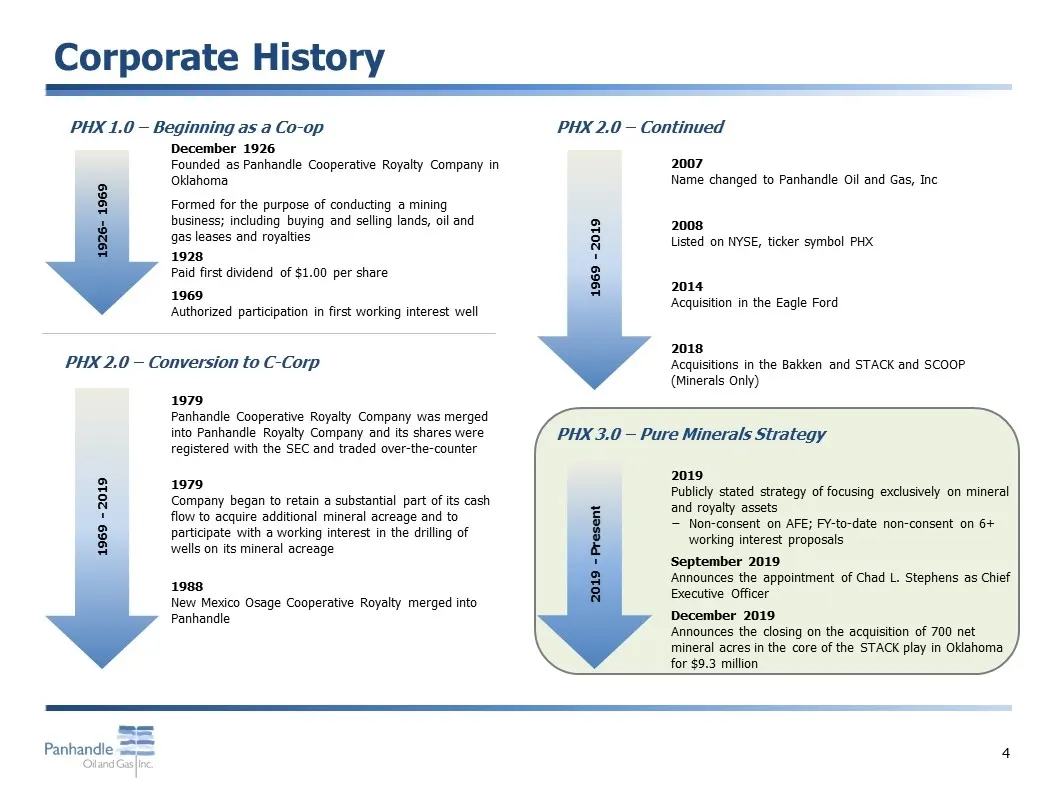
Slide 5: Company history: PHX 1.0 to PHX 3.0
1926- 1969 1928 Paid first dividend of $1.00 per share December 1926 Founded as Panhandle Cooperative Royalty Company in Oklahoma Formed for the purpose of conducting a mining business; including buying and selling lands, oil and gas leases and royalties 1979 Company began to retain a substantial pa
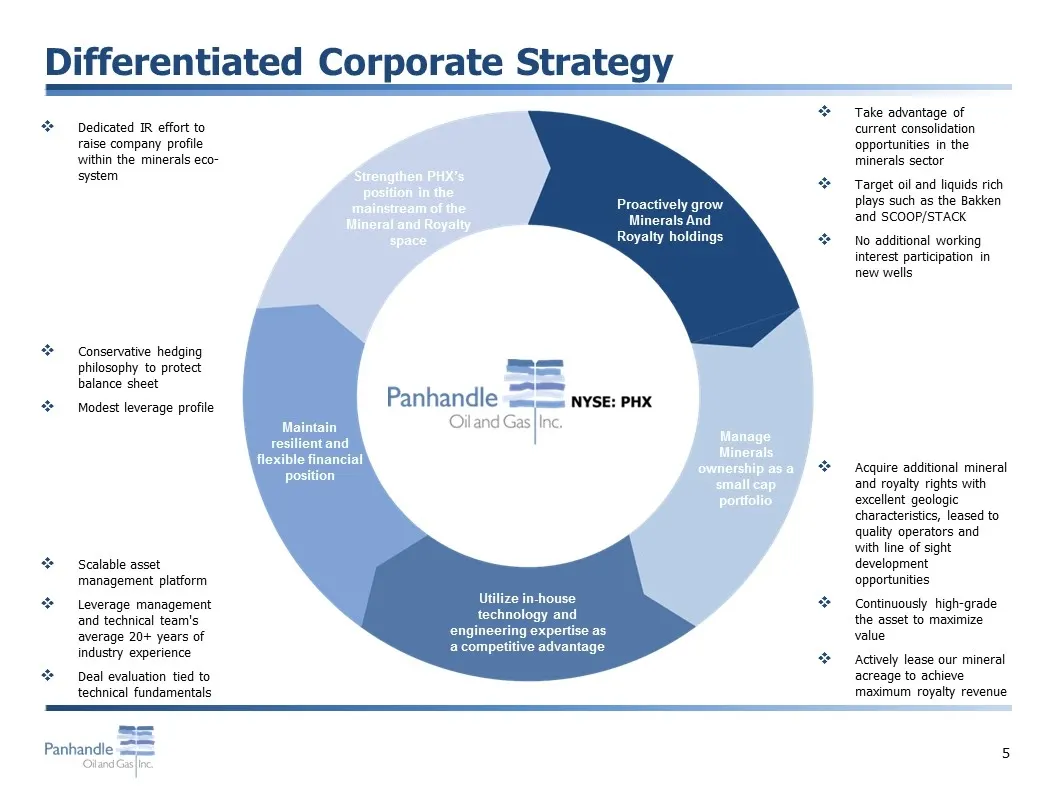
Slide 6: Differentiated Corporate Strategy
Proactively grow Minerals And Royalty holdings Take advantage of current consolidation opportunities in the minerals sector Target oil and liquids rich plays such as the Bakken and SCOOP/STACK No additional working interest participation in new wells Acquire additional mineral and royalty rights wit
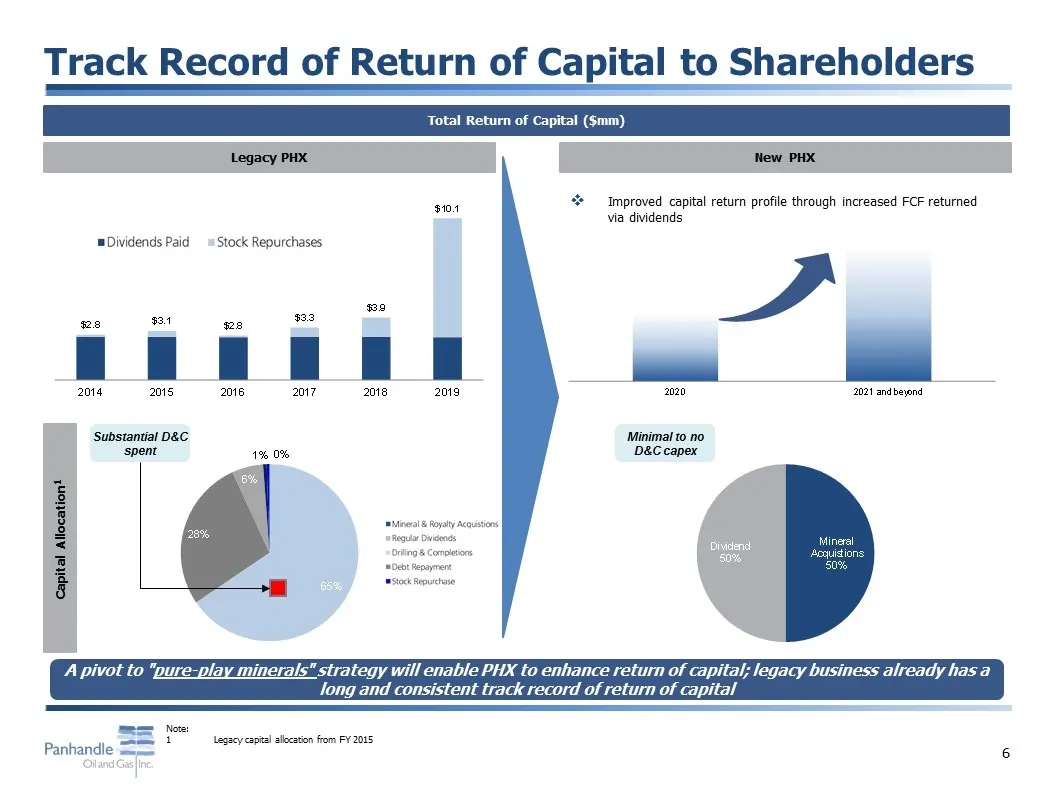
Slide 7: Track Record of Return of Capital to Shareholders
Track Record of Return of Capital to Shareholders A pivot to "pure-play minerals" strategy will enable PHX to enhance return of capital; legacy business already has a long and consistent track record of return of capital Total Return of Capital ($mm) Legacy PHX New PHX Improved capital return profil
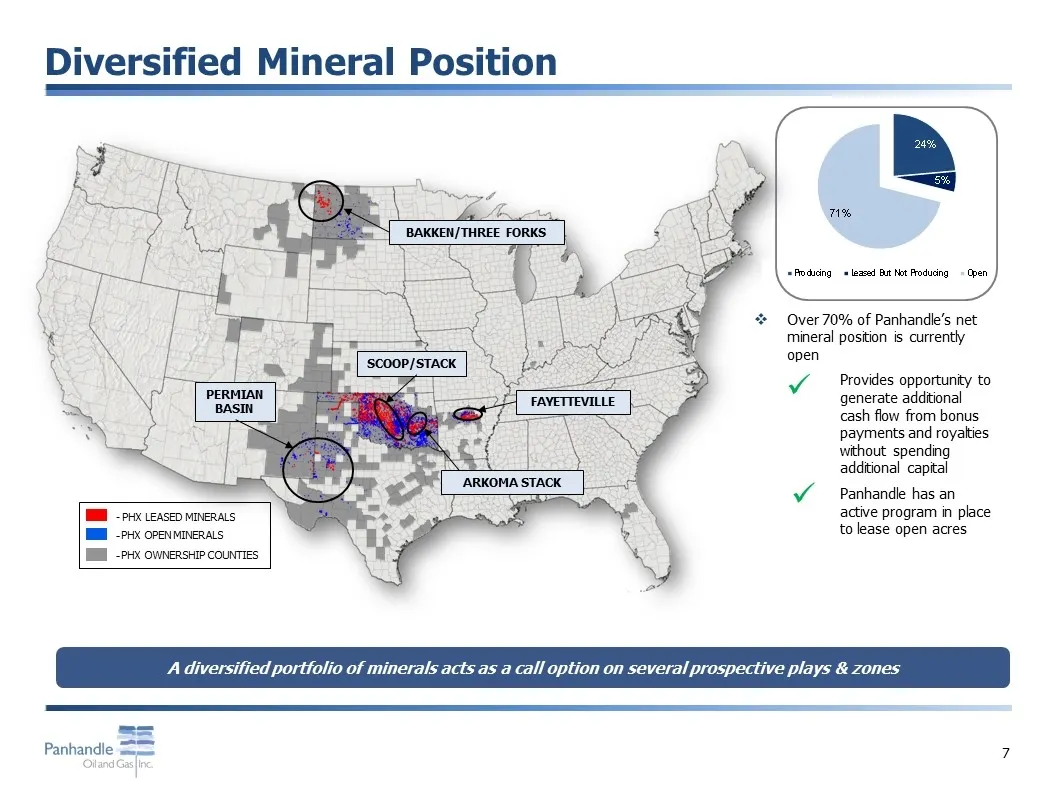
Slide 8: Diversified Mineral Position
Diversified Mineral Position Over 70% of Panhandle’s net mineral position is currently open Provides opportunity to generate additional cash flow from bonus payments and royalties without spending additional capital Panhandle has an active program in place to lease open acres - PHX OWNERSHIP COUNTIE
Slide 9: Portfolio Overview
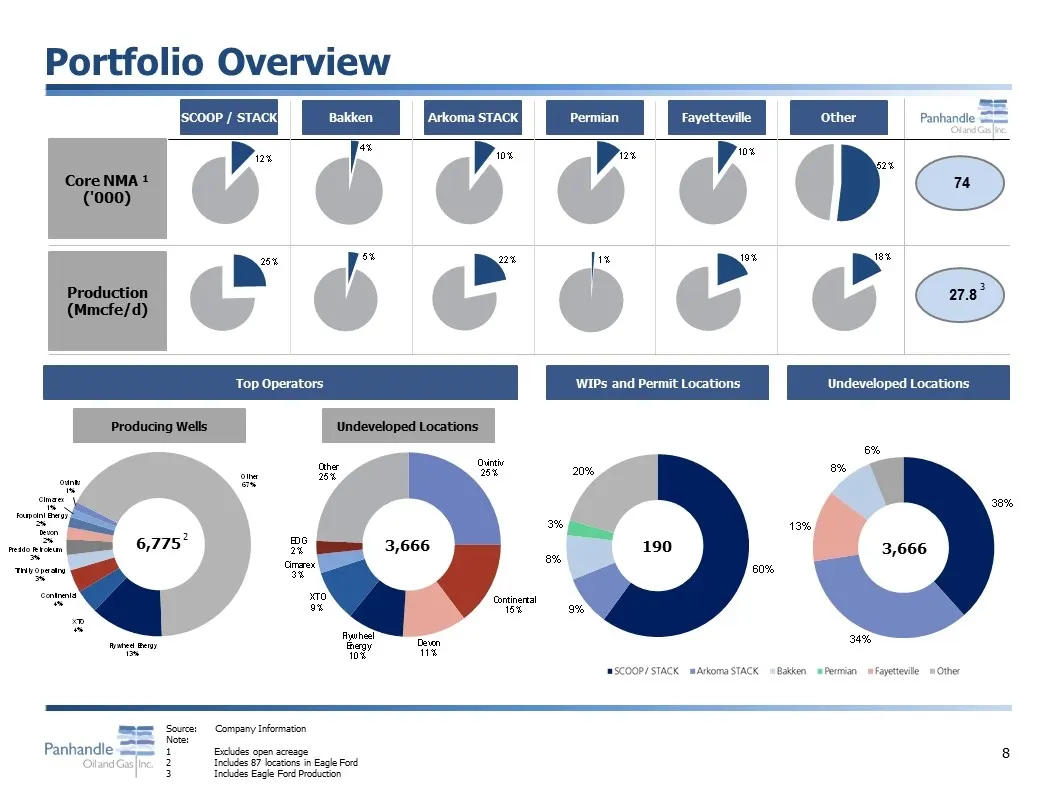
Portfolio Overview SCOOP / STACK Bakken Arkoma STACK Permian Fayetteville Other Core NMA 1 ('000) Production (Mmcfe/d) 74 27.8 Top Operators WIPs and Permit Locations Undeveloped Locations 190 Source: Company Information Note: 1Excludes open acreage 2Includes 87 locations in Eagle Ford 3Includes Eag
Slide 10: Portfolio Overview (cont'd)
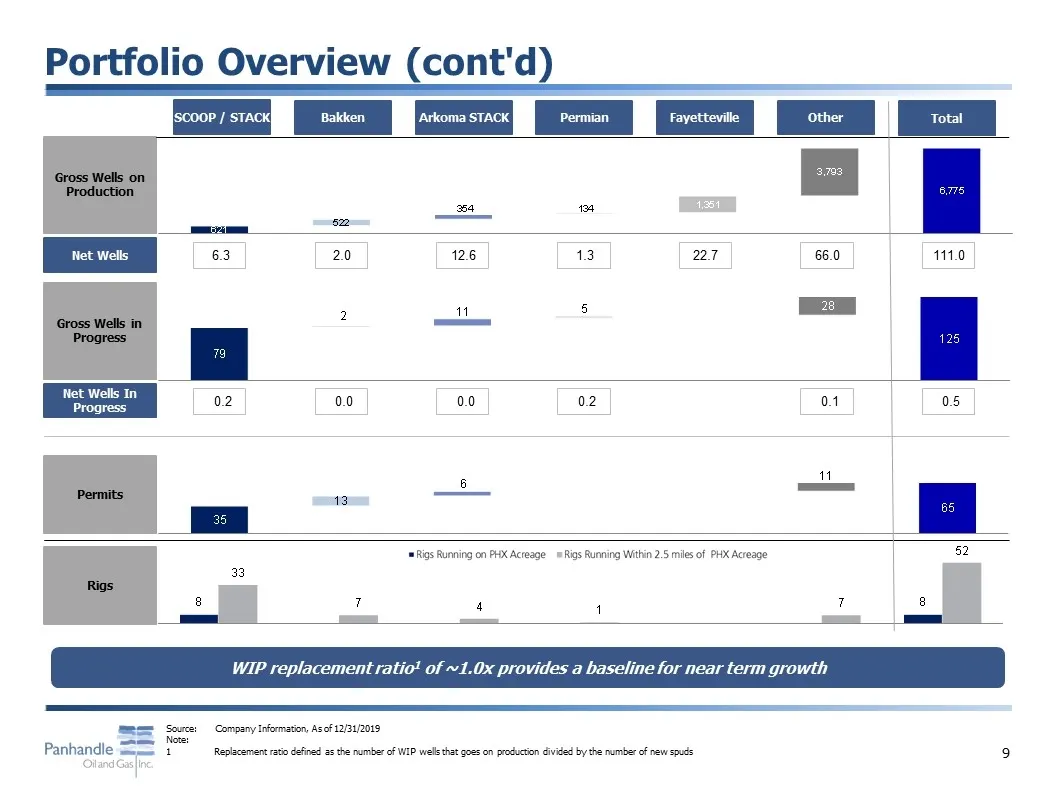
Portfolio Overview (cont'd) Gross Wells on Production Gross Wells in Progress Permits Rigs Net Wells Net Wells In Progress SCOOP / STACK Bakken Arkoma STACK Permian Fayetteville Other Total 6.3 2.0 12.6 1.3 22.7 66.0 111.0 0.2 0.0 0.0 0.2 0.1 0.5 WIP replacement ratio1 of ~1.0x provides a baseline f
Slide 11: Inventory Overview
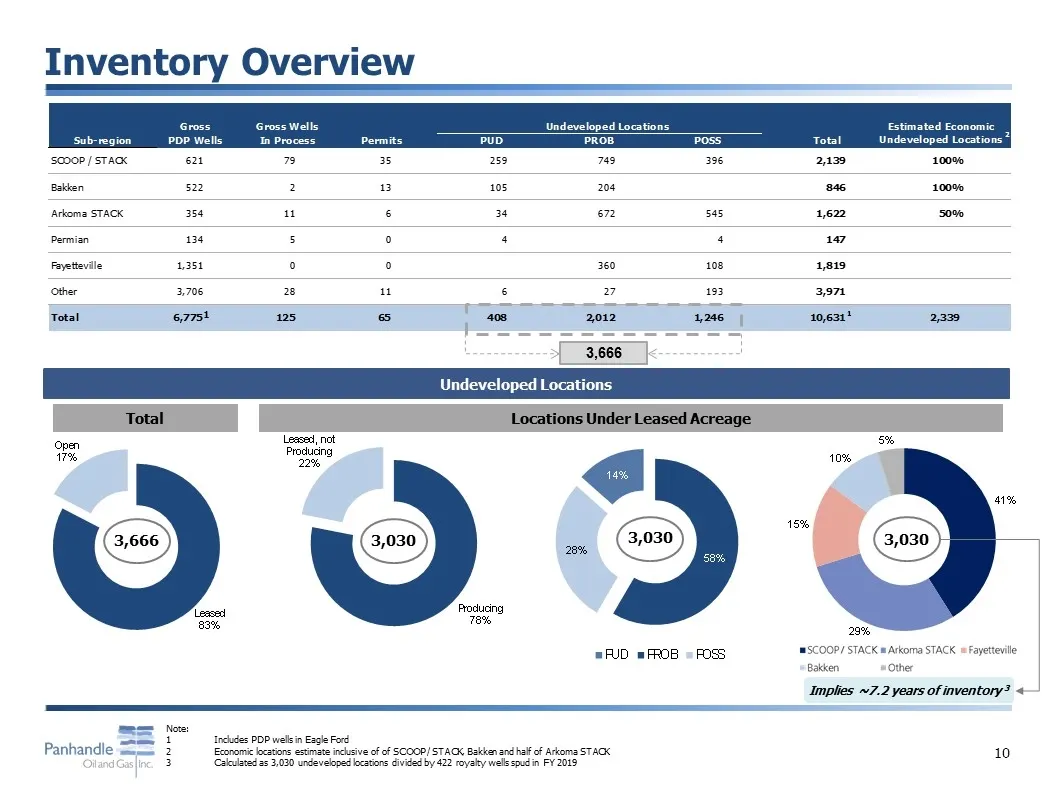
Inventory Overview Undeveloped Locations Note: 1Includes PDP wells in Eagle Ford 2Economic locations estimate inclusive of of SCOOP / STACK, Bakken and half of Arkoma STACK 3Calculated as 3,030 undeveloped locations divided by 422 royalty wells spud in FY 2019 1 1 2 3,030 Implies ~7.2 years of inven
Slide 12: Selected Mineral Acquisitions
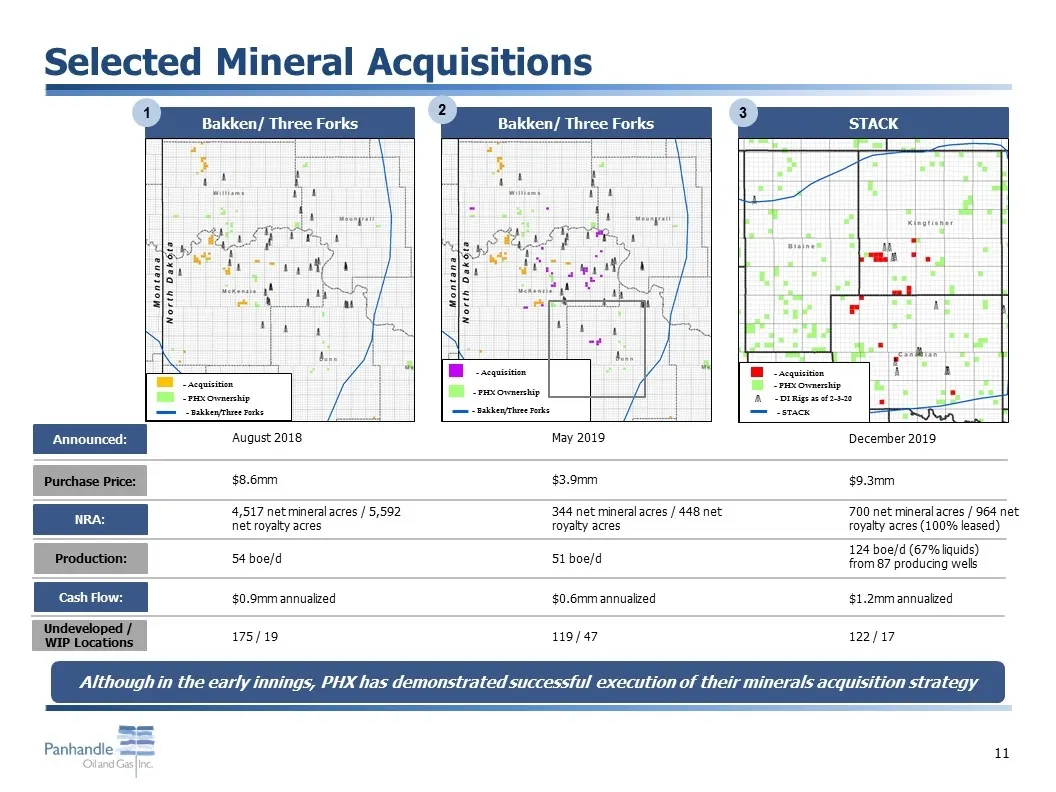
Selected Mineral Acquisitions - Acquisition - PHX Ownership - DI Rigs as of 2-3-20 - STACK - Acquisition - PHX Ownership - Bakken/Three Forks - PHX Ownership - Bakken/Three Forks - Acquisition STACK Bakken/ Three Forks Bakken/ Three Forks 1 2 3 Although in the early innings, PHX has demonstrated suc
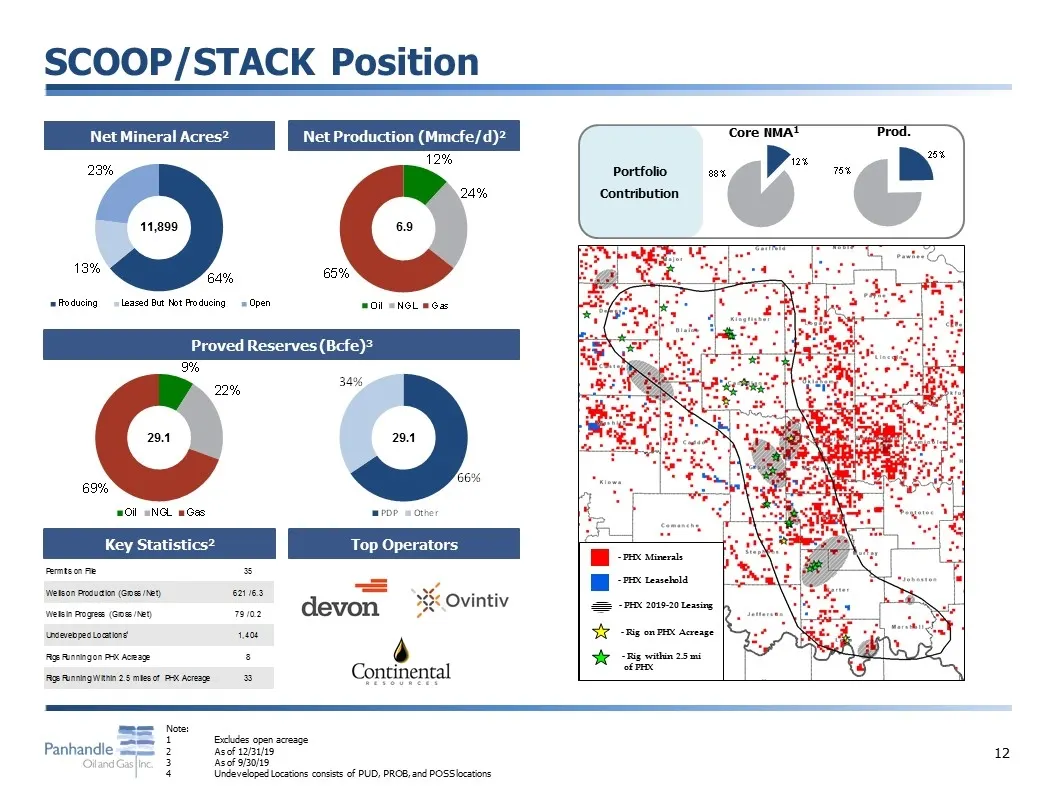
Slide 13: SCOOP/STACK Position
Key Statistics2 Top Operators Net Mineral Acres2 11,899 6.9 29.1 29.1 Core NMA1 Prod. Portfolio Contribution SCOOP/STACK Position Net Production (Mmcfe/d)2 Proved Reserves (Bcfe)3 Note: 1Excludes open acreage 2As of 12/31/19 3As of 9/30/19 4Undeveloped Locations consists of PUD, PROB, and POSS locat
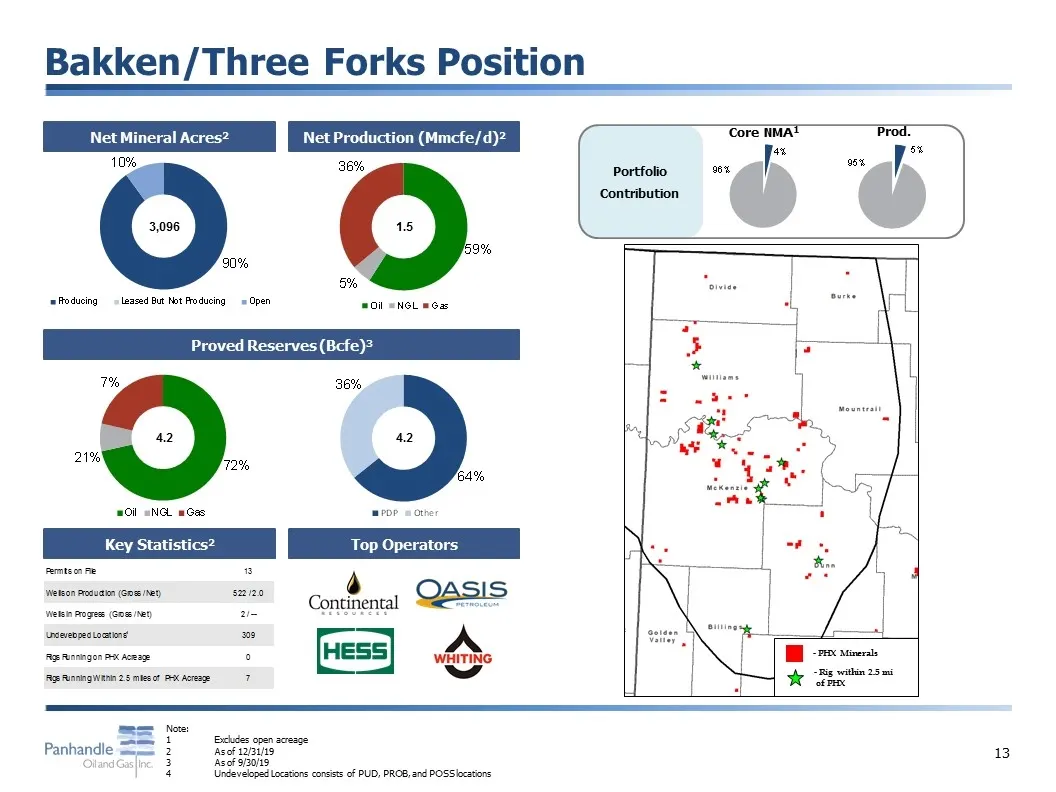
Slide 14: Bakken/Three Forks Position
3,096 1.5 4.2 4.2 Prod. Portfolio Contribution Bakken/Three Forks Position Top Operators Core NMA1 Key Statistics2 Net Mineral Acres2 Net Production (Mmcfe/d)2 Proved Reserves (Bcfe)3 Note: 1Excludes open acreage 2As of 12/31/19 3As of 9/30/19 4Undeveloped Locations consists of PUD, PROB, and POSS l

Slide 15: Financial Overview
== Panhandle =_ NYSE: PHX Olland Gas | Inc. Financial Overview
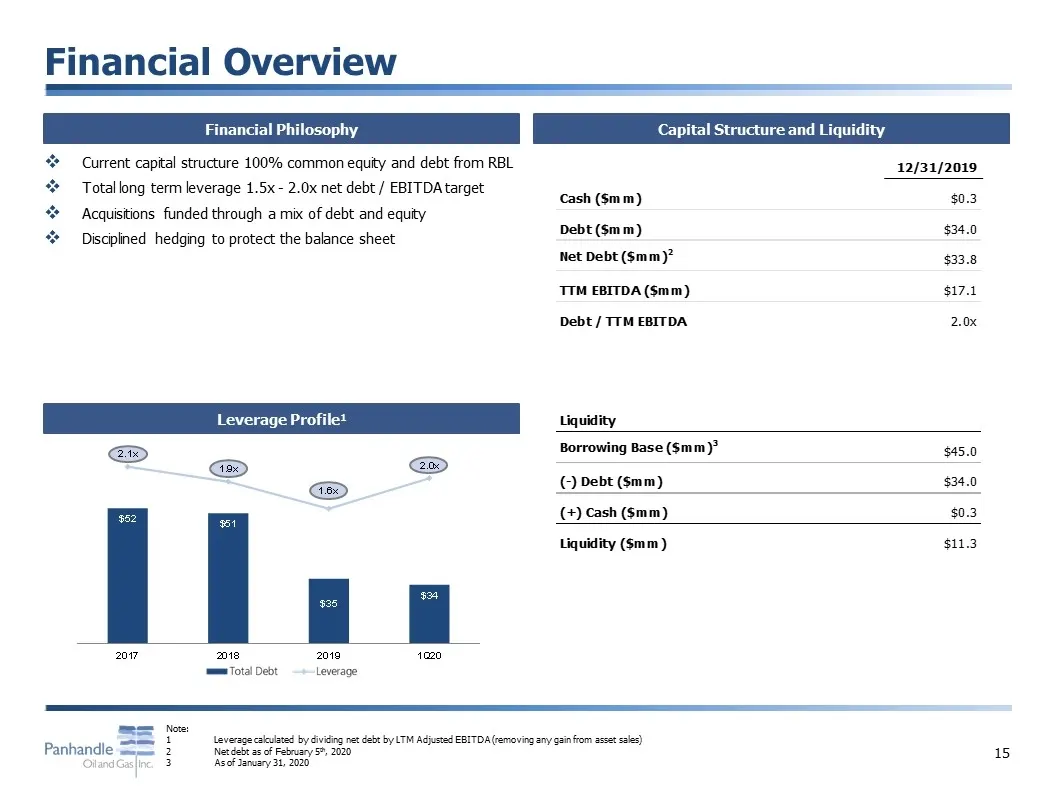
Slide 16: Financial Overview
Financial Overview Financial Philosophy Capital Structure and Liquidity Leverage Profile1 Current capital structure 100% common equity and debt from RBL Total long term leverage 1.5x - 2.0x net debt / EBITDA target Acquisitions funded through a mix of debt and equity Disciplined hedging to protect t
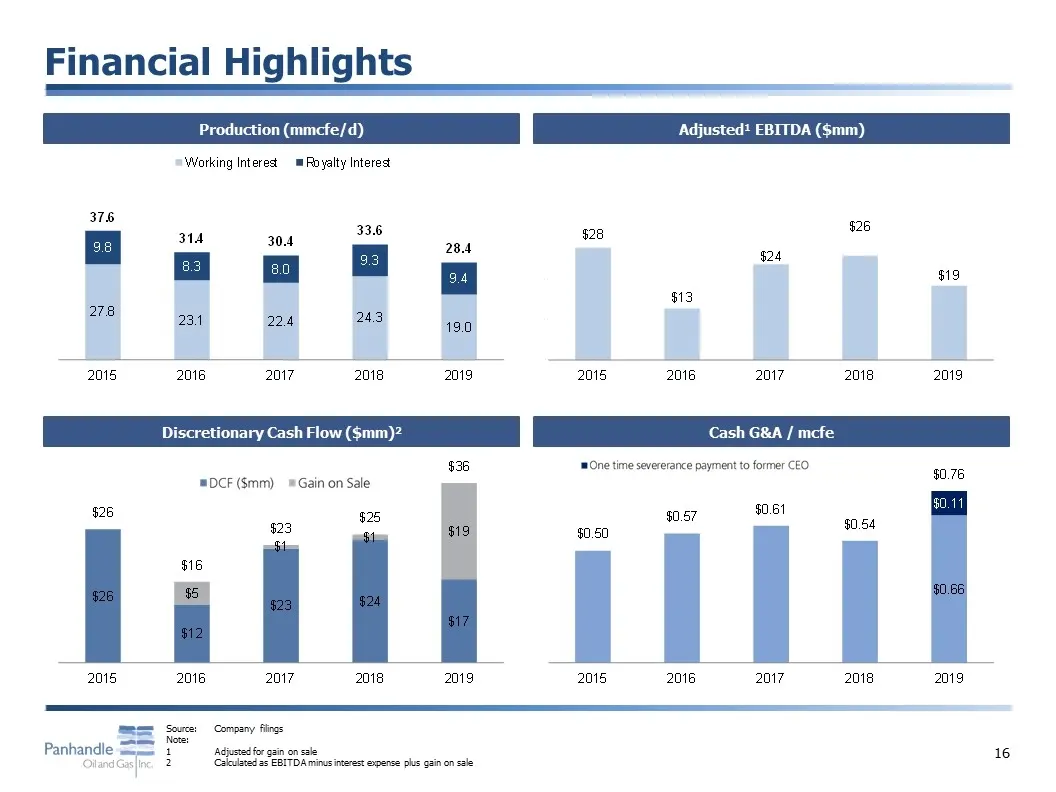
Slide 17: Financial Highlights
Financial Highlights Production (mmcfe/d) Adjusted1 EBITDA ($mm) Discretionary Cash Flow ($mm)2 Cash G&A / mcfe Source:Company filings Note: 1Adjusted for gain on sale 2Calculated as EBITDA minus interest expense plus gain on sale
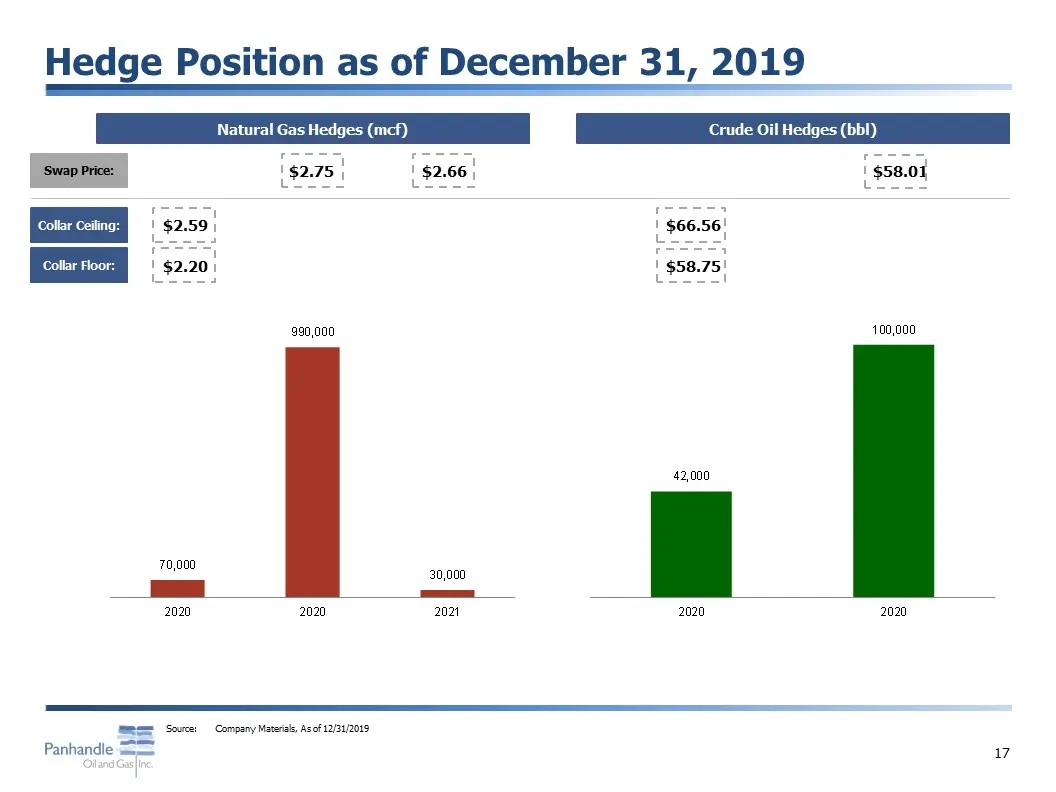
Slide 18: Hedge Position as of December 31, 2019
Hedge Position as of December 31, 2019 Natural Gas Hedges (mcf) Crude Oil Hedges (bbl) Swap Price: Collar Floor: Collar Ceiling: $2.59 $2.20 $2.75 $2.66 $58.01 $58.75 $66.56 Source: Company Materials, As of 12/31/2019
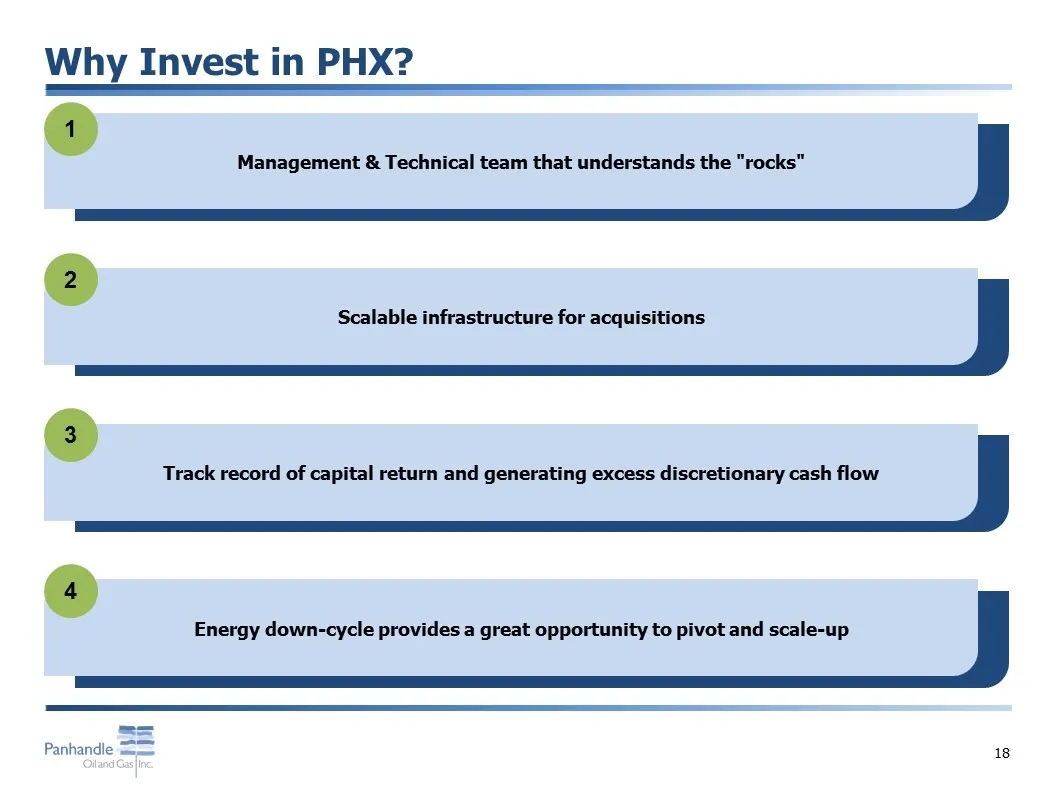
Slide 19: Why Invest in PHX?
Why Invest in PHX? Scalable infrastructure for acquisitions Management & Technical team that understands the "rocks" Energy down-cycle provides a great opportunity to pivot and scale-up Track record of capital return and generating excess discretionary cash flow 1 2 3 4
Slide 20: Appendix
== Panhandle =_ NYSE: PHX Olland Gas | Inc. Appendix
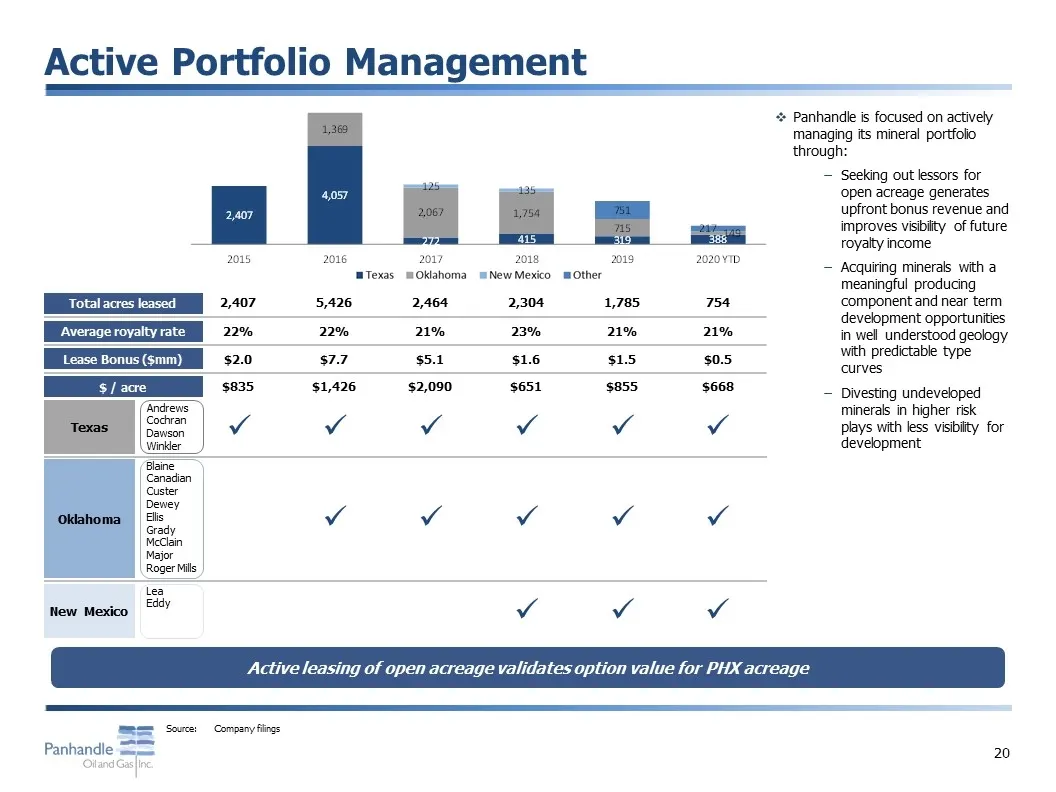
Slide 21: Active Portfolio Management
Active Portfolio Management $2.0 $7.7 $5.1 $1.6 $1.5 $0.5 Andrews Cochran Dawson Winkler $835 $1,426 $2,090 $651 $855 $668 Lease Bonus ($mm) $ / acre Texas Oklahoma New Mexico Blaine Canadian Custer Dewey Ellis Grady McClain Major Roger Mills Lea Eddy ü ü ü ü ü ü ü ü ü ü ü Active leasing of open acr
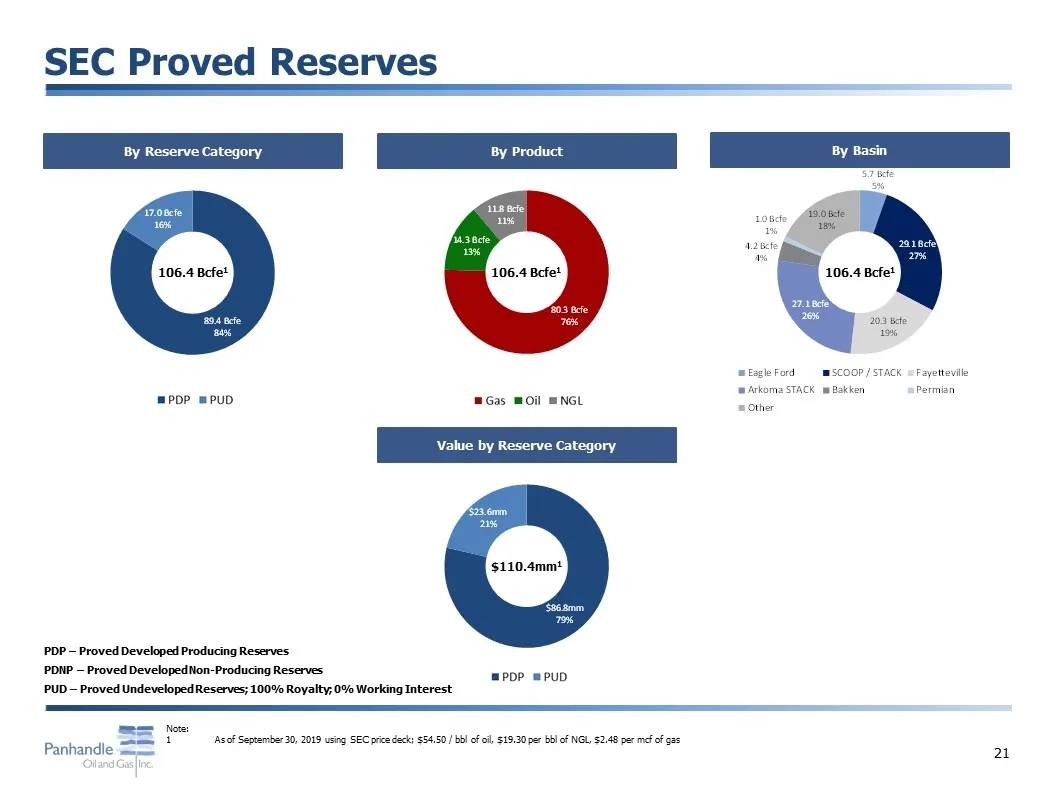
Slide 22: SEC Proved Reserves
SEC Proved Reserves By Reserve Category By Product By Basin 106.4 Bcfe1 106.4 Bcfe1 106.4 Bcfe1 PDP – Proved Developed Producing Reserves PDNP – Proved Developed Non-Producing Reserves PUD – Proved Undeveloped Reserves; 100% Royalty; 0% Working Interest Note: 1As of September 30, 2019 using SEC pric
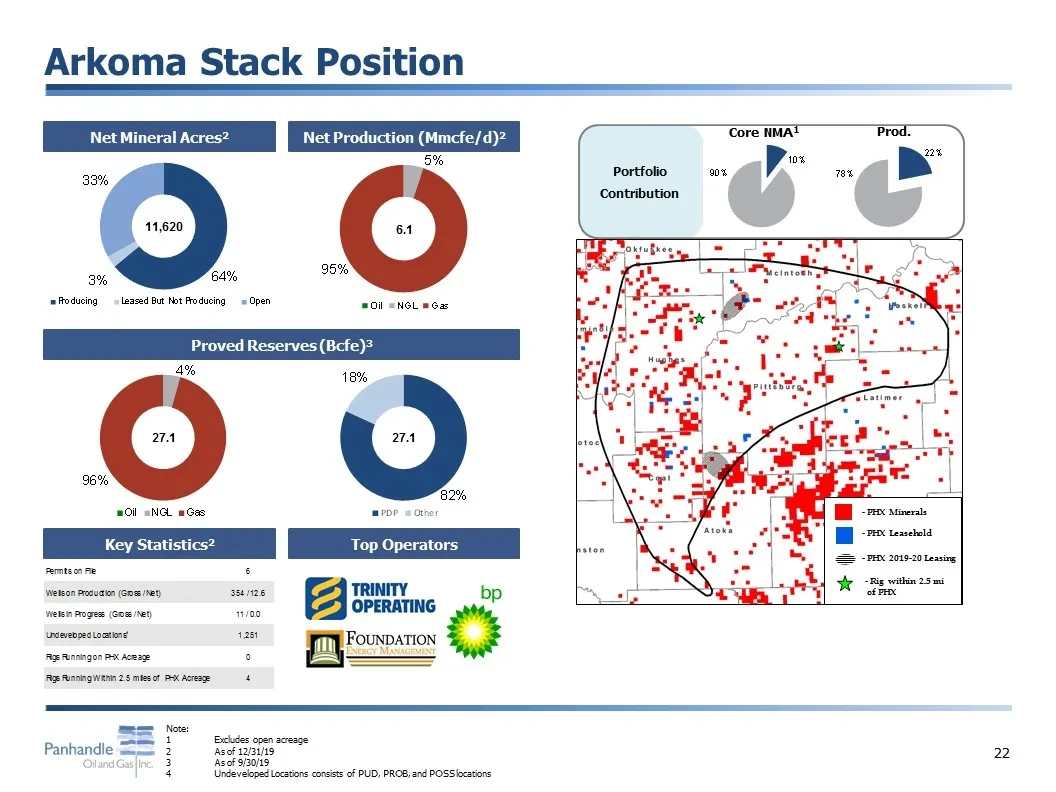
Slide 23: Arkoma Stack Position
11,620 6.1 27.1 27.1 Prod. Portfolio Contribution Arkoma Stack Position Top Operators Core NMA1 Key Statistics2 Net Mineral Acres2 Net Production (Mmcfe/d)2 Proved Reserves (Bcfe)3 Note: 1Excludes open acreage 2As of 12/31/19 3As of 9/30/19 4Undeveloped Locations consists of PUD, PROB, and POSS loca
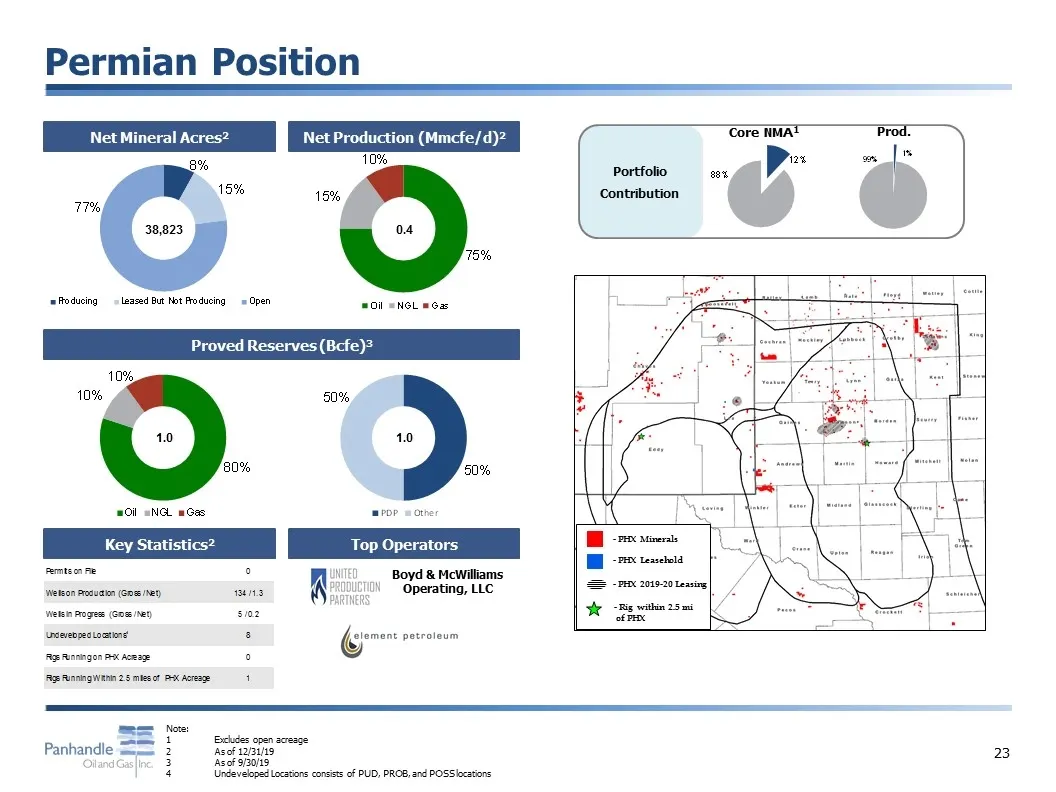
Slide 24: Permian Position
38,823 0.4 1.0 1.0 Prod. Portfolio Contribution Permian Position Boyd & McWilliams Operating, LLC Top Operators Core NMA1 Key Statistics2 Net Mineral Acres2 Net Production (Mmcfe/d)2 Proved Reserves (Bcfe)3 Note: 1Excludes open acreage 2As of 12/31/19 3As of 9/30/19 4Undeveloped Locations consists o
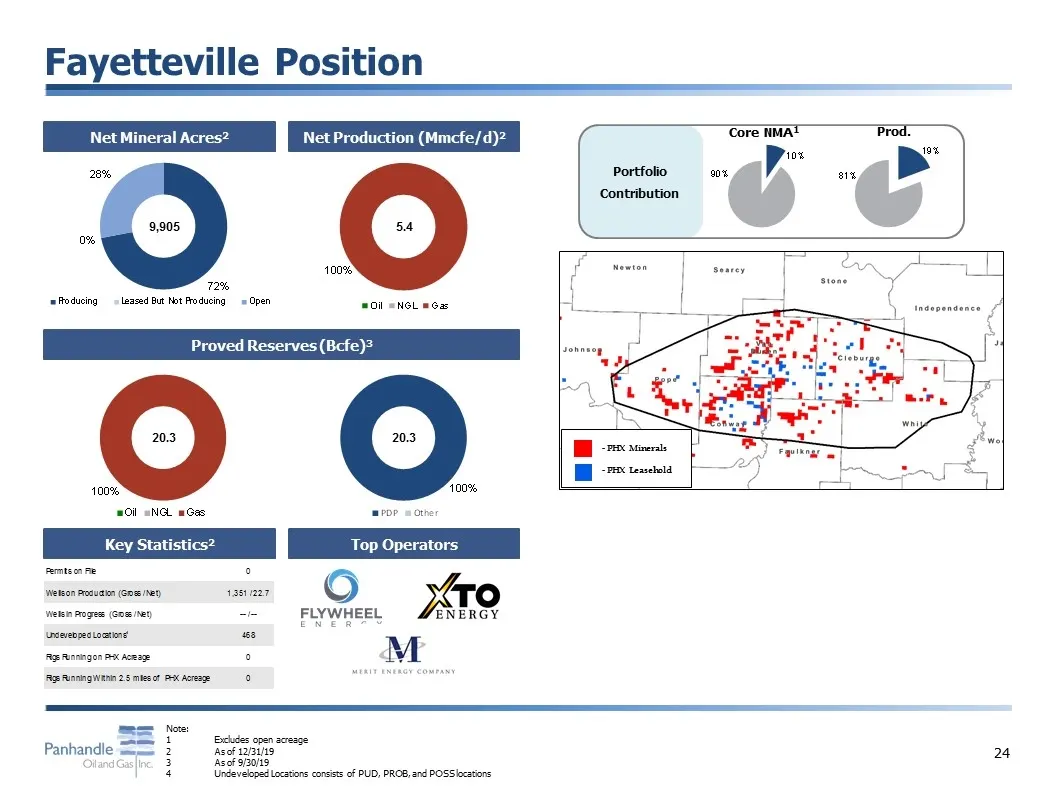
Slide 25: Fayetteville Position
9,905 5.4 20.3 20.3 Prod. Portfolio Contribution Fayetteville Position Top Operators Core NMA1 Key Statistics2 Net Mineral Acres2 Net Production (Mmcfe/d)2 Proved Reserves (Bcfe)3 Note: 1Excludes open acreage 2As of 12/31/19 3As of 9/30/19 4Undeveloped Locations consists of PUD, PROB, and POSS locat
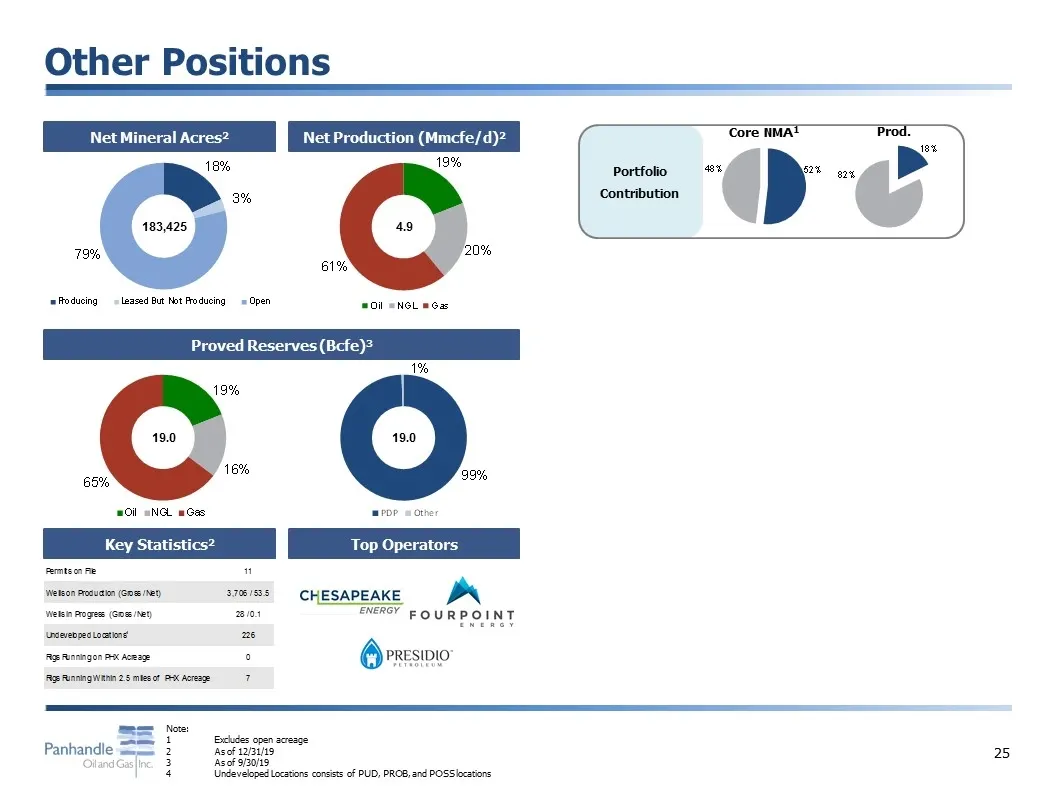
Slide 26: Other Positions
183,425 4.9 19.0 19.0 Prod. Portfolio Contribution Other Positions Top Operators Core NMA1 Key Statistics2 Net Mineral Acres2 Net Production (Mmcfe/d)2 Proved Reserves (Bcfe)3 Note: 1Excludes open acreage 2As of 12/31/19 3As of 9/30/19 4Undeveloped Locations consists of PUD, PROB, and POSS locations
Source: SEC EDGAR · 8-K filed Feb 11, 2020
More decks from PHX Minerals Inc
 Investor Presentation (March 2025)29 slides · Mar 12, 2025
 Investor Presentation (November 2024)33 slides · Nov 6, 2024
 Investor Presentation (August 2024)33 slides · Aug 7, 2024
 Investor Presentation (May 2024)33 slides · May 8, 2024
 Investor Presentation (March 2024)33 slides · Mar 12, 2024
 Investor Presentation (November 2023)40 slides · Nov 8, 2023