Sealed Air — Barclays Industrial Select Conference (February 2015)
15 slides from Sealed Air's conference presentation, Feb 19, 2015

Slide 1: Barclays Industrial Select Conference: Company Overview
Exhibit 99.1 Barclays Industrial Select Conference Company Overview Lori Chaitman, Vice President, Investor Relations Ph: 201-703-4161 Email: [email protected]

Slide 2: Vision, Mission and 2014 Financials
VISION: To create a better way for life MISSION: We Re-imagine™ the industries we serve to create a world that feels, tastes and works better. 2014 FINANCIALS Total Sales $ 7.8 B Adj. EBITDA $ 1.12 B Adj. EBITDA Margin 14.4 % Free Cash Flow $ 612 M
Slide 3: How We Deliver Value
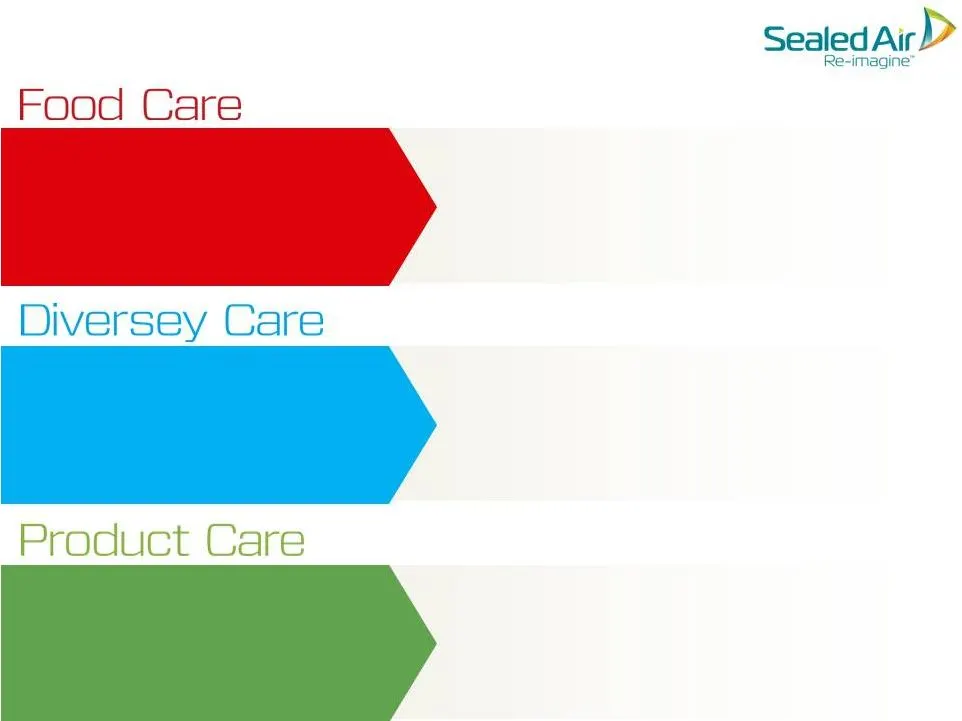
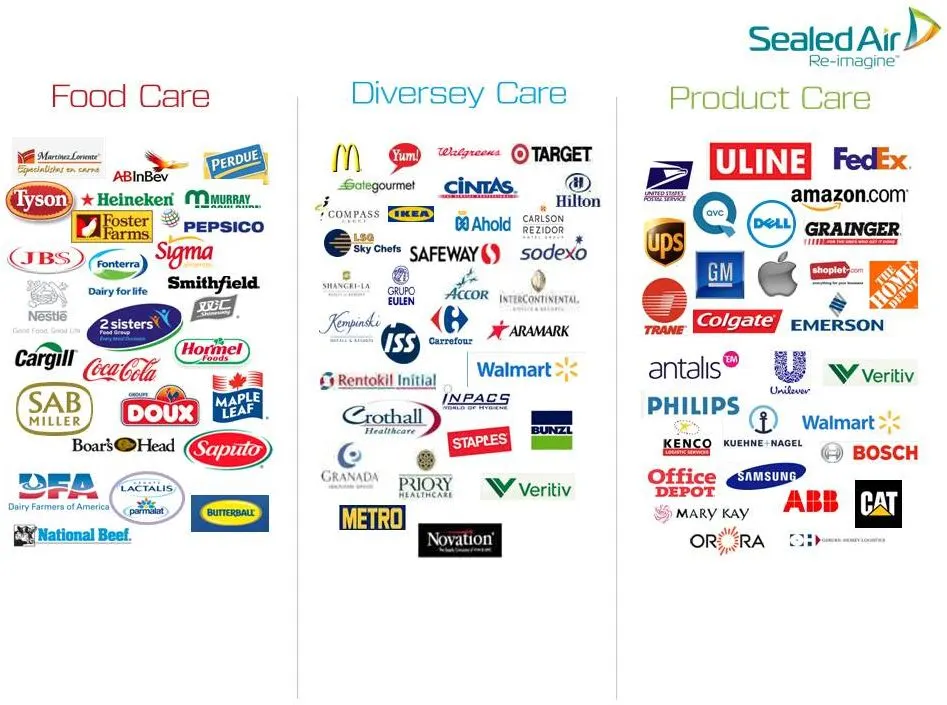
2014 Sales: $1.7B 26% of 2014 Adj. EBITDA 2014 Sales: $2.2B 22% of 2014 Adj. EBITDA 2014 Sales: $3.8B 60% of 2014 Adj. EBITDA • Engineered & Packaging Solutions driving Damage Control and Cube Optimization • Packaging Design & Testing • Lean Six Sigma Expertise • Building & Kitchen Care Services • I
Slide 4: Who We Serve
Who We Serve TOP CUSTOMERS ACCOUNT FOR ~ 25% OF SALES TOP CUSTOMERS ACCOUNT FOR ~ 20% OF SALES DISTRIBUTION ACCOUNTS FOR ~ 35% OF SALES DISTRIBUTION ACCOUNTS FOR ~ 65% OF SALES
Slide 5: 2014 Net Sales by End Market
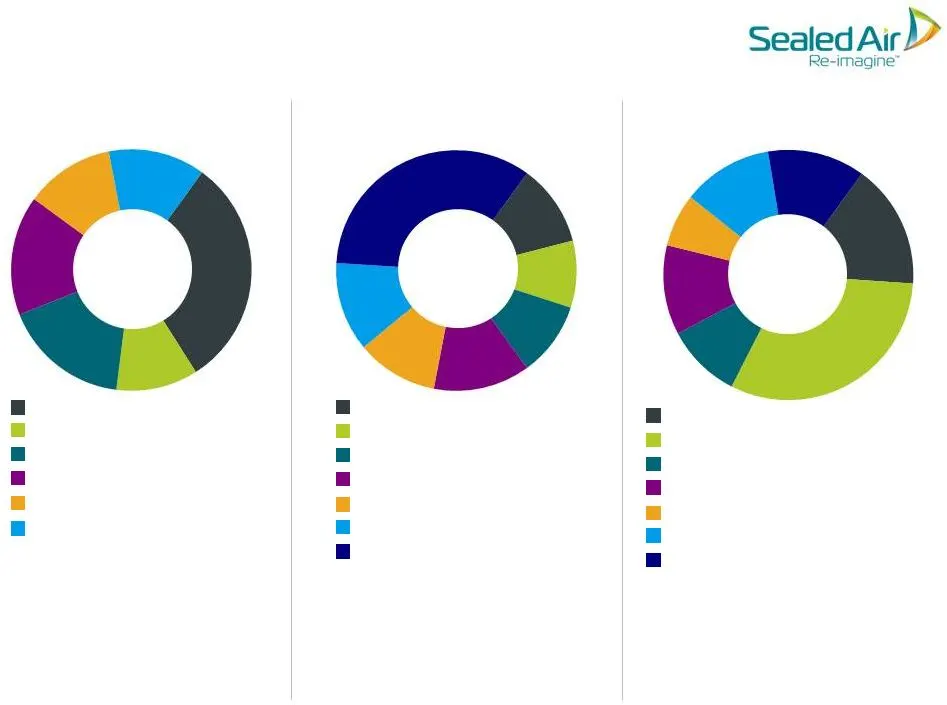
31% 11% 18% 15% 11% 13% 9% 12% 11% 11% 35% 12% 10% 12% 10% 12% 7% 13% 16% 31% DIVERSEY CARE FOOD CARE Fresh Red Meat Dairy Solids Other Food Smoked & Processed Poultry Beverages Building Service Contractors Health Care Other Food Service Retail Hospitality Distribution GLOBAL ADDRESSABLE MARKET: APP
Slide 6: 2014 Net Sales by Region
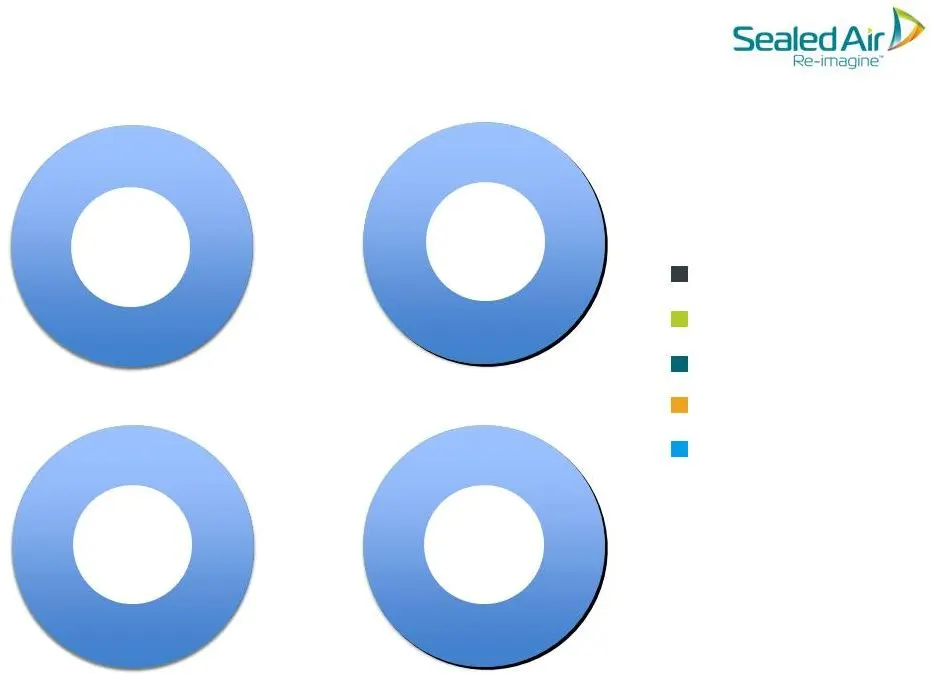
8% 11% 32% 10% 40% 7% 27% 14% 41% 10% 4% 24% 59% 8% 5% 19% 44% 9% 25% 3% DIVERSEY CARE PRODUCT CARE FOOD CARE SEALED AIR 2014 Net Sales by Region * AMAT: Asia, Middle East, Africa & Turkey ** ANZ: Australia & New Zealand North America Japan/ANZ** AMAT* Latin America Europe
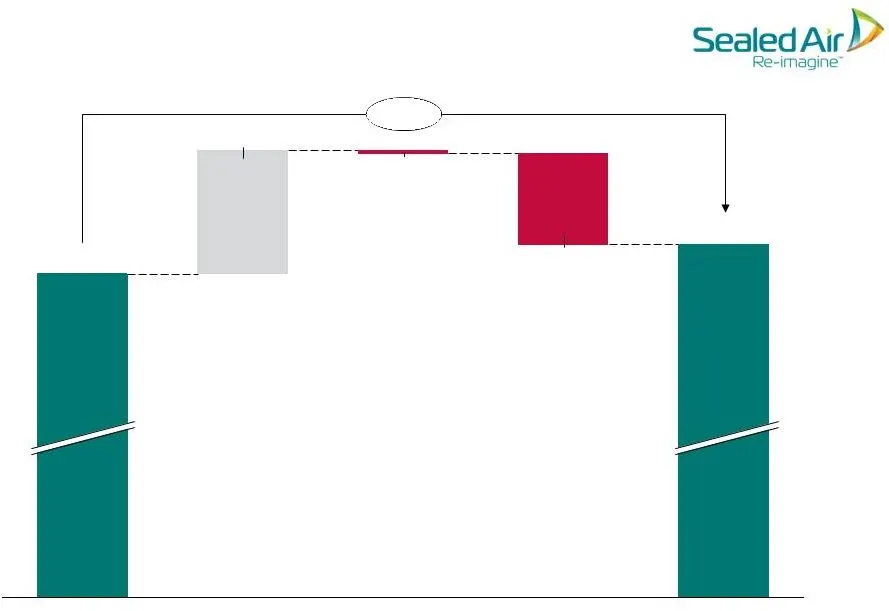
Slide 7: 2014 Net Sales Bridge
2014 Net Sales Bridge +0.8% 7,751 Foreign Exchange -183 Volume -6 Price/Mix +249 7,691 Constant Currency Sales Growth: 3.2% ($Millions) Net Sales Net Sales
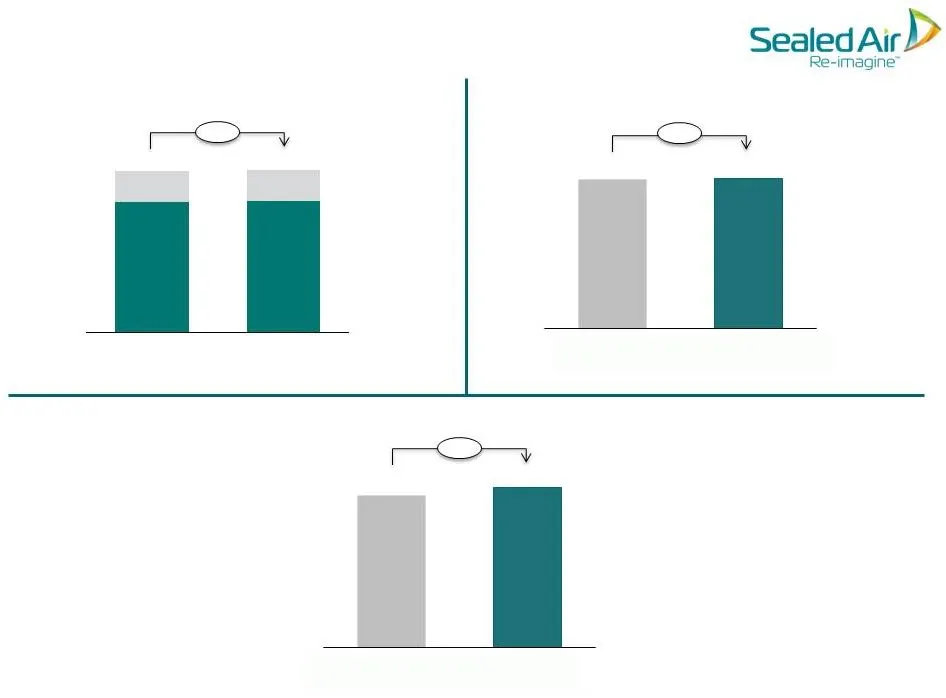
Slide 8: 2014 Net Sales by Division
3,110 3,132 FOOD CARE 2014 Net Sales by Division Packaging Hygiene 3,814 3,835 Constant Currency Net Sales Growth: 3.6% DIVERSEY CARE PRODUCT CARE ($Millions) Constant Currency Net Sales Growth: 3.7% Constant Currency Net Sales Growth: 3.0% 2,161 2,173 +0.6% +0.6% 1,610 1,655 +2.8%
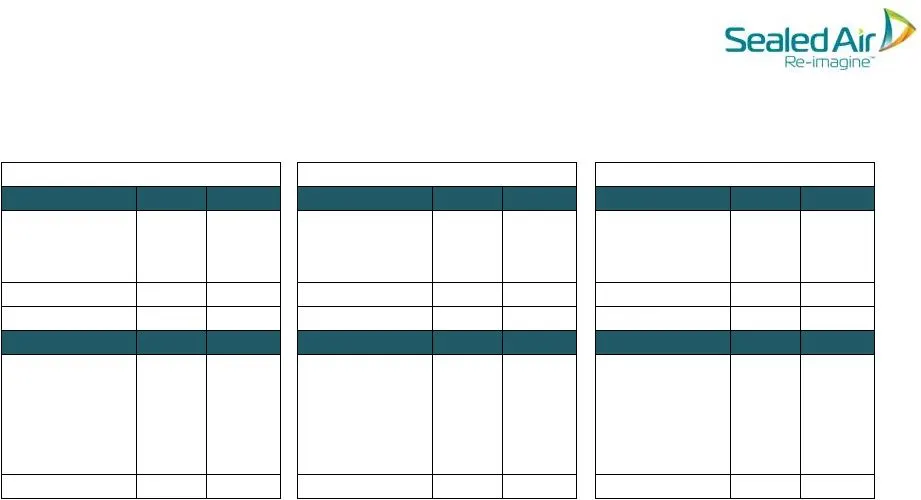
Slide 9: YoY Price/Mix & Volume Trends
By Division 2013 2014 By Region 2013 2014 By Division 2013 2014 By Region 2013 2014 By Division 2013 2014 By Region 2013 2014 YoY Price/Mix & Volume Trends 2014 delivered constant currency sales growth with favorable Price/Mix in every division and every region. YEAR-END 2014 RESULTS Food Care 1.6%
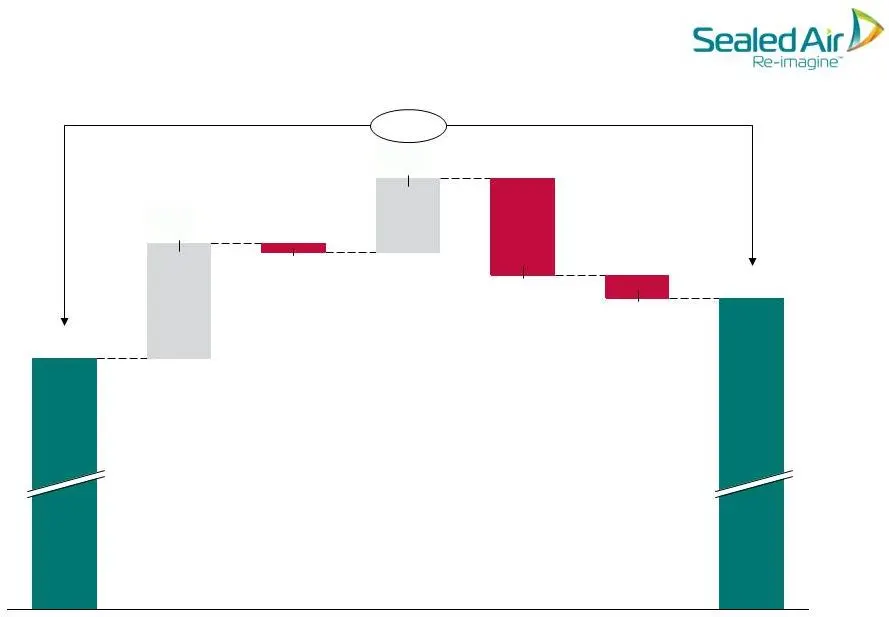
Slide 10: 2014 Adjusted EBITDA Bridge
2014 Adjusted EBITDA Bridge Volume +7.5% Foreign Exchange -30 -127 -12 1,041 1,118 Cost Synergies Adjusted EBITDA Margin: 2014: 14.4% 2013: 13.5% ($Millions) Mix & Price/ Cost Spread SG&A/ Other
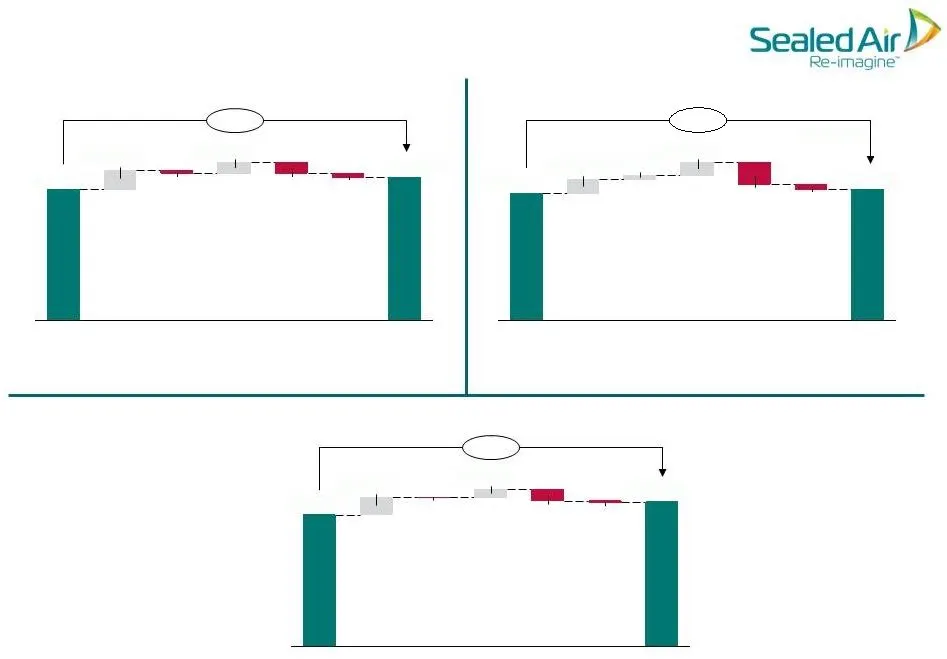
Slide 11: 2014 Adjusted EBITDA by Division
FOOD CARE 2014 Adjusted EBITDA by Division DIVERSEY CARE PRODUCT CARE ($Millions) +9.0% Foreign Exchange Volume -51 Mix & Price/Cost Spread Cost Synergies Adj. EBITDA Margin: 2014: 17.5% 2013: 16.1% -40 Cost Synergies Foreign Exchange Volume Mix & Price/Cost Spread Adj. EBITDA Margin: 2014: 11.3% 20
Slide 12: Free Cash Flow
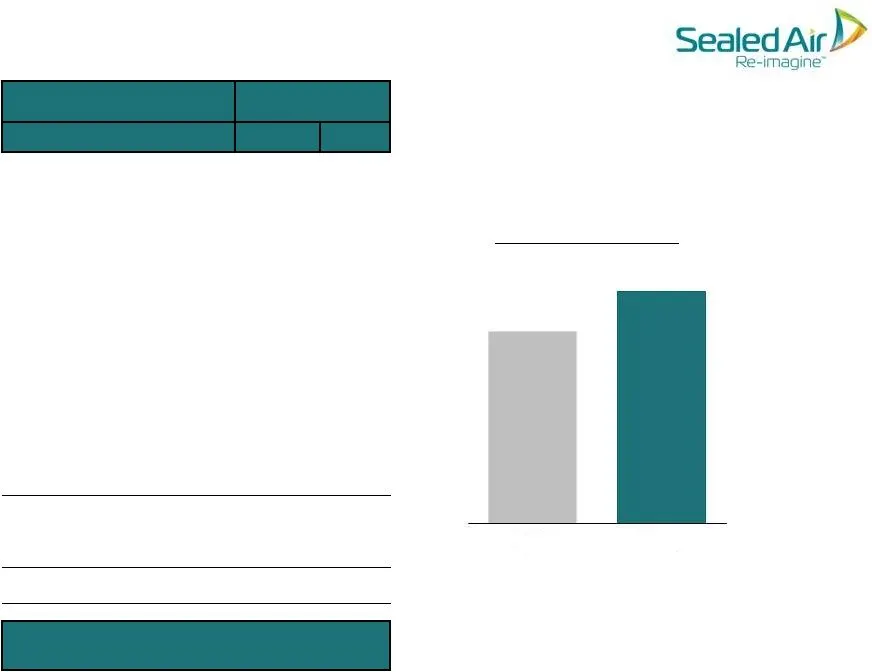
($ in millions) Free Cash Flow 2013 2014 Free Cash Flow Before Settlement Payment 509 612 Year Ended December 31 ($ in millions) Free Cash Flow Before Settlement Payment Year Ended December 31 Free Cash Flow * Includes changes in trade receivables, net, inventories and accounts payable. Adjusted Net
Slide 13: Debt Maturity Schedule
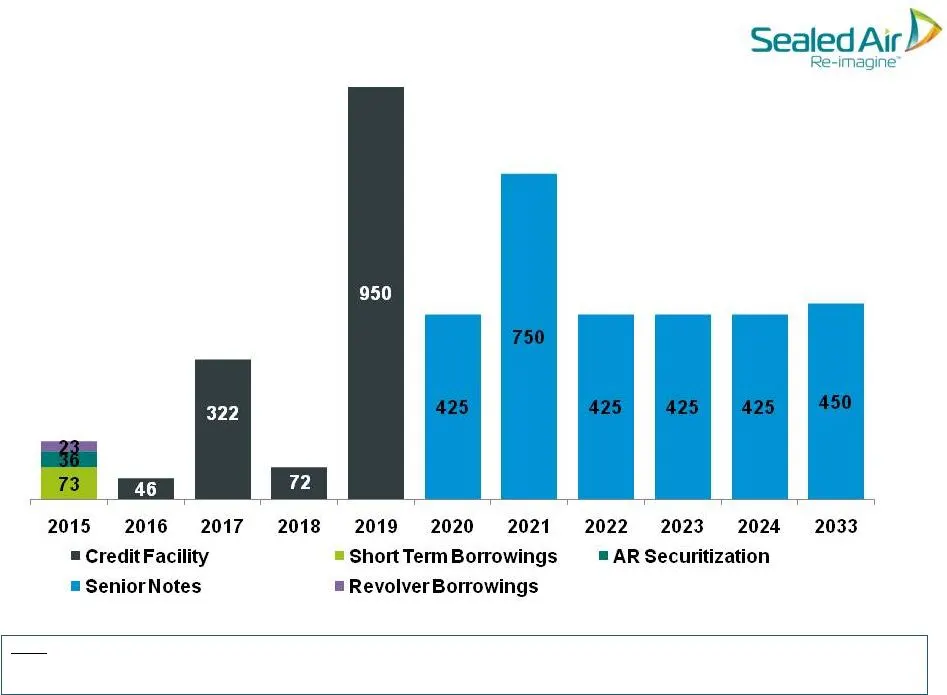
Debt Maturity Schedule • Refinanced credit facility on July 25, 2014. Please see Form 8-K filed on July 30, 2014 for more details. • Refinanced 8.125% Notes due 2019 with $425M of Notes due 2022 and $425M of Notes due 2024. 6.5% 5.25% 6.875% 4.875% 5.125% 8.375%
Slide 14: Liquidity & Net Debt
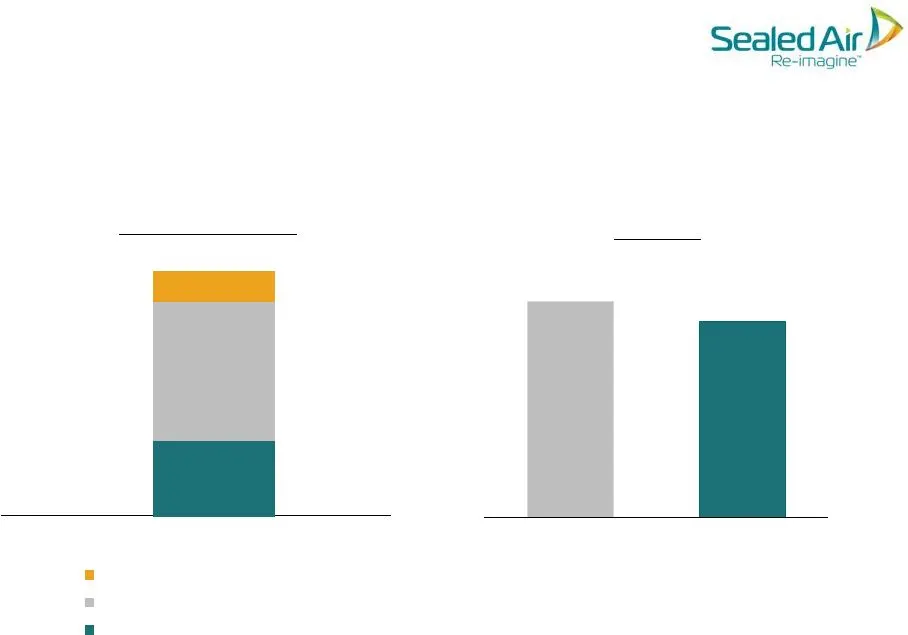
Liquidity & Net Debt Liquidity Position December 31, 2014 A/R Securitization Net Debt 4,332 4,092 December 31, 2013 December 31, 2014 1,155 Revolving Credit Facility Cash & Cash Equivalents ($ in millions)
Slide 15: Sealed Air
Sealed Air 22-imagine’
Source: SEC EDGAR · 8-K filed Feb 19, 2015
More decks from Sealed Air Corporation
 Q3 2025 Earnings Presentation17 slides · Nov 4, 2025
 Q2 2025 Earnings Presentation17 slides · Aug 5, 2025
 Q1 2025 Earnings Presentation15 slides · May 6, 2025
 Q4 2024 Earnings Presentation21 slides · Feb 25, 2025
 Q3 2024 Earnings Presentation20 slides · Nov 7, 2024
 Q2 2024 Earnings Presentation20 slides · Aug 8, 2024