Verso — Deutsche Bank Leveraged Finance Conference 2016
28 slides from Verso's conference presentation, Sep 27, 2016
Slide 1: Verso Corporation Deutsche Bank Leveraged Finance Conference
VERSO CORPORATION Deutsche Bank Leveraged Finance Conference September 28, 2016
Slide 2: Disclaimer
CONFIDENTIAL INTERNAL USE ONLY Disclaimer 1 This document contains highly confidential information and is solely for informational purposes. You should not rely upon or use it to form the definitive basis for any decision or action whatsoever, with respect to any proposed transaction or otherwise. Y
Slide 3: Disclaimer - continued
CONFIDENTIAL INTERNAL USE ONLY Disclaimer - continued 2 Forward-Looking Statements In this presentation, all statements that are not purely historical facts are forward-looking statements within the meaning of Section 27A of the Securities Act of 1933, as amended, and Section 21E of the Securities E
Slide 4: Presenters
CONFIDENTIAL INTERNAL USE ONLY Presenters • Allen Campbell Verso Corporation SVP and Chief Financial Officer • Tim Nusbaum Verso Corporation Treasurer 3
Slide 5: Verso Corporation Company Profile
CONFIDENTIAL INTERNAL USE ONLY Verso Corporation Company Profile
Slide 6: Company Overview
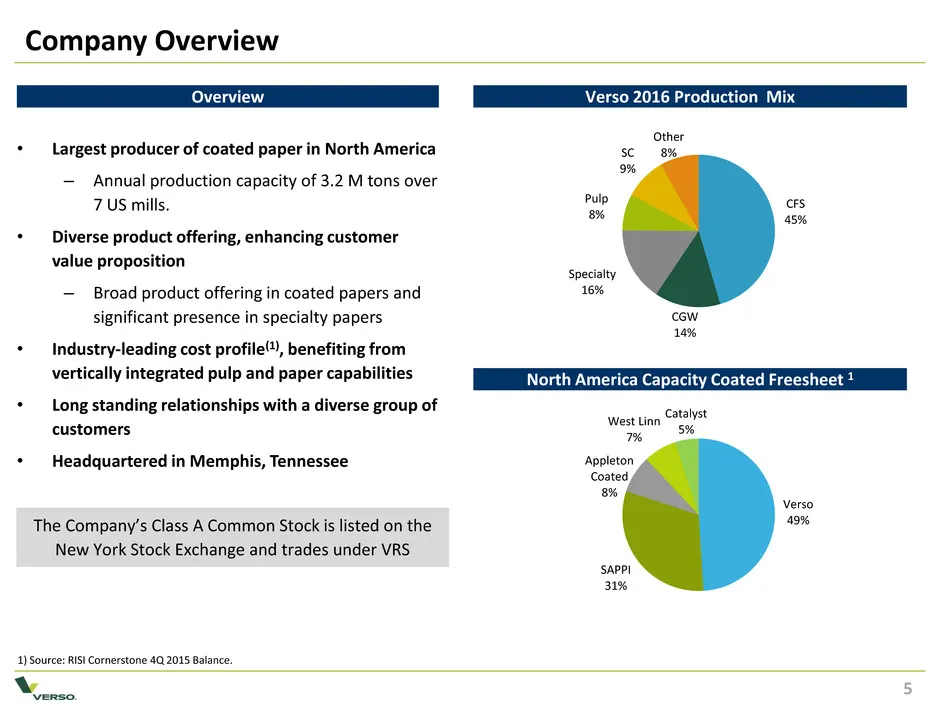
CONFIDENTIAL INTERNAL USE ONLY Company Overview 5 5 Verso 49% SAPPI 31% Appleton Coated 8% West Linn 7% Catalyst 5% • Largest producer of coated paper in North America – Annual production capacity of 3.2 M tons over 7 US mills. • Diverse product offering, enhancing customer value proposition – Broad
Slide 7: Restructuring Overview
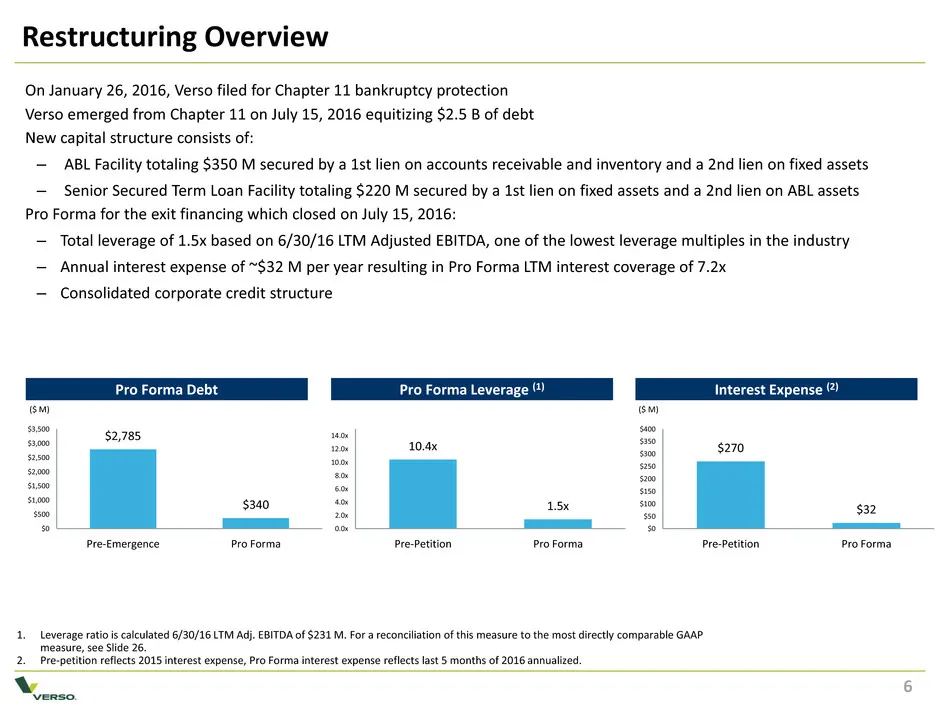
CONFIDENTIAL INTERNAL USE ONLY 6 1. Leverage ratio is calculated 6/30/16 LTM Adj. EBITDA of $231 M. For a reconciliation of this measure to the most directly comparable GAAP measure, see Slide 26. 2. Pre-petition reflects 2015 interest expense, Pro Forma interest expense reflects last 5 months of 20
Slide 8: Fresh Start Restructuring Results
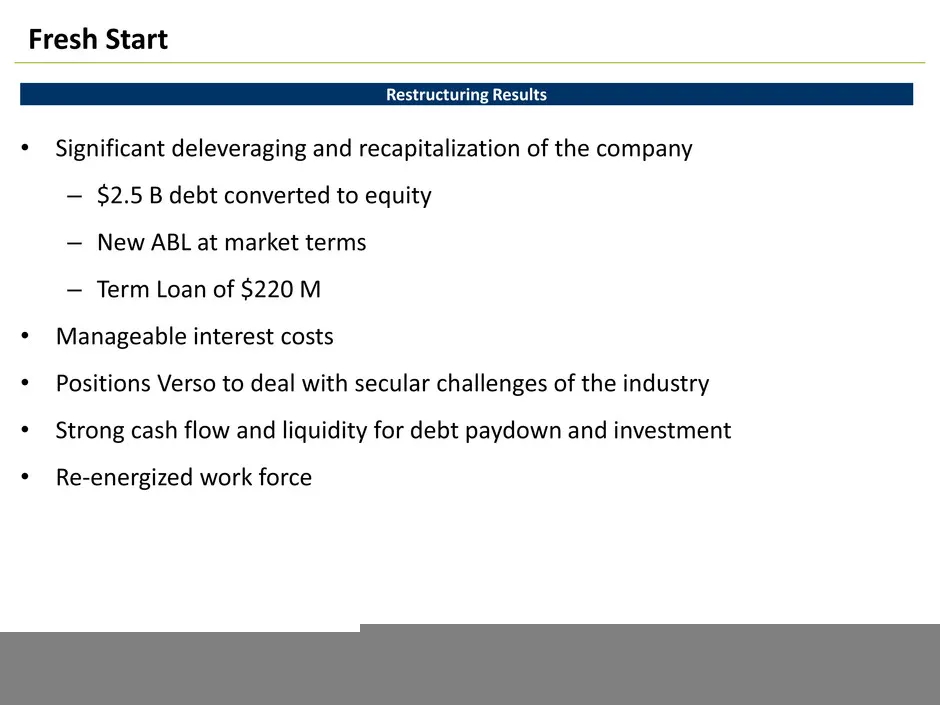
CONFIDENTIAL INTERNAL USE ONLY Fresh Start Restructuring Results • Significant deleveraging and recapitalization of the company – $2.5 B debt converted to equity – New ABL at market terms – Term Loan of $220 M • Manageable interest costs • Positions Verso to deal with secular challenges of the indus
Slide 9: Verso - Attractive Investment Profile
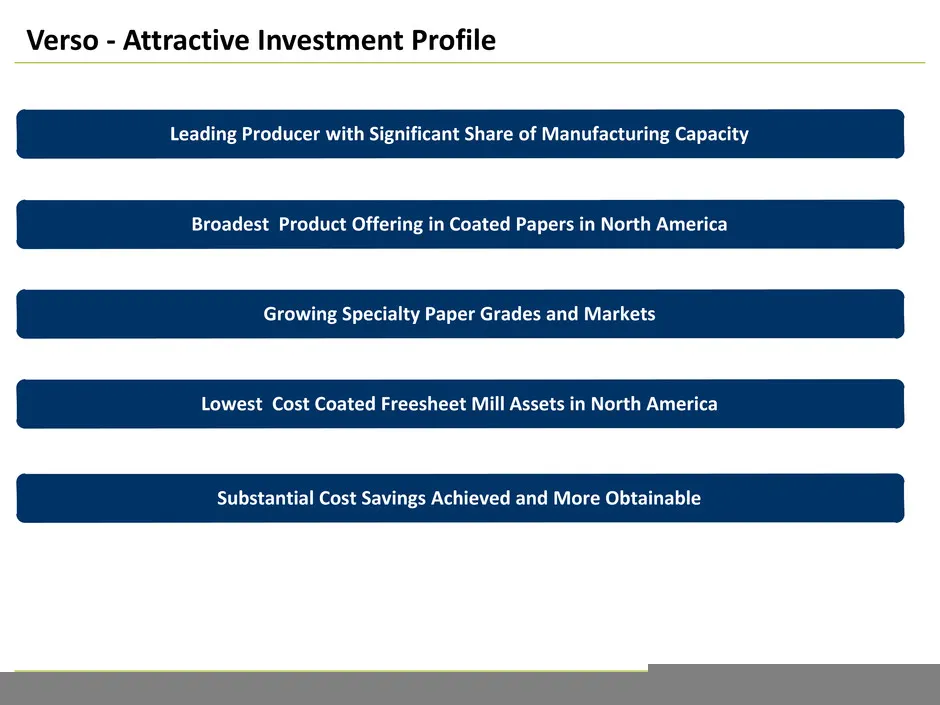
CONFIDENTIAL INTERNAL USE ONLY Verso - Attractive Investment Profile Substantial Cost Savings Achieved and More Obtainable Growing Specialty Paper Grades and Markets Leading Producer with Significant Share of Manufacturing Capacity Lowest Cost Coated Freesheet Mill Assets in North America Broadest P
Slide 10: Broad Product Offering
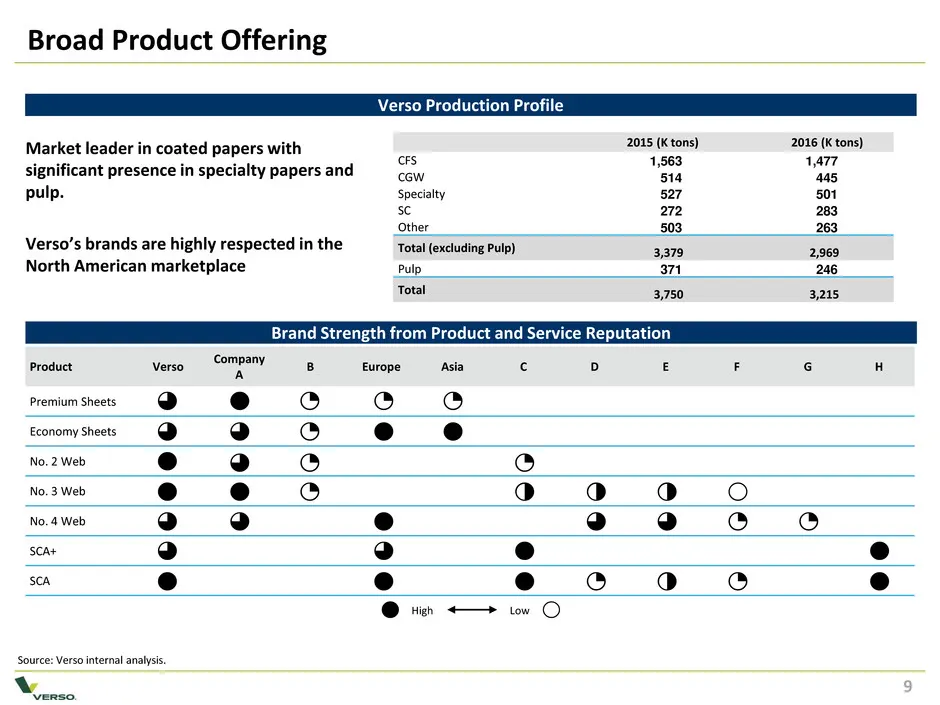
CONFIDENTIAL INTERNAL USE ONLY 9 Broad Product Offering 9 Market leader in coated papers with significant presence in specialty papers and pulp. Verso’s brands are highly respected in the North American marketplace Product Verso Company A B Europe Asia C D E F G H Premium Sheets Economy Sheets No. 2
Slide 11: Where Verso's Products Are Used
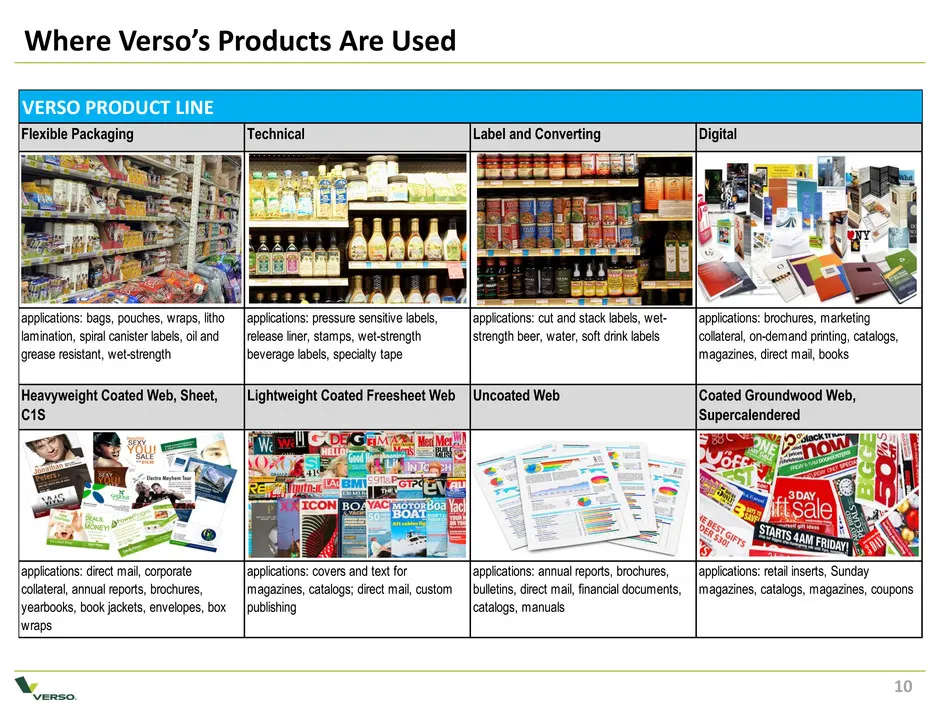
CONFIDENTIAL INTERNAL USE ONLY Where Verso’s Products Are Used 10 Flexible Packaging Technical Label and Converting Digital applications: bags, pouches, wraps, litho lamination, spiral canister labels, oil and grease resistant, wet-strength applications: pressure sensitive labels, release liner, sta
Slide 12: Low Cost Assets
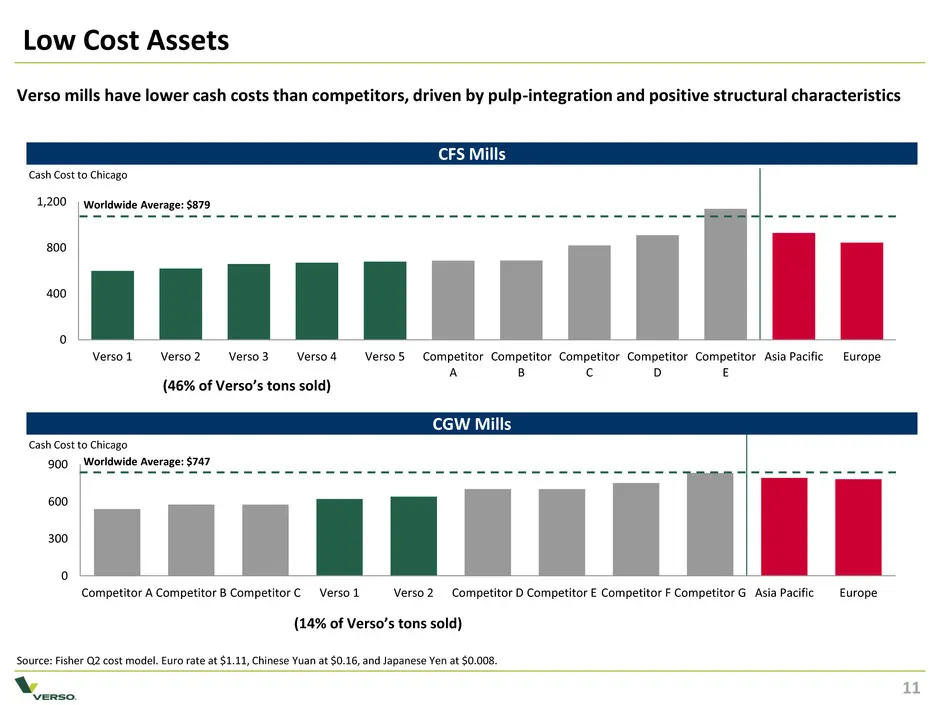
CONFIDENTIAL INTERNAL USE ONLY Low Cost Assets 11 Source: Fisher Q2 cost model. Euro rate at $1.11, Chinese Yuan at $0.16, and Japanese Yen at $0.008. Verso mills have lower cash costs than competitors, driven by pulp-integration and positive structural characteristics CFS Mills CGW Mills 0 300 600
Slide 13: Growing Specialty Paper Grades
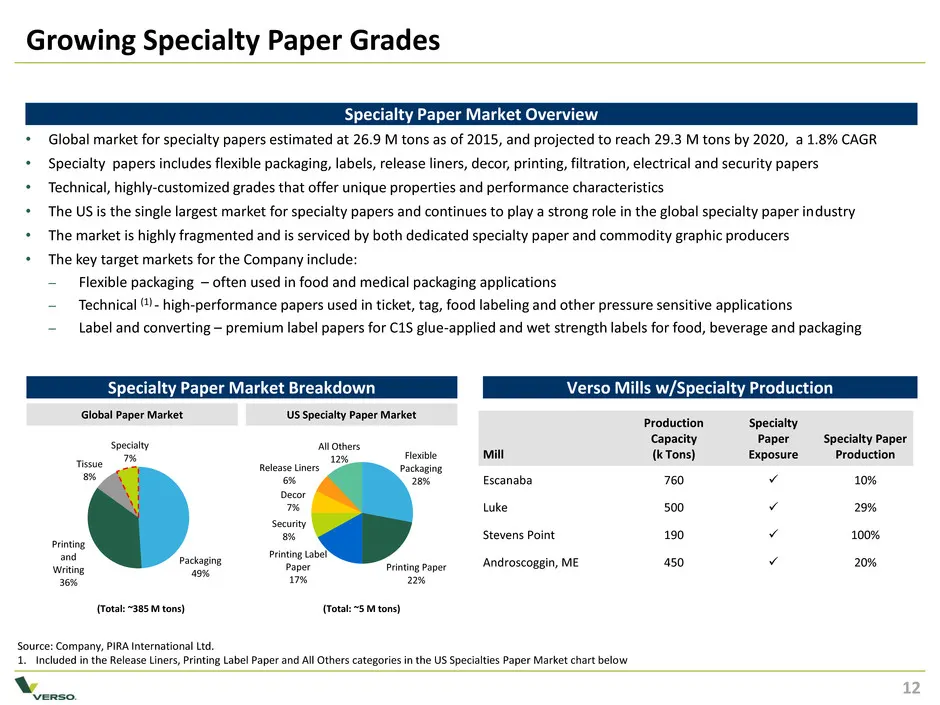
CONFIDENTIAL INTERNAL USE ONLY Growing Specialty Paper Grades 12 Source: Company, PIRA International Ltd. 1. Included in the Release Liners, Printing Label Paper and All Others categories in the US Specialties Paper Market chart below Specialty Paper Market Overview Specialty Paper Market Breakdown
Slide 14: Company Focus Areas
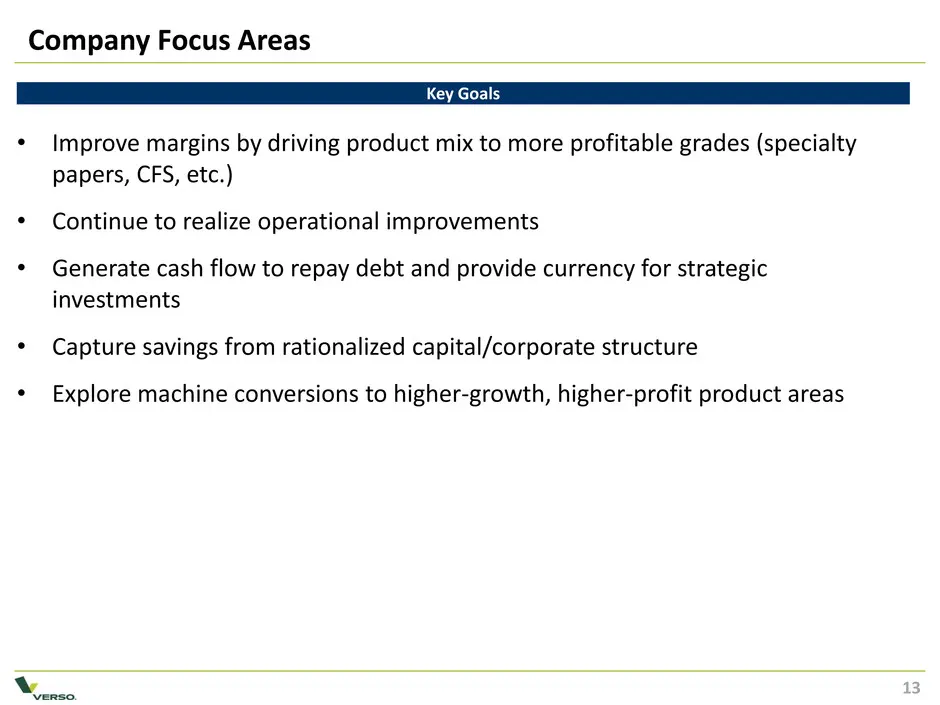
CONFIDENTIAL INTERNAL USE ONLY Company Focus Areas 13 Key Goals • Improve margins by driving product mix to more profitable grades (specialty papers, CFS, etc.) • Continue to realize operational improvements • Generate cash flow to repay debt and provide currency for strategic investments • Capture
Slide 15: Industry Update and Outlook
CONFIDENTIAL INTERNAL USE ONLY Industry Update and Outlook
Slide 16: Industry Projections – US Paper Demand
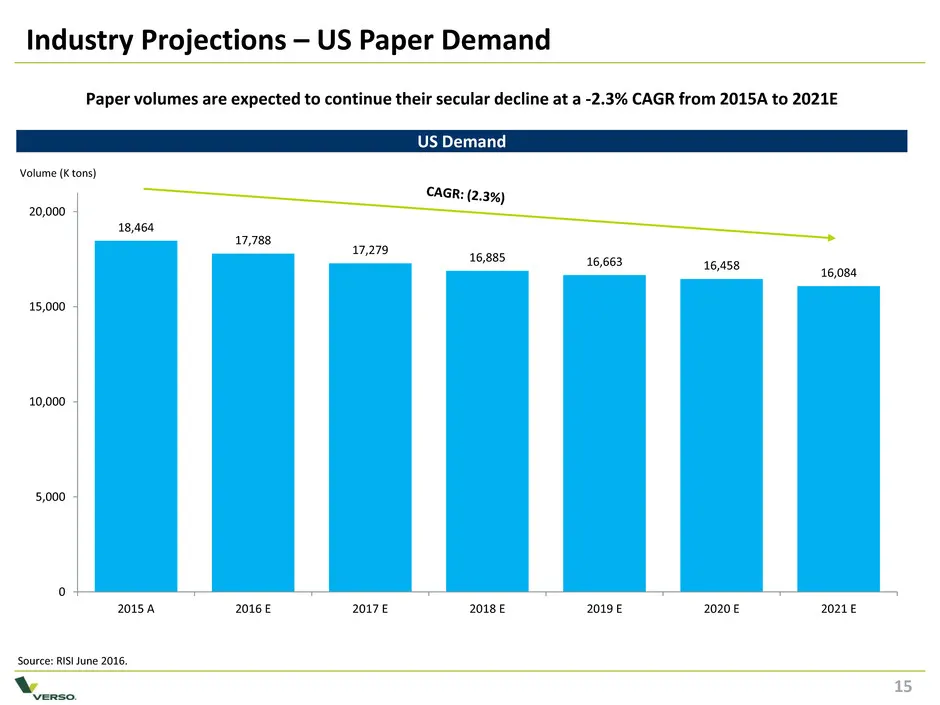
CONFIDENTIAL INTERNAL USE ONLY Industry Projections – US Paper Demand Volume (K tons) Source: RISI June 2016. US Demand Paper volumes are expected to continue their secular decline at a -2.3% CAGR from 2015A to 2021E 18,464 17,788 17,279 16,885 16,663 16,458 16,084 0 5,000 10,000 15,000 20,000 2015
Slide 17: Industry Projections – US Paper Demand By Type
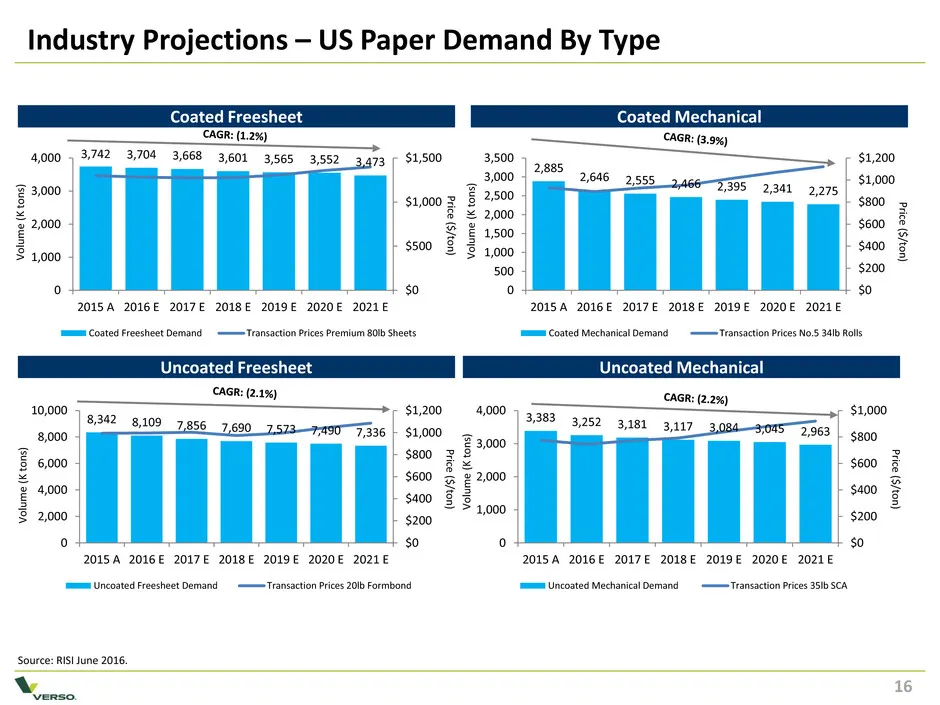
CONFIDENTIAL INTERNAL USE ONLY 3,383 3,252 3,181 3,117 3,084 3,045 2,963 $0 $200 $400 $600 $800 $1,000 0 1,000 2,000 3,000 4,000 2015 A 2016 E 2017 E 2018 E 2019 E 2020 E 2021 E Uncoated Mechanical Demand Transaction Prices 35lb SCA 8,342 8,109 7,856 7,690 7,573 7,490 7,336 $0 $200 $400 $600 $800 $1
Slide 18: Coated Freesheet – Net Imports % of US Demand
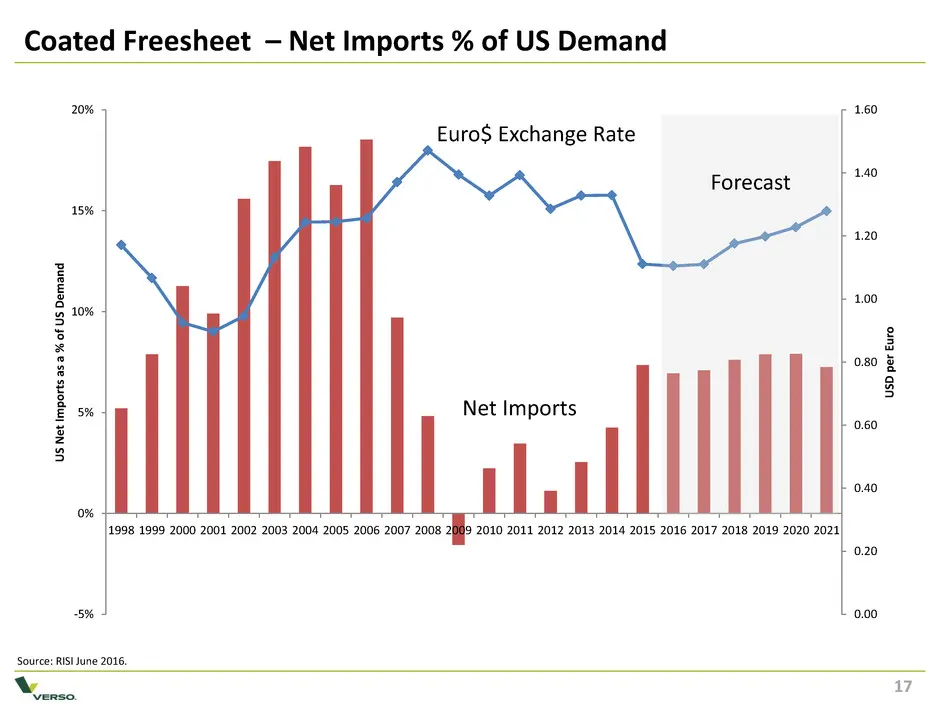
CONFIDENTIAL INTERNAL USE ONLY 0.00 0.20 0.40 0.60 0.80 1.00 1.20 1.40 1.60 -5% 0% 5% 10% 15% 20% 1998 1999 2000 2001 2002 2003 2004 2005 2006 2007 2008 2009 2010 2011 2012 2013 2014 2015 2016 2017 2018 2019 2020 2021 U SD p e r Eu ro U S N e t Im p o rts as a % o f U S D e m an d Coated Freesheet –
Slide 19: 2016 Guidance
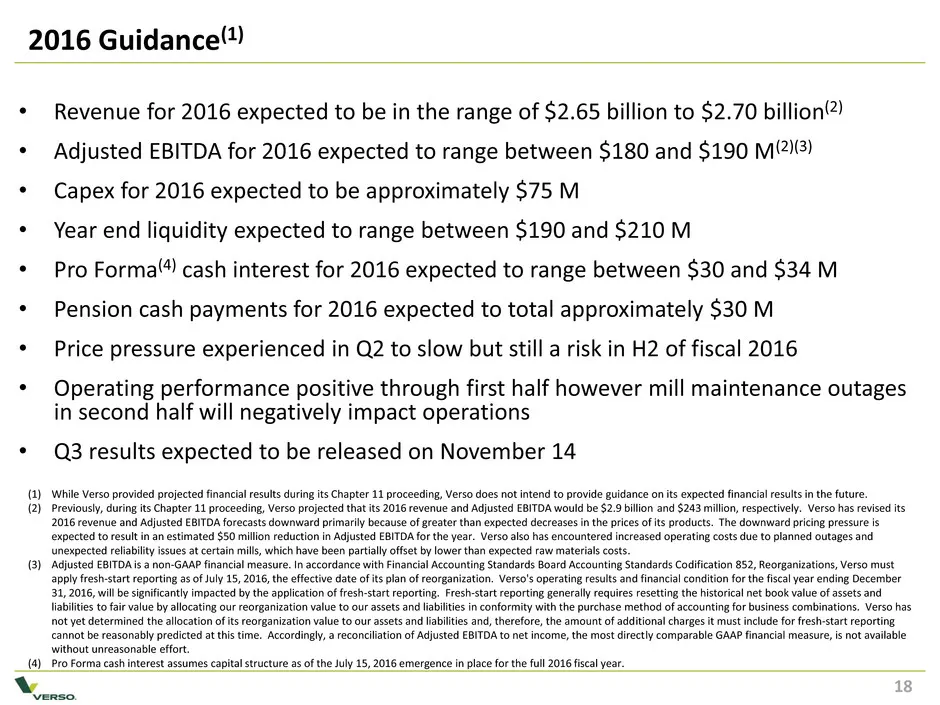
CONFIDENTIAL INTERNAL USE ONLY 2016 Guidance(1) • Revenue for 2016 expected to be in the range of $2.65 billion to $2.70 billion(2) • Adjusted EBITDA for 2016 expected to range between $180 and $190 M(2)(3) • Capex for 2016 expected to be approximately $75 M • Year end liquidity expected to range be
Slide 20: Recent Financial Performance
CONFIDENTIAL INTERNAL USE ONLY Recent Financial Performance
Slide 21: Summary Historical and YTD Financials
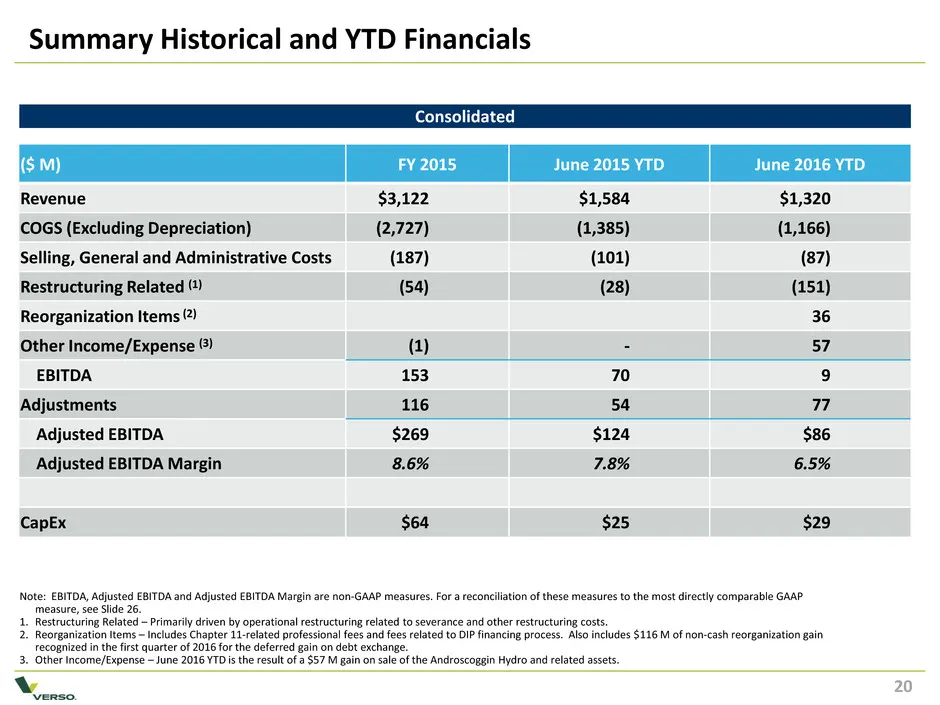
CONFIDENTIAL INTERNAL USE ONLY Summary Historical and YTD Financials 20 Note: EBITDA, Adjusted EBITDA and Adjusted EBITDA Margin are non-GAAP measures. For a reconciliation of these measures to the most directly comparable GAAP measure, see Slide 26. 1. Restructuring Related – Primarily driven by op
Slide 22: 6 Months 2015 to 2016 Adjusted EBITDA Bridge
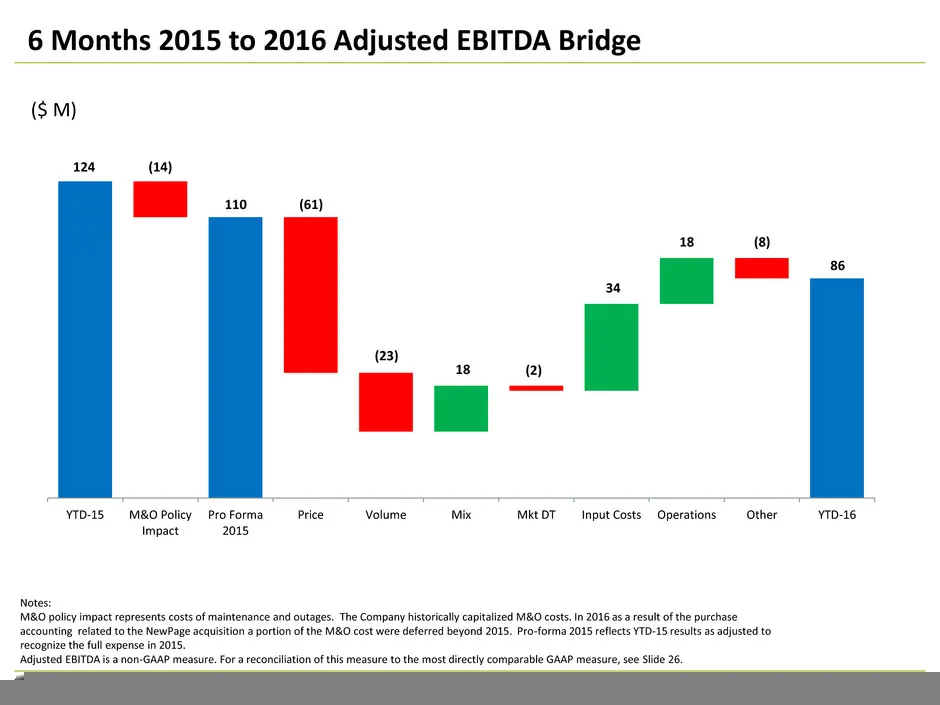
CONFIDENTIAL INTERNAL USE ONLY 21 21 ($ M) YTD-15 M&O Policy Impact Pro Forma 2015 Price Volume Mix Mkt DT Input Costs Operations Other YTD-16 124 (14) 18 (23) (61) 110 18 (2) 86 (8) 34 6 Months 2015 to 2016 Adjusted EBITDA Bridge Notes: M&O policy impact represents costs of maintenance and outages.
Slide 23: Pro Forma TTM Cash Flow at Q2 2016
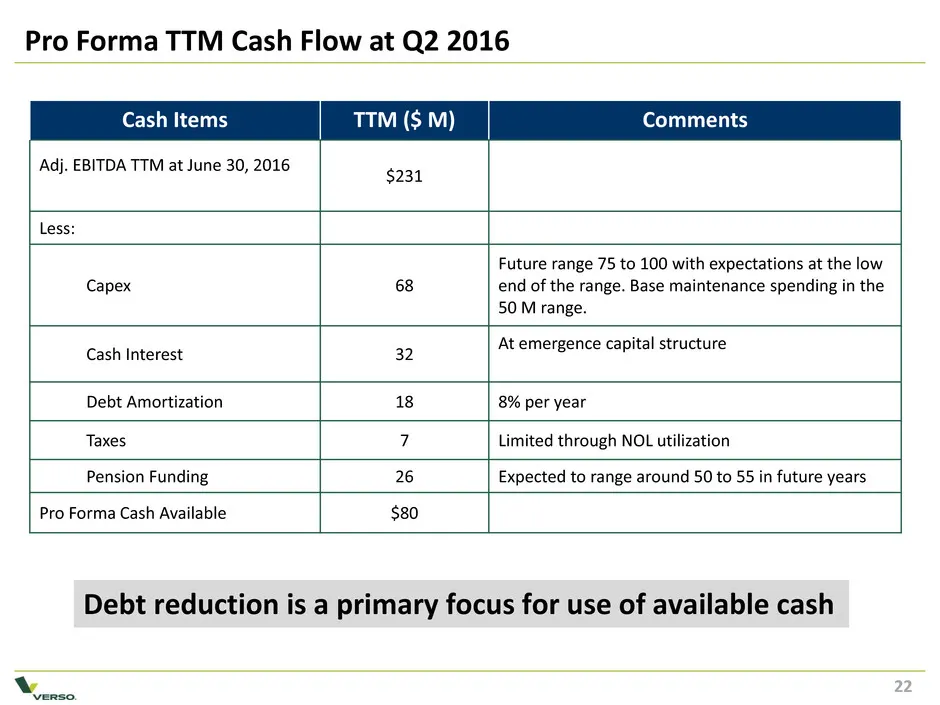
CONFIDENTIAL INTERNAL USE ONLY Pro Forma TTM Cash Flow at Q2 2016 Cash Items TTM ($ M) Comments Adj. EBITDA TTM at June 30, 2016 $231 Less: Capex 68 Future range 75 to 100 with expectations at the low end of the range. Base maintenance spending in the 50 M range. Cash Interest 32 At emergence capita
Slide 24: Financial Appendix
CONFIDENTIAL INTERNAL USE ONLY Financial Appendix
Slide 25: Significant Collateral Coverage – Term Loan Facility
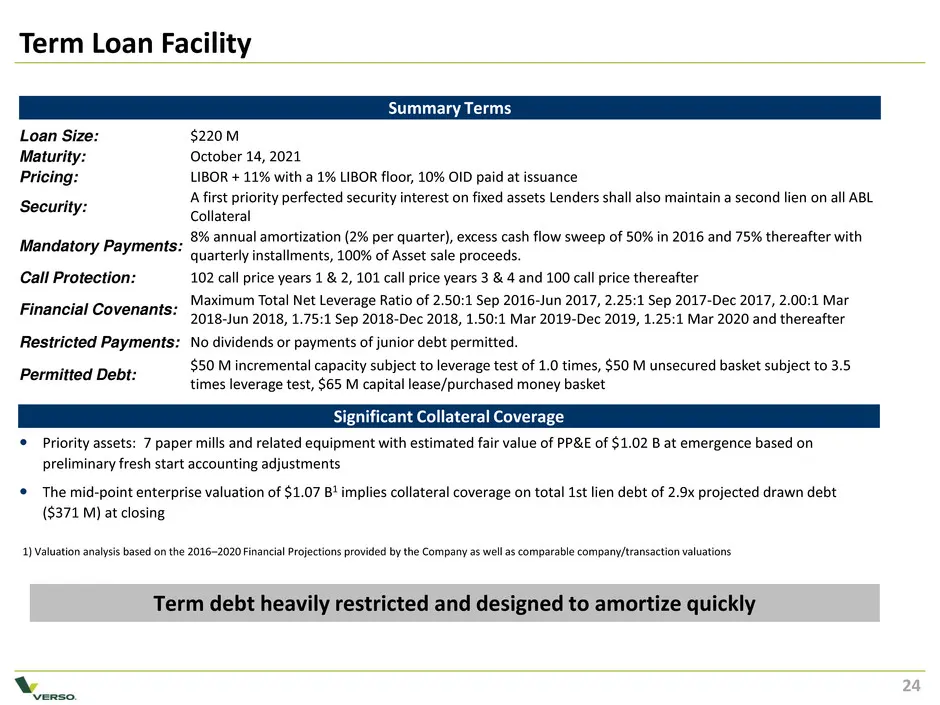
CONFIDENTIAL INTERNAL USE ONLY Significant Collateral Coverage Term Loan Facility Summary Terms Loan Size: $220 M Maturity: October 14, 2021 Pricing: LIBOR + 11% with a 1% LIBOR floor, 10% OID paid at issuance Security: A first priority perfected security interest on fixed assets Lenders shall also
Slide 26: Significant Collateral Coverage – Asset Backed Loan (Revolver)
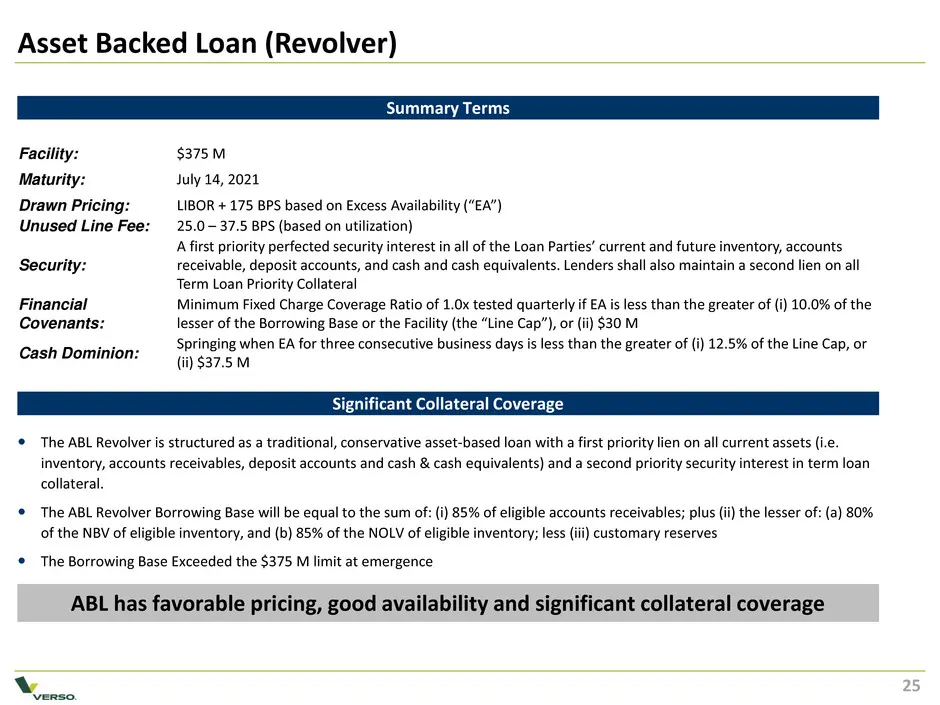
CONFIDENTIAL INTERNAL USE ONLY Significant Collateral Coverage Asset Backed Loan (Revolver) Summary Terms Facility: $375 M Maturity: July 14, 2021 Drawn Pricing: LIBOR + 175 BPS based on Excess Availability (“EA”) Unused Line Fee: 25.0 – 37.5 BPS (based on utilization) Security: A first priority per
Slide 27: Consolidated Net Loss to Adj. EBITDA Reconciliation
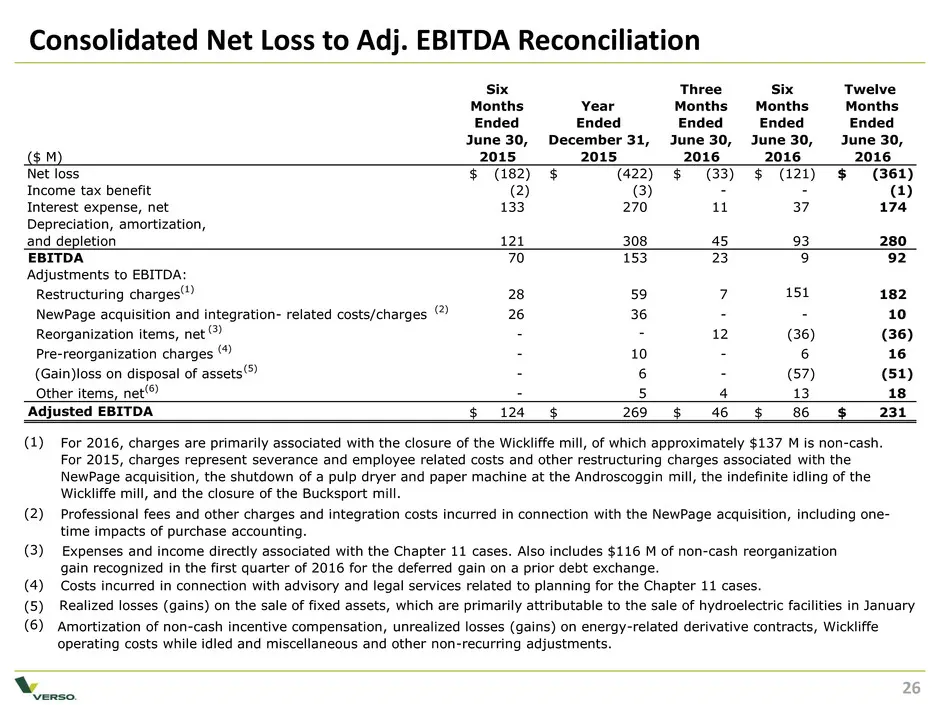
CONFIDENTIAL INTERNAL USE ONLY Consolidated Net Loss to Adj. EBITDA Reconciliation 26 Six Three Six Twelve Months Year Months Months Months Ended Ended Ended Ended Ended June 30, December 31, June 30, June 30, June 30, ($ M) 2015 2015 2016 2016 2016 Net loss (182) $ (422) $ (33) $ (121) $ (361) $ In
Slide 28: Pension and OPEB Obligations
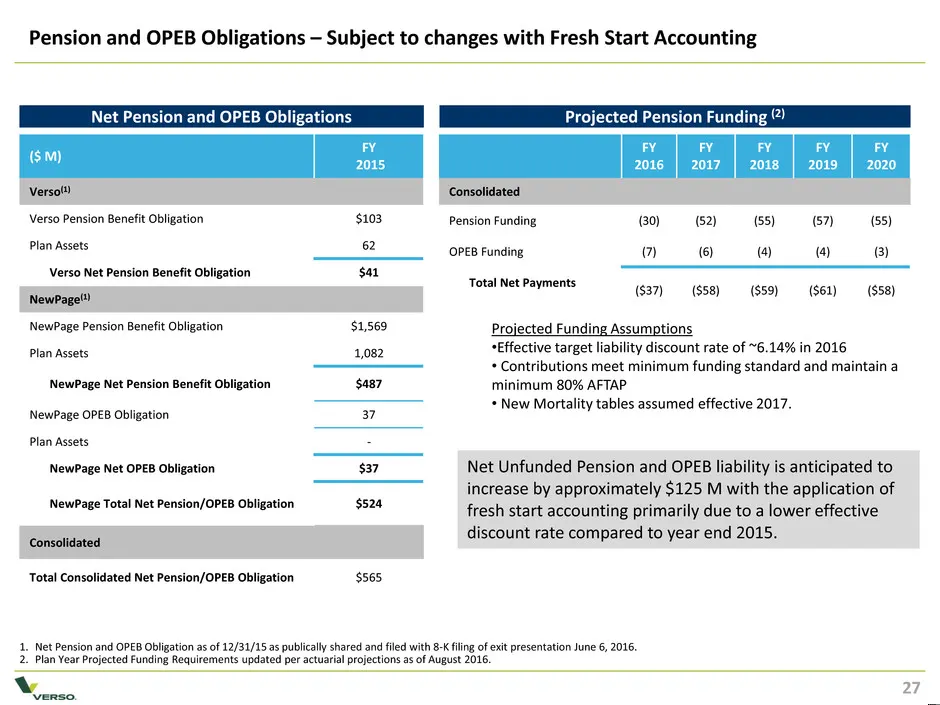
CONFIDENTIAL INTERNAL USE ONLY Pension and OPEB Obligations – Subject to changes with Fresh Start Accounting 1. Net Pension and OPEB Obligation as of 12/31/15 as publically shared and filed with 8-K filing of exit presentation June 6, 2016. 2. Plan Year Projected Funding Requirements updated per act
Source: SEC EDGAR · 8-K filed Sep 27, 2016
More decks from Verso Corporation
 Merger or Acquisition (December 2021)21 slides · Dec 22, 2021
 Merger or Acquisition (December 2021)14 slides · Dec 20, 2021
 Merger or Acquisition (December 2021)15 slides · Dec 20, 2021
 Q3 2020 Earnings Presentation26 slides · Nov 9, 2020
 Q2 2020 Earnings Presentation28 slides · Aug 6, 2020
 Q1 2020 Earnings Presentation22 slides · May 11, 2020