Communityone Bancorp — FNB — Southeast Super-Community Bank Conference 2006
48 slides from Communityone Bancorp's conference presentation, Feb 3, 2006

Slide 1: Southeast Super-Community Bank Conference
Southeast Super-Community Bank Conference Atlanta, GA February 6-7, 2006 Yes You Can ® Exhibit 99.1

Slide 2: Forward-Looking Statements
Forward-Looking Statements FNB Corp. has made forward-looking statements in the accompanying presentation materials that are subject to risks and uncertainties. These statements are based on the beliefs and assumptions of the management of FNB Corp., and on the information available to management at

Slide 3: Overview
Overview Yes You Can ®

Slide 4: Overview Company Facts
Overview Company Facts •Annual Cash Dividend –Market Cap (est. Dec.30, 2005) –Shares Outstanding –Assets •Numbers** •Symbol •Listing •Headquarters $0.60 $121.0 Million $121.0 Million $1.102 Billion FNBN NASDAQ NM Asheboro, NC **Unaudited, not including announced Integrity merger Franchise Value
Slide 5: Corporate Structure
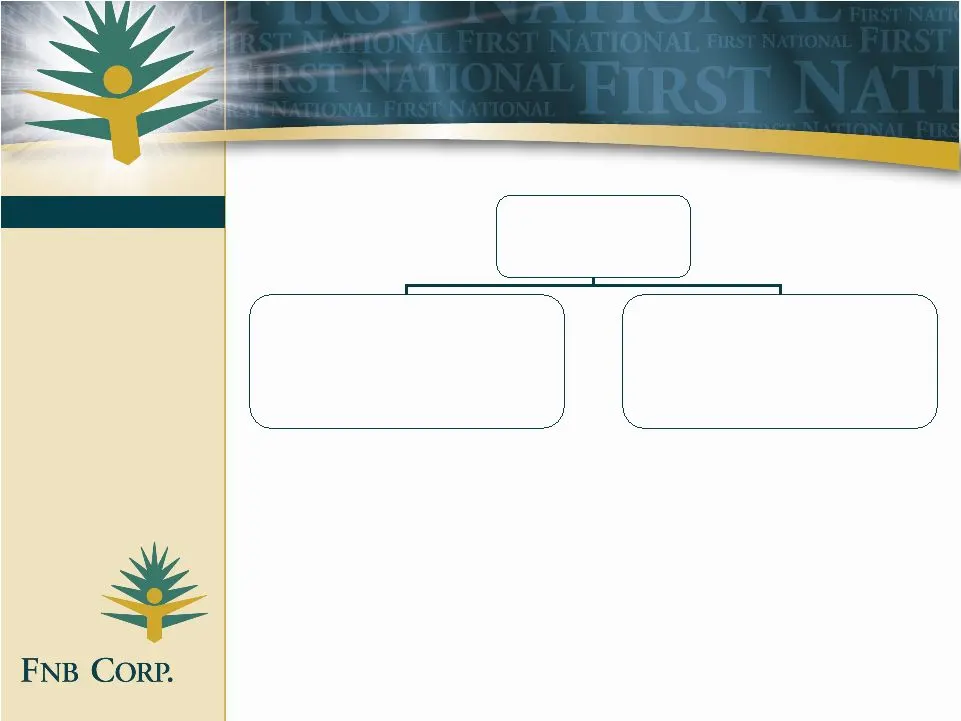
Overview Corporate Structure Franchise Value FNB Corp. (NC) Founded May 1985 First National Bank and Trust Company * Founded December 1907 Dover Mortgage Company Founded May 1986 Acquired by FNB April 2003 *Acquisitions: Richmond Savings Bank – April 2000 Rowan Bank – August 2002 United Financial (A
Slide 6: Service Areas
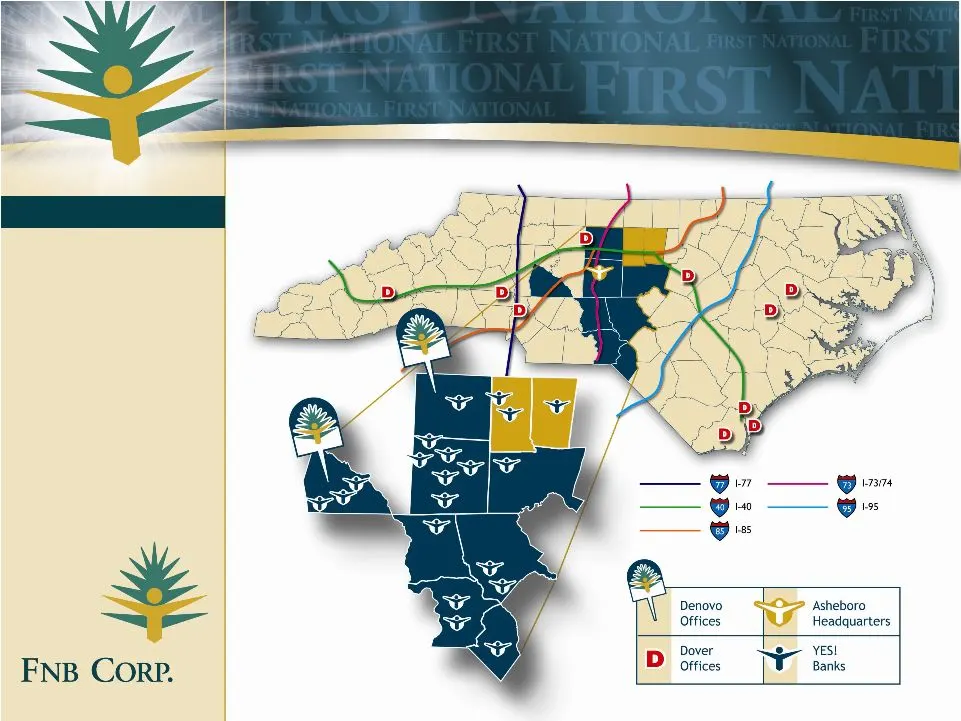
Service Areas Overview Franchise Value
Slide 7: Major Loan Classifications
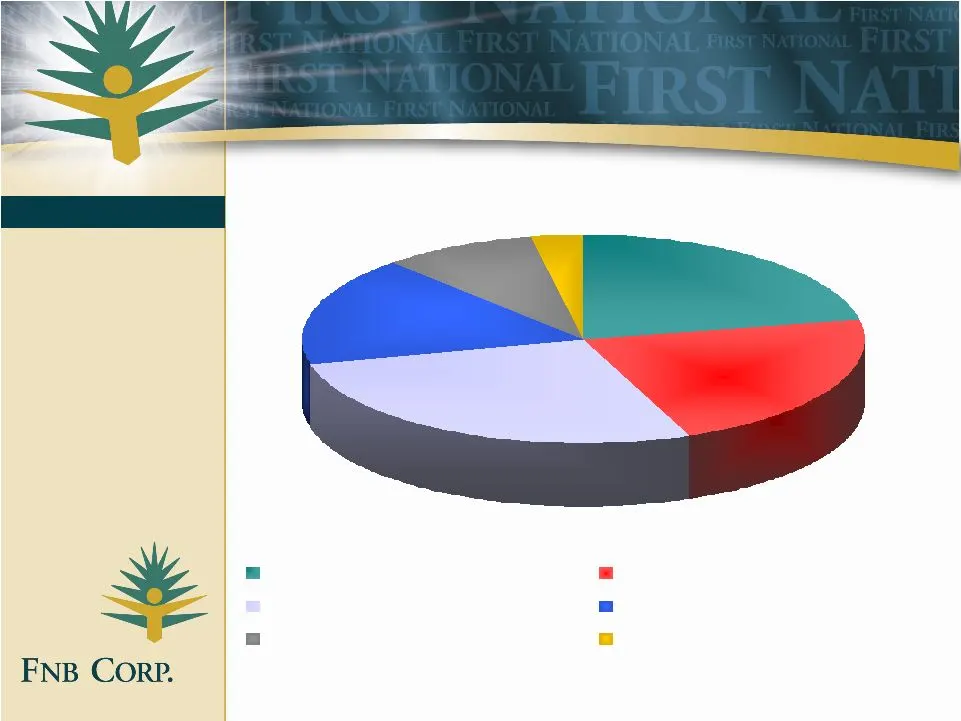
Major Loan Classifications Overview Franchise Value 9% 3% 17% 22% 27% 22% Commercial/Industrial Residential Real Estate Commercial Real Estate RE Construction and Development Home Equity Line Consumer
Slide 8: Major Funding Classifications
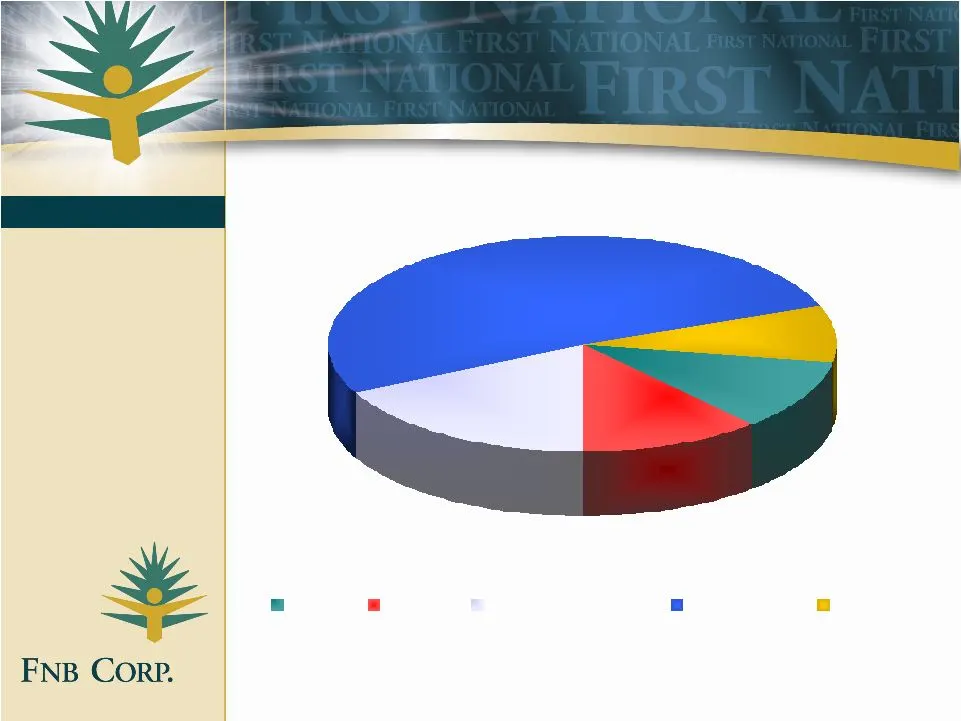
Major Funding Classifications Overview 9% 51% 12% 17% 11% DDA NOW MM,SAV,Repo CD / IRA FHLB Franchise Value

Slide 9: Competitive Advantages
Competitive Advantages Overview • Only community bank in North Carolina with local, full-service Wealth Management team. • Our business bankers have an average of 25 years of experience each. • We make mortgage loan decisions in less than 24 hours through our “First Reply” program. • Practice, pract

Slide 10: Operating Performance Yes We Can
Operating Performance Yes We Can ®
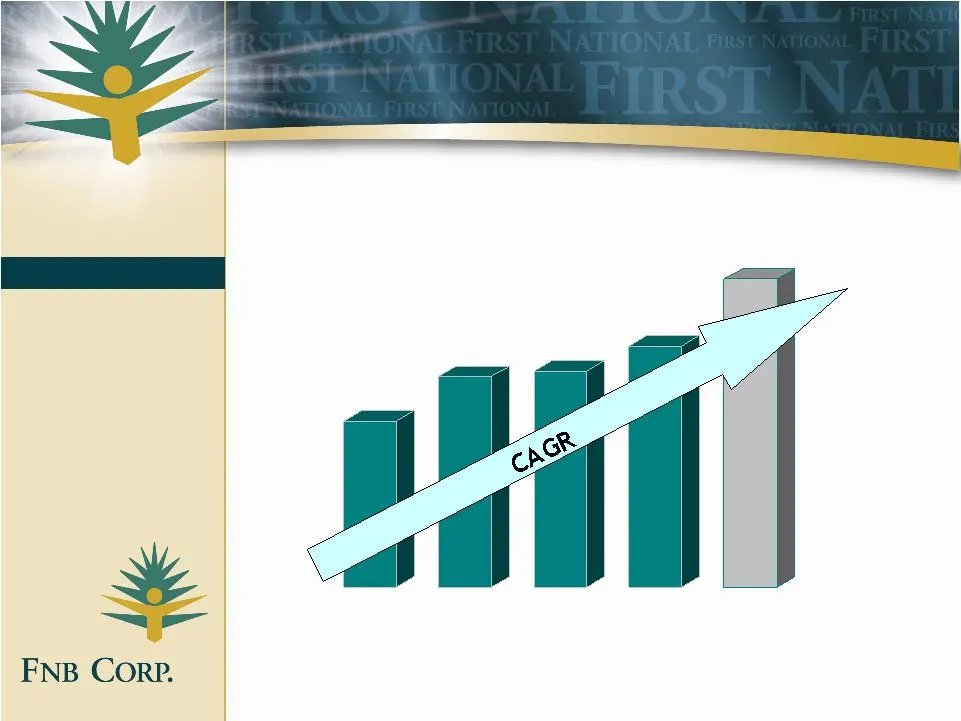
Slide 11: Asset Growth
Asset Growth Operating Performance 1102 2001 2002 2003 2004 2005 (Millions) 16.76% unaudited Franchise Value
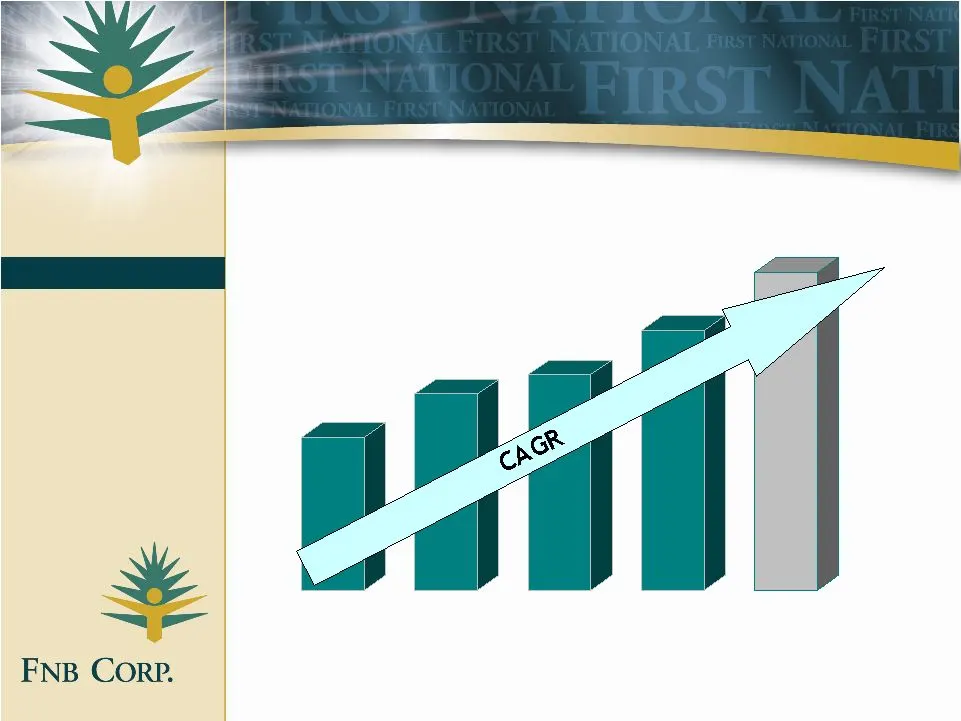
Slide 12: Loan Growth
Loan Growth Operating Performance 2001 2002 2003 2004 2005 20.01% unaudited Franchise Value (Millions)
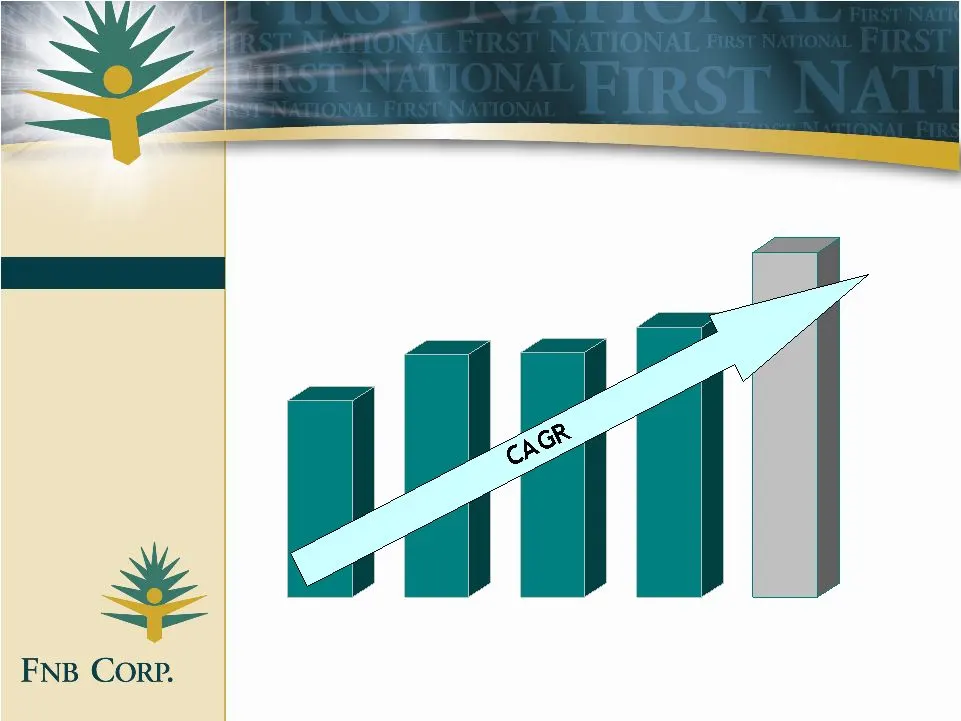
Slide 13: Deposit Growth
Operating Performance Deposit Growth Franchise Value 2001 2002 2003 2004 2005 15.08% (Millions) unaudited
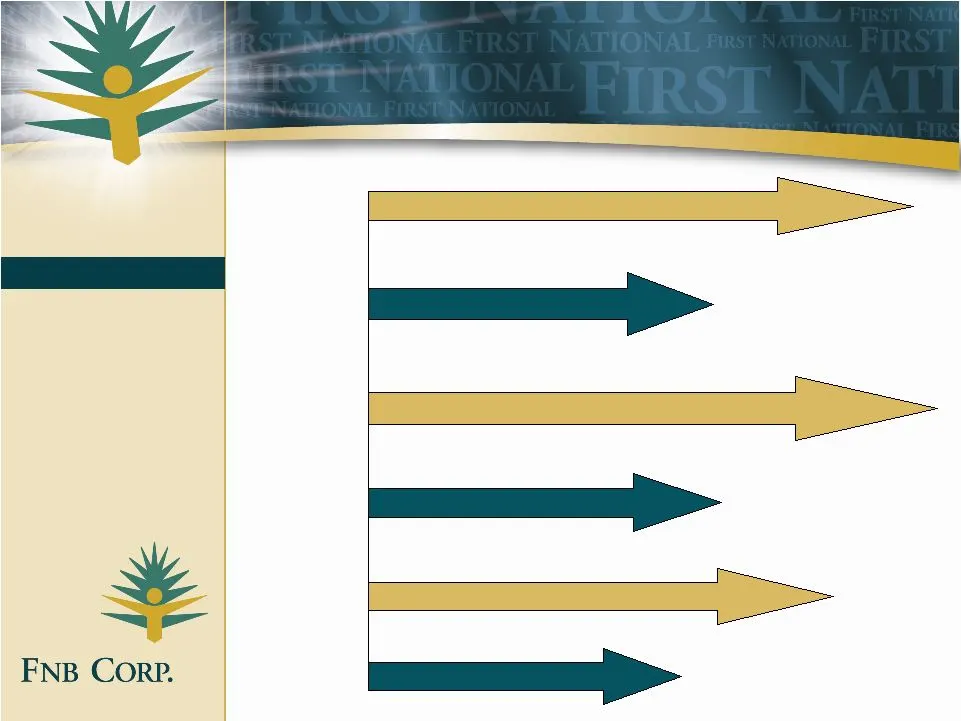
Slide 14: Household Growth
Operating Performance 12-01 to 12-06 Household Growth Franchise Value 111% Deposit Households 112% Total Households 63.7% Core Households ( without acquisitions) 64% Core Households 76.6% Loan Households 48% Core Households
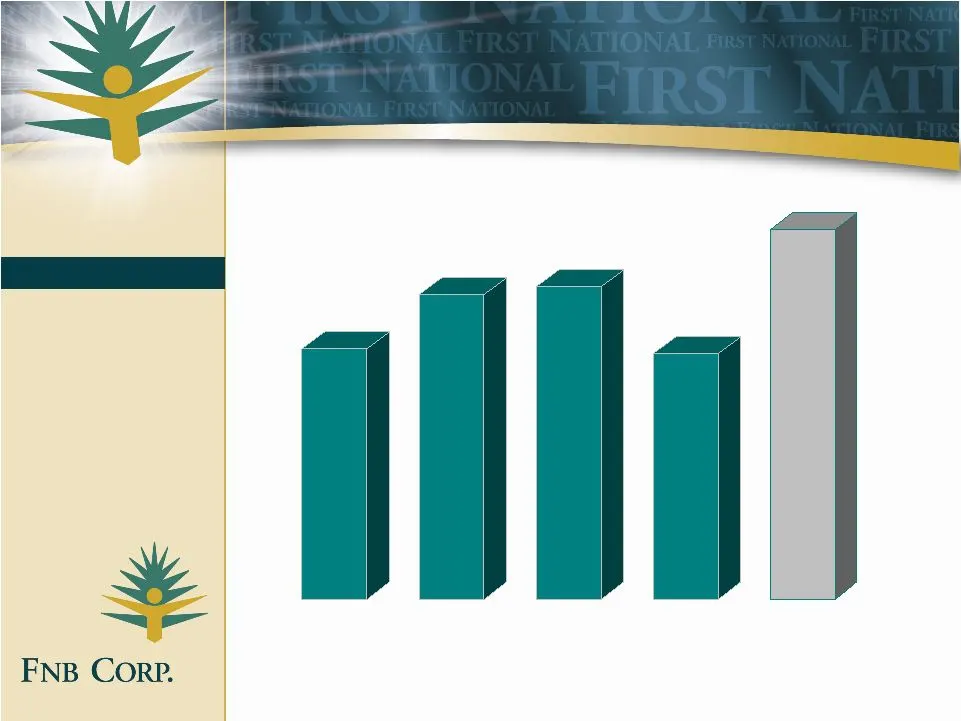
Slide 15: Net Income
Operating Performance Net Income Franchise Value 6,728 8,200 8,400 6,598 9,937 2001 2002 2003 2004 2005 unaudited
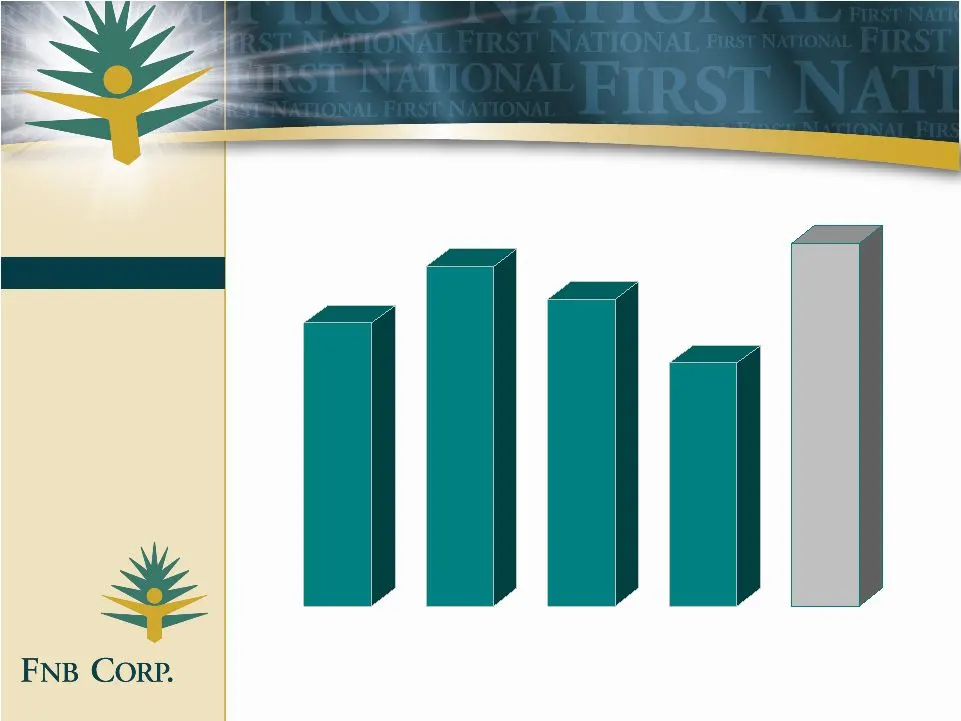
Slide 16: Earnings Per Share
Operating Performance Earnings Per Share Franchise Value 1.32 1.58 1.43 1.13 1.69 2001 2002 2003 2004 2005 unaudited
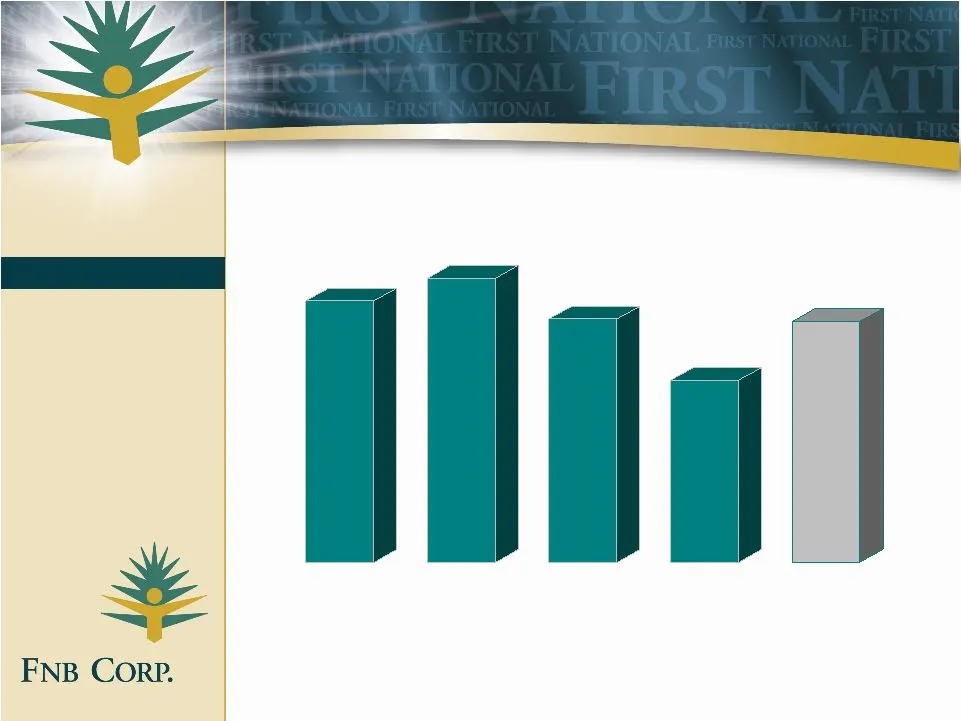
Slide 17: Return On Assets
Operating Performance Return On Assets Franchise Value 1.15% 1.25% 1.07% 0.80% 1.06% 2001 2002 2003 2004 2005 unaudited
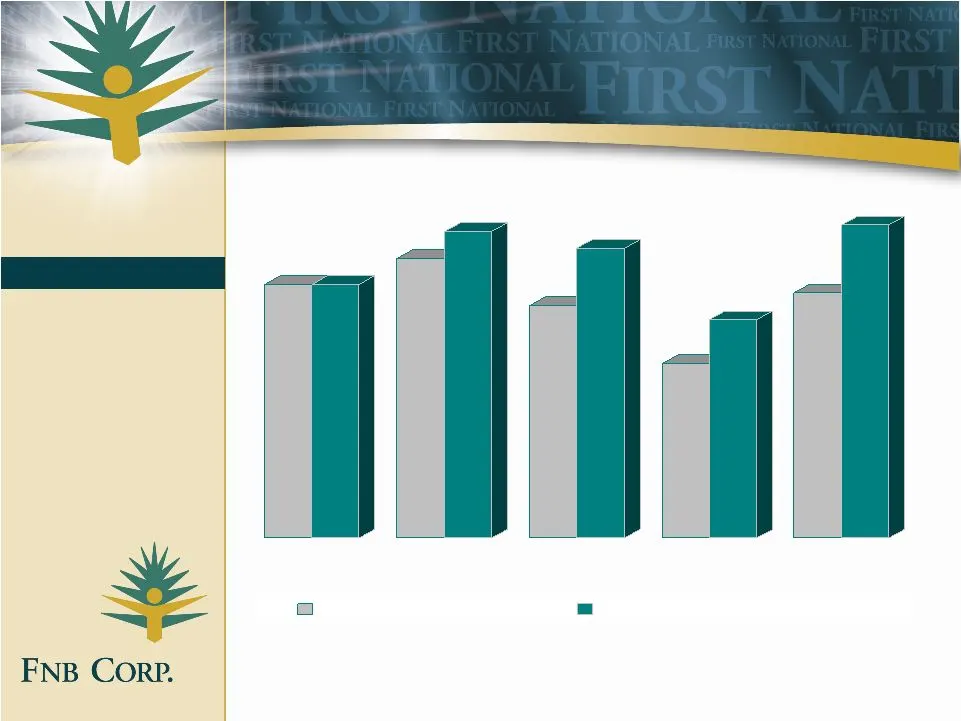
Slide 18: Returns On Equity
Operating Performance Returns On Equity Franchise Value 11.63% 11.63% 12.82% 14.05% 10.66% 13.29% 8.00% 10.00% 11.25% 14.36% 2001 2002 2003 2004 2005 Return on Equity Return on Tangible Equity unaudited

Slide 19: Credit Quality Measures
Credit Quality Measures 0.22% 0.47% 0.33% 0.26% 0.28% Net Charge Offs/Average Loans 164.49% 139.53% 102.99% 98.34% 92.93% Loan Loss Reserve/Nonperforming Loans 1.25% 1.12% 1.14% 1.22% 1.17% Loan Loss Reserve/Total Loans Held for Investment 0.76% 0.80% 1.10% 1.24% 1.25% Nonperforming Loans/ Total Loa

Slide 20: Franchise Value Yes We Can
Franchise Value Yes We Can ®

Slide 21: Franchise Value Strong Points
Franchise Value Strong Points Consistent Financial Performance Long Term Focus Growth Orientation Good Markets / Good State De Novo Offices Selective Prudent Acquisitions Productive lines of business “YES!” Branding Program
Slide 22: Dividend History
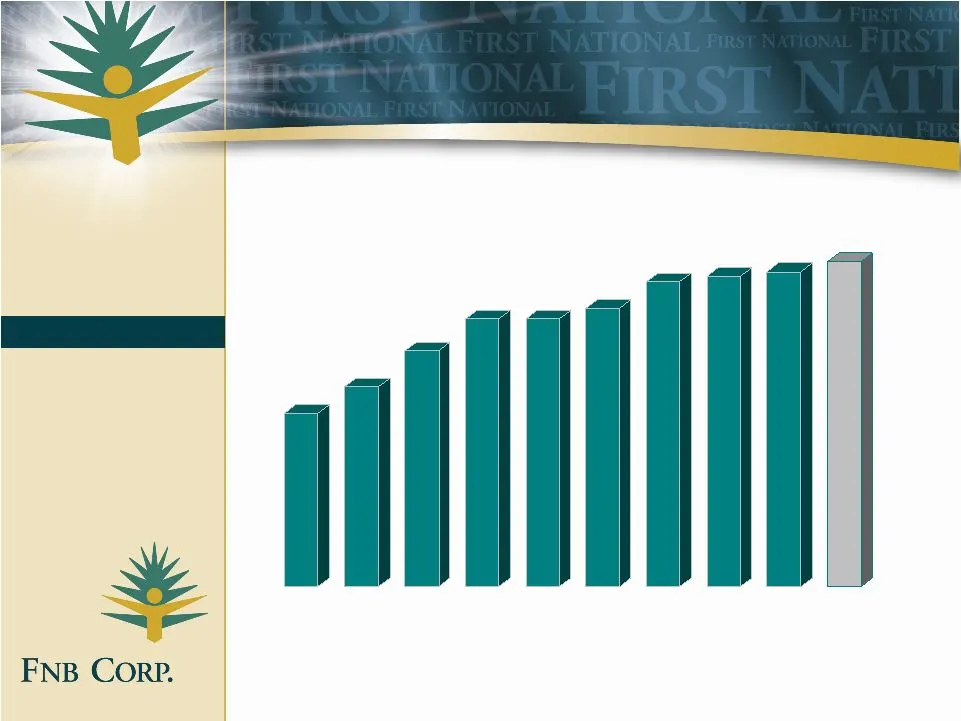
Dividend History Franchise Value 0.33 0.38 0.45 0.51 0.51 0.53 0.58 0.59 0.60 0.62

Slide 23: Growth - Integrity Financial, Inc.
Franchise Growth Franchise Value Growth - Integrity Financial, Inc. • A $666 Million Company headquartered in Hickory, NC – deal pending • Operating subsidiaries: – First Gaston Bank, including Catawba Valley Bank and Northwestern Bank Divisions – Integrity Securities, Inc. a full service brokerage

Slide 24: Pro-forma Combined Company
Franchise Growth Franchise Value • Asset: $1.8 Billion • Loans: $1.3 Billion • Deposits: $1.4 Billion • Market Cap: $200 Million+ • Top 6 in North Carolina – HQ Banks in Assets and Deposits New Corp Name: FNB UNITED CORP. Pro-forma Combined Company Franchise

Slide 25: Pro-forma Footprint
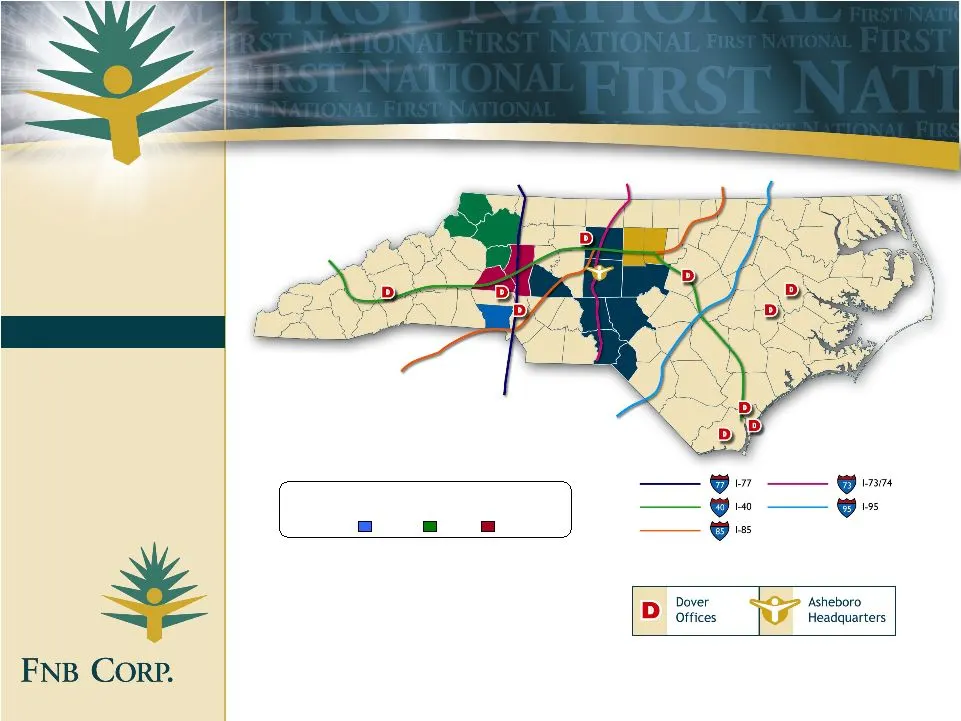
Franchise Growth Franchise Value • Pro-forma Foot Print - From Central and Southern Piedmont and The Sandhills to The Foothills and Mountains of Western NC • 43 Banking Offices In 31 Communities In 17 Growing Counties • Strategically Located Along Interstates Corridors Of I-85, I-40, I-77, I-73/74 A
Slide 26: Integrity Financial Markets
Franchise Growth Franchise Value Integrity Financial Markets
Slide 27: Population Growth – County Projections
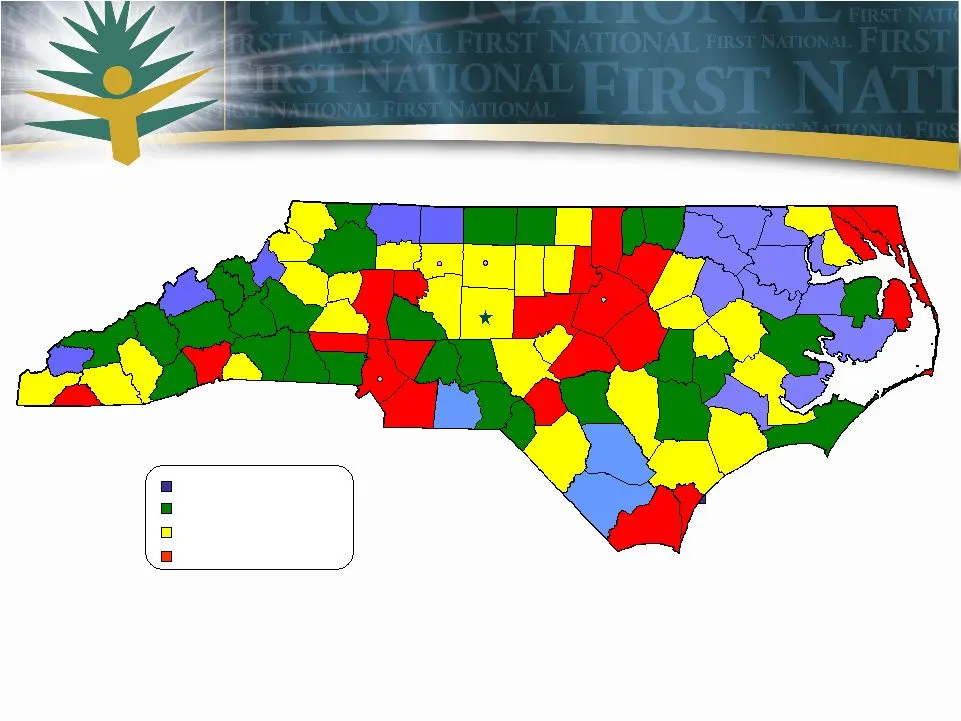
Population Growth – County Projections Branch and demographic data per SNL Financial, MapInfo Professional; data represents projected population growth between 2005 – 2010 Negative Projected Growth 0-3% Projected Growth 3-8% Projected Growth 8+% Projected Growth Winston Salem Raleigh Charlotte Green

Slide 28: Growth - Integrity Financial Deal Structure
Franchise Value Franchise Growth Growth - Integrity Financial, Inc. • Deal Structure – 78% Stock 22% Cash • Conditions Precedent Merge subsidiaries - done Address CVB M.O.U. Issues Credit Communication Bring forward 1.25% A.L.L.L.

Slide 29: Pro-forma Financial Comparison
Franchise Growth Franchise Value Goodwill/Equity Goodwill/Assets TangEquity/TangAssets Equity/Assets Total Capital Goodwill Deposits Assets FNB United Corp. (Proforma 9/30) FNB Corp. (unaudited 12/31/05) 58.51% 31.97% 6.36% 2.97% 4.82% 6.51% 10.88% 9.28% 198,072 102,315 115,893 32,707 1,375,789 841,

Slide 30: Positives of Integrity Acquisition
Franchise Growth Franchise Value Positives of Integrity Acquisition • FNB - Proven Acquirer and Integrator • Partner Bring Attractive Customer Base And Markets With Good Demographics • Merger Adds Scale And Brings New Product And Service Opportunities In Broad, Growing Markets

Slide 31: Franchise Growth Benefits
Franchise Value Franchise Growth • Enhances Shareholder Value Through Increased Earnings and Growth Opportunities • IT and Platform Systems Compatibility • Franchise Will Accommodate Future Acquisitions Following Integration
Slide 32: Fee Business
Franchise Value Fee Business Not FDIC Insured - May Lose Value - Not Bank Guaranteed – Not Deposit Accounts Investment Management Life and Long Term Care Insurance Trust and Estate Planning Retirement Planning Wealth Management Wealth Management Retail and Wholesale New Growth Markets Expanded Sales

Slide 33: Growth in Non Interest Income
Growth in Non Interest Income Franchise Value 4,684 4,032 4,890 1,631 Gain on Sale of Mortgages 1,293 1,535 1,414 Wealth Management 6,062 5,419 4,949 3,740 2,537 Service/Activity Fees 14,926 13,673 13,600 8,268 5,900 Total Non Interest Income 2005 2004 2003 2002 2001

Slide 34: YES! Branding
YES! Branding Franchise Value First National is the YES! Bank. It is plainly stated in our Yes you can ® —Yes we can ® trademarks. It is reflected in the design of our logo and corporate mascot, Jack. And it is repeated in our customer service programs, company spirit campaigns and marketing message

Slide 35: Core Strategies
Core Strategies Yes You Can ® Yes We Can ®

Slide 36: Core Strategies
Core Strategies Core Strategies Franchise Value • Credit Quality • Core Deposit Emphasis • Continue to Build Performance/Service Culture • Growth Strategy • Increased Penetration of Current Markets • Complete Integration of Acquisitions • “Experience” Retail • “Yes” ® Branding – Yes You Can ® Yes We

Slide 37: Core Deposit Emphasis
Core Strategies Core Deposit Emphasis • Checking Promotions – over 14,000 New Accounts • Business DDAs • Cash Management – REPO Sweeps • Non-Profit and Governmental • Targeted Certificates of Deposit Franchise Value

Slide 38: Performance Culture
Performance Culture Core Strategies Performance Compensation for STAKEHOLDERS™ • Maximize Long-term Value Of Organization • Team Orientation - Universal Participation • Coaching And Communication • Educational Program Franchise Value Opportunity
Slide 39: Fun and Friendly Yes! Bank
Core Strategies Fun and Friendly Yes! Bank Franchise Value Investor Opportunity
Slide 40: Fun and Friendly Yes! Bank
Core Strategies Fun and Friendly Yes! Bank Franchise Value Investor Opportunity
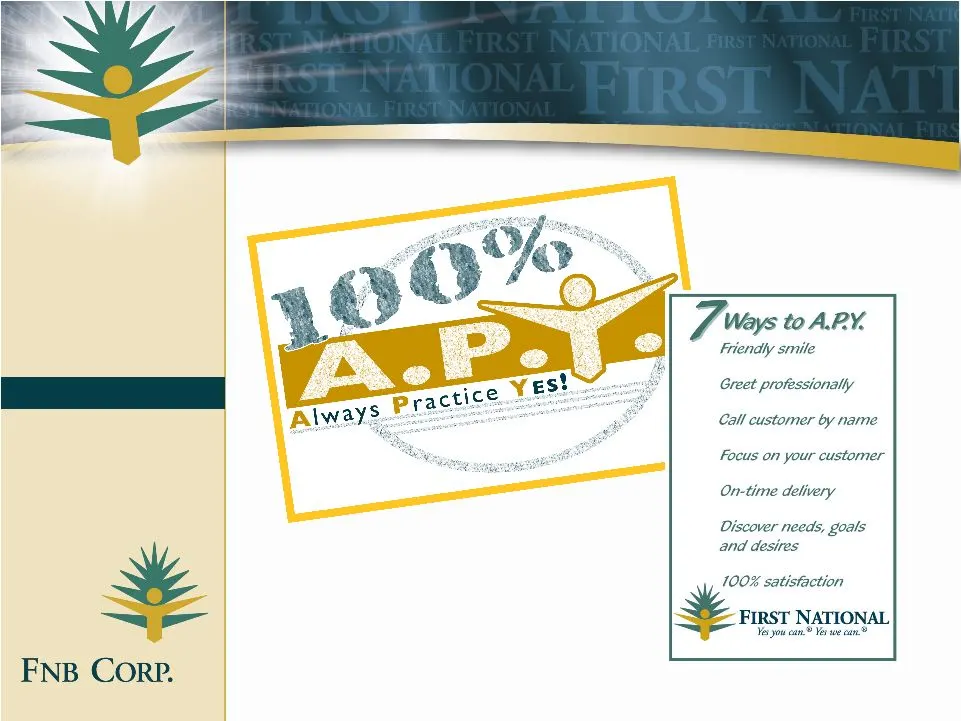
Slide 41: Customer Service + Brand
Customer Service + Brand Core Strategies Franchise Value
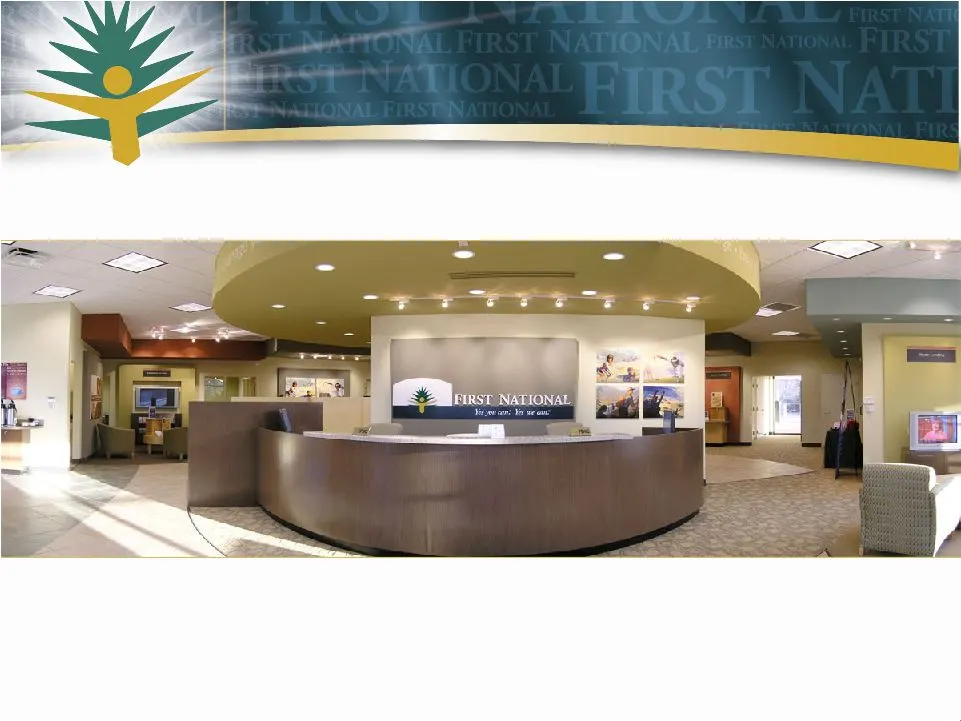
Slide 42: “Experience” Retail
“Experience” Retail
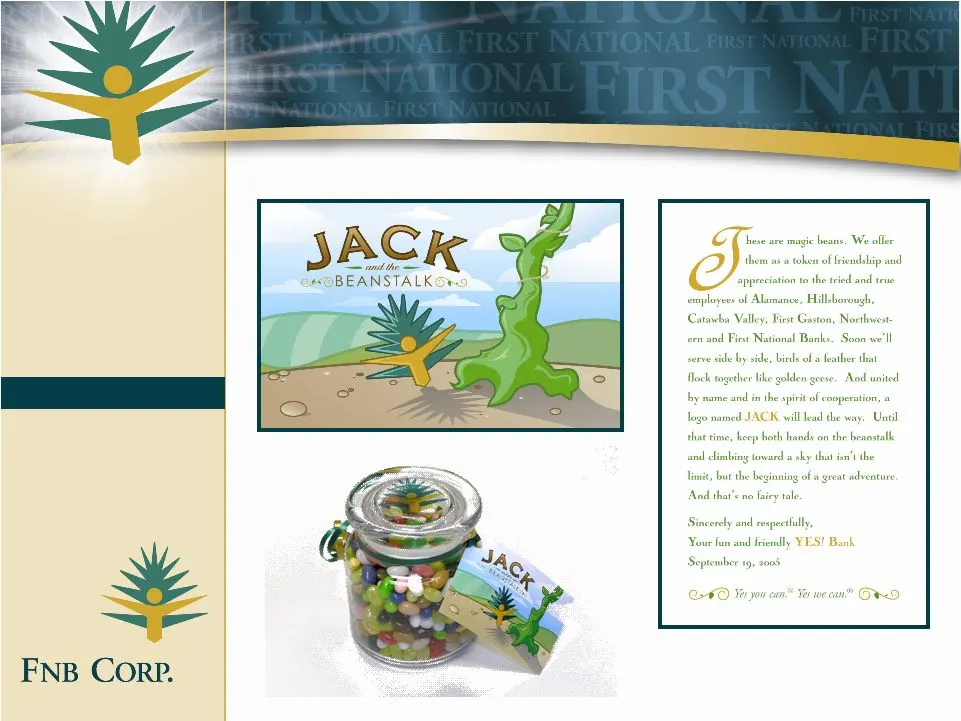
Slide 43: Performance: Team Focus
Core Strategies Performance: Team Focus Franchise Value

Slide 44: Investor Opportunity
Investor Opportunity Yes You Can ® Yes We Can ®

Slide 45: Investor Opportunity
Investor Opportunity Investor Opportunity Franchise Value • Good Markets / Good State • Possess Components Required for Sustainable, Profitable Growth • Good Franchise Elements • Current Market Valuation
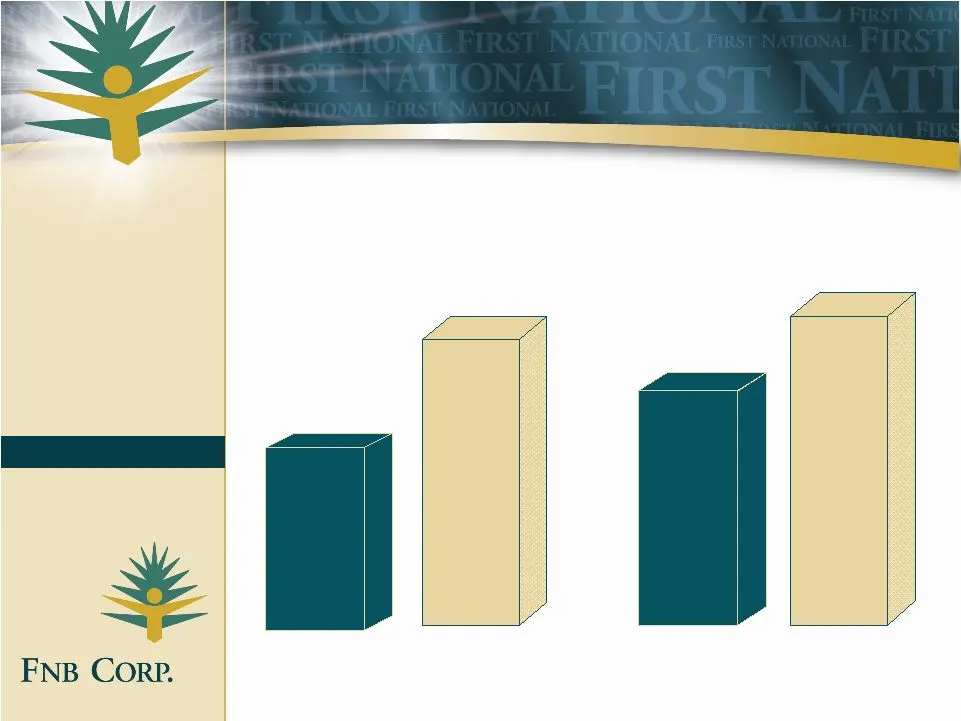
Slide 46: Price / Book vs Peer Group
Investor Opportunity Investor Opportunity 142.06 212.51 117.06 185.20 Price / Book (%) Price / Tangible Book (%) FNB Corp . FNB Corp. *SNL Data SE Publicly traded banks between $500 million and $2 billion as of 1/17/2006 Peer Group* Peer Group* Franchise Value
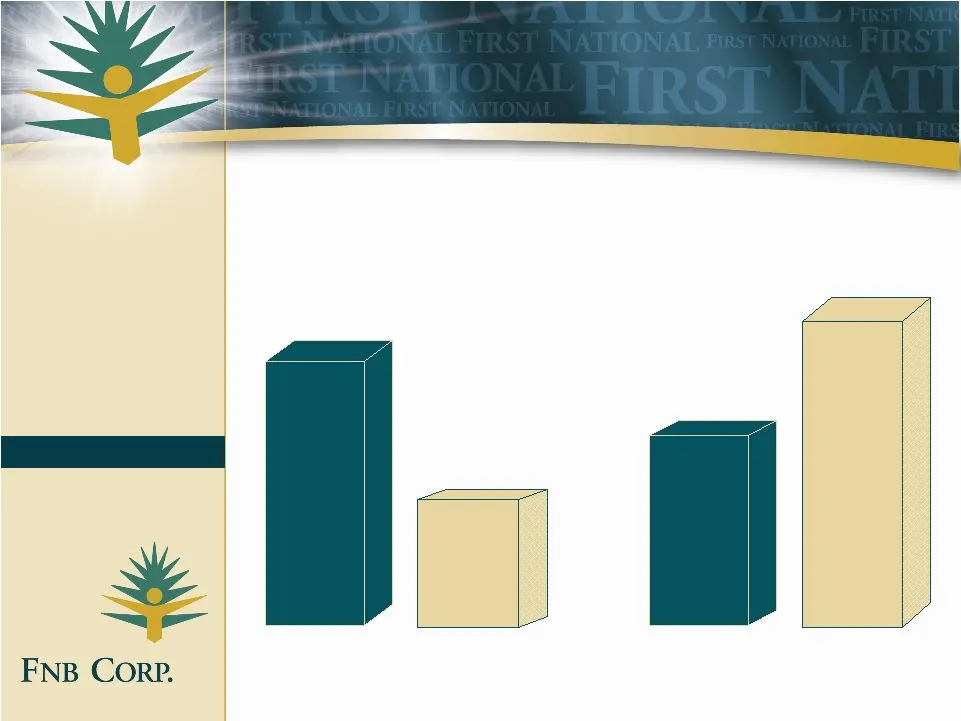
Slide 47: Dividend Yield and Price / Earnings vs Peers
Investor Opportunity Investor Opportunity 11.12 16.35 3.19 1.91 Current Dividend Yield (%) Price / LTM EPS (X) Franchise Value FNB Corp . FNB Corp. *SNL Data SE Publicly traded banks between $500 million and $2 billion as of 1/17/2006 Peer Group* Peer Group*

Slide 48: Contact Information
Contact Information Michael C. Miller Chairman and President [email protected] R. Larry Campbell Executive Vice President [email protected] FNB Corp. First National Bank and Trust Company 101 Sunset Avenue PO Box 1328 Asheboro, NC 27204 336.626.8300 Yes You Can ® Yes We Can ®
Source: SEC EDGAR · 8-K filed Feb 3, 2006
More decks from Communityone Bancorp
 Merger or Acquisition (February 2016)25 slides · Feb 8, 2016
 Q4 2015 Earnings Presentation22 slides · Jan 29, 2016
 Q3 2015 Earnings Presentation17 slides · Oct 30, 2015
 Q2 2015 Earnings Presentation17 slides · Jul 30, 2015
 Q1 2015 Earnings Presentation17 slides · Apr 30, 2015
 Investor Presentation (March 2015)18 slides · Mar 5, 2015