HCC Insurance — Q3 2012 Earnings Presentation
23 slides from HCC Insurance's earnings presentation, Nov 21, 2012
Slide 1: Third Quarter 2012 Investor Presentation
Third Quarter 2012 Investor Presentation November 21, 2012 HCC Insurance Holdings, Inc.
Slide 2: Notice About This Presentation
See Notice About This Presentation Notice About This Presentation ABOUT FORWARD-LOOKING STATEMENTS: This presentation contains certain “forward-looking statements” within the meaning of Section 27A of the Securities Act of 1933 and Section 21E of the Securities Exchange Act of 1934, which are intend
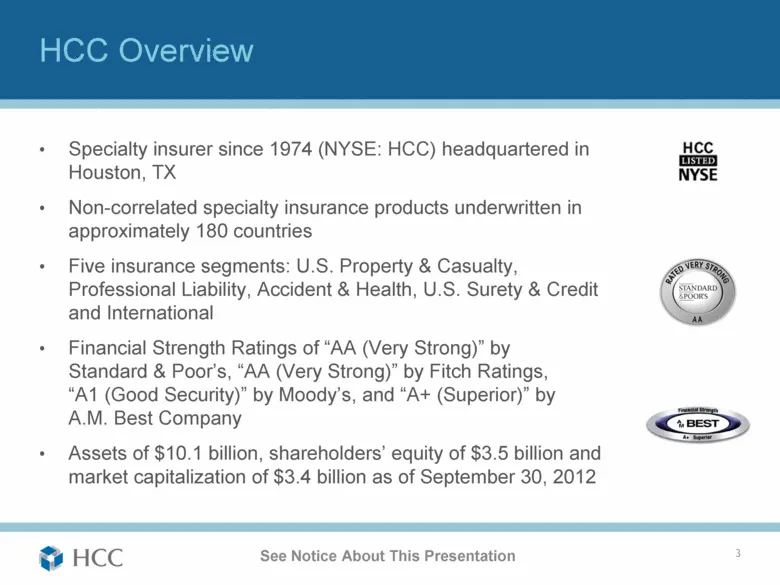
Slide 3: HCC Overview
See Notice About This Presentation HCC Overview Specialty insurer since 1974 (NYSE: HCC) headquartered in Houston, TX Non-correlated specialty insurance products underwritten in approximately 180 countries Five insurance segments: U.S. Property & Casualty, Professional Liability, Accident & Health,
Slide 4: Characteristics That Make HCC Unique
See Notice About This Presentation Characteristics That Make HCC Unique Specialty Insurance businesses with strong long-term fundamentals and market leadership Diversified underwriting portfolio with historically low correlation Consistent track record of growth and strong underwriting performance L
Slide 5: Operating Highlights Year to Date
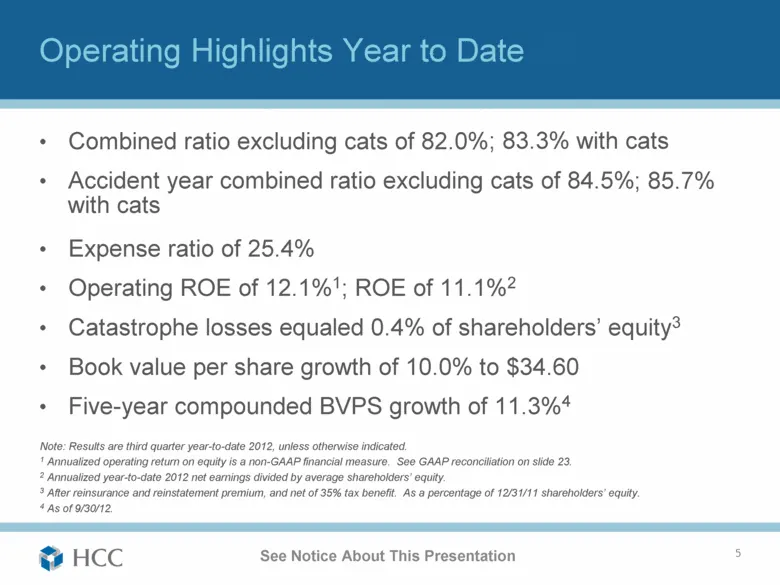
See Notice About This Presentation Operating Highlights Year to Date Combined ratio excluding cats of 82.0% Accident year combined ratio excluding cats of 84.5% Expense ratio of 25.4% Operating ROE of 12.1%1; ROE of 11.1%2 Catastrophe losses equaled 0.4% of shareholders’ equity3 Book value per share
Slide 6: Segment Overview
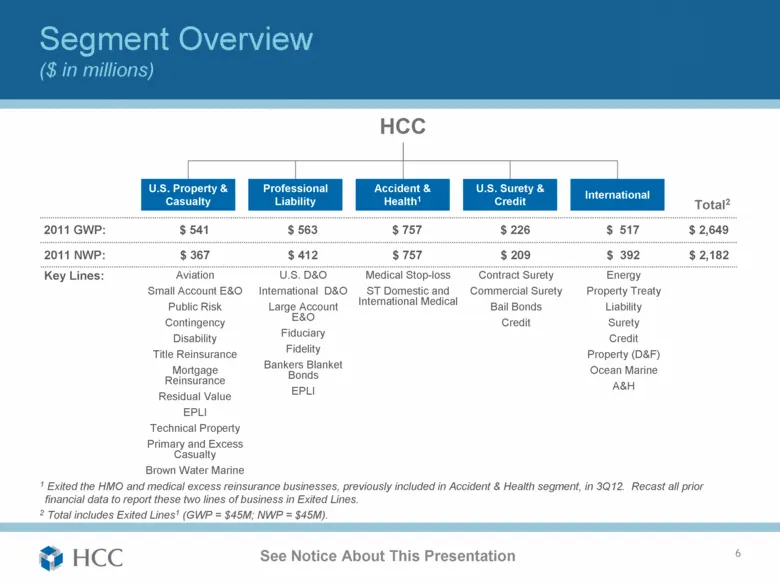
See Notice About This Presentation Segment Overview ($ in millions) 6 Total2 2011 GWP: $ 541 $ 563 $ 757 $ 226 $ 517 $ 2,649 HCC U.S. Property & Casualty Professional Liability U.S. Surety & Credit International Accident & Health1 2011 NWP: $ 367 $ 412 $ 757 $ 209 $ 392 $ 2,182 Key Lines: Aviation S
Slide 7: Segment Comparison YTD 3Q12
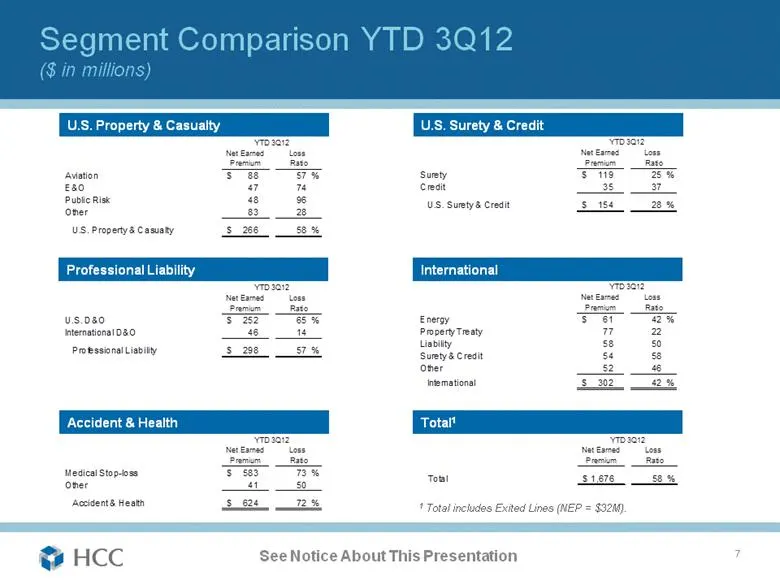
See Notice About This Presentation Segment Comparison YTD 3Q12 ($ in millions) 7 U.S. Property & Casualty Professional Liability Accident & Health U.S. Surety & Credit International Total1 1 Total includes Exited Lines (NEP = $32M). 46 Net Earned 42 $ 624 58
Slide 8: Segment Comparison 2011
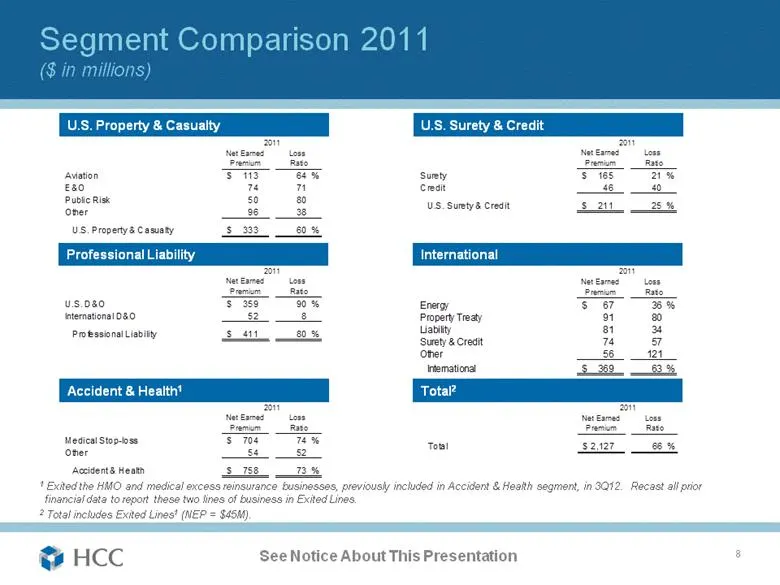
See Notice About This Presentation Segment Comparison 2011 ($ in millions) 8 U.S. Property & Casualty Professional Liability Accident & Health1 U.S. Surety & Credit International Total2 1 Exited the HMO and medical excess reinsurance businesses, previously included in Accident & Health segment, in 3
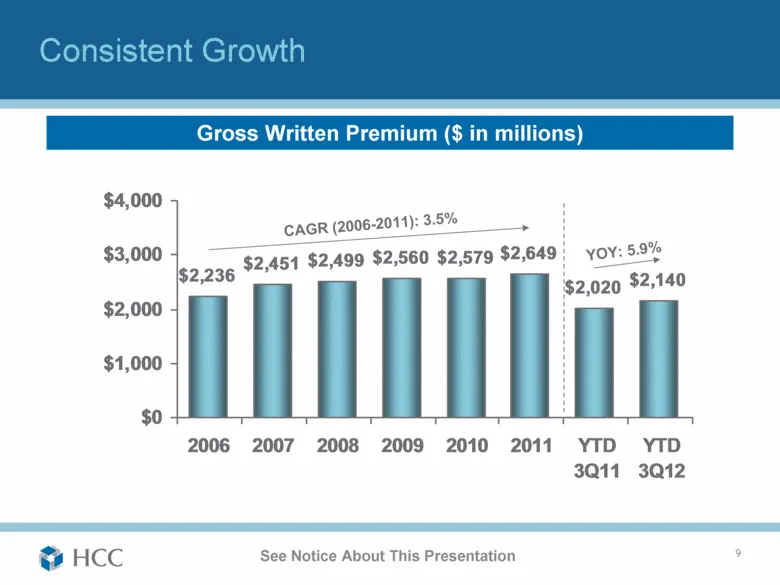
Slide 9: Consistent Growth: Gross Written Premium
See Notice About This Presentation Consistent Growth 10 CAGR (2006-2011): 3.5% Gross Written Premium ($ in millions) YOY: 5.9% $2,236 $2,451 $2,499 $2,560 $2,579 $2,649 $2,020 $2,140 $0 $1,000 $2,000 $3,000 $4,000 2006 2007 2008 2009 2010 2011 YTD 3Q11 YTD 3Q12
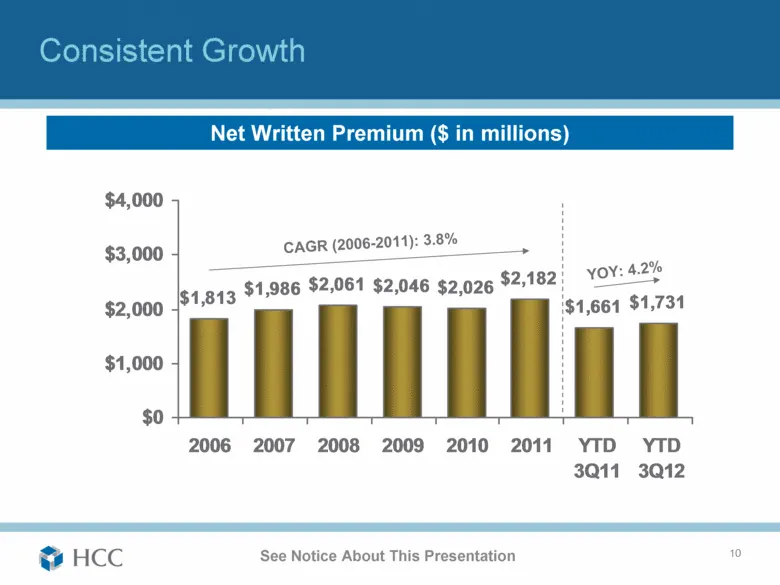
Slide 10: Consistent Growth: Net Written Premium
Consistent Growth 11 See Notice About This Presentation Net Written Premium ($ in millions) CAGR (2006-2011): 3.8% YOY: 4.2% $1,813 $1,986 $2,061 $2,046 $2,026 $2,182 $1,661 $1,731 $0 $1,000 $2,000 $3,000 $4,000 2006 2007 2008 2009 2010 2011 YTD 3Q11 YTD 3Q12
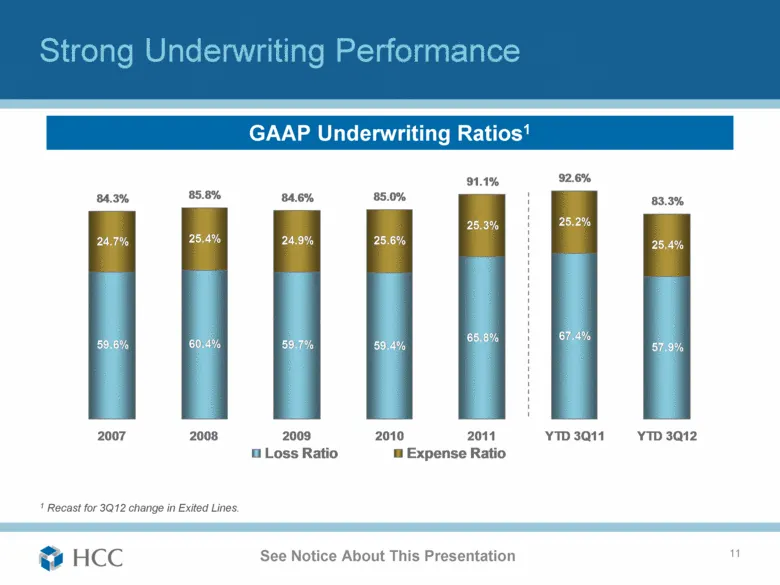
Slide 11: Strong Underwriting Performance
Strong Underwriting Performance 12 See Notice About This Presentation GAAP Underwriting Ratios1 1 Recast for 3Q12 change in Exited Lines. 59.6% 60.4% 59.7% 59.4% 65.8% 67.4% 24.7% 25.4% 24.9% 25.6% 25.3% 25.2% 84.3% 85.8% 84.6% 85.0% 91.1% 92.6% 83.3% 57.9% 25.4% 2007 2008 2009 2010 2011 YTD 3Q11 YT
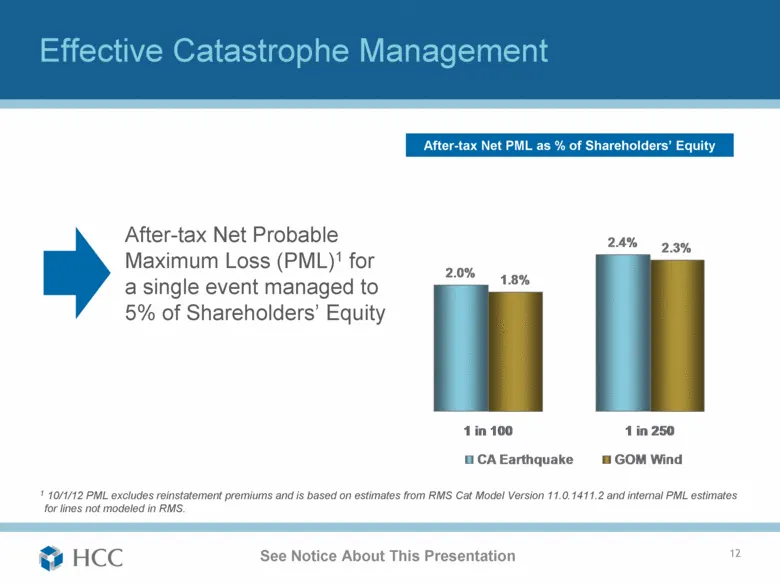
Slide 12: Effective Catastrophe Management
See Notice About This Presentation Effective Catastrophe Management 13 1 10/1/12 PML excludes reinstatement premiums and is based on estimates from RMS Cat Model Version 11.0.1411.2 and internal PML estimates for lines not modeled in RMS. After-tax Net Probable Maximum Loss (PML)1 for a single event
Slide 13: Catastrophe Exposure Management
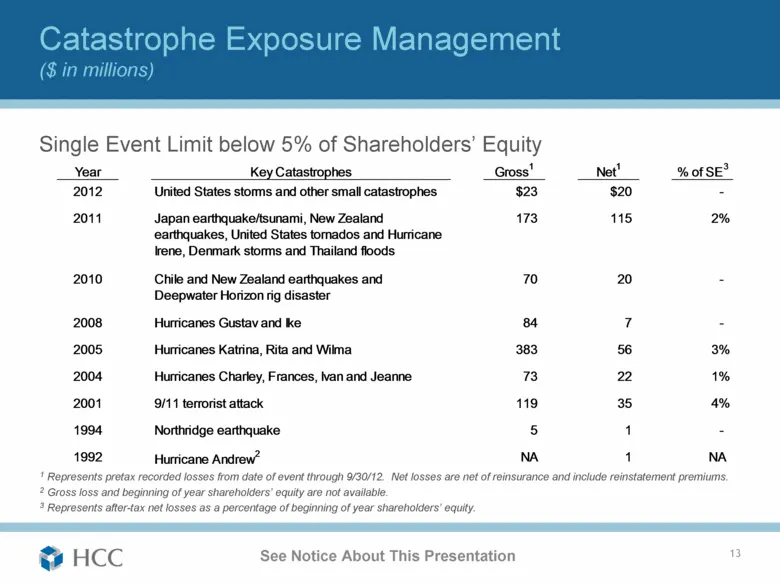
Single Event Limit below 5% of Shareholders’ Equity See Notice About This Presentation Catastrophe Exposure Management ($ in millions) 14 1 Represents pretax recorded losses from date of event through 9/30/12. Net losses are net of reinsurance and include reinstatement premiums. 2 Gross loss and beg
Slide 14: Investment Portfolio at September 30, 2012
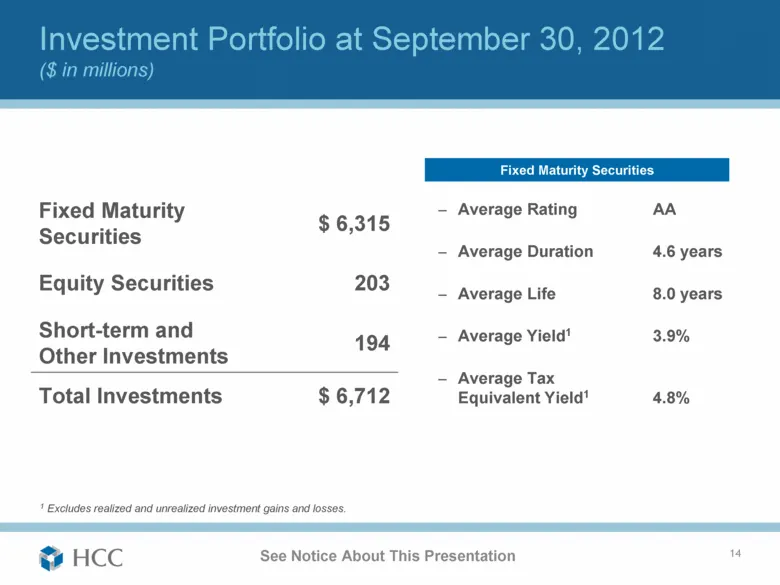
See Notice About This Presentation Investment Portfolio at September 30, 2012 ($ in millions) 15 1 Excludes realized and unrealized investment gains and losses. Average Rating AA Average Duration 4.6 years Average Life 8.0 years Average Yield1 3.9% Average Tax Equivalent Yield1 4.8% Fixed Maturity S
Slide 15: Investment Analysis at September 30, 2012
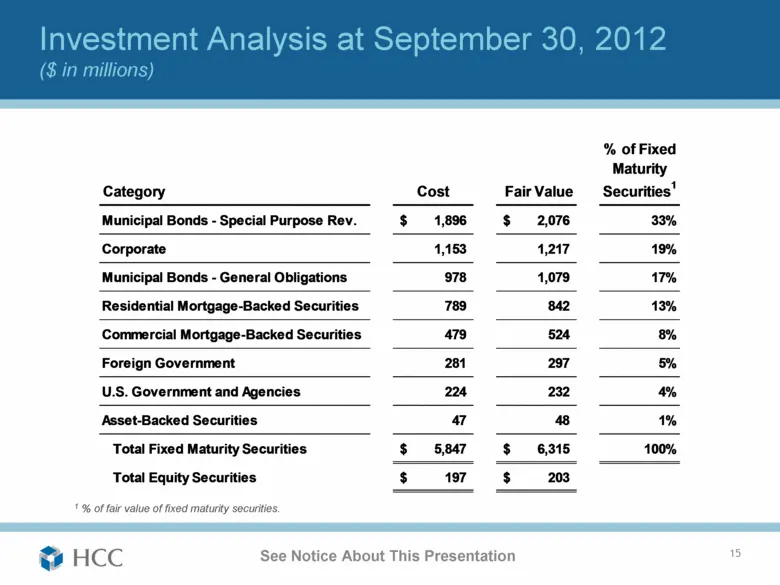
See Notice About This Presentation Investment Analysis at September 30, 2012 ($ in millions) 16 1 % of fair value of fixed maturity securities.
Slide 16: Quality Reinsurance Security
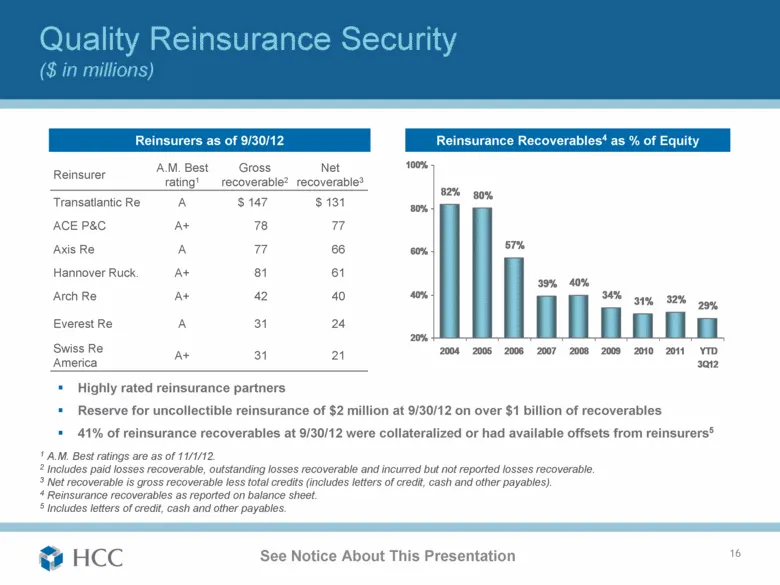
See Notice About This Presentation Quality Reinsurance Security ($ in millions) 17 1 A.M. Best ratings are as of 11/1/12. 2 Includes paid losses recoverable, outstanding losses recoverable and incurred but not reported losses recoverable. 3 Net recoverable is gross recoverable less total credits (in
Slide 17: HCC's Value Proposition
See Notice About This Presentation HCC’s Value Proposition 18 Non-correlated portfolio of products Double-digit margin in very competitive market High quality investment portfolio Strong operating cash flow Experienced management team
Slide 18: Performance Versus Peers
See Notice About This Presentation Performance Versus Peers 19
Slide 19: Total Value Creation
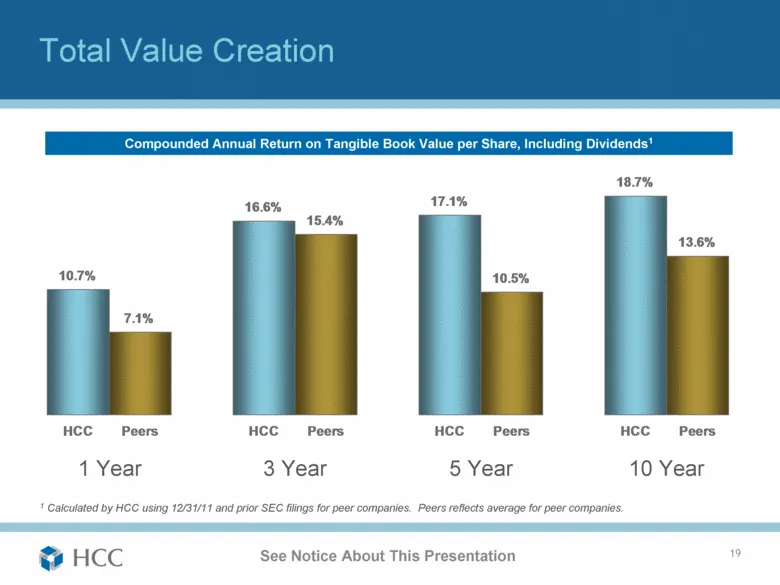
See Notice About This Presentation Total Value Creation 20 1 Calculated by HCC using 12/31/11 and prior SEC filings for peer companies. Peers reflects average for peer companies. Compounded Annual Return on Tangible Book Value per Share, Including Dividends1 1 Year 3 Year 5 Year 10 Year 10.7% 7.1% 1
Slide 20: Outperformance with Low Volatility - 10 Years
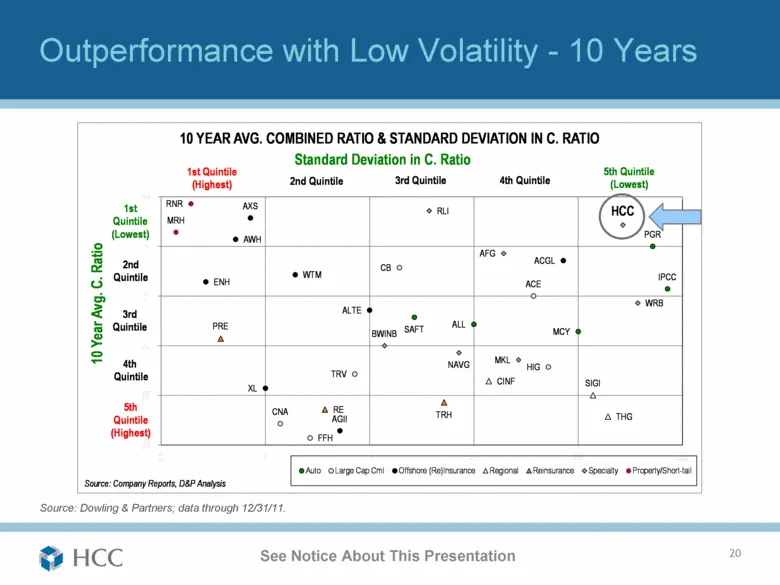
See Notice About This Presentation Outperformance with Low Volatility - 10 Years 21 Source: Dowling & Partners; data through 12/31/11. SAFT PGR MCY IPCC ALL TRV ACE CB FFH HIG CNA ACGL AXS AGII AWH ENH WTM ALTE XL SIGI CINF THG PRE RE TRH WRB HCC AFG RLI MKL NAVG BWINB RNR MRH 10 Year Avg. C. Ratio
Slide 21: Outperformance with Low Volatility - 5 Years
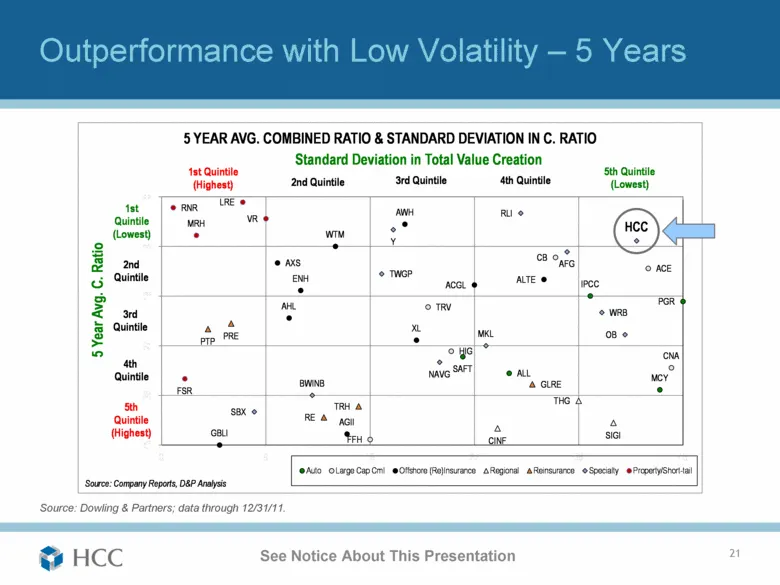
See Notice About This Presentation Outperformance with Low Volatility – 5 Years 22 Source: Dowling & Partners; data through 12/31/11. IPCC SAFT PGR MCY ALL FFH ACE TRV CB CNA HIG ACGL AWH AHL ENH AXS AGII WTM ALTE GBLI XL THG SIGI CINF PRE PTP TRH RE GLRE HCC AFG RLI WRB NAVG TWGP Y SBX MKL OB BWINB
Slide 22: Favorable Investment Metrics
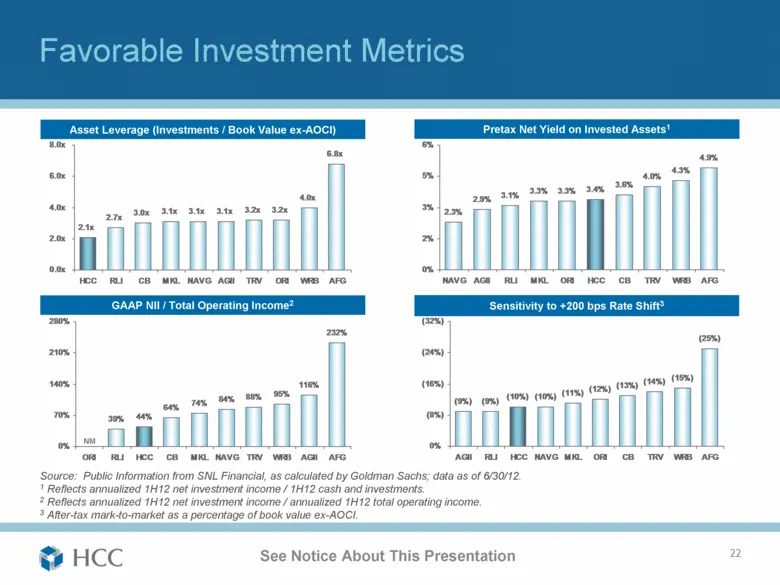
See Notice About This Presentation Favorable Investment Metrics 23 Source: Public Information from SNL Financial, as calculated by Goldman Sachs; data as of 6/30/12. 1 Reflects annualized 1H12 net investment income / 1H12 cash and investments. 2 Reflects annualized 1H12 net investment income / annua
Slide 23: Reconciliation of Non-GAAP Financial Measure to GAAP
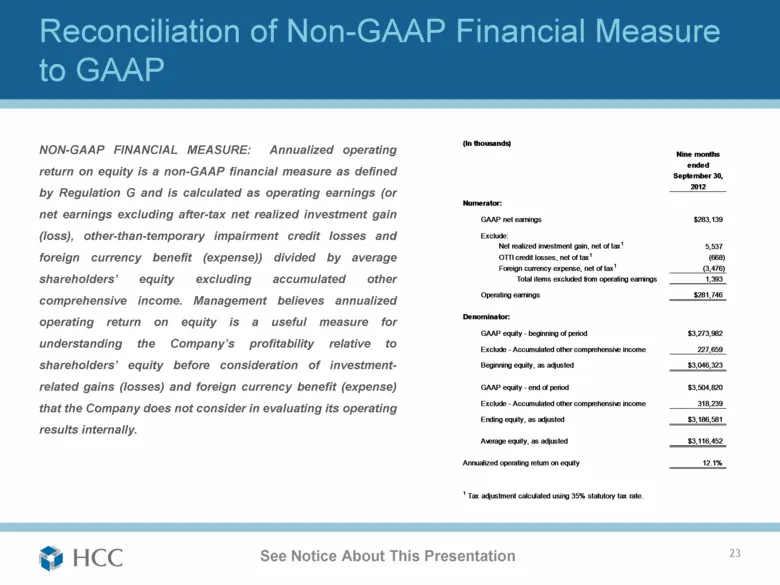
See Notice About This Presentation Reconciliation of Non-GAAP Financial Measure to GAAP NON-GAAP FINANCIAL MEASURE: Annualized operating return on equity is a non-GAAP financial measure as defined by Regulation G and is calculated as operating earnings (or net earnings excluding after-tax net realiz
Source: SEC EDGAR · 8-K filed Nov 21, 2012
More decks from HCC Insurance Holdings Inc
 Q2 2015 Earnings Presentation31 slides · Aug 14, 2015
 Merger or Acquisition (June 2015)22 slides · Jun 23, 2015
 Merger or Acquisition (June 2015)10 slides · Jun 10, 2015
 Merger or Acquisition (June 2015)30 slides · Jun 10, 2015
 Q1 2015 Earnings Presentation35 slides · May 21, 2015
 36th Annual Raymond James Institutional Investors Conference (February 2015)36 slides · Feb 27, 2015