Antares Pharma — FBR 8th Annual Growth Investor Conference 2004
29 slides from Antares Pharma's conference presentation, Jun 3, 2004
Slide 1: Building Shareholder Value as a Leader in Drug Delivery
Antares Pharma, Inc. Building Shareholder Value as a Leader in Drug Delivery FBR 8th Annual Growth Investor Conference June 2-3, 2004 Roger G. Harrison, Ph.D. CEO and President OTCBB: ANTR www.antarespharma.com
Slide 2: Safe Harbor Statement
Safe Harbor Statement Throughout this presentation, we discuss some of our expectations regarding the Company’s future performance. All of these forward-looking statements are based on our current views and assumptions. Actual results could differ materially from these current expectations and from
Slide 3: Agenda
Agenda • Company Summary • Strategy • Technology and Value Proposition • Pipeline and Financial Projections
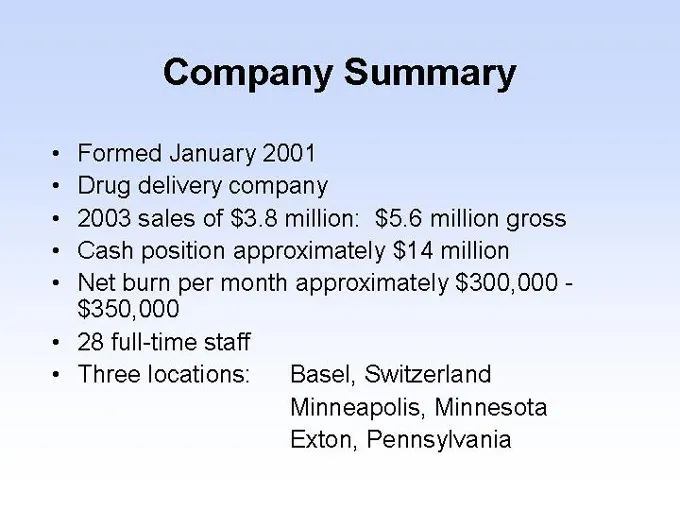
Slide 4: Company Summary
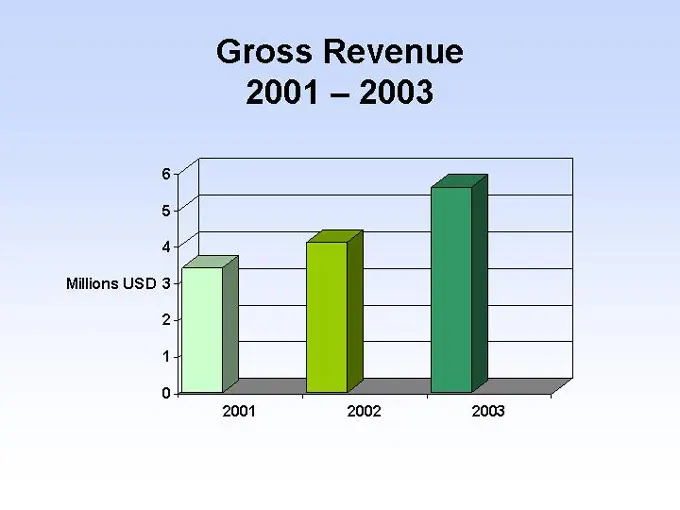
Company Summary • Formed January 2001 • Drug delivery company • 2003 sales of $3.8 million: $5.6 million gross • Cash position approximately $14 million • Net burn per month approximately $300,000 -$350,000 • 28 full-time staff • Three locations: Basel, Switzerland Minneapolis, Minnesota Exton, Penn
Slide 5: Equity Information
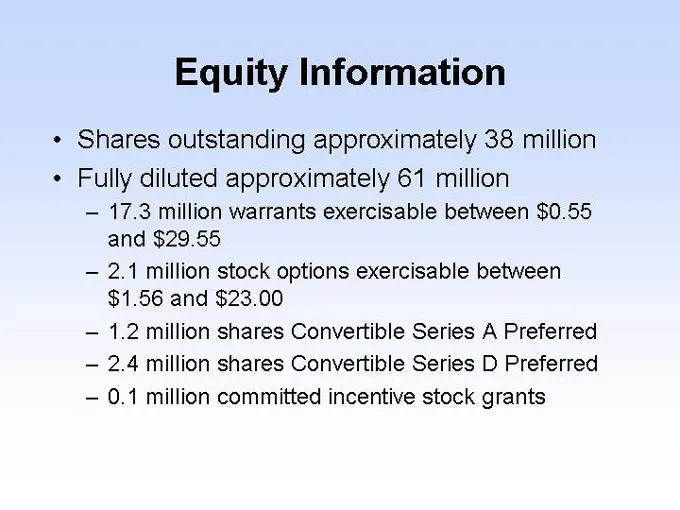
Equity Information • Shares outstanding approximately 38 million • Fully diluted approximately 61 million – 17.3 million warrants exercisable between $0.55 and $29.55 – 2.1 million stock options exercisable between $1.56 and $23.00 – 1.2 million shares Convertible Series A Preferred – 2.4 million sh
Slide 6: Reconfigured Board
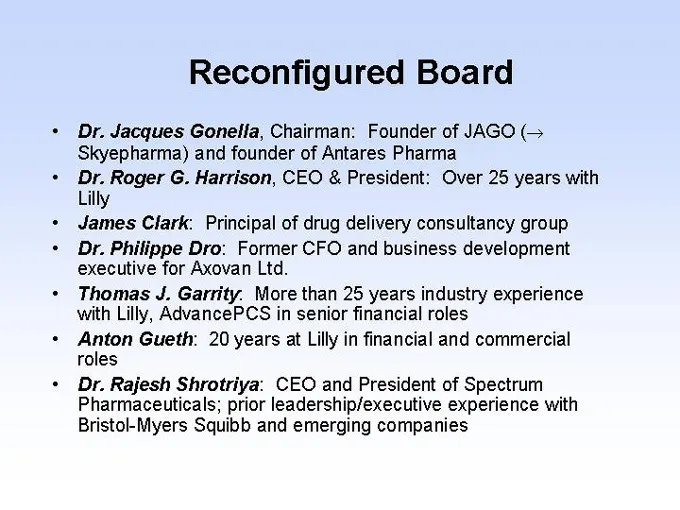
Reconfigured Board • Dr. Jacques Gonella, Chairman: Founder of JAGO ( ??Skyepharma) and founder of Antares Pharma • Dr. Roger G. Harrison, CEO & President: Over 25 years with Lilly • James Clark: Principal of drug delivery consultancy group • Dr. Philippe Dro: Former CFO and business development exe
Slide 7: Strategy: Gross Revenue 2001-2003
Strategy Gross Revenue 2001 – 2003 Millions USD 2001 2002 2003
Slide 8: Strategy
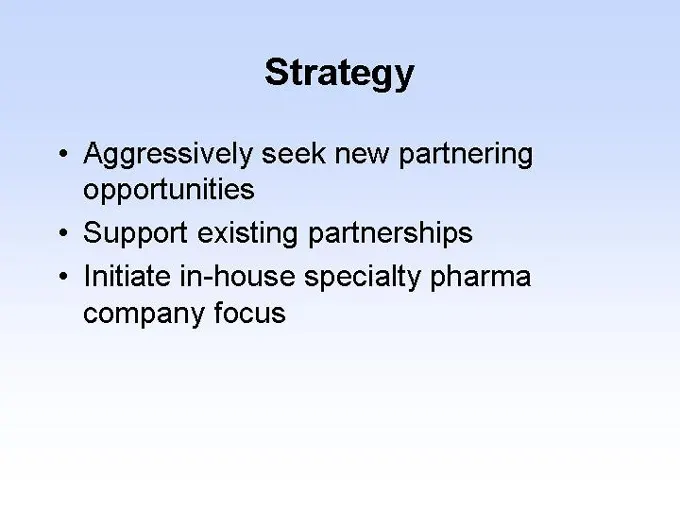
Strategy • Aggressively seek new partnering opportunities • Support existing partnerships • Initiate in-house specialty pharma company focus
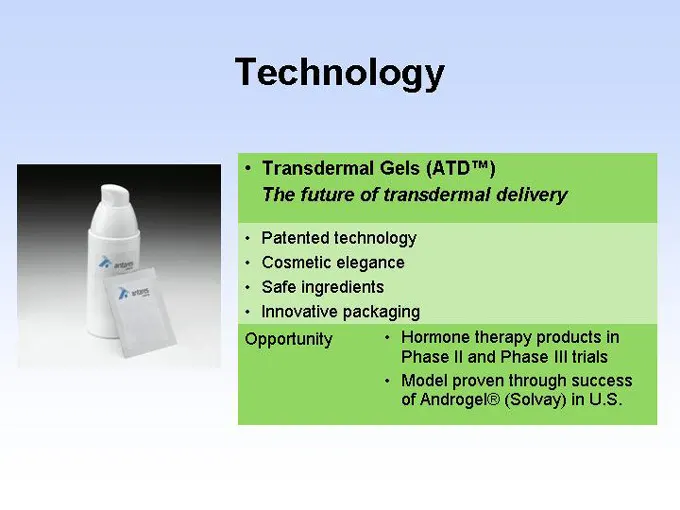
Slide 9: Technology: Transdermal Gels (ATD)
Technology • Transdermal Gels (ATD™) The future of transdermal delivery • Patented technology • Cosmetic elegance • Safe ingredients • Innovative packaging Opportunity • Hormone therapy products in Phase II and Phase III trials • Model proven through success of Androgel® (Solvay) in U.S.
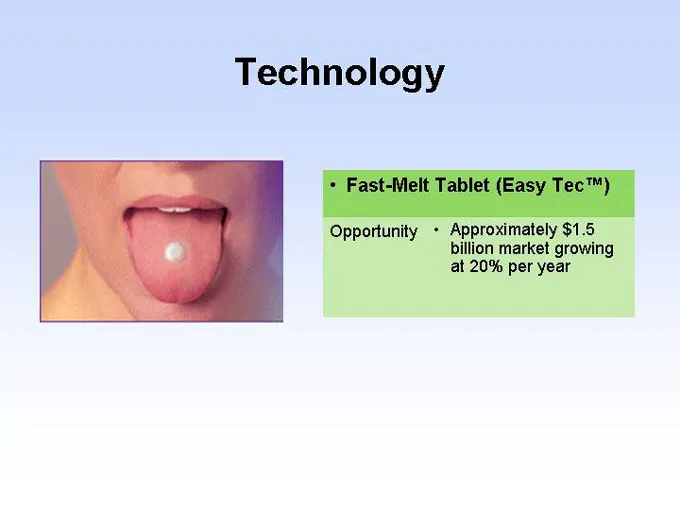
Slide 10: Technology: Fast-Melt Tablet
Technology • Fast-Melt Tablet (Easy Tec™) Opportunity Approximately $1.5 billion market growing at 20% per year
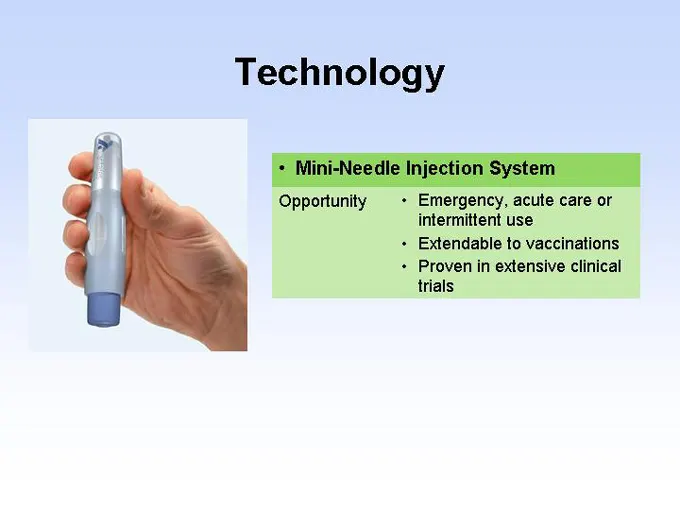
Slide 11: Technology: Mini-Needle Injection System
Technology • Mini-Needle Injection System Opportunity • Emergency, acute care or intermittent use • Extendable to vaccinations • Proven in extensive clinical trials
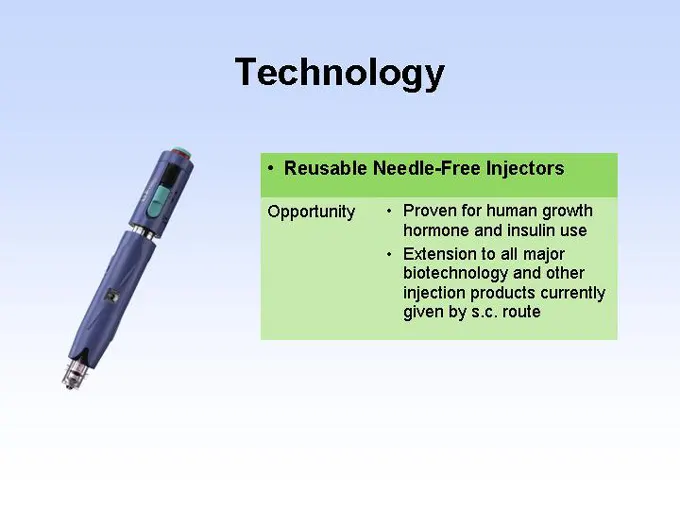
Slide 12: Technology: Reusable Needle-Free Injectors
Technology • Reusable Needle-Free Injectors Opportunity • Proven for human growth hormone and insulin use • Extension to all major biotechnology and other injection products currently given by s.c. route
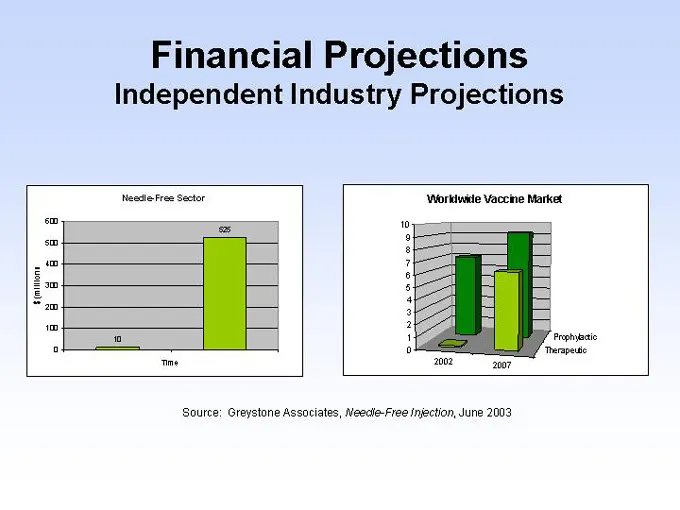
Slide 13: Financial Projections: Needle-Free Sector
Financial Projections Independent Industry Projections Needle-Free Sector Time Worldwide Vaccine Market 2002 2007 Prophylactic Therapeutic Source: Greystone Associates, Needle-Free Injection, June 2003
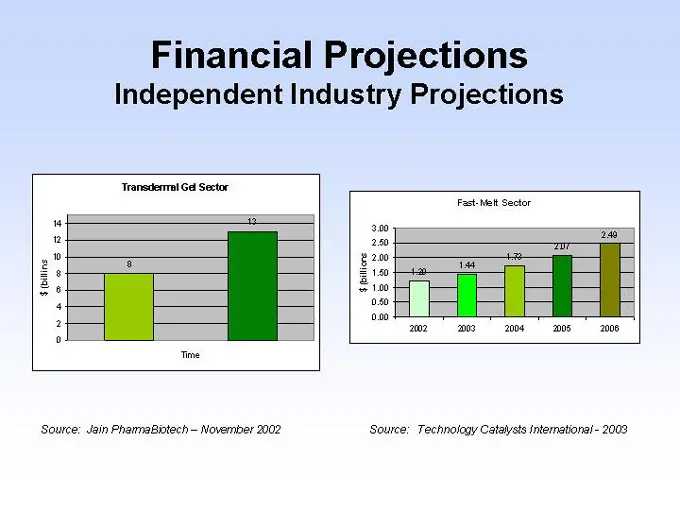
Slide 14: Financial Projections: Transdermal Gel and Fast-Melt
Financial Projections Independent Industry Projections Transdermal Gel Sector Time Source: Jain PharmaBiotech – November 2002 Fast-Melt Sector 2.49 2.07 1.73 1.44 1.20 2002 2003 2004 2005 2006 Source: Technology Catalysts International—2003
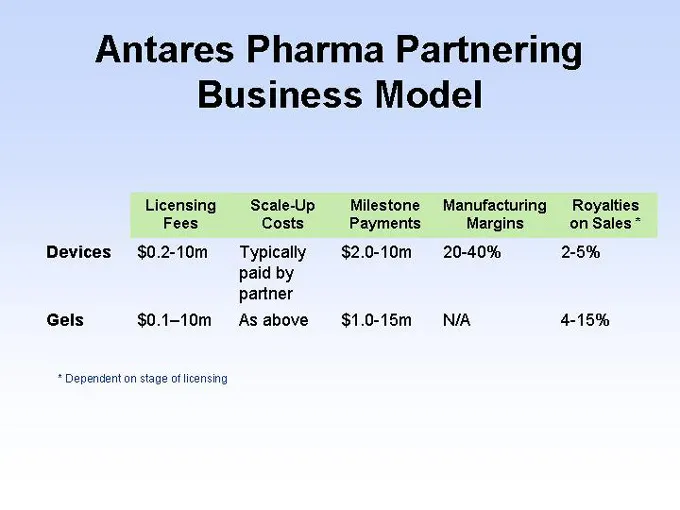
Slide 15: Partnering Business Model
Antares Pharma Partnering Business Model Licensing Scale-Up Milestone Manufacturing Royalties Fees Costs Payments Margins on Sales * Devices $0.2-10m Typically $2.0-10m 20-40% 2-5% paid by partner Gels $0.1–10m As above $1.0-15m N/A 4-15% * Dependent on stage licensing
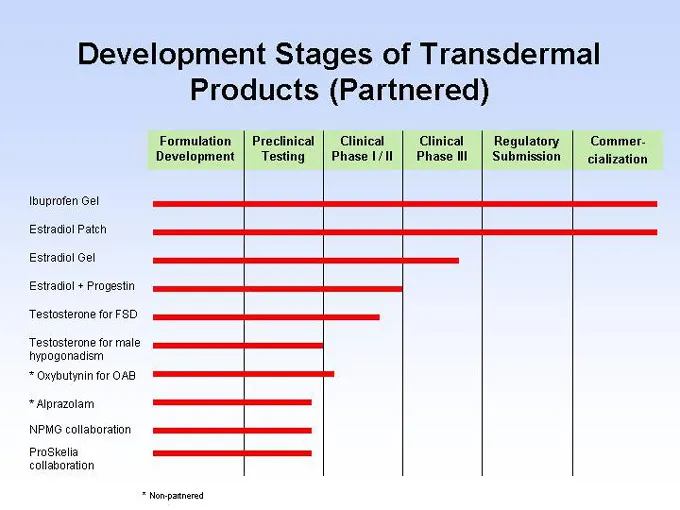
Slide 16: Development Stages of Transdermal Products
Development Stages of Transdermal Products (Partnered) Formulation Preclinical Clinical Clinical Regulatory Commer- Development Testing Phase I / II Phase III Submission cialization Ibuprofen Gel Estradiol Patch Estradiol Gel Estradiol + Progestin Testosterone for FSD Testosterone for male hypogonad
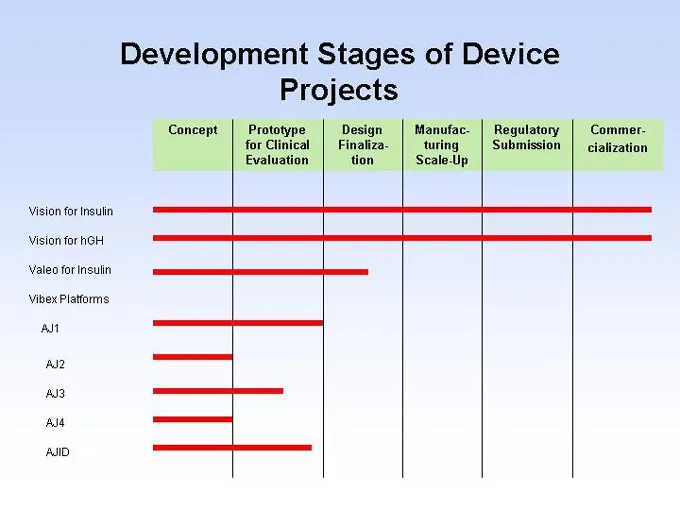
Slide 17: Development Stages of Device Projects
Development Stages of Device Projects Concept Prototype Design Manufac- Regulatory Commer- for Clinical Finaliza- turing Submission cialization Evaluation tion Scale-Up Vision for Insulin Vision for hGH Valeo for Insulin Vibex Platforms AJ1 AJ2 AJ3 AJ4 AJID
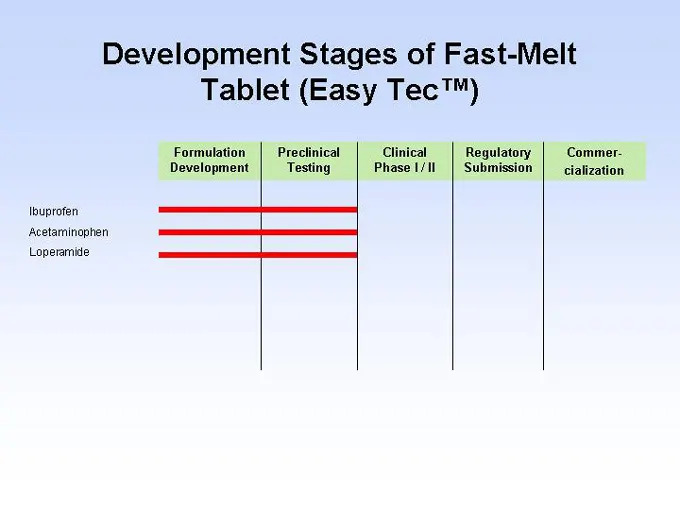
Slide 18: Development Stages of Fast-Melt Tablet
Development Stages of Fast-Melt Tablet (Easy Tec™) Formulation Preclinical Clinical Regulatory Commer- Development Testing Phase I / II Submission cialization Ibuprofen Acetaminophen Loperamide
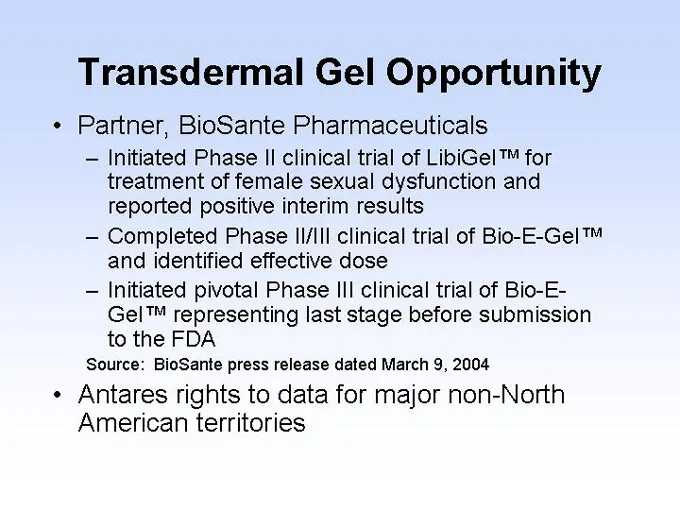
Slide 19: Transdermal Gel Opportunity
Transdermal Gel Opportunity • Partner, BioSante Pharmaceuticals – Initiated Phase II clinical trial of LibiGel™ for treatment of female sexual dysfunction and reported positive interim results – Completed Phase II/III clinical trial of Bio-E-Gel™ and identified effective dose – Initiated pivotal Pha
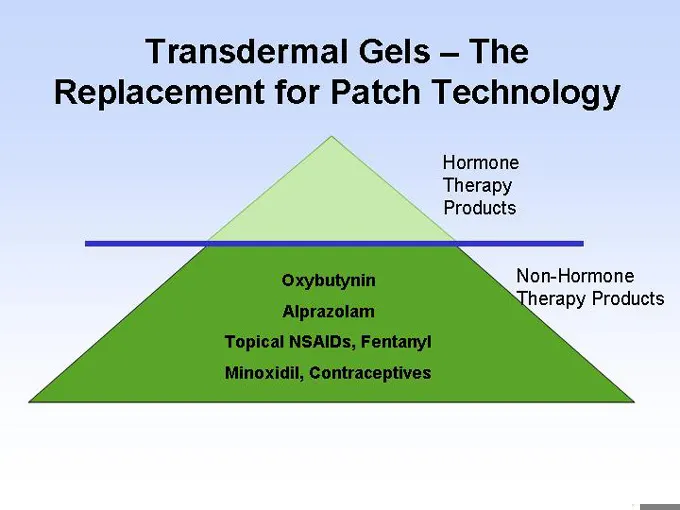
Slide 20: Transdermal Gels - The Replacement for Patch Technology
Transdermal Gels – The Replacement for Patch Technology Hormone Therapy Products Oxybutynin Alprazolam Topical NSAIDs, Fentanyl Minoxidil, Contraceptives Non-Hormone Therapy Products
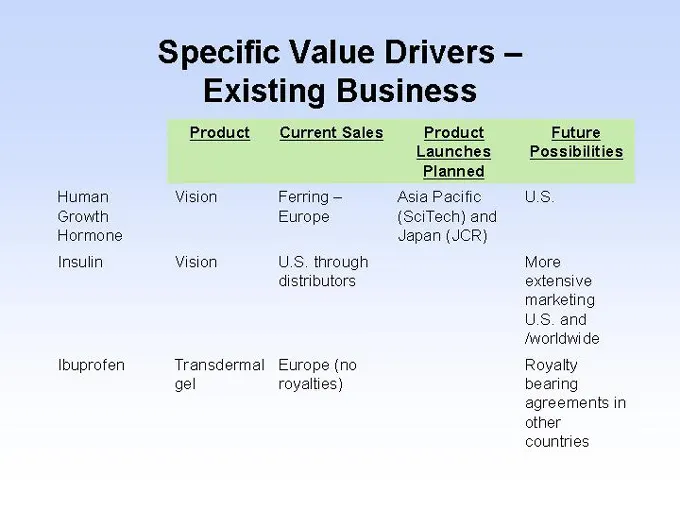
Slide 21: Specific Value Drivers - Existing Business
Specific Value Drivers –Existing Business Product Current Sales Product Future Launches Possibilities Planned Human Vision Ferring – Asia Pacific U.S. Growth Europe (SciTech) and Hormone Japan (JCR) Insulin Vision U.S. through More distributors extensive marketing U.S. and / worldwide Ibuprofen Tran
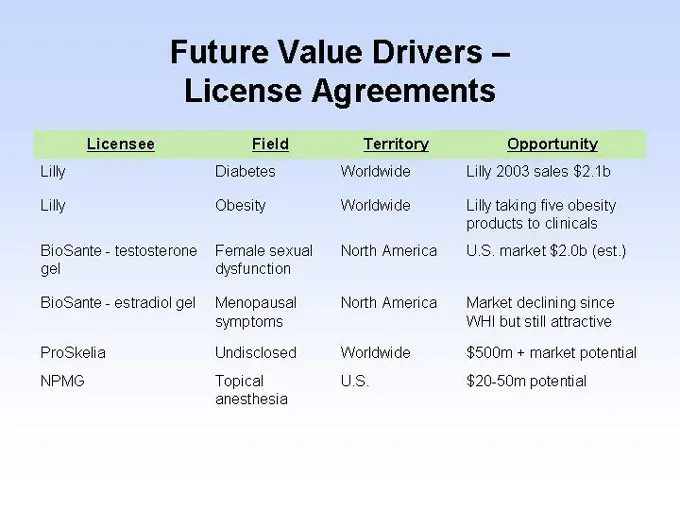
Slide 22: Future Value Drivers - License Agreements
Future Value Drivers –License Agreements Licensee Field Territory Opportunity Lilly Diabetes Worldwide Lilly 2003 sales $2.1b Lilly Obesity Worldwide Lilly taking five obesity products to clinicals BioSante—testosterone Female sexual North America U.S. market $2.0b (est.) gel dysfunction BioSante—es
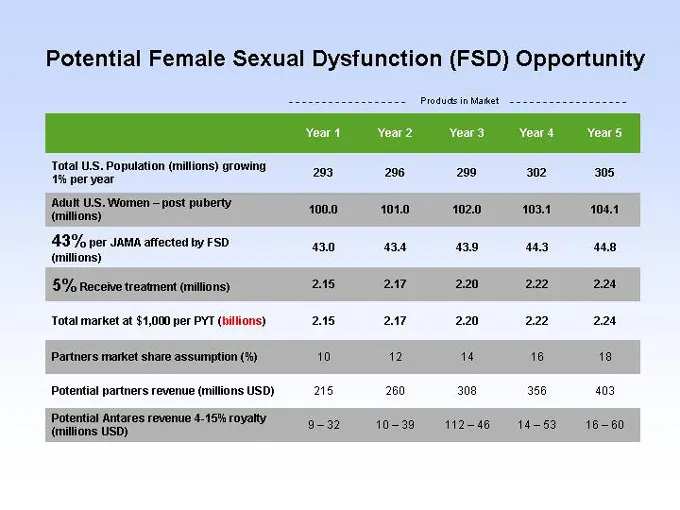
Slide 23: Potential Female Sexual Dysfunction Opportunity
Potential Female Sexual Dysfunction (FSD) Opportunity Products in Market Year 1 Year 2 Year 3 Year 4 Year 5 Total U.S. Population (millions) growing 293 296 299 302 305 1% per year Adult U.S. Women – post puberty 100.0 101.0 102.0 103.1 104.1 (millions) 43% per JAMA affected by FSD 43.0 43.4 43.9 44
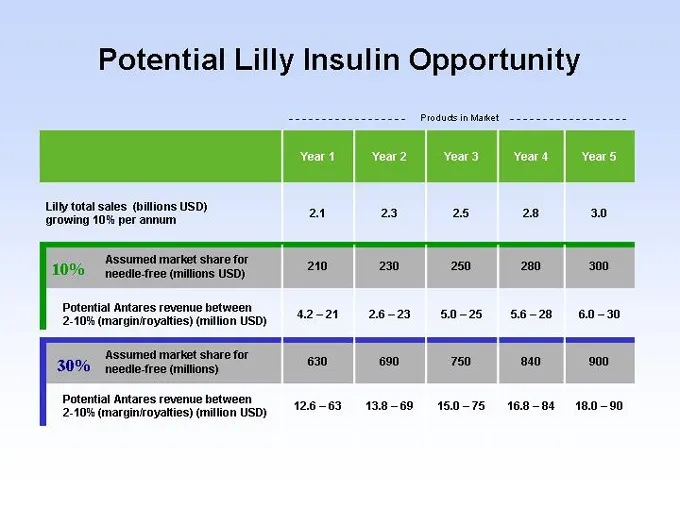
Slide 24: Potential Lilly Insulin Opportunity
Potential Lilly Insulin Opportunity Products in Market Year 1 Year 2 Year 3 Year 4 Year 5 Lilly total sales (billions USD) 2.1 2.3 2.5 2.8 3.0 growing 10% per annum Assumed market share for 10% 210 230 250 280 300 needle-free (millions USD) Potential Antares revenue between 4.2 – 21 2.6 – 23 5.0 – 2
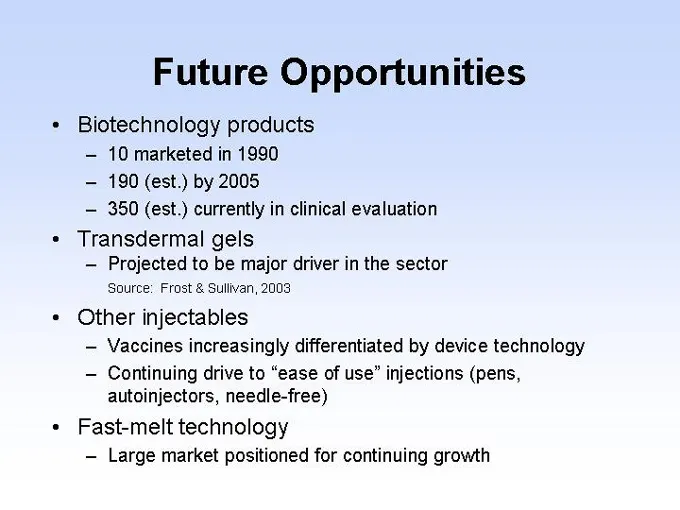
Slide 25: Future Opportunities
Future Opportunities • Biotechnology products – 10 marketed in 1990 – 190 (est.) by 2005 – 350 (est.) currently in clinical evaluation • Transdermal gels – Projected to be major driver in the sector Source: Frost & Sullivan, 2003 • Other injectables – Vaccines increasingly differentiated by device t
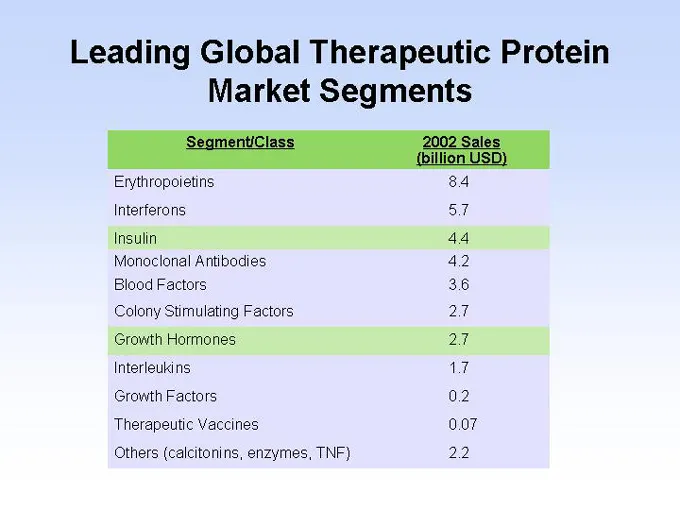
Slide 26: Leading Global Therapeutic Protein Market Segments
Leading Global Therapeutic Protein Market Segments Segment/Class 2002 Sales (billion USD) Erythropoietins 8.4 Interferons 5.7 Insulin 4.4 Monoclonal Antibodies 4.2 Blood Factors 3.6 Colony Stimulating Factors 2.7 Growth Hormones 2.7 Interleukins 1.7 Growth Factors 0.2 Therapeutic Vaccines 0.07 Other
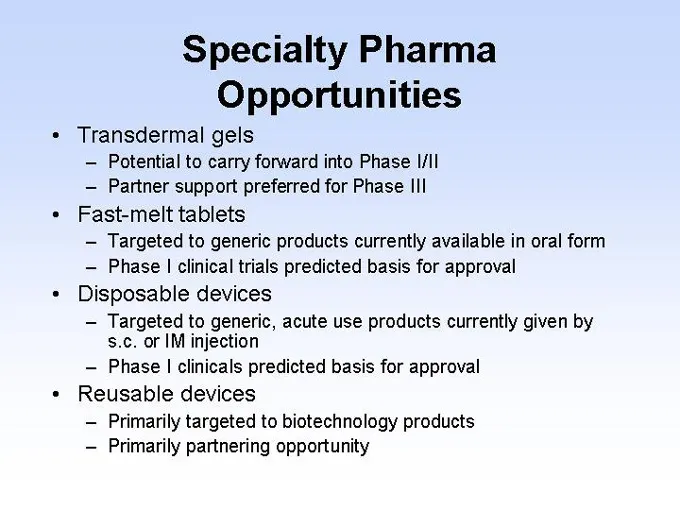
Slide 27: Specialty Pharma Opportunities
Specialty Pharma Opportunities • Transdermal gels – Potential to carry forward into Phase I/II – Partner support preferred for Phase III • Fast-melt tablets – Targeted to generic products currently available in oral form – Phase I clinical trials predicted basis for approval • Disposable devices – T
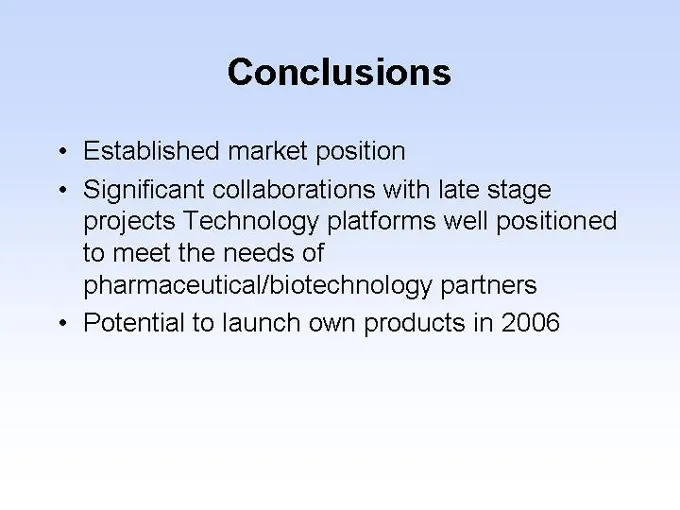
Slide 28: Conclusions
Conclusions • Established market position • Significant collaborations with late stage projects Technology platforms well positioned to meet the needs of pharmaceutical/biotechnology partners • Potential to launch own products in 2006
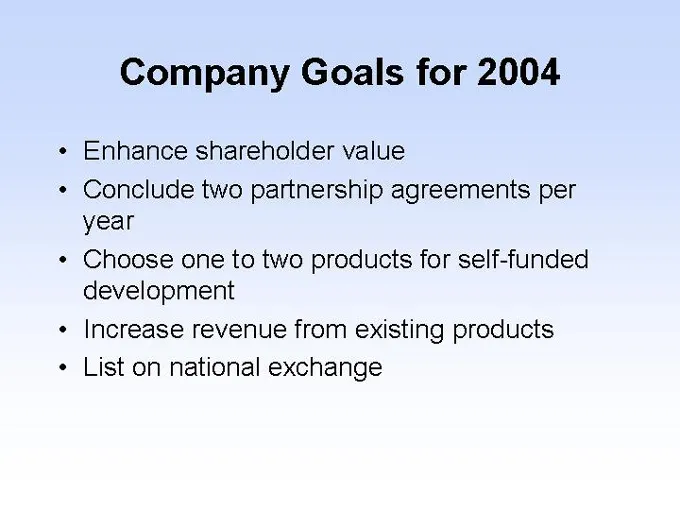
Slide 29: Company Goals for 2004
Company Goals for 2004 • Enhance shareholder value • Conclude two partnership agreements per year • Choose one to two products for self-funded development • Increase revenue from existing products • List on national exchange
Source: SEC EDGAR · 8-K filed Jun 3, 2004
More decks from Antares Pharma Inc
 Investor Presentation (March 2022)25 slides · Mar 7, 2022
 Investor Presentation (January 2022)25 slides · Jan 12, 2022
 Investor Presentation (August 2021)28 slides · Aug 18, 2021
 Investor Presentation (June 2021)27 slides · Jun 1, 2021
 Investor Presentation (March 2021)28 slides · Mar 5, 2021
 Investor Presentation (January 2021)28 slides · Jan 11, 2021