Premier Financial — First Defiance Financial — Raymond James U.S. Bank Conference September 2016
40 slides from Premier Financial's conference presentation, Sep 7, 2016
Slide 1: Raymond James U.S. Bank Conference September 2016
Donald P. Hileman P resident & Chief Executive Officer Kevin T. Thompson Executive Vice President & Chief Financial Officer Raymond James U.S. Bank Conference September 2016 Exhibit 99
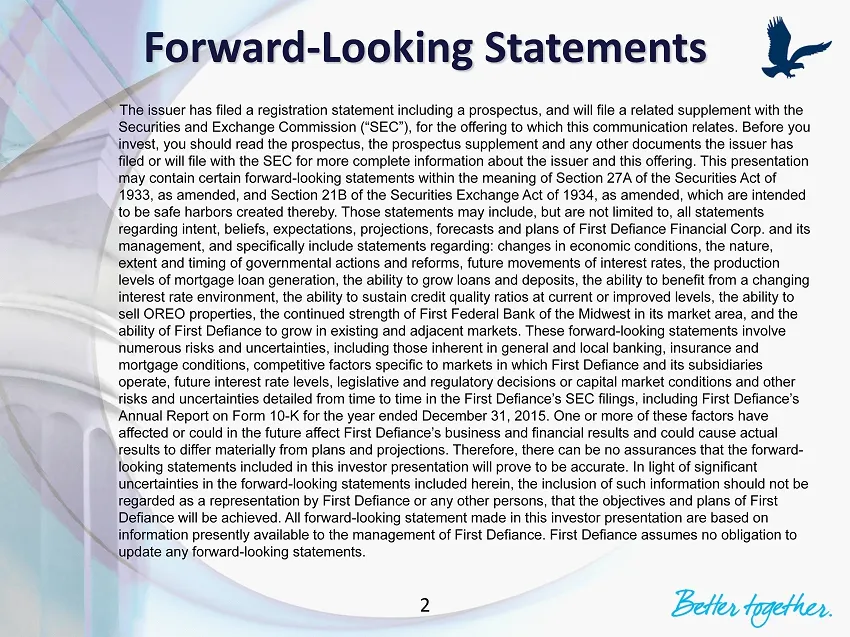
Slide 2: Forward-looking statements and offering notice
The issuer has filed a registration statement including a prospectus, and will file a related supplement with the Securities and Exchange Commission (“SEC”), for the offering to which this communication relates. Before you invest, you should read the prospectus, the prospectus supplement and any oth

Slide 3: Company Overview
~< ~ Company Overview
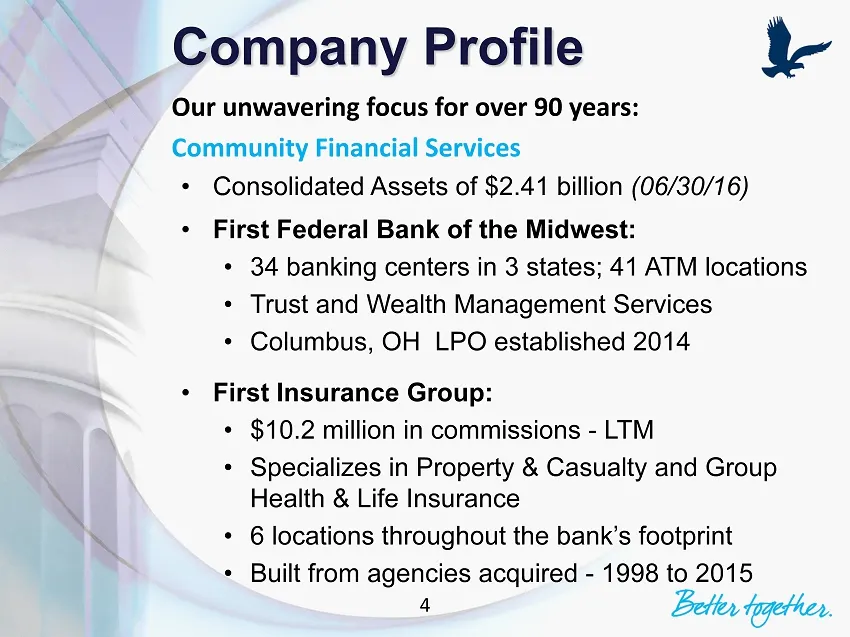
Slide 4: Company Profile
Company Profile Our unwavering focus for over 90 years: Community Financial Services • Consolidated Assets of $2.41 billion (06/30/16) • First Federal Bank of the Midwest: • 34 banking centers in 3 states; 41 ATM locations • Trust and Wealth Management Services • Columbus, OH LPO established 2014 •
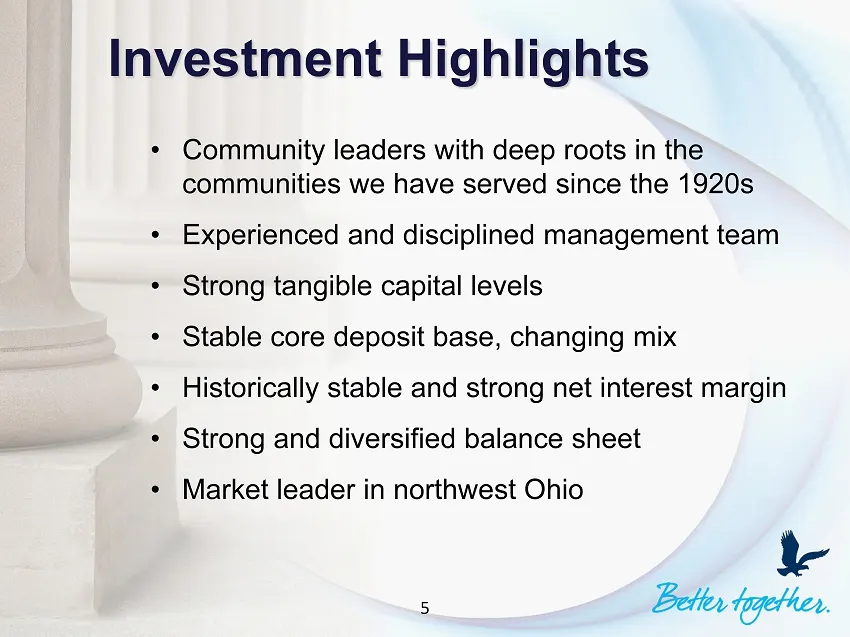
Slide 5: Investment Highlights
Investment Highlights • Community leaders with deep roots in the communities we have served since the 1920s • Experienced and disciplined management team • Strong tangible capital levels • Stable core deposit base, changing mix • Historically stable and strong net interest margin • Strong and divers
Slide 6: Executive Leadership
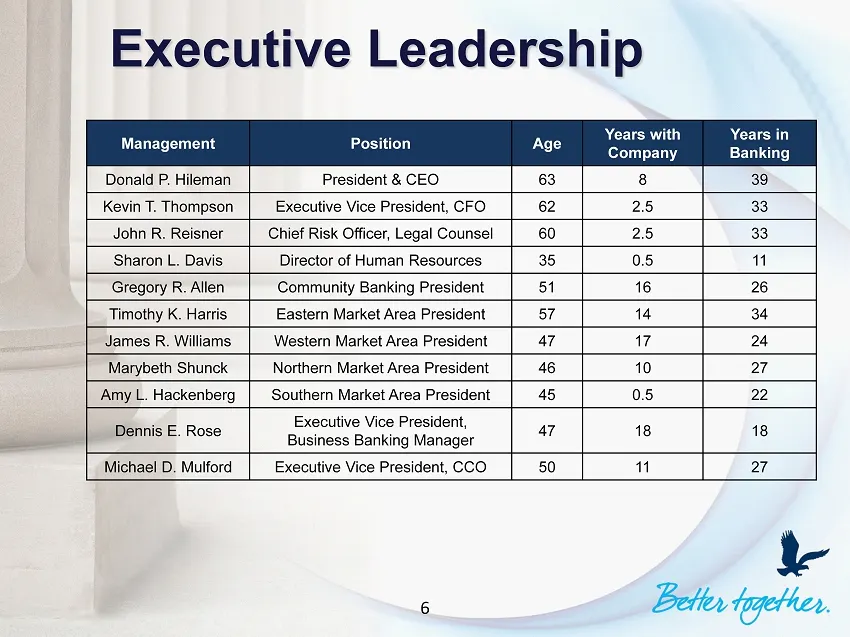
Executive Leadership Management Position Age Years with Company Years in Banking Donald P. Hileman President & CEO 63 8 39 Kevin T. Thompson Executive Vice President, CFO 62 2.5 33 John R. Reisner Chief Risk Officer, Legal Counsel 60 2.5 33 Sharon L. Davis Director of Human Resources 35 0.5 11 Grego
Slide 7: The First Defiance Market
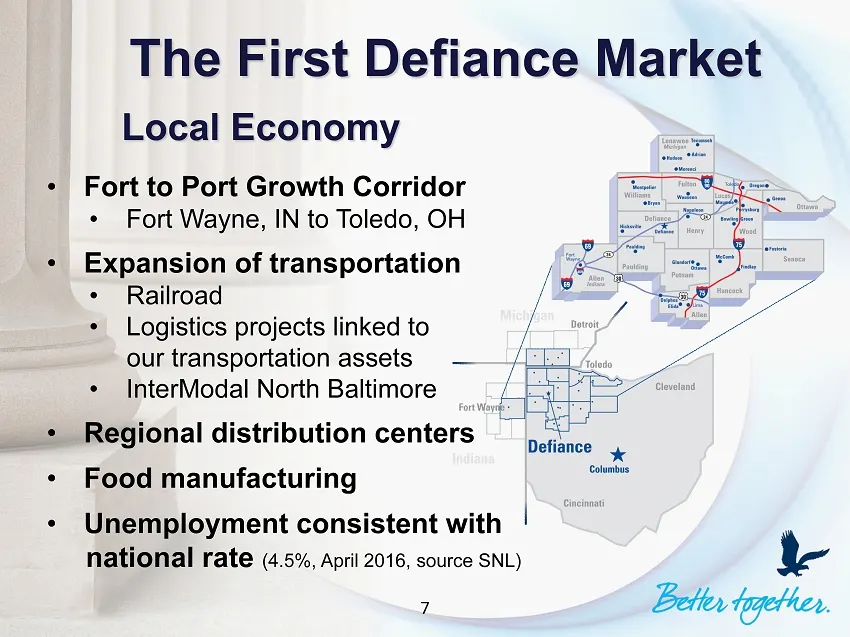
The First Defiance Market • Fort to Port Growth Corridor • Fort Wayne, IN to Toledo, OH • Expansion of transportation • Railroad • Logistics projects linked to our transportation assets • InterModal North Baltimore • Regional distribution centers • Food manufacturing • Unemployment consistent with n
Slide 8: Strategic Focus
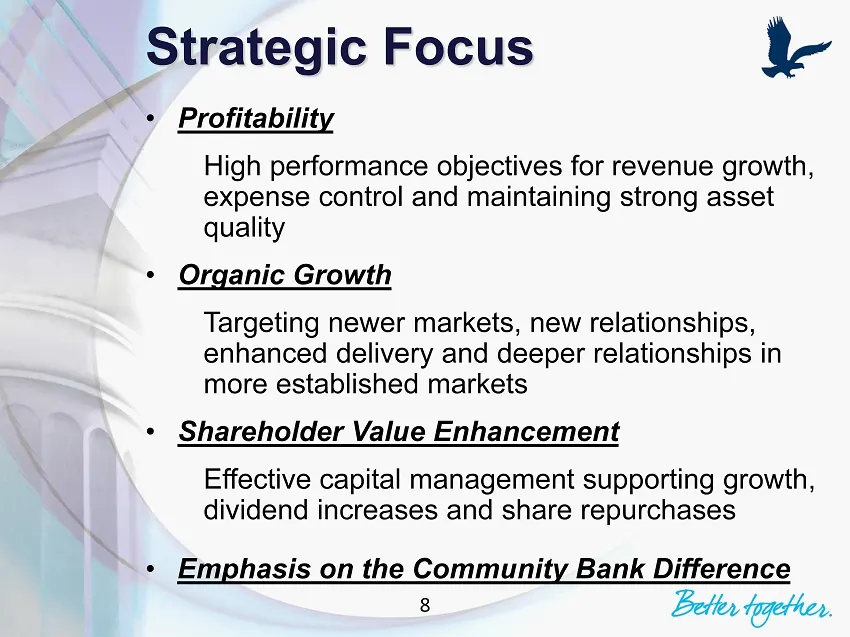
Strategic Focus • Profitability High performance objectives for revenue growth, expense control and maintaining strong asset quality • Organic Growth Targeting newer markets, new relationships, enhanced delivery and deeper relationships in more established markets • Shareholder Value Enhancement Eff
Slide 9: Recognized Performance
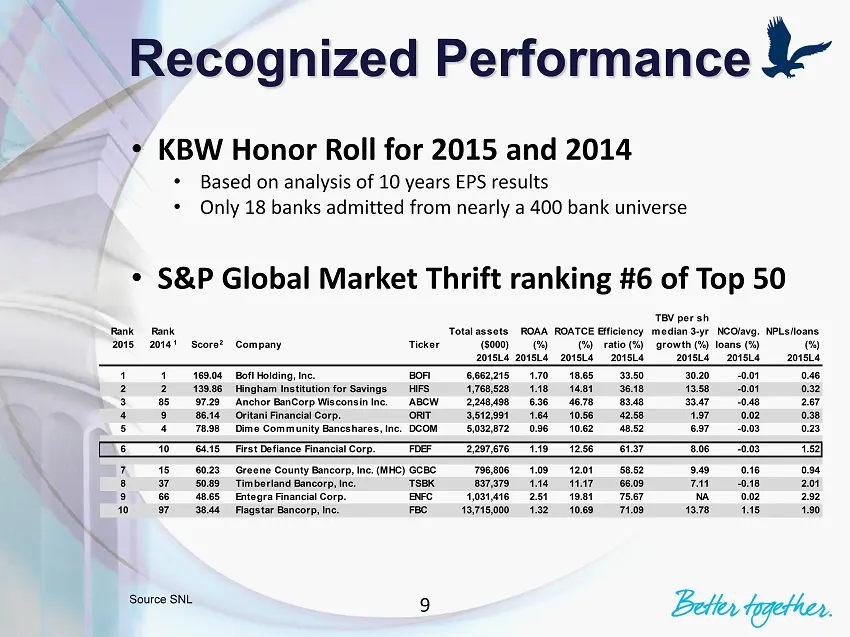
Recognized Performance Source SNL • KBW Honor Roll for 2015 and 2014 • Based on analysis of 10 years EPS results • Only 18 banks admitted from nearly a 400 bank universe • S&P Global Market Thrift ranking #6 of Top 50 Rank 2015 Rank 2014 1 Score2 Company Ticker Total assets ($000) ROAA (%) ROATCE (%
Slide 10: Consistent Profitability
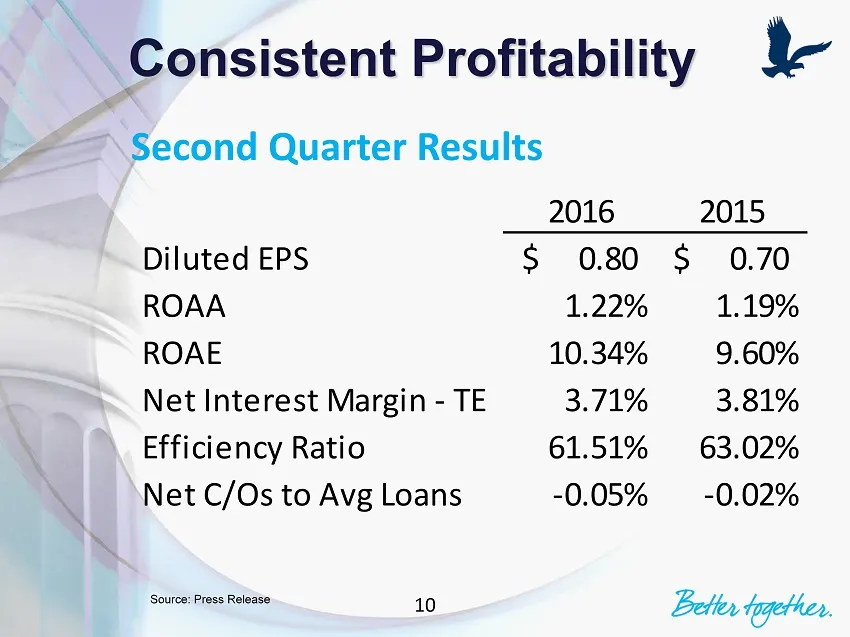
Consistent Profitability Source: Press Release Second Quarter Results 2016 2015 Diluted EPS 0.80$ 0.70$ ROAA 1.22% 1.19% ROAE 10.34% 9.60% Net Interest Margin - TE 3.71% 3.81% Efficiency Ratio 61.51% 63.02% Net C/Os to Avg Loans -0.05% -0.02% 10
Slide 11: Strong Sales & Service Delivery
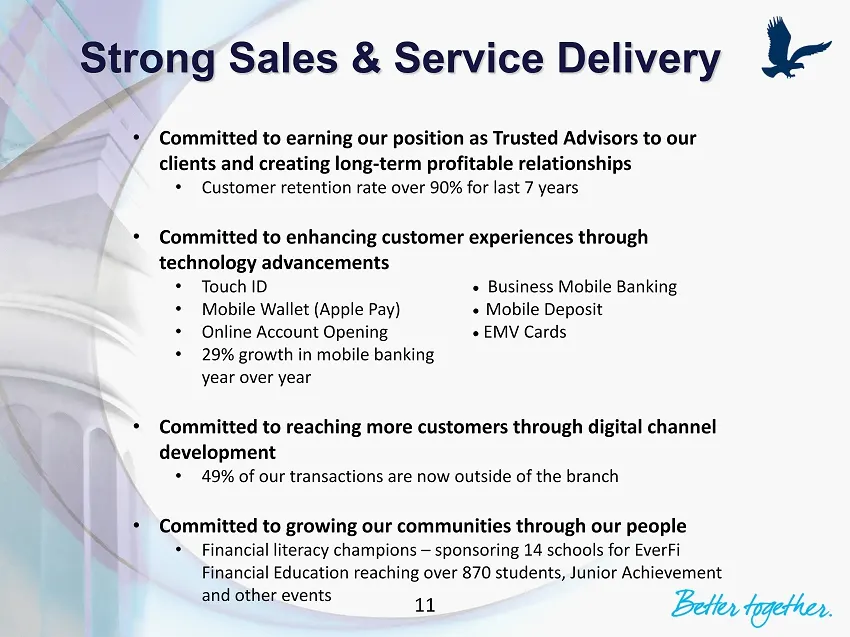
Strong Sales & Service Delivery • Committed to earning our position as Trusted Advisors to our clients and creating long - term profitable relationships • Customer retention rate over 90% for last 7 years • Committed to enhancing customer experiences through technology advancements • Touch ID Busi
Slide 12: Earned Market Share
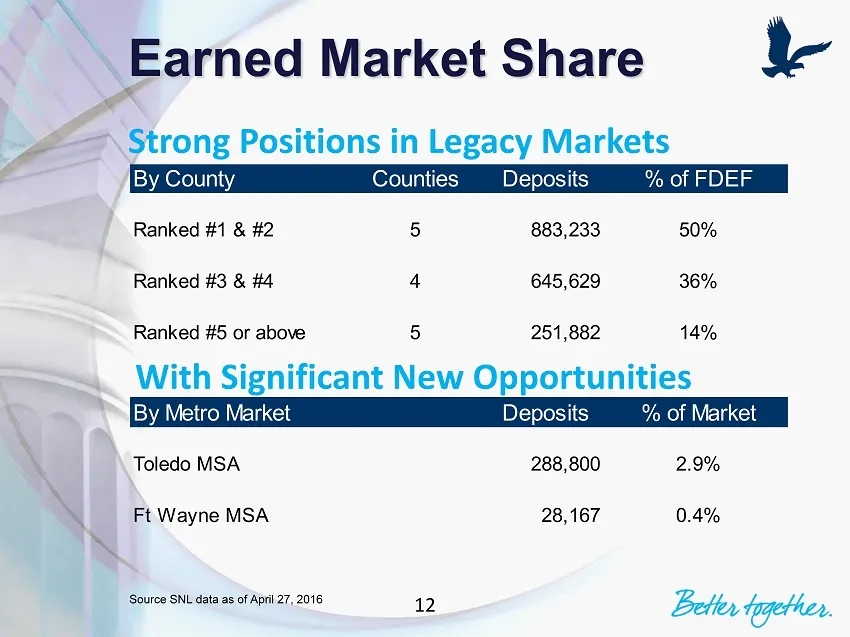
Earned Market Share Strong Positions in Legacy Markets By County Counties Deposits % of FDEF Ranked #1 & #2 5 883,233 50% Ranked #3 & #4 4 645,629 36% Ranked #5 or above 5 251,882 14% By Metro Market Deposits % of Market Toledo MSA 288,800 2.9% Ft Wayne MSA 28,167 0.4% Source SNL data as of April 27
Slide 13: Emerging Growth Profile
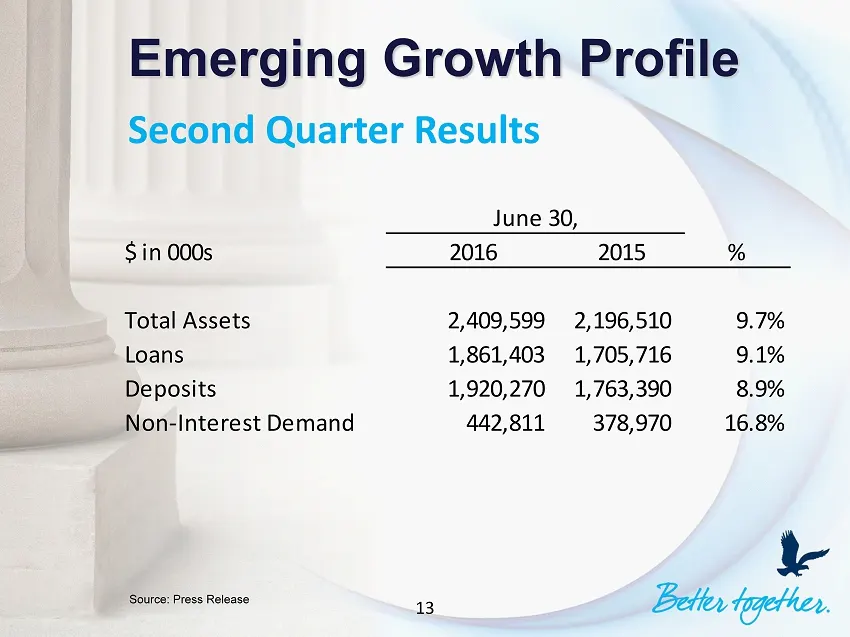
Emerging Growth Profile Second Quarter Results Source: Press Release June 30, $ in 000s 2016 2015 % Total Assets 2,409,599 2,196,510 9.7% Loans 1,861,403 1,705,716 9.1% Deposits 1,920,270 1,763,390 8.9% Non-Interest Demand 442,811 378,970 16.8% 13
Slide 14: Strong Shareholder Returns
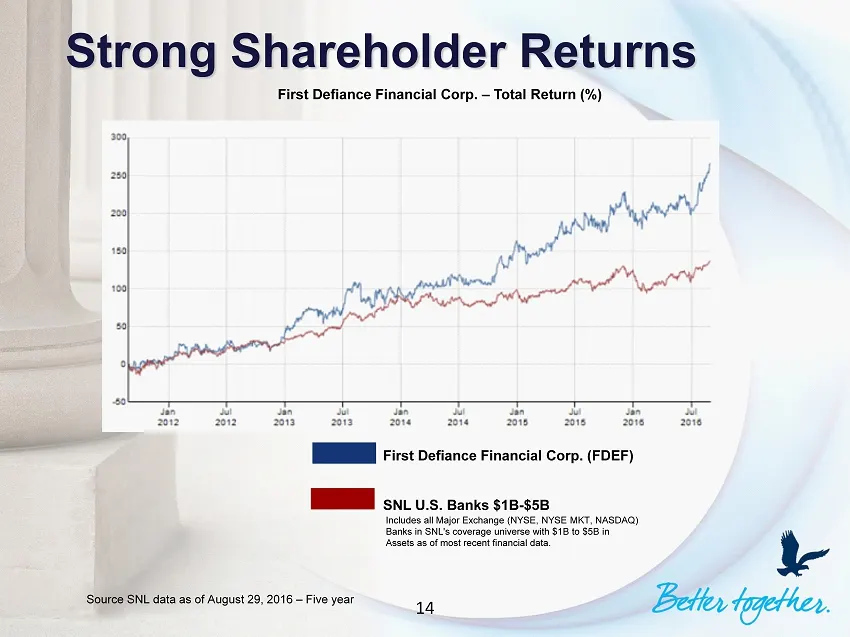
Strong Shareholder Returns First Defiance Financial Corp. – Total Return (%) First Defiance Financial Corp. (FDEF) SNL U.S. Banks $1B - $5B Includes all Major Exchange (NYSE, NYSE MKT, NASDAQ) Banks in SNL's coverage universe with $1B to $5B in Assets as of most recent financial data. Source SNL dat
Slide 15: 2016 Top Five Initiatives
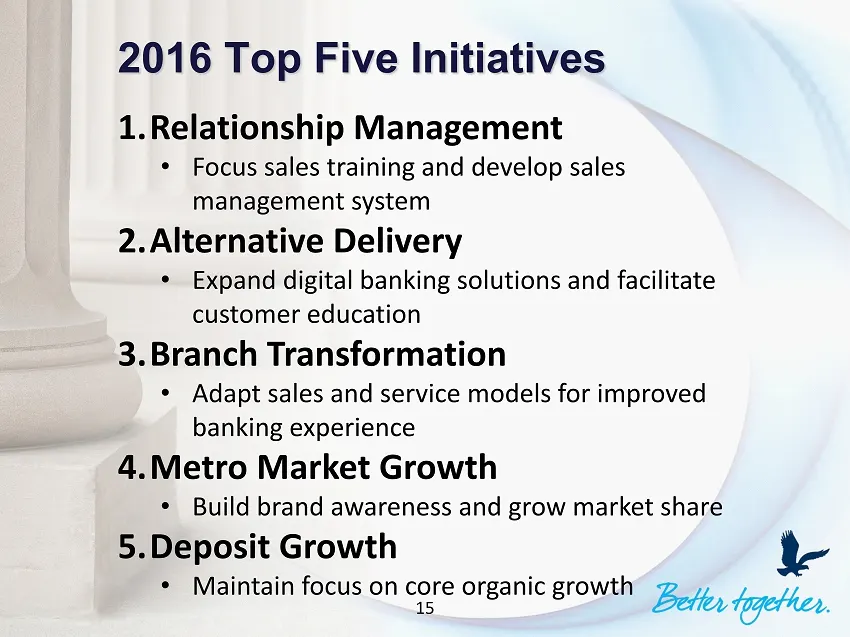
2016 Top Five Initiatives 1. Relationship Management • Focus sales t raining and develop sales management system 2. Alternative Delivery • Expand digital banking solutions and facilitate customer education 3. Branch Transformation • Adapt sales and service models for improved banking experience 4. M
Slide 16: Financial Highlights
Financial Highlights 16 Better together.
Slide 17: Net Income & Earnings Per Share
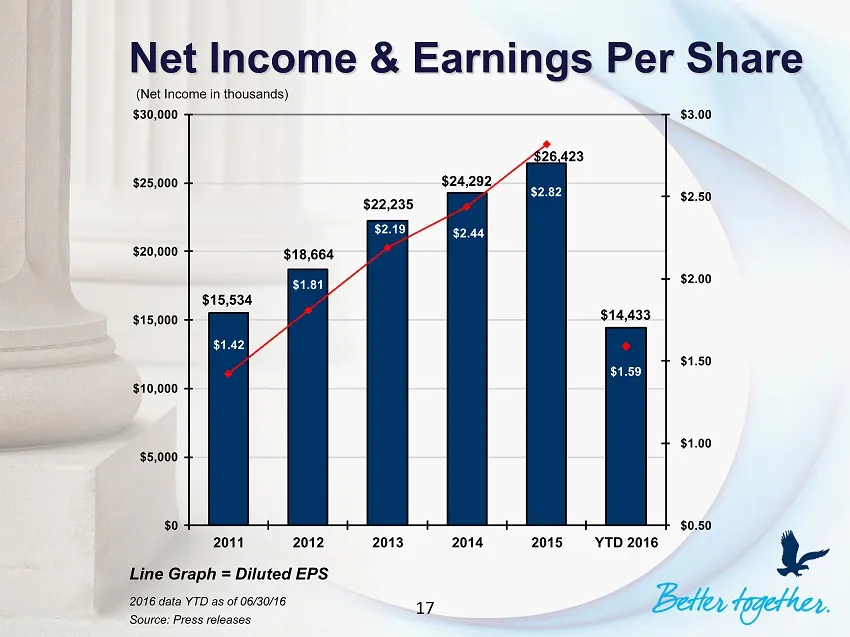
Net Income & Earnings Per Share $15,534 $18,664 $22,235 $24,292 $26,423 $14,433 $1.42 $1.81 $2.19 $2.44 $2.82 $1.59 $0.50 $1.00 $1.50 $2.00 $2.50 $3.00 $0 $5,000 $10,000 $15,000 $20,000 $25,000 $30,000 2011 2012 2013 2014 2015 YTD 2016 Line Graph = Diluted EPS Source : Press releases (Net Income in
Slide 18: Total Assets & Return On Assets
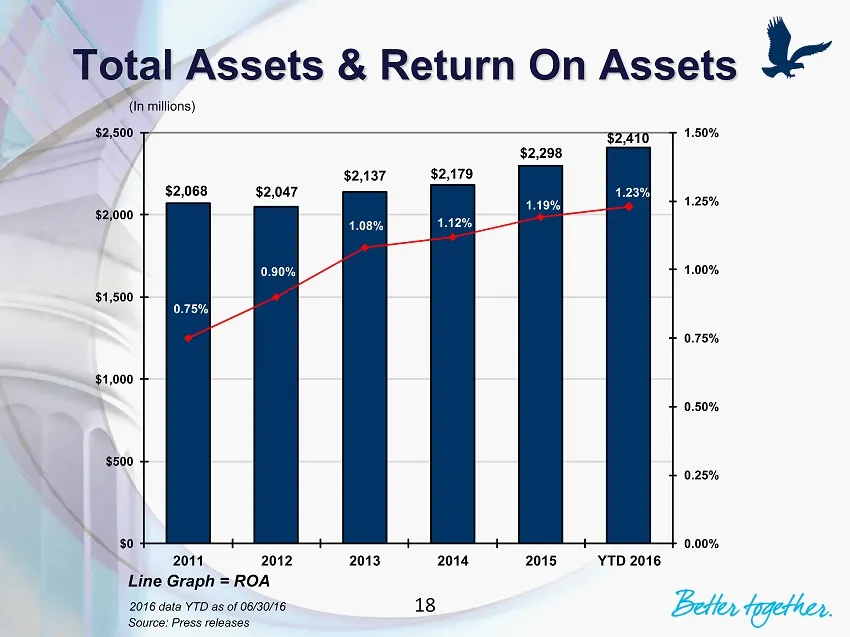
Total Assets & Return On Assets $2,068 $2,047 $2,137 $2,179 $2,298 $2,410 0.75% 0.90% 1.08% 1.12% 1.19% 1.23% 0.00% 0.25% 0.50% 0.75% 1.00% 1.25% 1.50% $0 $500 $1,000 $1,500 $2,000 $2,500 2011 2012 2013 2014 2015 YTD 2016 Line Graph = ROA Source : Press releases (In millions) 2016 data YTD as of 06/
Slide 19: Loan Portfolio Composition
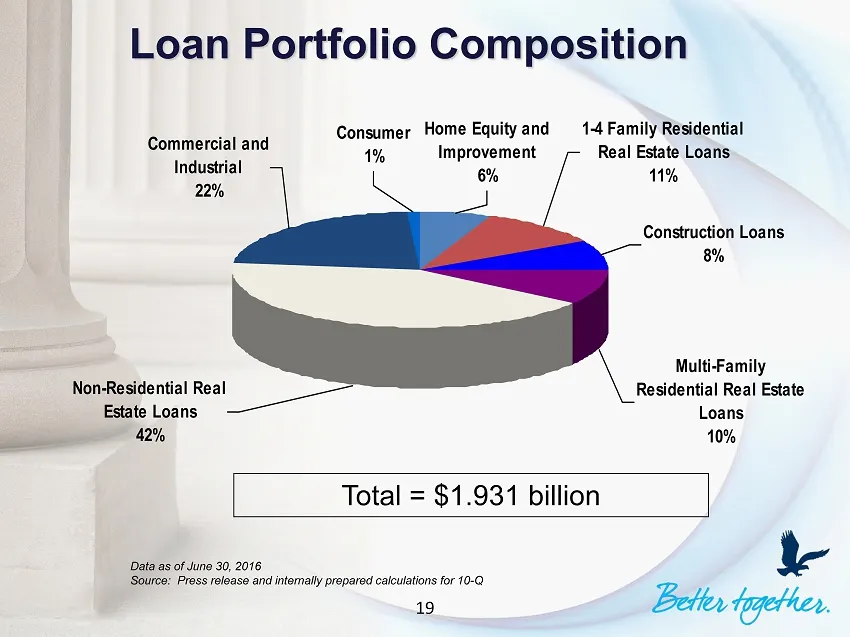
Loan Portfolio Composition Commercial and Industrial 22% Non-Residential Real Estate Loans 42% Multi-Family Residential Real Estate Loans 10% Consumer 1% Construction Loans 8% 1-4 Family Residential Real Estate Loans 11% Home Equity and Improvement 6% Data as of June 30, 2016 Source: Press release a
Slide 20: Non-performing Assets & NPAs/Assets
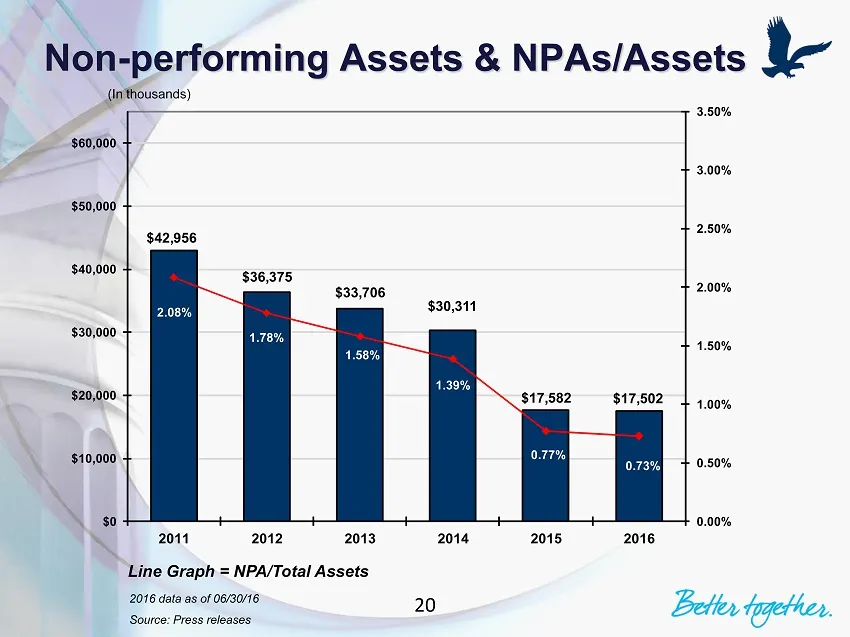
$42,956 $36,375 $33,706 $30,311 $17,582 $17,502 2.08% 1.78% 1.58% 1.39% 0.77% 0.73% 0.00% 0.50% 1.00% 1.50% 2.00% 2.50% 3.00% 3.50% $0 $10,000 $20,000 $30,000 $40,000 $50,000 $60,000 2011 2012 2013 2014 2015 2016 Line Graph = NPA/Total Assets Source : Press releases Non - performing Assets & NPAs/As
Slide 21: Net Charge-Offs/Avg. Loans
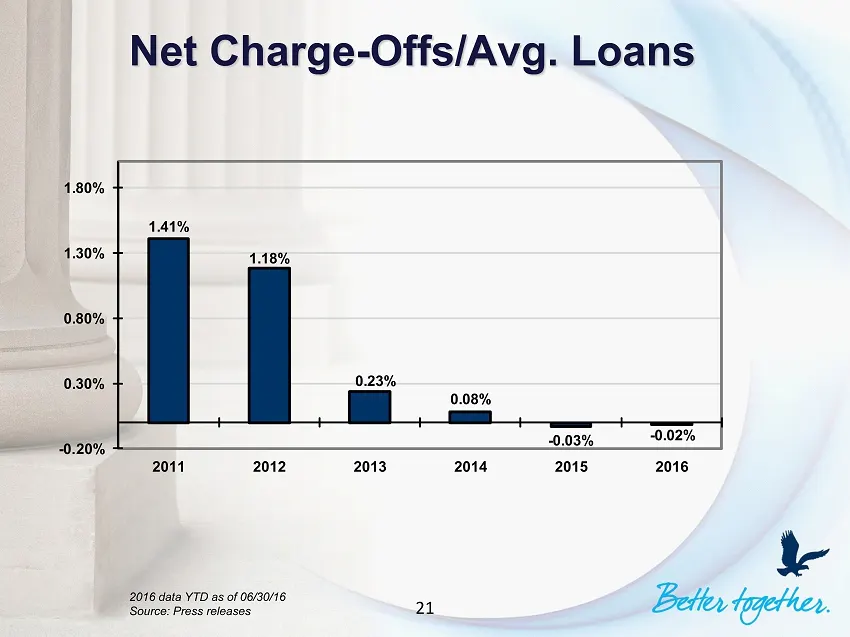
Net Charge - Offs/Avg. Loans 1.41% 1.18% 0.23% 0.08% - 0.03% - 0.02% -0.20% 0.30% 0.80% 1.30% 1.80% 2011 2012 2013 2014 2015 2016 2016 data YTD as of 06/30/16 Source: Press releases 21
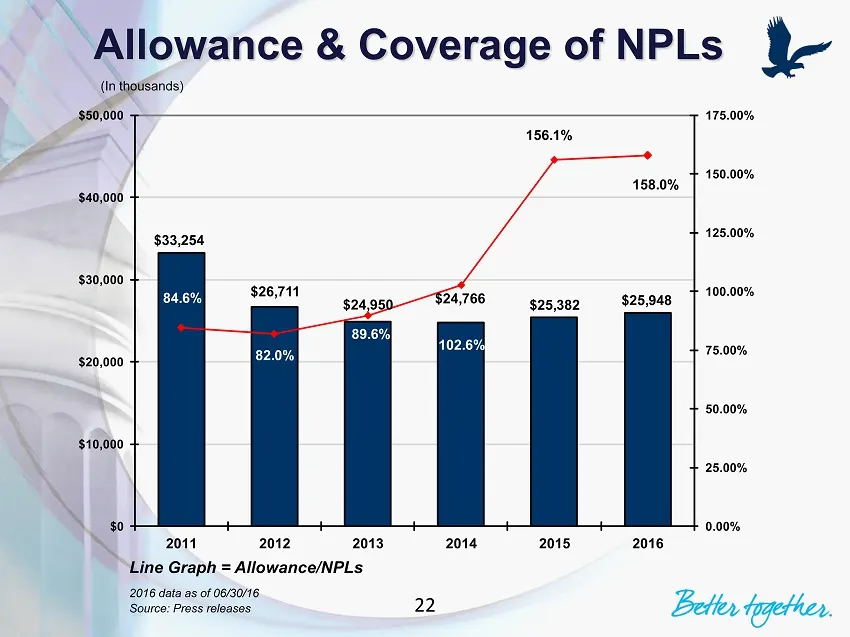
Slide 22: Allowance & Coverage of NPLs
Allowance & Coverage of NPLs $33,254 $26,711 $24,950 $24,766 $25,382 $25,948 84.6% 82.0% 89.6% 102.6% 156.1% 158.0% 0.00% 25.00% 50.00% 75.00% 100.00% 125.00% 150.00% 175.00% $0 $10,000 $20,000 $30,000 $40,000 $50,000 2011 2012 2013 2014 2015 2016 (In thousands) Line Graph = Allowance/NPLs Source :
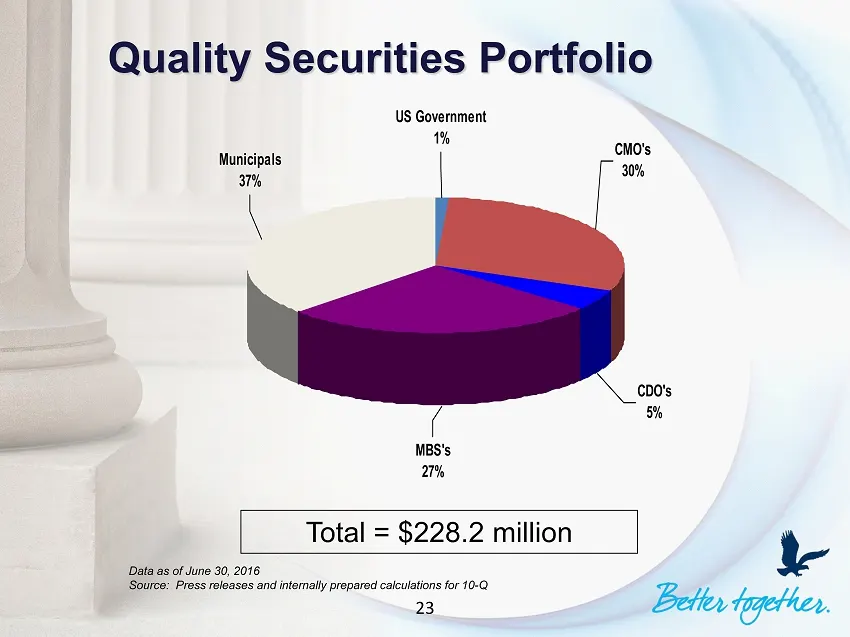
Slide 23: Quality Securities Portfolio
Quality Securities Portfolio US Government 1% CMO's 30% CDO's 5% MBS's 27% Municipals 37% Data as of June 30, 2016 Source: Press releases and internally prepared calculations for 10 - Q Total = $ 228.2 million 23
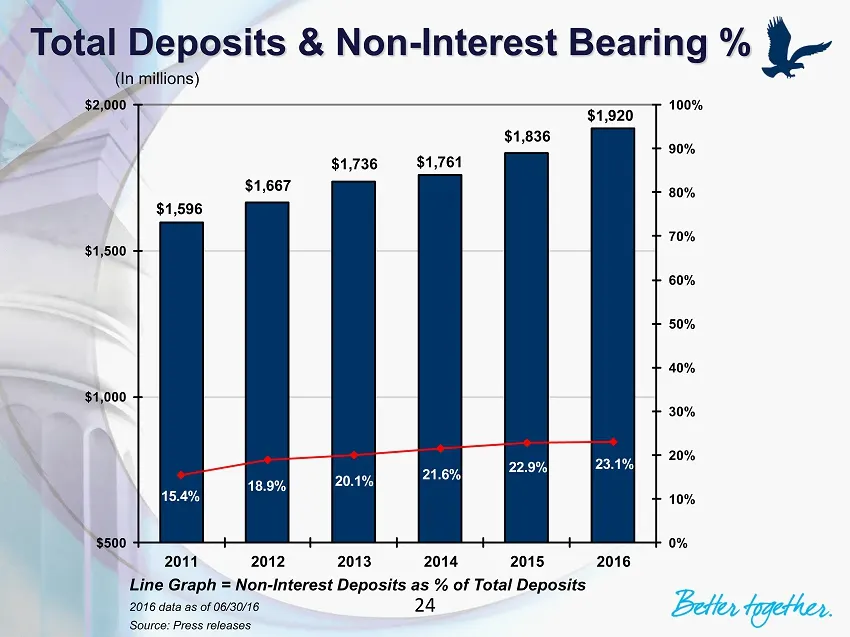
Slide 24: Total Deposits & Non-Interest Bearing %
Total Deposits & Non - Interest Bearing % $1,596 $1,667 $1,736 $1,761 $1,836 $1,920 20.1% 15.4% 18.9% 21.6% 22.9% 23.1% 0% 10% 20% 30% 40% 50% 60% 70% 80% 90% 100% $500 $1,000 $1,500 $2,000 2011 2012 2013 2014 2015 2016 (In millions) Line Graph = Non - Interest Deposits as % of Total Deposits Source
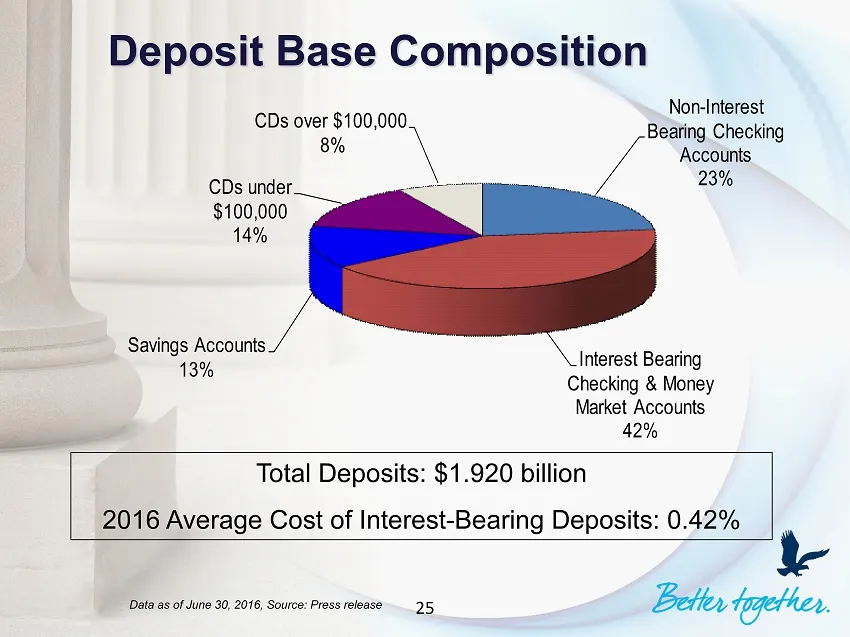
Slide 25: Deposit Base Composition
Deposit Base Composition Non - Interest Bearing Checking Accounts 23% Interest Bearing Checking & Money Market Accounts 42% Savings Accounts 13% CDs under $100,000 14% CDs over $100,000 8% Total Deposits: $ 1.920 billion 2016 Average Cost of Interest - Bearing Deposits: 0.42% Data as of June 30, 201
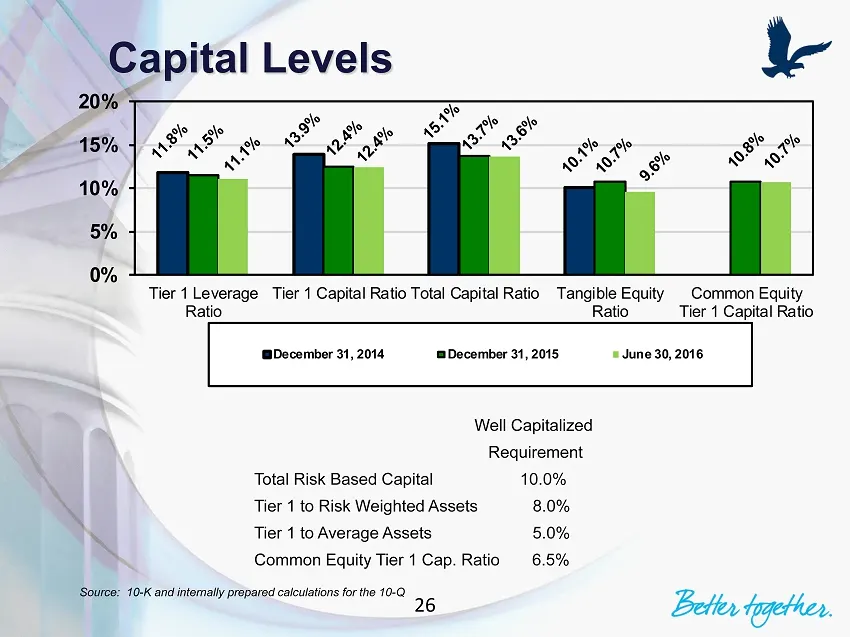
Slide 26: Capital Levels
Capital Levels 0% 5% 10% 15% 20% Tier 1 Leverage Ratio Tier 1 Capital Ratio Total Capital Ratio Tangible Equity Ratio Common Equity Tier 1 Capital Ratio December 31, 2014 December 31, 2015 June 30, 2016 Well Capitalized Requirement Total Risk Based Capital 10.0% Tier 1 to Risk Weighted Assets 8.0% T
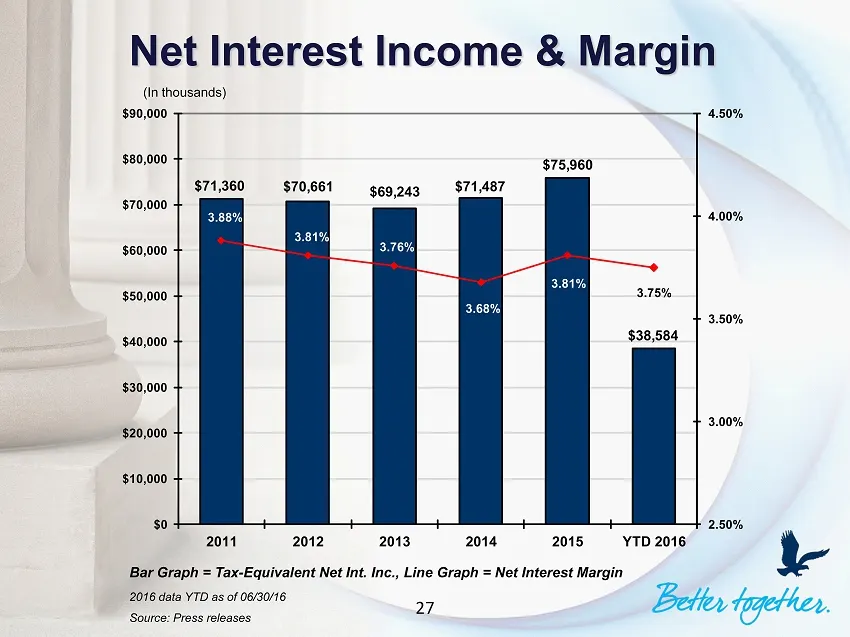
Slide 27: Net Interest Income & Margin
Net Interest Income & Margin $71,360 $70,661 $69,243 $71,487 $75,960 $38,584 3.88% 3.81% 3.76% 3.68% 3.81% 3.75% 2.50% 3.00% 3.50% 4.00% 4.50% $0 $10,000 $20,000 $30,000 $40,000 $50,000 $60,000 $70,000 $80,000 $90,000 2011 2012 2013 2014 2015 YTD 2016 (In thousands) Bar Graph = Tax - Equivalent Net
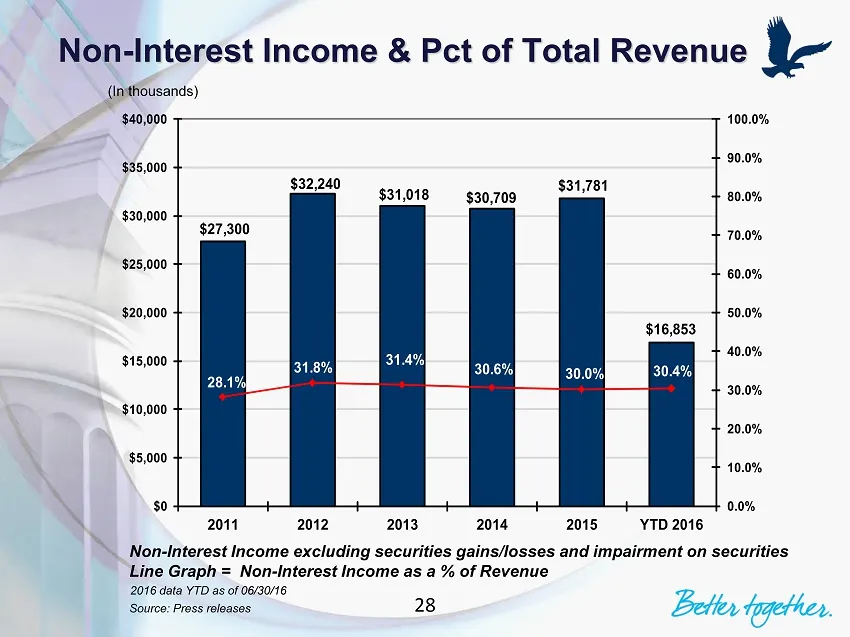
Slide 28: Non-Interest Income & Pct of Total Revenue
Non - Interest Income & Pct of Total Revenue $27,300 $32,240 $31,018 $30,709 $31,781 $16,853 28.1% 31.8% 31.4% 30.6% 30.0% 30.4% 0.0% 10.0% 20.0% 30.0% 40.0% 50.0% 60.0% 70.0% 80.0% 90.0% 100.0% $0 $5,000 $10,000 $15,000 $20,000 $25,000 $30,000 $35,000 $40,000 2011 2012 2013 2014 2015 YTD 2016 (In t
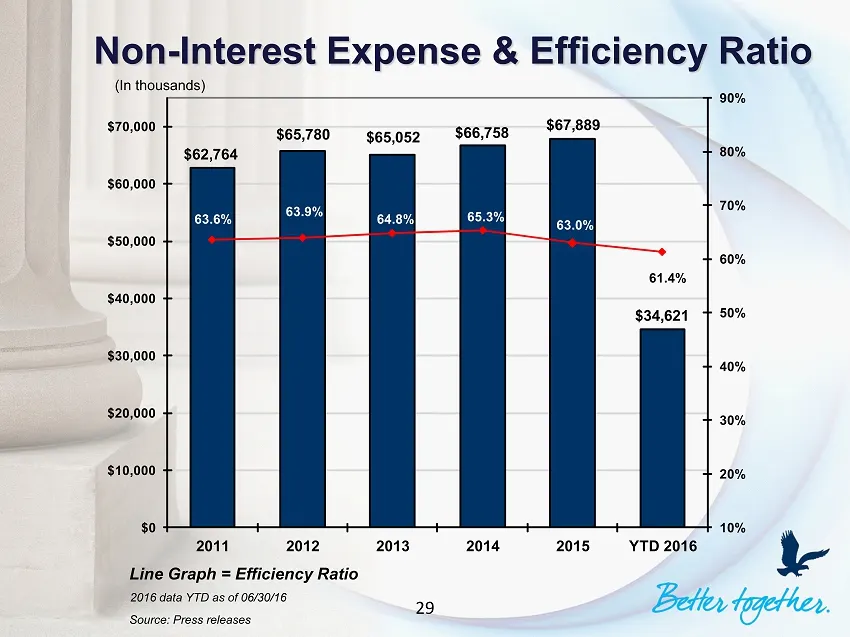
Slide 29: Non-Interest Expense & Efficiency Ratio
Non - Interest Expense & Efficiency Ratio $62,764 $65,780 $65,052 $66,758 $67,889 $34,621 63.6% 63.9% 64.8% 65.3% 63.0% 61.4% 10% 20% 30% 40% 50% 60% 70% 80% 90% $0 $10,000 $20,000 $30,000 $40,000 $50,000 $60,000 $70,000 2011 2012 2013 2014 2015 YTD 2016 (In thousands) Line Graph = Efficiency Ratio
Slide 30: Return On Equity & ROTE
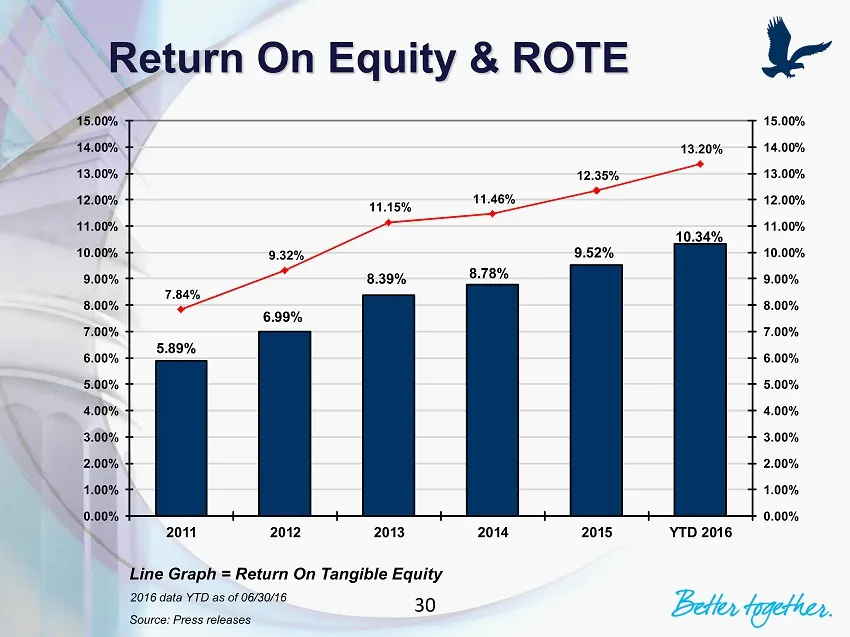
Return On Equity & ROTE 5.89% 6.99% 8.39% 8.78% 9.52% 10.34% 7.84% 9.32% 11.15% 11.46% 12.35% 13.20% 0.00% 1.00% 2.00% 3.00% 4.00% 5.00% 6.00% 7.00% 8.00% 9.00% 10.00% 11.00% 12.00% 13.00% 14.00% 15.00% 0.00% 1.00% 2.00% 3.00% 4.00% 5.00% 6.00% 7.00% 8.00% 9.00% 10.00% 11.00% 12.00% 13.00% 14.00% 15

Slide 31: Pending Merger
Pending Merger 31
Slide 32: Commercial Bancshares Overview
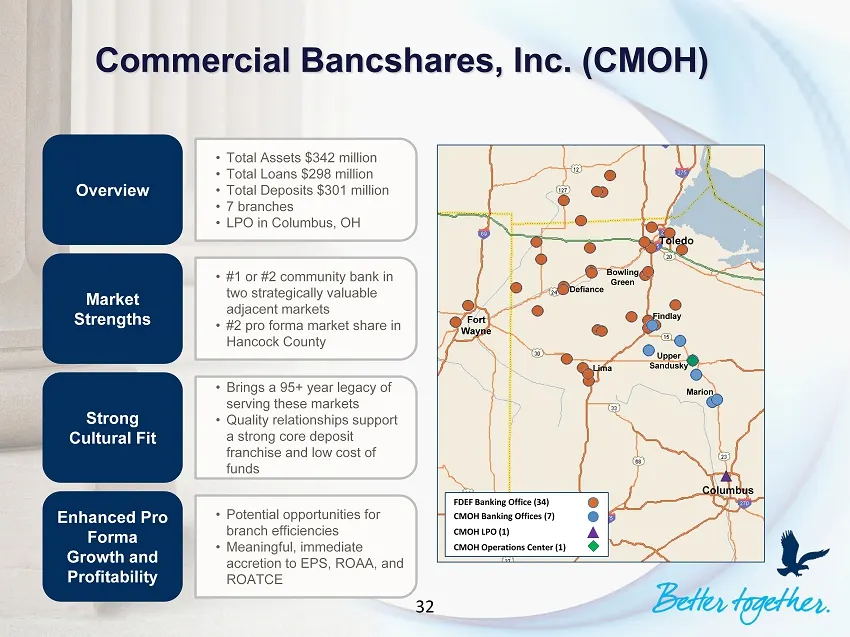
Overview Market Strengths Enhanced Pro Forma Growth and Profitability • Total Assets $342 million • Total Loans $298 million • Total Deposits $301 million • 7 branches • LPO in Columbus, OH • Potential opportunities for branch efficiencies • Meaningful, immediate accretion to EPS, ROAA, and ROATCE •
Slide 33: Pro Forma Loan and Deposit Composition
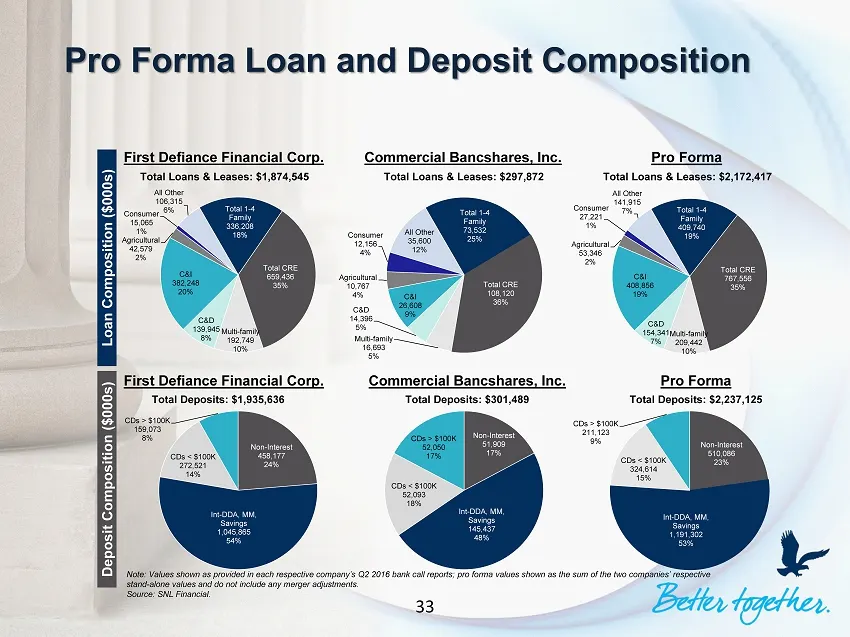
Total 1 - 4 Family 409,740 19% Total CRE 767,556 35% Multi - family 209,442 10% C&D 154,341 7% C&I 408,856 19% Agricultural 53,346 2% Consumer 27,221 1% All Other 141,915 7% Non - Interest 510,086 23% Int - DDA, MM, Savings 1,191,302 53% CDs < $100K 324,614 15% CDs > $100K 211,123 9% Non - Interest
Slide 34: CMOH: Transaction Summary
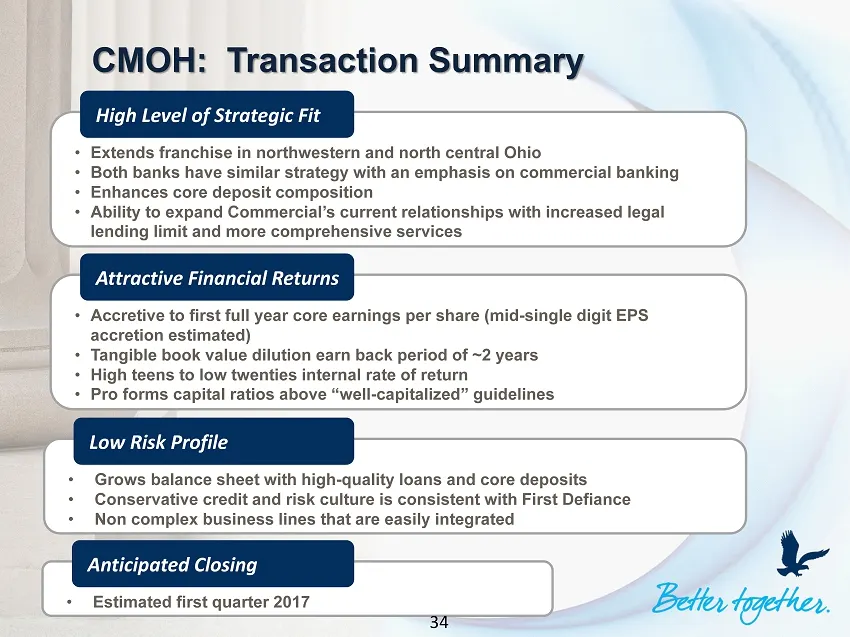
CMOH: Transaction Summary 34 • Extends franchise in northwestern and north central Ohio • Both banks have similar strategy with an emphasis on commercial banking • Enhances core deposit composition • Ability to expand Commercial’s current relationships with increased legal lending limit and more com
Slide 35: Shareholder Value
~< _ Shareholder Value
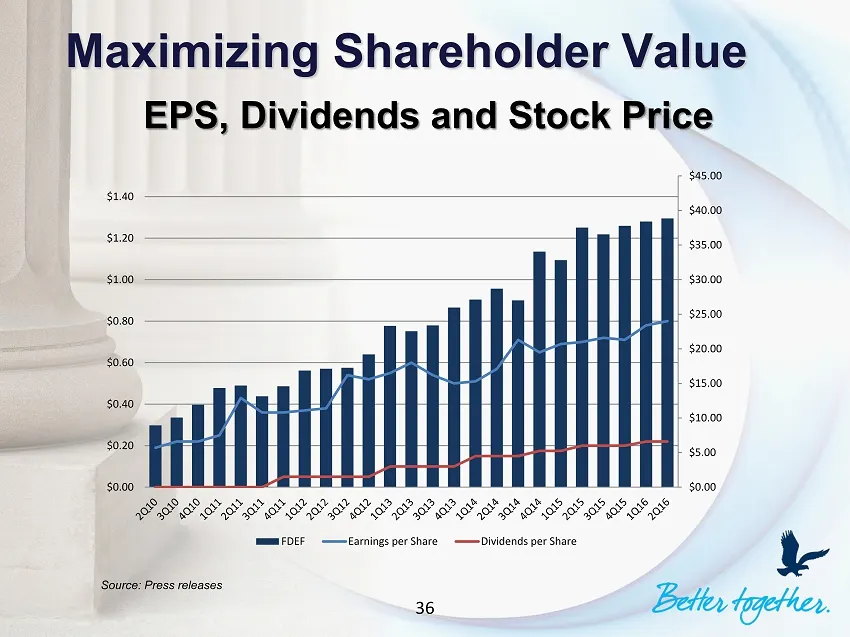
Slide 36: Maximizing Shareholder Value: EPS, Dividends and Stock Price
Maximizing Shareholder Value EPS, Dividends and Stock Price Source: Press releases $0.00 $5.00 $10.00 $15.00 $20.00 $25.00 $30.00 $35.00 $40.00 $45.00 $0.00 $0.20 $0.40 $0.60 $0.80 $1.00 $1.20 $1.40 FDEF Earnings per Share Dividends per Share 36
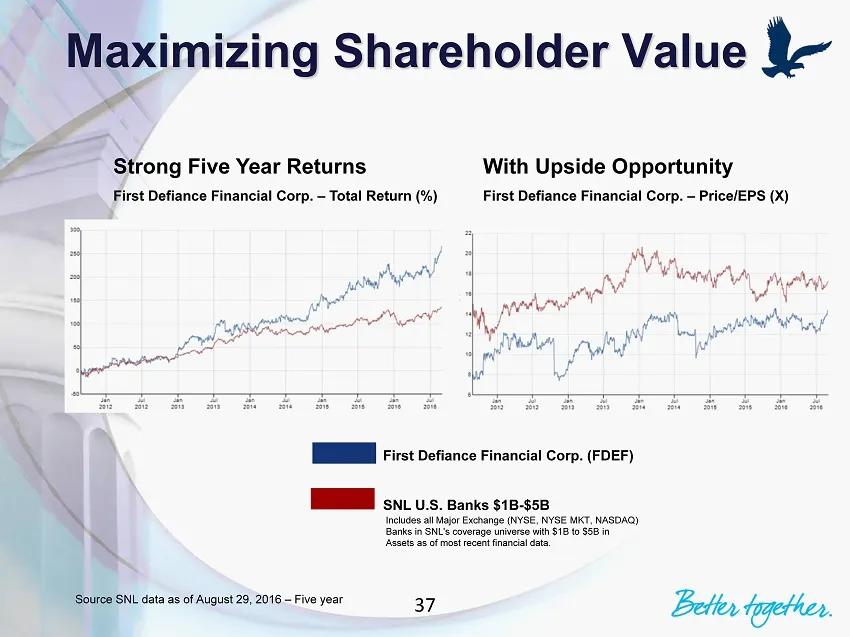
Slide 37: Maximizing Shareholder Value: Strong Five Year Returns
Maximizing Shareholder Value Strong Five Year Returns First Defiance Financial Corp. – Total Return (%) With Upside Opportunity First Defiance Financial Corp. – Price/EPS (X) First Defiance Financial Corp. (FDEF) SNL U.S. Banks $1B - $5B Includes all Major Exchange (NYSE, NYSE MKT, NASDAQ) Banks in
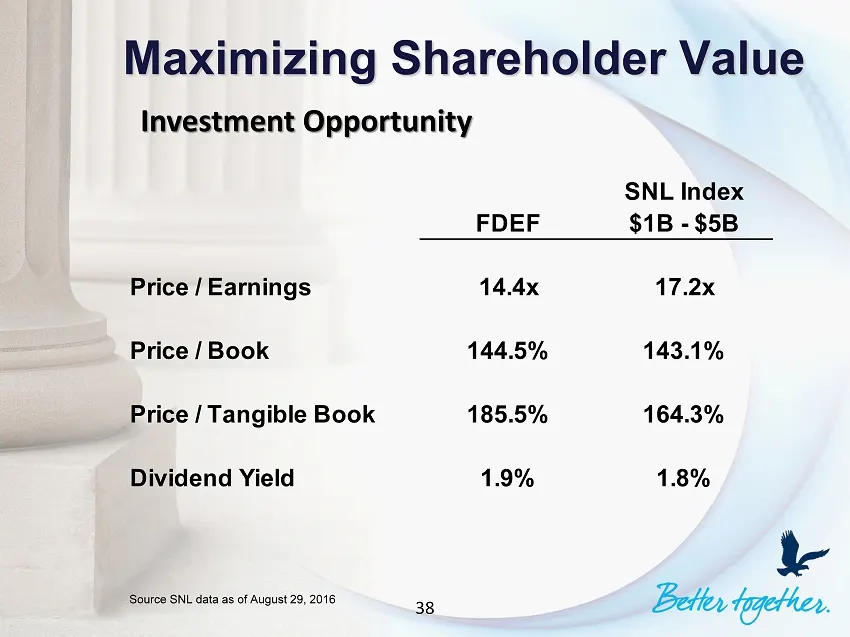
Slide 38: Maximizing Shareholder Value: Investment Opportunity
Maximizing Shareholder Value Source SNL data as of August 29, 2016 Investment Opportunity SNL Index FDEF $1B - $5B Price / Earnings 14.4x 17.2x Price / Book 144.5% 143.1% Price / Tangible Book 185.5% 164.3% Dividend Yield 1.9% 1.8% 38
Slide 39: Summary
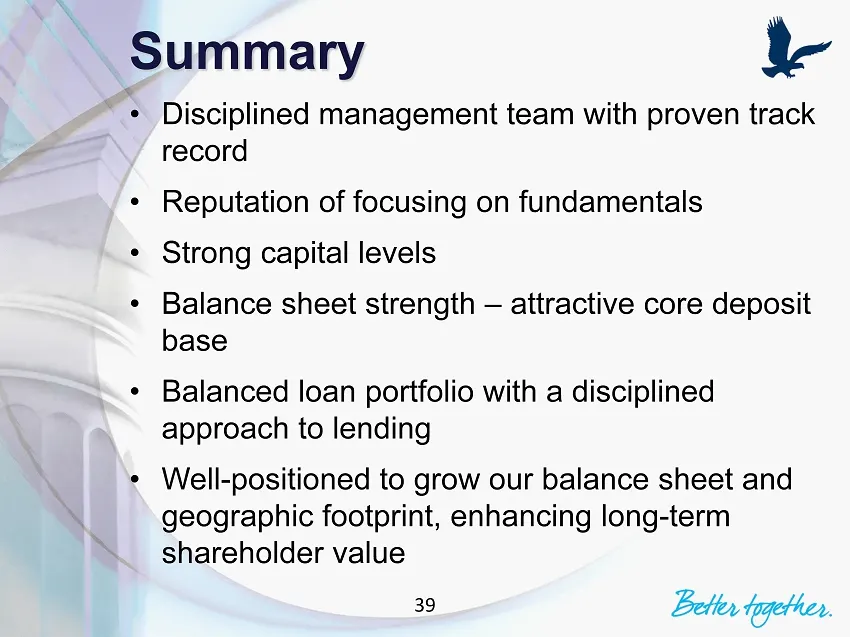
Summary • Disciplined management team with proven track record • Reputation of focusing on fundamentals • Strong capital levels • Balance sheet strength – attractive core deposit base • Balanced loan portfolio with a disciplined approach to lending • Well - positioned to grow our balance sheet and g

Slide 40: Contact Information
Contact Information Donald P. Hileman , President and CEO (419) 785 - 2210 dhileman@first - fed.com Kevin T. Thompson , Executive Vice President and CFO (419) 783 - 1098 kthompson@first - fed.com 40
Source: SEC EDGAR · 8-K filed Sep 7, 2016
More decks from Premier Financial Corp
 Investor Presentation (February 2025)51 slides · Feb 10, 2025
 Q4 2024 Earnings Presentation23 slides · Jan 22, 2025
 Q3 2024 Earnings Presentation50 slides · Nov 6, 2024
 Q3 2024 Earnings Presentation22 slides · Oct 23, 2024
 Investor Presentation (August 2024)54 slides · Aug 30, 2024
 Merger or Acquisition (July 2024)39 slides · Jul 26, 2024