Comerica — Comerica Inc /New/ — Credit Suisse Financial Services Forum 2015
17 slides from Comerica's conference presentation, Feb 6, 2015

Slide 1: Credit Suisse Financial Services Forum
Comerica Incorporated Credit Suisse Financial Services ForumFebruary 10, 2015 Karen ParkhillVice Chairman and Chief Financial Officer Judy LovePresident, Comerica Bank -California Market 2 Safe Harbor Statement Any statements in this presentation that are not historical facts are forward-looking sta
Slide 2: Well Positioned in California
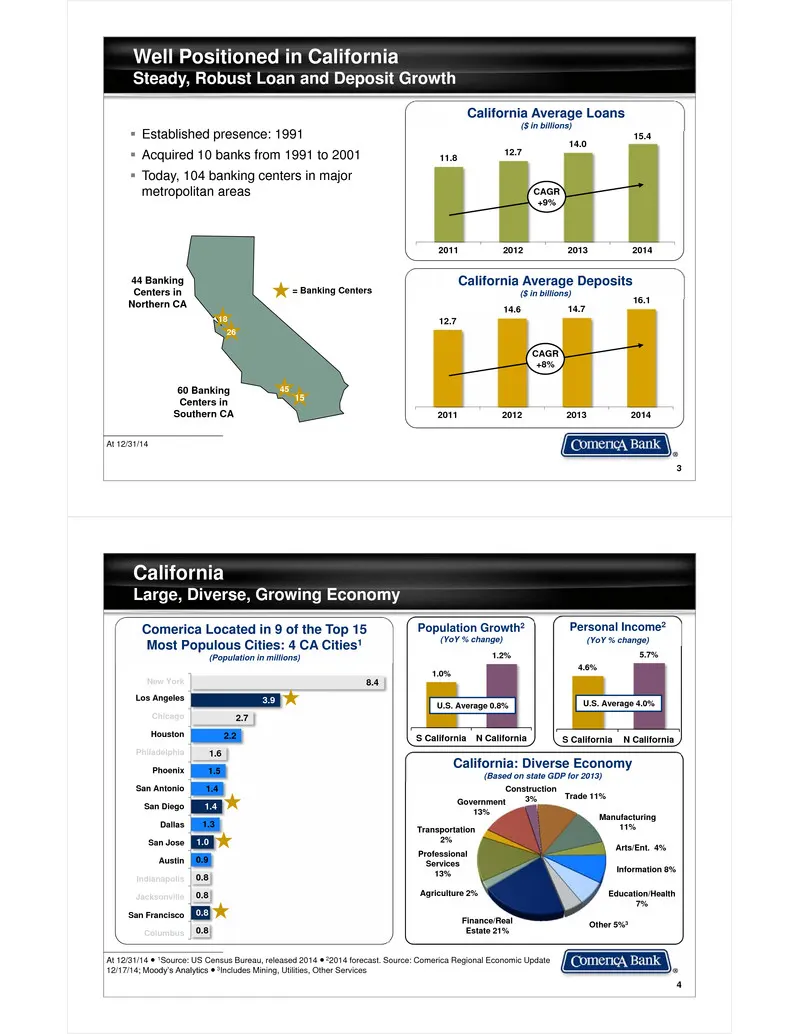
3 Well Positioned in California Steady, Robust Loan and Deposit Growth At 12/31/14 Established presence: 1991 Acquired 10 banks from 1991 to 2001 Today, 104 banking centers in major metropolitan areas 11.8 12.7 14.0 15.4 2011 2012 2013 2014 CAGR+9% California Average Loans($ in billions) Calif
Slide 3: California: Key Contributor to Comerica's Growth
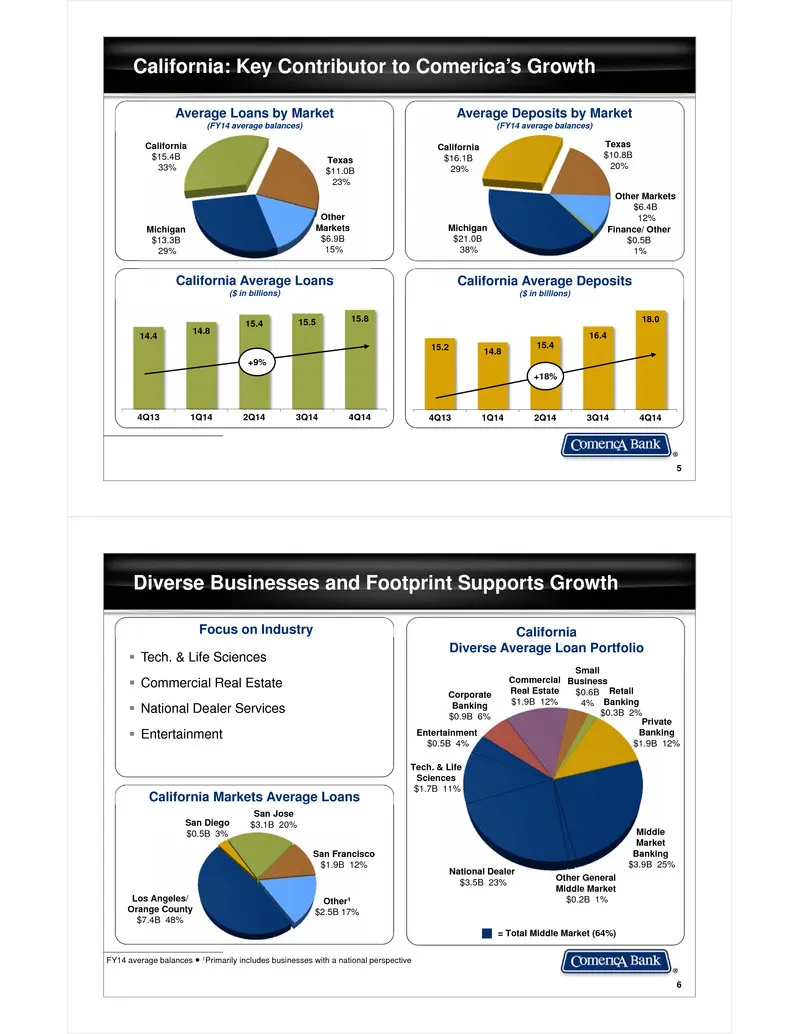
5 California: Key Contributor to Comerica’s Growth California$15.4B33% Texas$11.0B23% Michigan$13.3B29% Other Markets$6.9B15% Average Loans by Market(FY14 average balances) Average Deposits by Market(FY14 average balances) California$16.1B29% Texas$10.8B20% Michigan$21.0B38% Other Markets$6.4B12%Fin
Slide 4: Middle Market Banking California
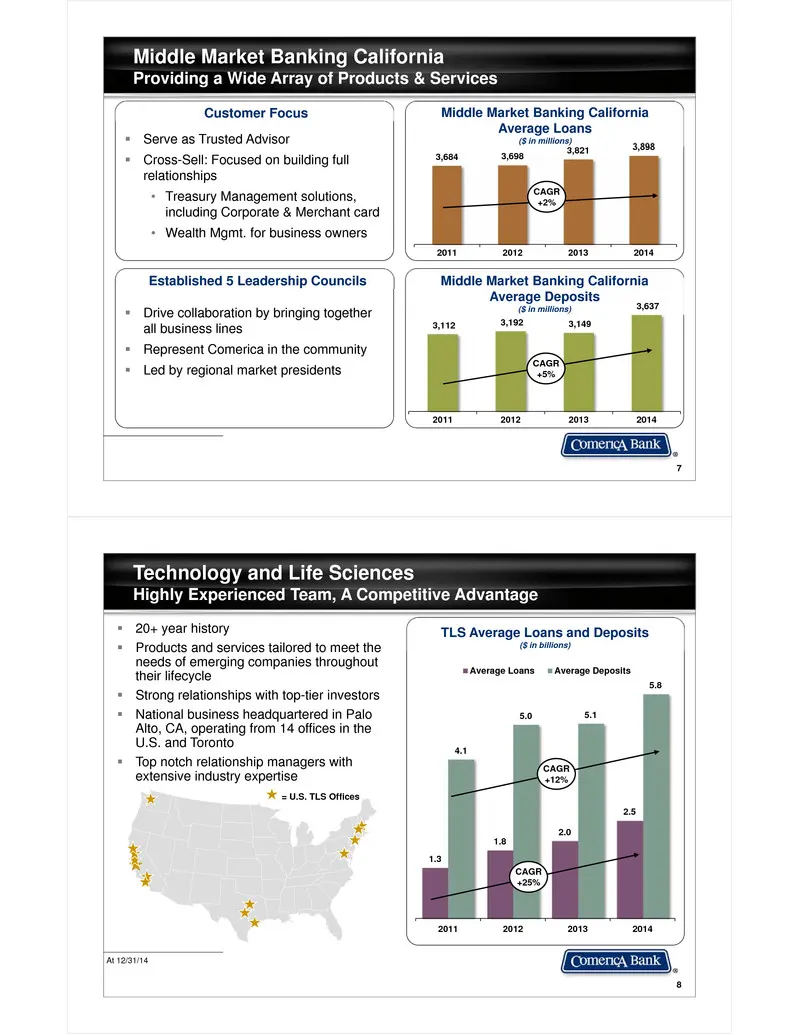
7 3,684 3,698 3,821 3,898 2011 2012 2013 2014 Middle Market Banking CaliforniaProviding a Wide Array of Products & Services Middle Market Banking CaliforniaAverage Loans($ in millions) Middle Market Banking CaliforniaAverage Deposits($ in millions) 3,112 3,192 3,149 3,637 2011 2012 2013 2014 Serve
Slide 5: Technology & Life Sciences Customer Segment Overview
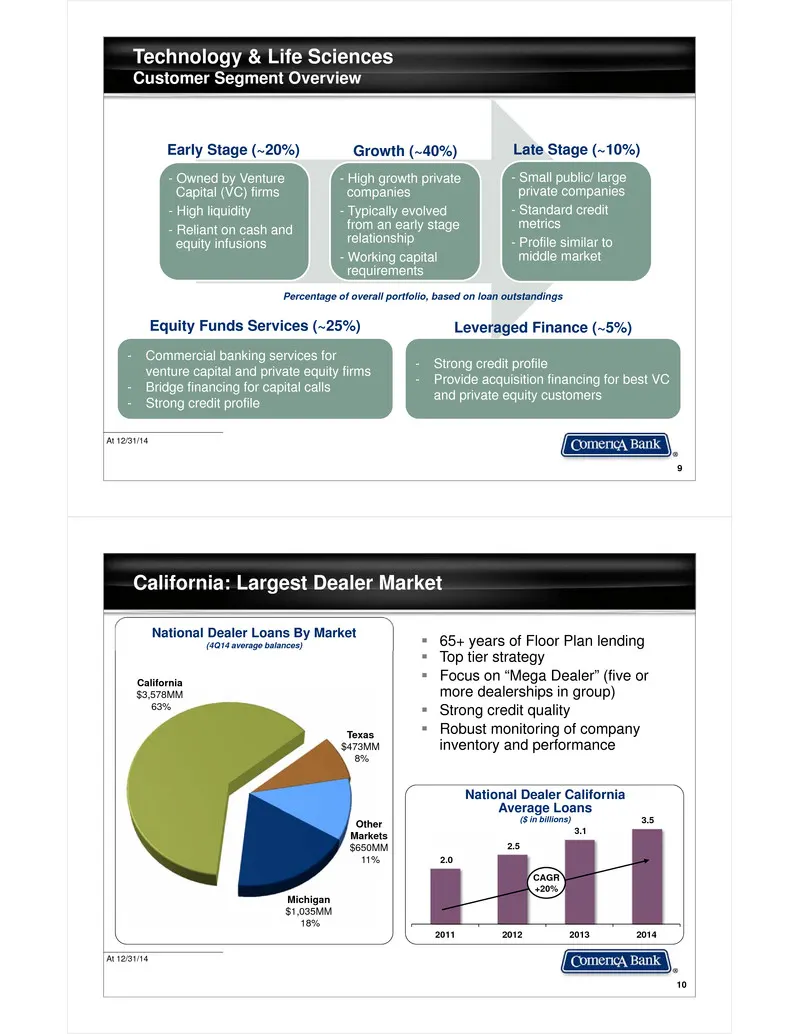
- Owned by Venture Capital (VC) firms- High liquidity- Reliant on cash and equity infusions - High growth private companies- Typically evolved from an early stage relationship - Working capital requirements - Small public/ large private companies- Standard credit metrics - Profile similar to middle
Slide 6: Commercial Real Estate Line of Business
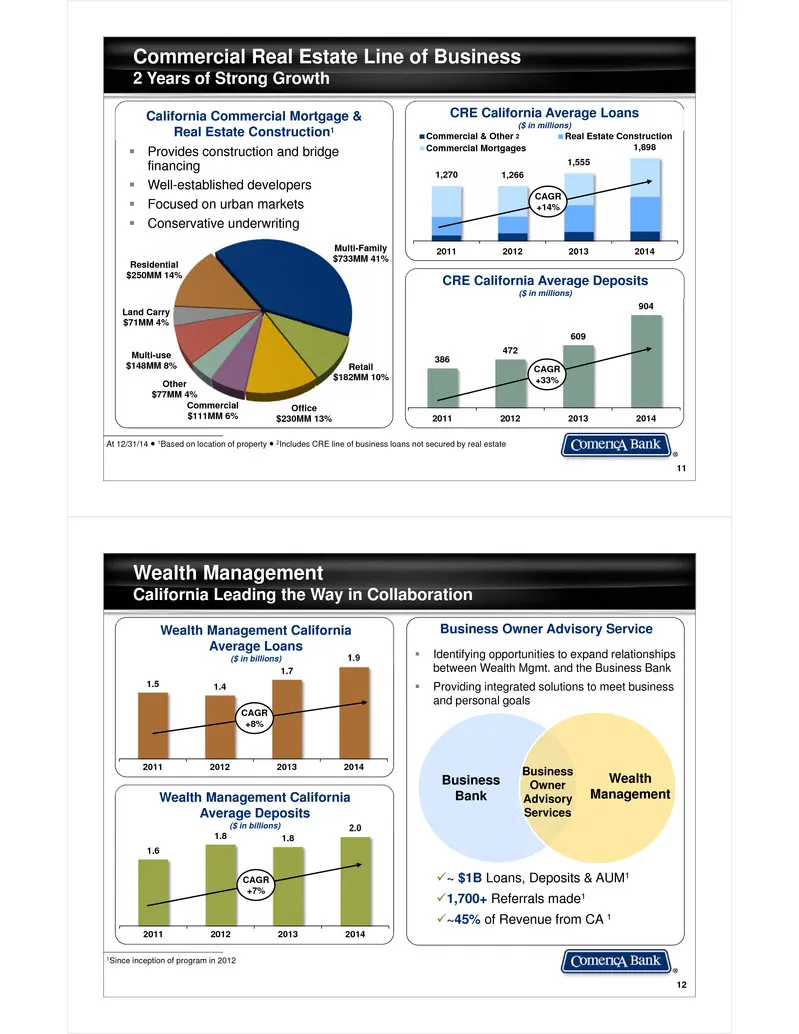
11 Commercial Real Estate Line of Business2 Years of Strong Growth At 12/31/14 ● 1Based on location of property ● 2Includes CRE line of business loans not secured by real estate Residential $250MM 14% Multi-Family $733MM 41% Retail$182MM 10% Office$230MM 13%Commercial$111MM 6% Other$77MM 4% Multi-us
Slide 7: Comerica Competitive Advantage
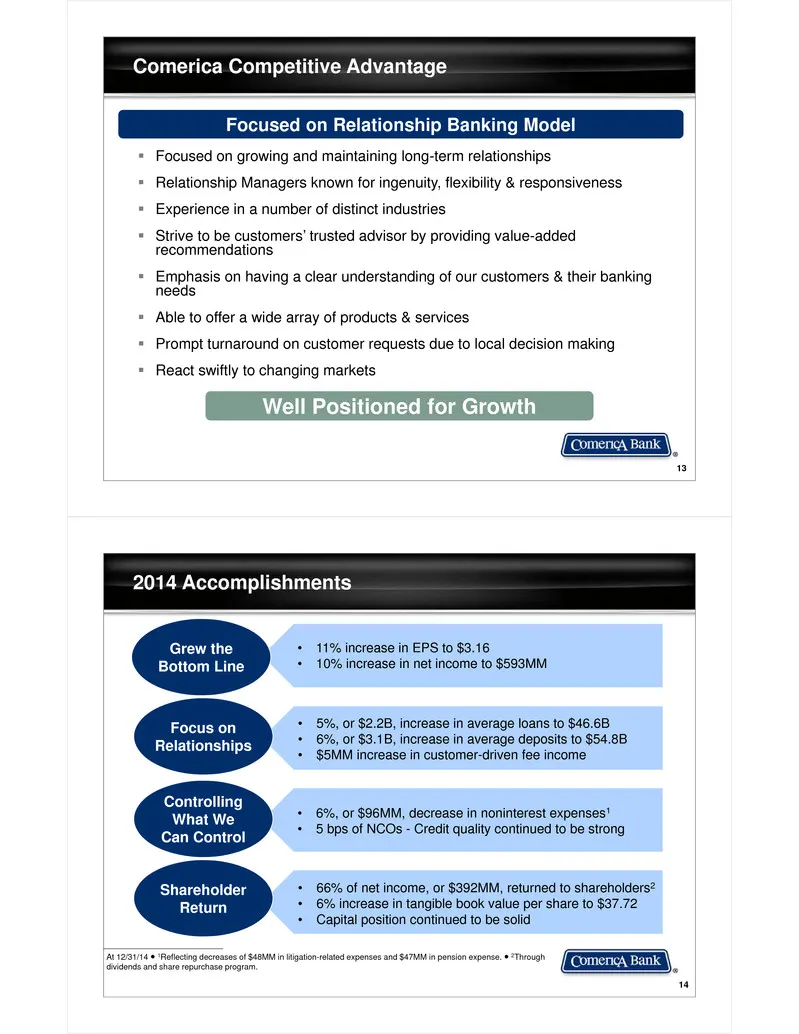
13 Comerica Competitive Advantage Focused on growing and maintaining long-term relationships Relationship Managers known for ingenuity, flexibility & responsiveness Experience in a number of distinct industries Strive to be customers’ trusted advisor by providing value-added recommendations
Slide 8: Loan Growth Outpaces Peers
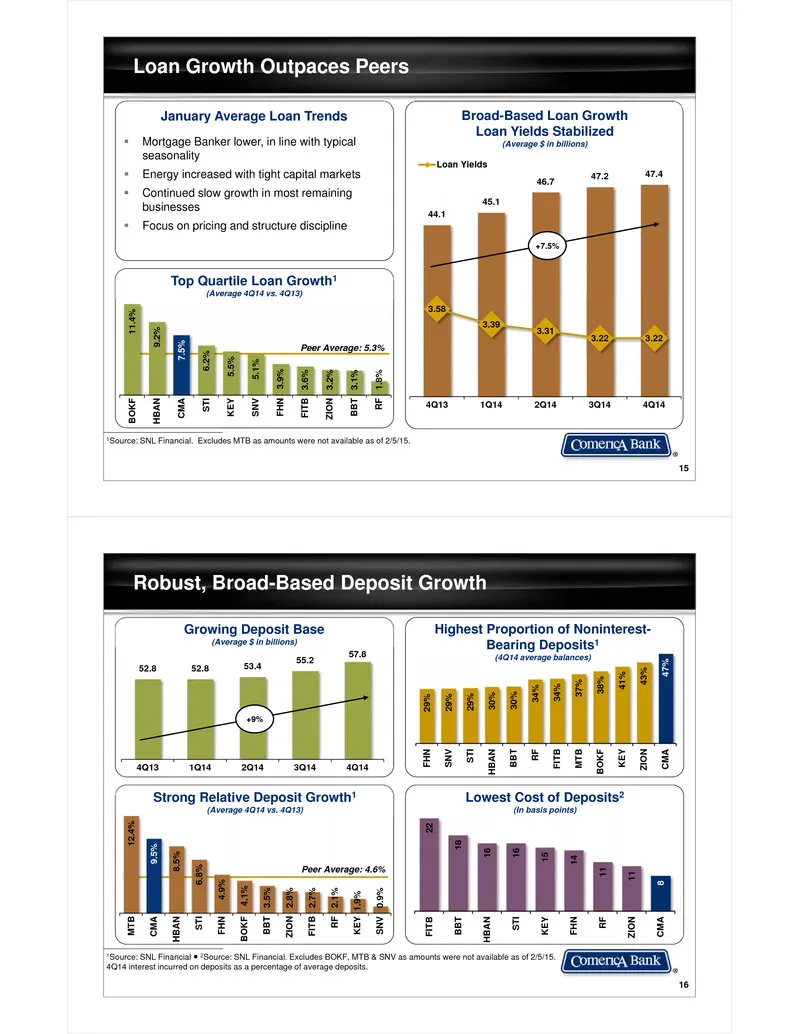
15 Loan Growth Outpaces Peers 1Source: SNL Financial. Excludes MTB as amounts were not available as of 2/5/15. 44.1 45.1 46.7 47.2 47.4 3.58 3.39 3.31 3.22 3.22 4Q13 1Q14 2Q14 3Q14 4Q14 Loan Yields Broad-Based Loan GrowthLoan Yields Stabilized(Average $ in billions) January Average Loan Trends Mor
Slide 9: Managing Expenses
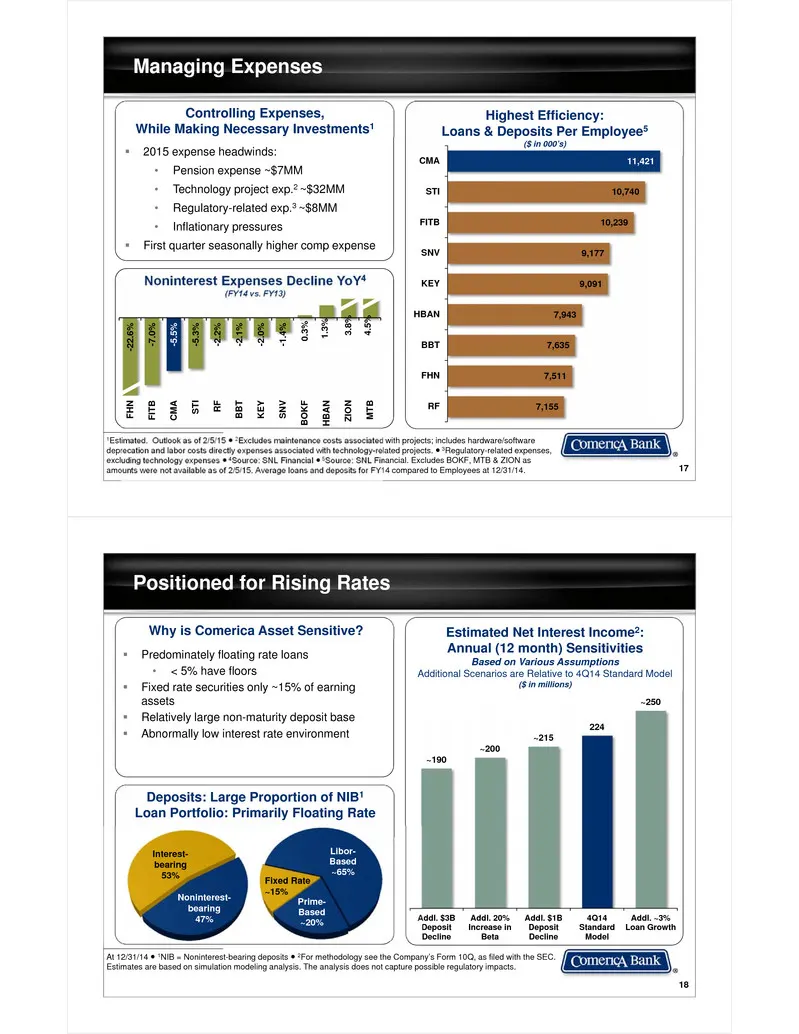
17 Managing Expenses 1Estimated. Outlook as of 2/5/15 ● 2Excludes maintenance costs associated with projects; includes hardware/software deprecation and labor costs directly expenses associated with technology-related projects. ● 3Regulatory-related expenses, excluding technology expenses ● 4Source:
Slide 10: Active Capital Management
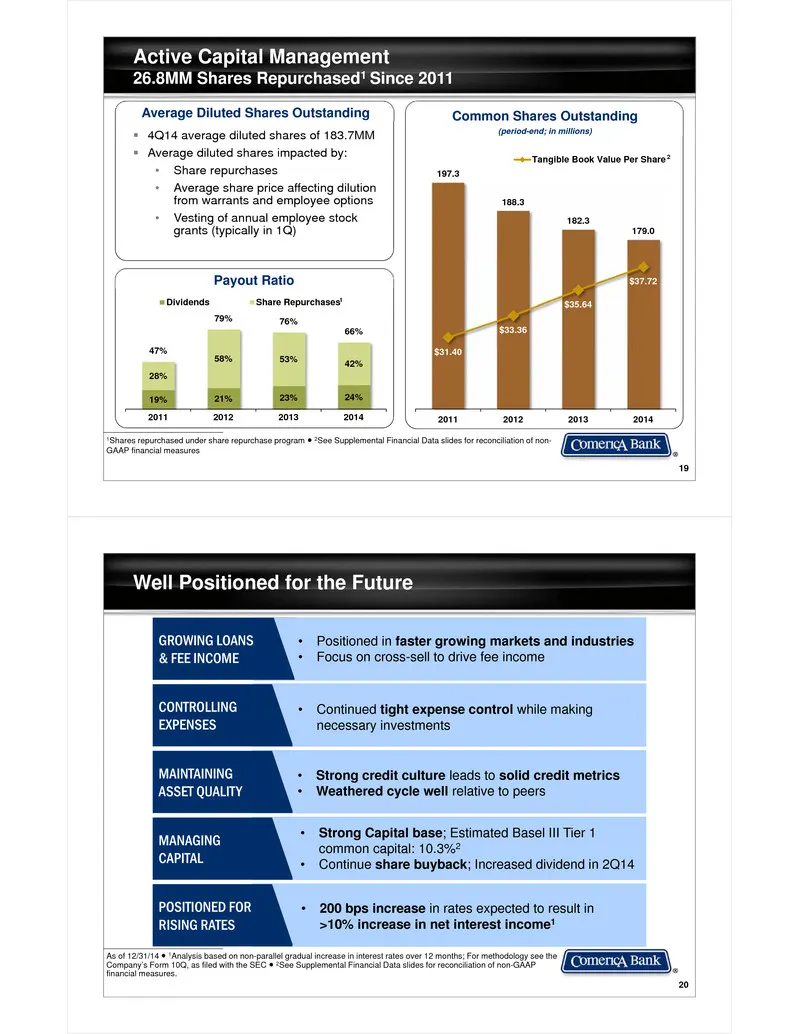
19 Active Capital Management26.8MM Shares Repurchased1 Since 2011 1Shares repurchased under share repurchase program ● 2See Supplemental Financial Data slides for reconciliation of non-GAAP financial measures 19% 21% 23% 24% 28% 58% 53% 42%47% 79% 76% 66% 2011 2012 2013 2014 Dividends Share Repurcha
Slide 11: Loans by Business and Market
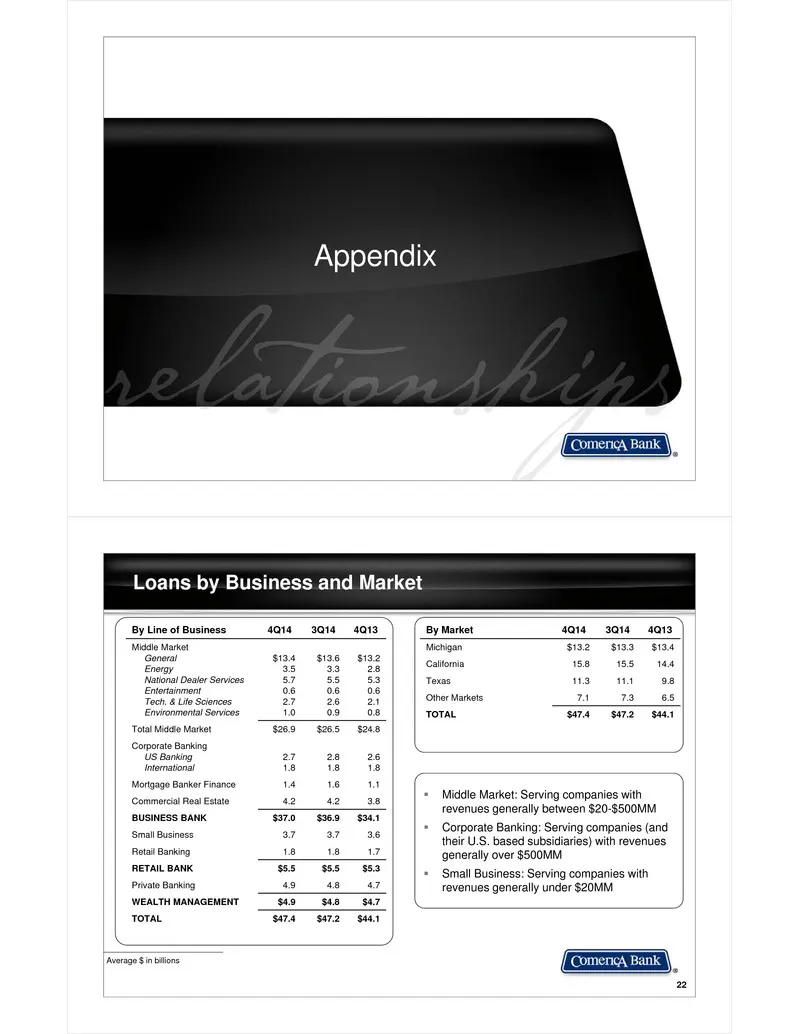
Appendix 22 Loans by Business and Market Average $ in billions Middle Market: Serving companies with revenues generally between $20-$500MM Corporate Banking: Serving companies (and their U.S. based subsidiaries) with revenues generally over $500MM Small Business: Serving companies with revenue
Slide 12: Deposits by Business and Market
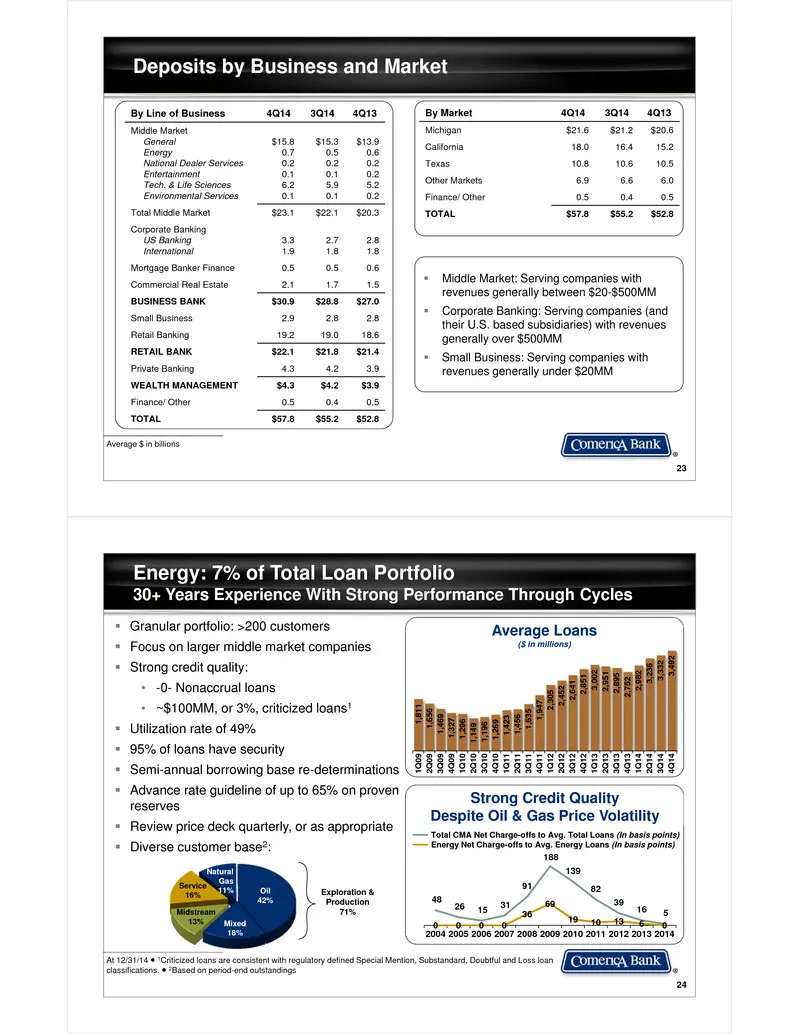
23 Deposits by Business and Market Average $ in billions Middle Market: Serving companies with revenues generally between $20-$500MM Corporate Banking: Serving companies (and their U.S. based subsidiaries) with revenues generally over $500MM Small Business: Serving companies with revenues gene
Slide 13: Mortgage Banker Finance
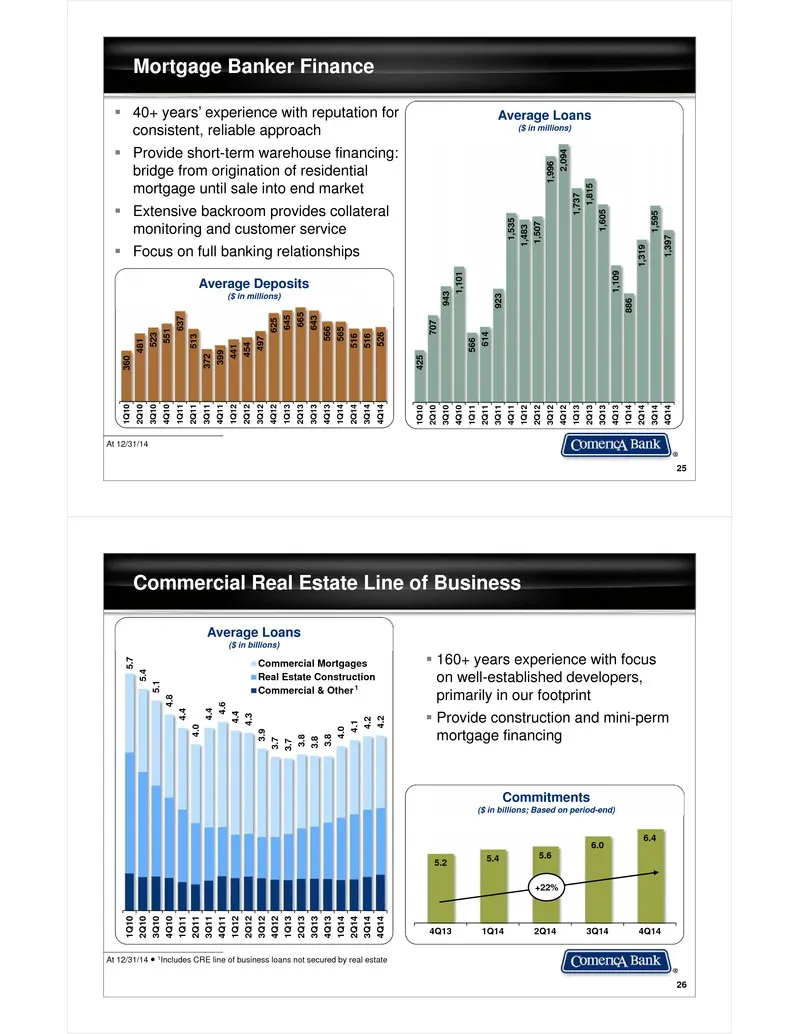
25 Mortgage Banker Finance Average Deposits($ in millions) 40+ years’ experience with reputation for consistent, reliable approach Provide short-term warehouse financing: bridge from origination of residential mortgage until sale into end market Extensive backroom provides collateral monitorin
Slide 14: Shared National Credit (SNC) Relationships
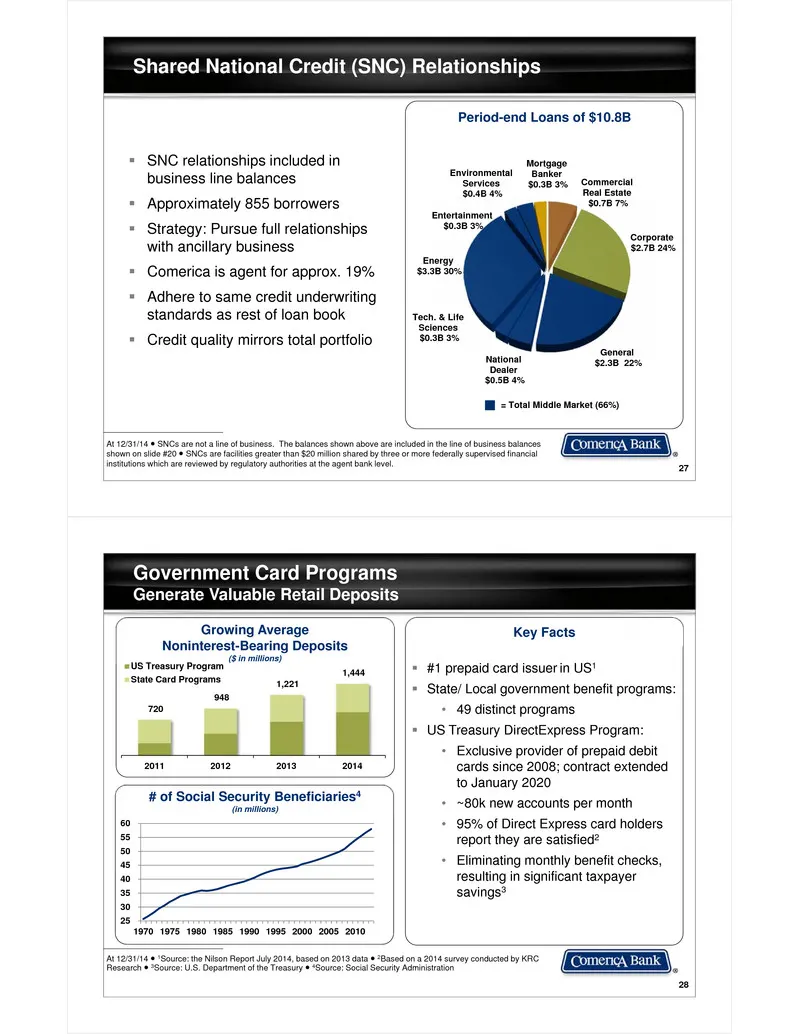
27 Shared National Credit (SNC) Relationships At 12/31/14 ● SNCs are not a line of business. The balances shown above are included in the line of business balances shown on slide #20 ● SNCs are facilities greater than $20 million shared by three or more federally supervised financial institutions wh
Slide 15: Funding and Maturity Profile
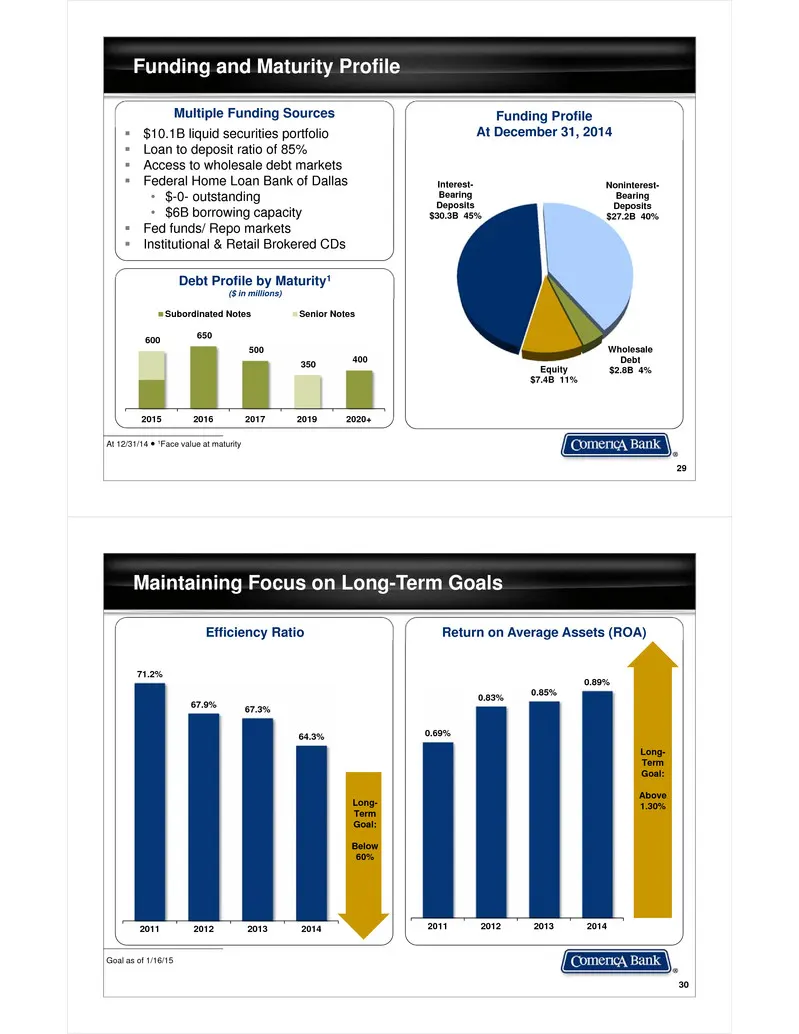
29 Funding and Maturity Profile At 12/31/14 ● 1Face value at maturity $10.1B liquid securities portfolio Loan to deposit ratio of 85% Access to wholesale debt markets Federal Home Loan Bank of Dallas• $-0- outstanding • $6B borrowing capacity Fed funds/ Repo markets Institutional & Retai
Slide 16: Holding Company Debt Rating
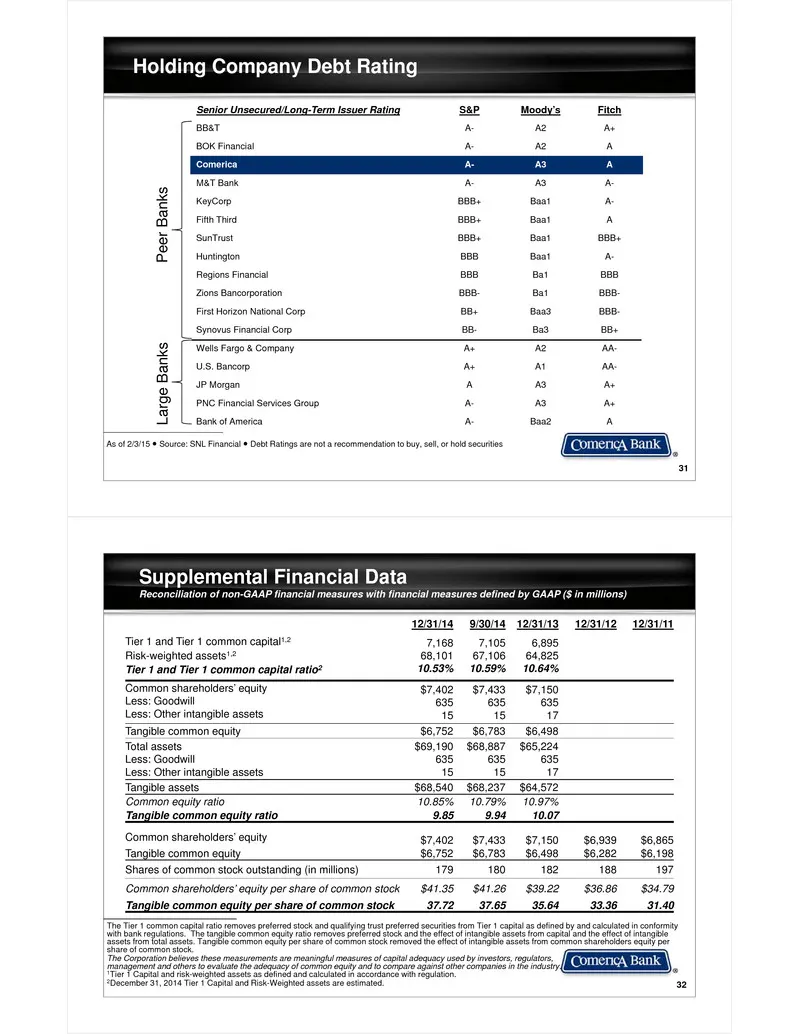
31 Holding Company Debt Rating As of 2/3/15 ● Source: SNL Financial ● Debt Ratings are not a recommendation to buy, sell, or hold securities Senior Unsecured/Long-Term Issuer Rating S&P Moody’s Fitch BB&T A- A2 A+ BOK Financial A- A2 A Comerica A- A3 A M&T Bank A- A3 A- KeyCorp BBB+ Baa1 A- Fifth Th
Slide 17: Supplemental Financial Data: Tier 1 Common Equity under Basel III
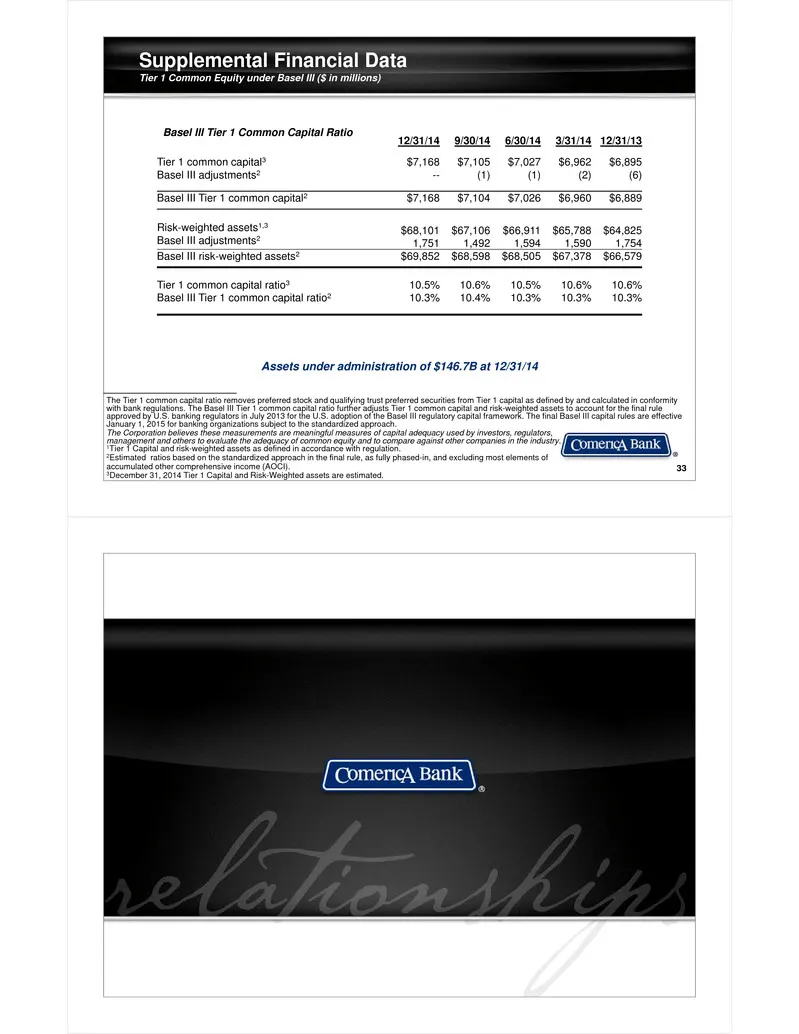
Supplemental Financial DataTier 1 Common Equity under Basel III ($ in millions) 33 The Tier 1 common capital ratio removes preferred stock and qualifying trust preferred securities from Tier 1 capital as defined by and calculated in conformity with bank regulations. The Basel III Tier 1 common capit
Source: SEC EDGAR · 8-K filed Feb 6, 2015
More decks from Comerica Incorporated
 Goldman Sachs Financial Services Conference 202520 slides · Dec 11, 2025
 Merger or Acquisition (October 2025)18 slides · Oct 6, 2025
 Barclays Global Financial Services Conference 202524 slides · Sep 8, 2025
 Q2 2025 Earnings Presentation24 slides · Jul 18, 2025
 Q1 2025 Earnings Presentation21 slides · Apr 21, 2025
 Q4 2024 Earnings Presentation24 slides · Jan 22, 2025