Lonestar Resources US — J.P. Morgan Energy Conference 2018
23 slides from Lonestar Resources US's conference presentation, Jun 18, 2018
Slide 1: Lonestar Resources US, Inc. J.P. Morgan Energy Conference
Lonestar Resources US, Inc. J.P. Morgan Energy Conference June 18, 2018
Slide 2: Disclaimer and Forward Looking Statements
Disclaimer and Forward Looking Statements Forward Looking Statements The information in this presentation includes “forward-looking statements” that are made pursuant to the Safe Harbor Provisions of the Private Securities Litigation Reform Act of 1995. All statements, other than statements of histo
Slide 3: Experienced Management Team
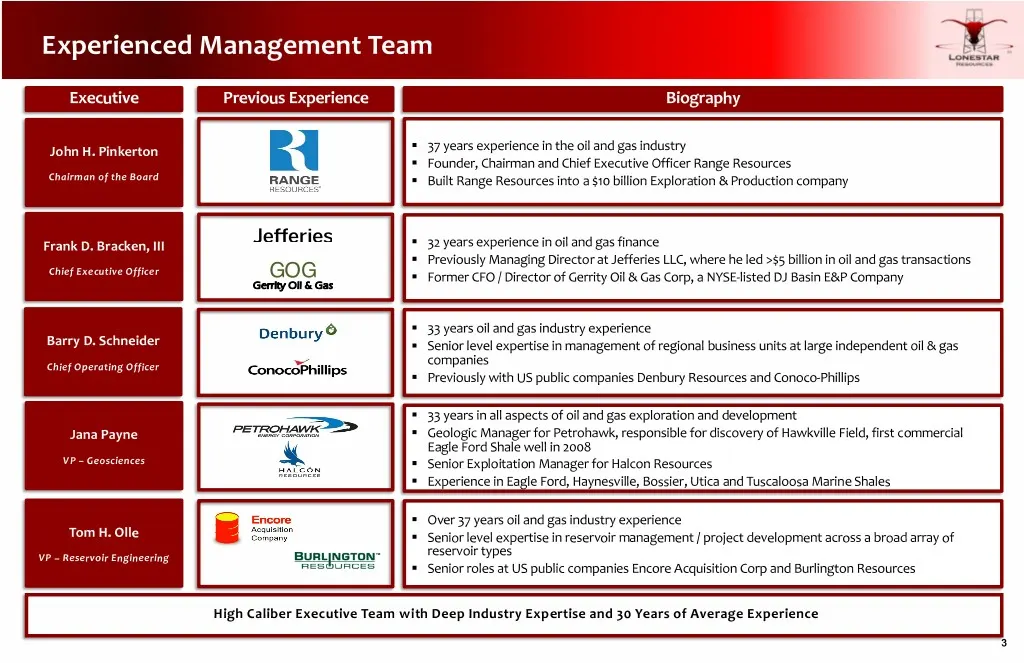
Experienced Management Team Executive Previous Experience Biography John H. Pinkerton § 37 years experience in the oil and gas industry § Founder, Chairman and Chief Executive Officer Range Resources Chairman of the Board § Built Range Resources into a $10 billion Exploration & Production company Fr
Slide 4: Company Profile
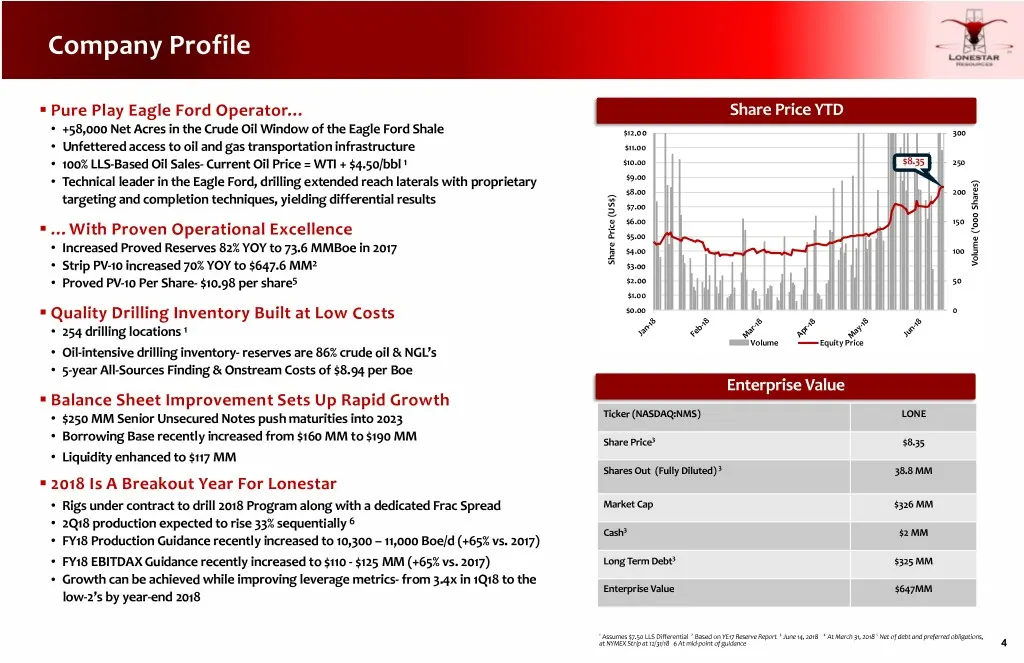
Company Profile § Pure Play Eagle Ford Operator… Share Price YTD • +58,000 Net Acres in the Crude Oil Window of the Eagle Ford Shale $12.00 300 • Unfettered access to oil and gas transportation infrastructure $11.00 • 100% LLS-Based Oil Sales- Current Oil Price = WTI + $4.50/bbl 1 $10.00 $8.35 250 •
Slide 5: 2018 - A Breakout Year For Lonestar's Financials
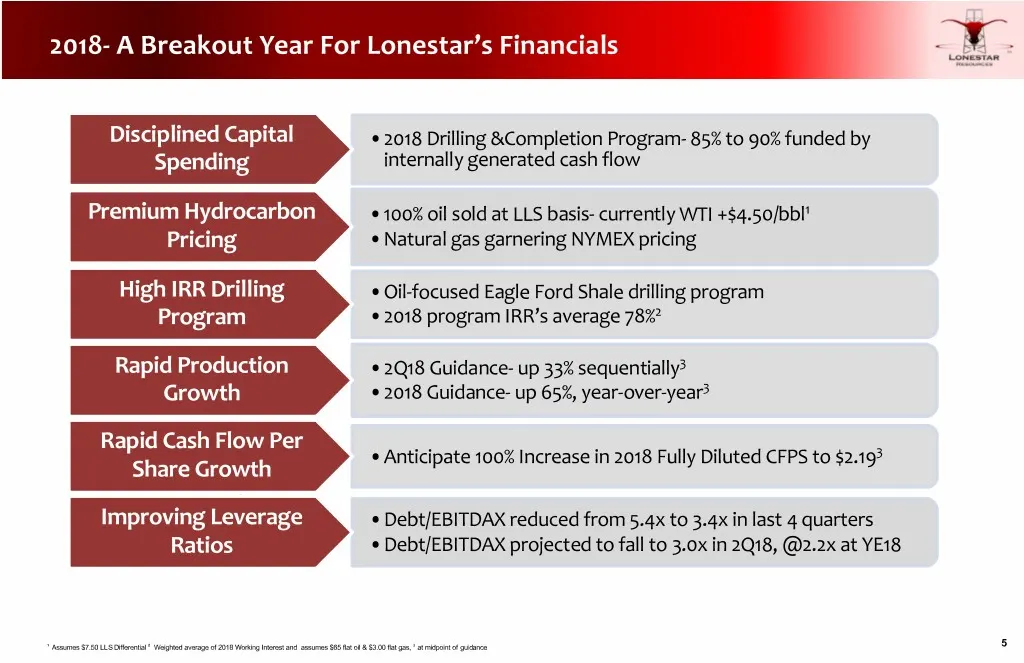
2018- A Breakout Year For Lonestar’s Financials Disciplined Capital •2018 Drilling &Completion Program- 85% to 90% funded by Spending internally generated cash flow Premium Hydrocarbon •100% oil sold at LLS basis- currently WTI +$4.50/bbl1 Pricing •Natural gas garnering NYMEX pricing High IRR Drilli
Slide 6: Lonestar's Footprint
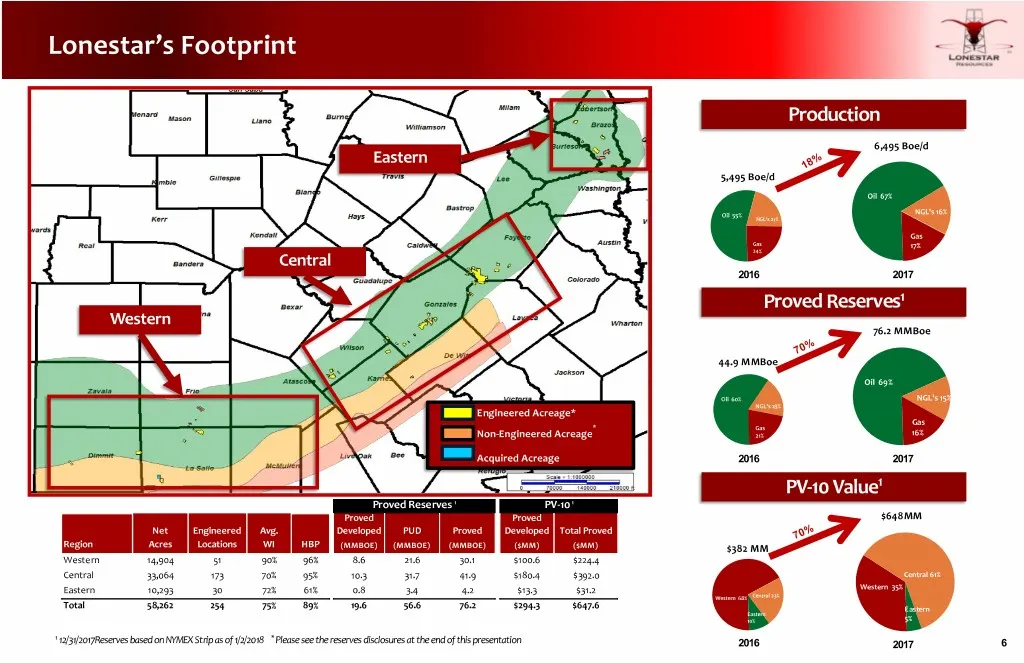
Lonestar’s Footprint Production 6,495 Boe/d Eastern 18% 5,495 Boe/d Oil 67% Oil 55% NGL's 16% NGL's 21% Gas Gas 17% 24% Central 2016 2017 Proved Reserves1 Western 76.2 MMBoe 70% 44.9 MMBoe Oil 69% Oil 60% NGL's 15% NGL's 18% Engineered Acreage* Gas * Gas Non-Engineered Acreage 21% 16% Acquired Acrea
Slide 7: 2017 Capital Results vs. Peers
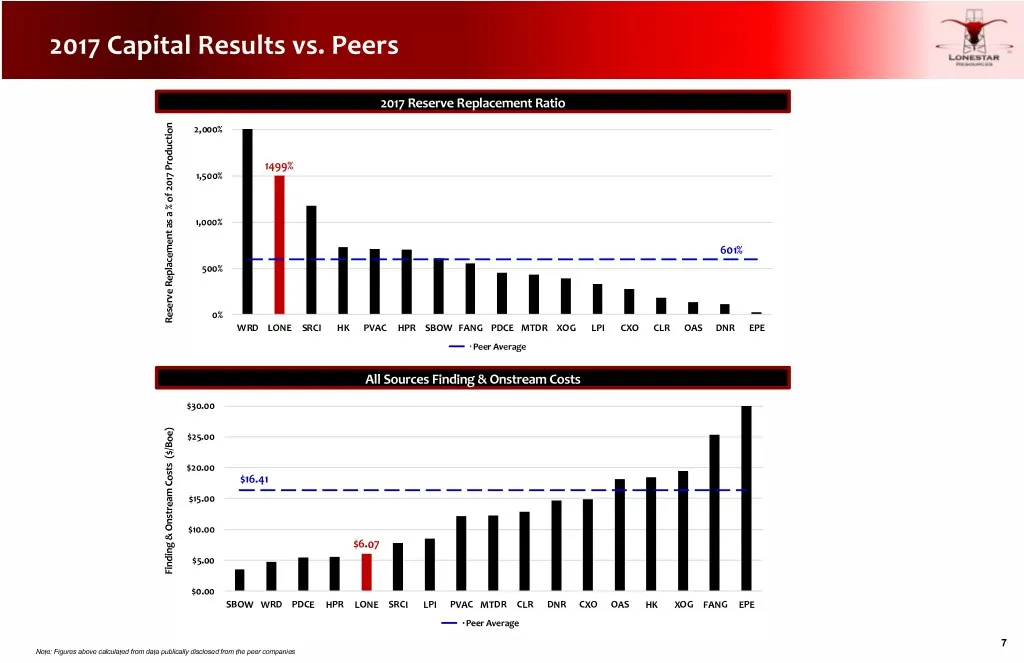
2017 Capital Results vs. Peers 2017 Reserve Replacement Ratio 2,000% 1499% 1,500% 1,000% 601% 500% 0% Reserve Replacement as a % of 2017 Production WRD LONE SRCI HK PVAC HPR SBOW FANG PDCE MTDR XOG LPI CXO CLR OAS DNR EPE Peer Average All Sources Finding & Onstream Costs $30.00 $25.00 $400 $350 $300
Slide 8: Crude Oil Weighted Production Yields High Margins
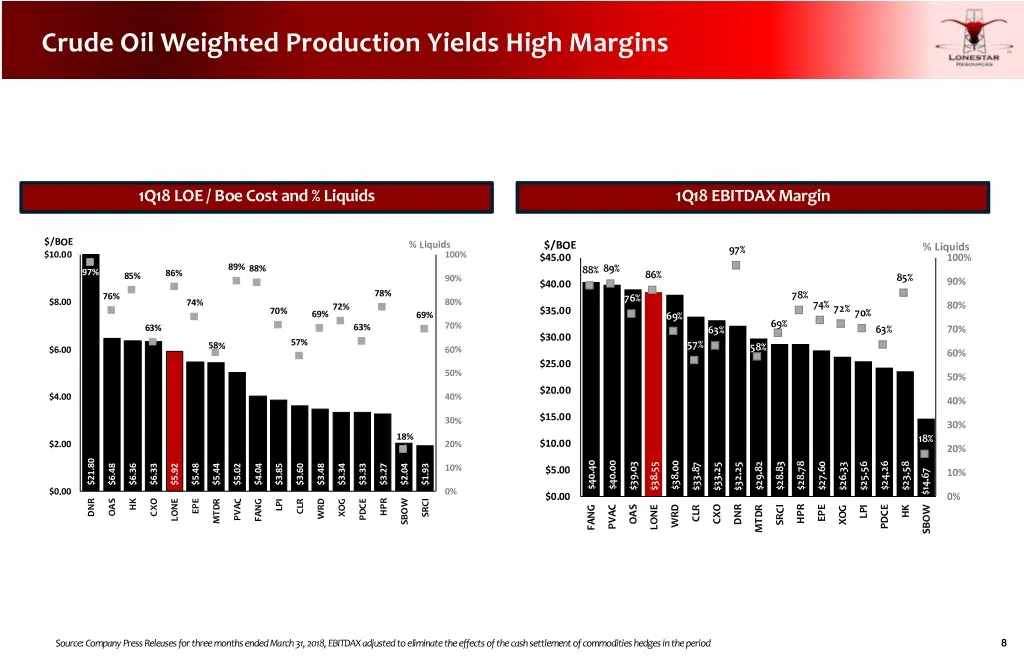
Crude Oil Weighted Production Yields High Margins 1Q18 LOE / Boe Cost and % Liquids 1Q18 EBITDAX Margin $/BOE % Liquids $/BOE 97% % Liquids $10.00 100% $45.00 100% 89% 97% 86% 88% 88% 89% 85% 90% 86% 85% $40.00 90% 76% 78% 76% 78% $8.00 74% 80% 74% 80% 70% 72% $35.00 72% 69% 69% 69% 70% 69% 63% 63%
Slide 9: Rapidly Improving Financial Metrics
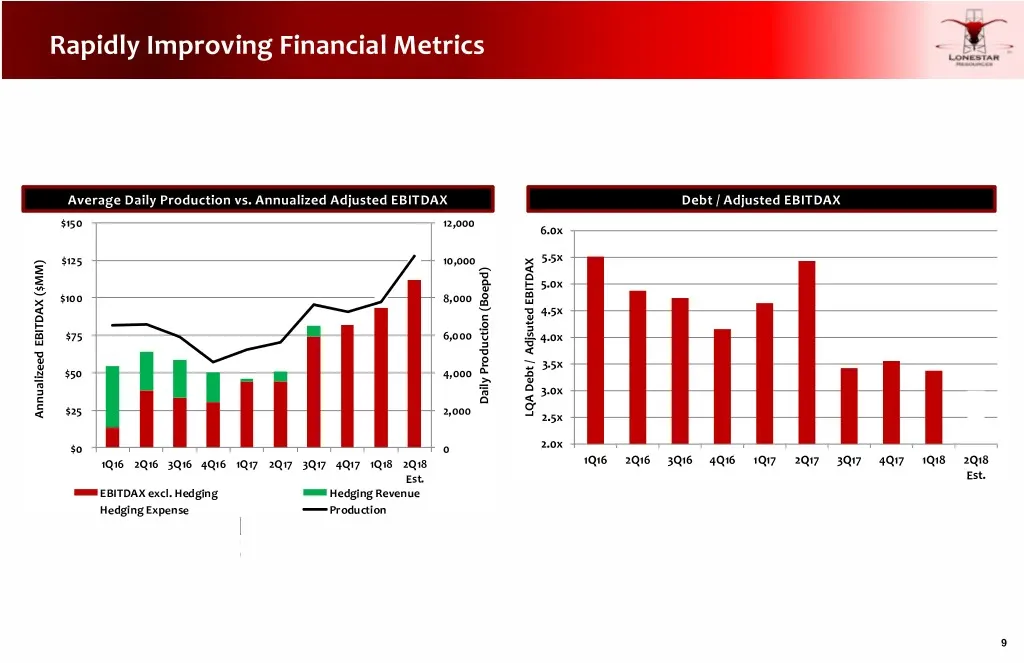
Rapidly Improving Financial Metrics Average Daily Production vs. Annualized Adjusted EBITDAX Debt / Adjusted EBITDAX $150 12,000 6.0x $125 10,000 5.5x 5.0x $100 8,000 4.5x $75 6,000 4.0x 3.5x $50 4,000 3.0x Daily Production (Boepd) $25 2,000 LQA Debt Adjsuted / EBITDAX Annualizeed EBITDAX Annualizee
Slide 10: Strip PV-10 Per Share
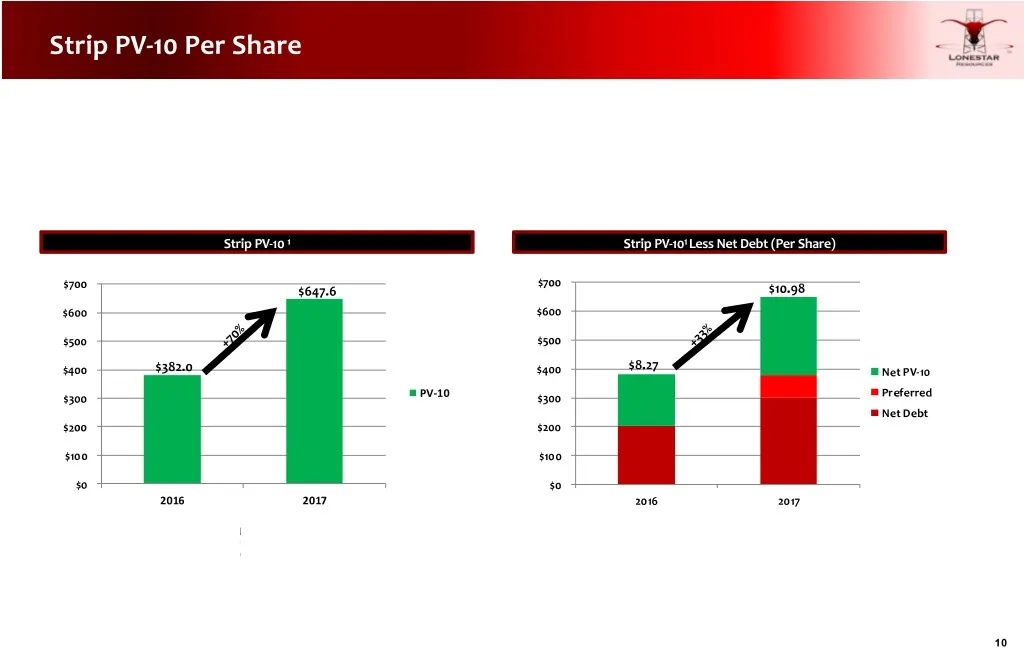
Strip PV-10 Per Share Strip PV-10 1 Strip PV-101 Less Net Debt (Per Share) $700 $700 $647.6 $10.98 $600 $600 $500 +70% $500 +33% $8.27 $400 $382.0 $400 Net PV-10 Preferred $300 PV-10 $300 Net Debt $200 $400 $200 $350 $100 $300 $100 $250 $0 $200 $0 10 ($mm)10 - $150 2016 2017 2016 2017 $100 1P PV 1P
Slide 11: Geo-Engineered Completions Continue to Improve Results
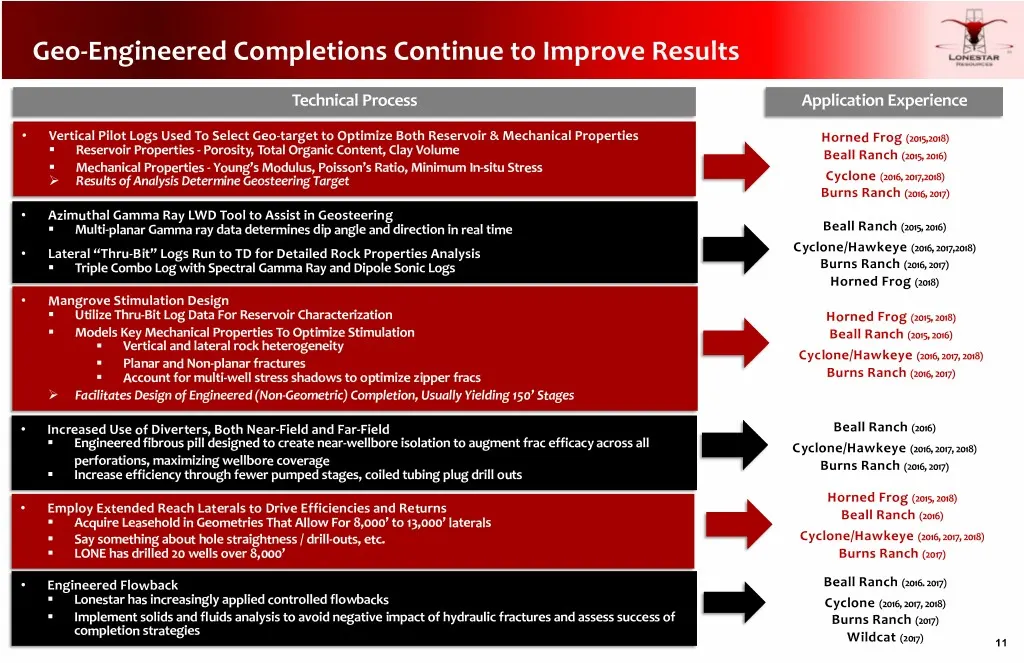
Geo-Engineered Completions Continue to Improve Results Technical Process Application Experience • Vertical Pilot Logs Used To Select Geo-target to Optimize Both Reservoir & Mechanical Properties Horned Frog (2015,2018) § Reservoir Properties - Porosity, Total Organic Content, Clay Volume Beall Ranch
Slide 12: The Value of Extended Reach Laterals in the Eagle Ford
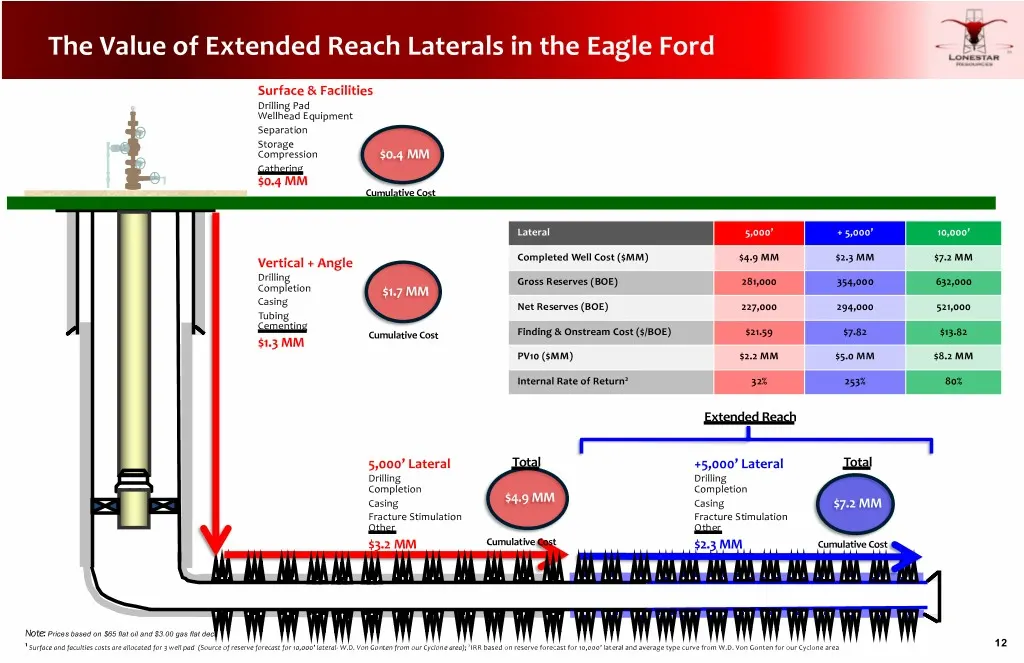
The Value of Extended Reach Laterals in the Eagle Ford Surface & Facilities Drilling Pad Wellhead Equipment Separation Storage Compression $0.4 MM Gathering $0.4 MM Cumulative Cost Lateral 5,000’ + 5,000’ 10,000’ Vertical + Angle Completed Well Cost ($MM) $4.9 MM $2.3 MM $7.2 MM Drilling Gross Reser

Slide 13: 2018 Capital Program Areas of Focus
2018 Capital Program Areas of Focus
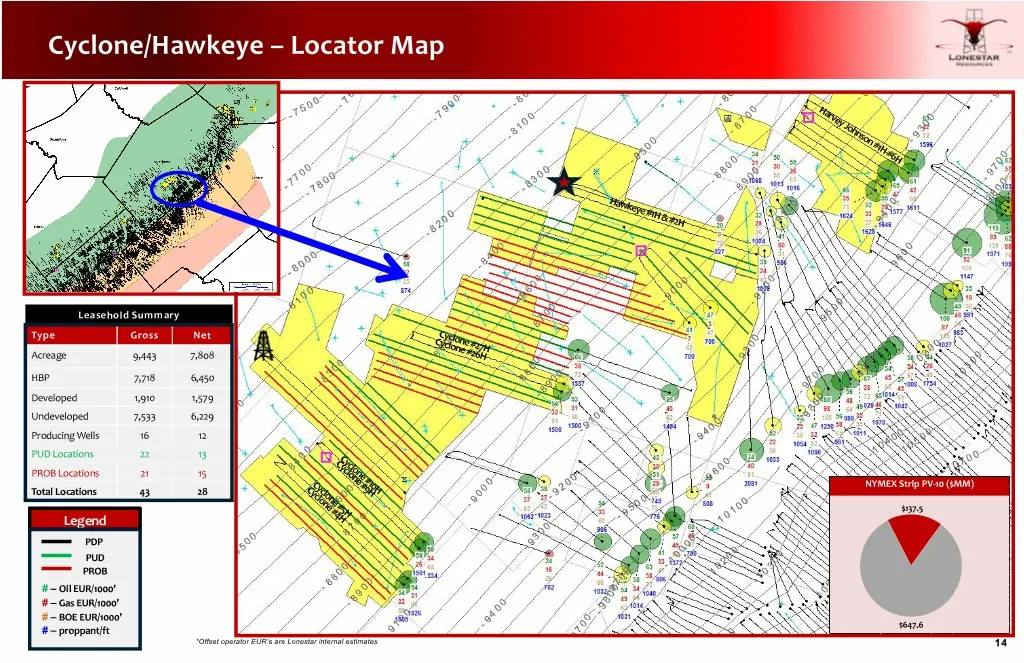
Slide 14: Cyclone/Hawkeye – Locator Map
Cyclone/Hawkeye – Locator Map Harvey Johnson #1H -#6H Hawkeye #1H & #2H Leasehold Summary Type Gross Net Cyclone #27H Cyclone #26H Acreage 9,443 7,808 HBP 7,718 6,450 Developed 1,910 1,579 Undeveloped 7,533 6,229 Producing Wells 16 12 PUD Locations 22 13 Cyclone #10H Cyclone #9H PROB Locations 21 15
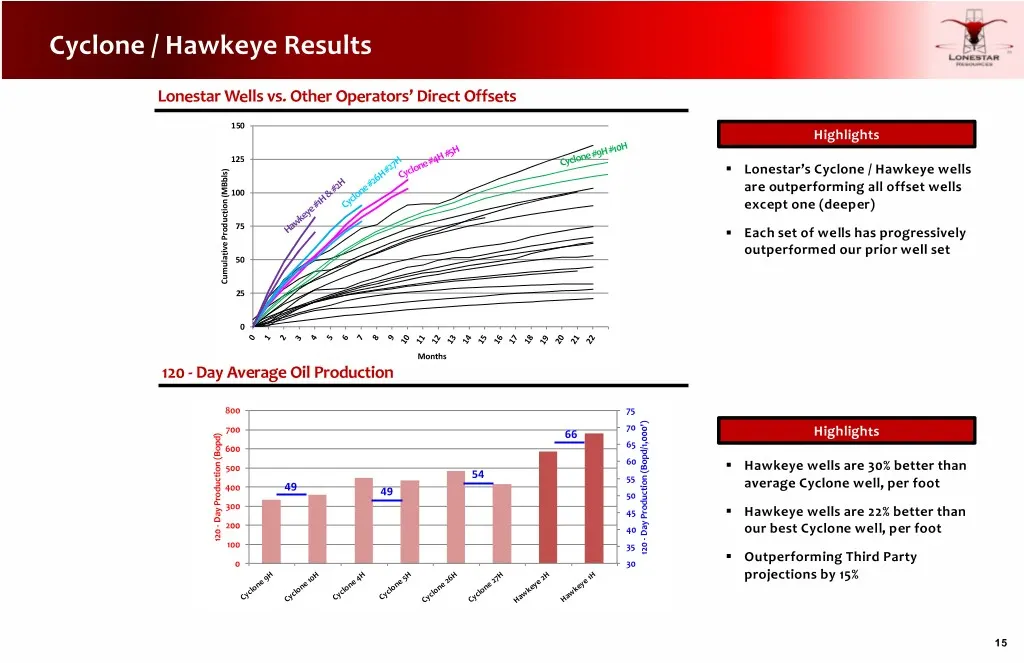
Slide 15: Cyclone / Hawkeye Results
Cyclone / Hawkeye Results Lonestar Wells vs. Other Operators’ Direct Offsets 150 Highlights 125 Cyclone #9H #10H Cyclone #4H #5H § Lonestar’s Cyclone / Hawkeye wells 100 are outperforming all offset wells Cyclone #26H #27H except one (deeper) 75 Hawkeye #1H & #2H § Each set of wells has progressivel
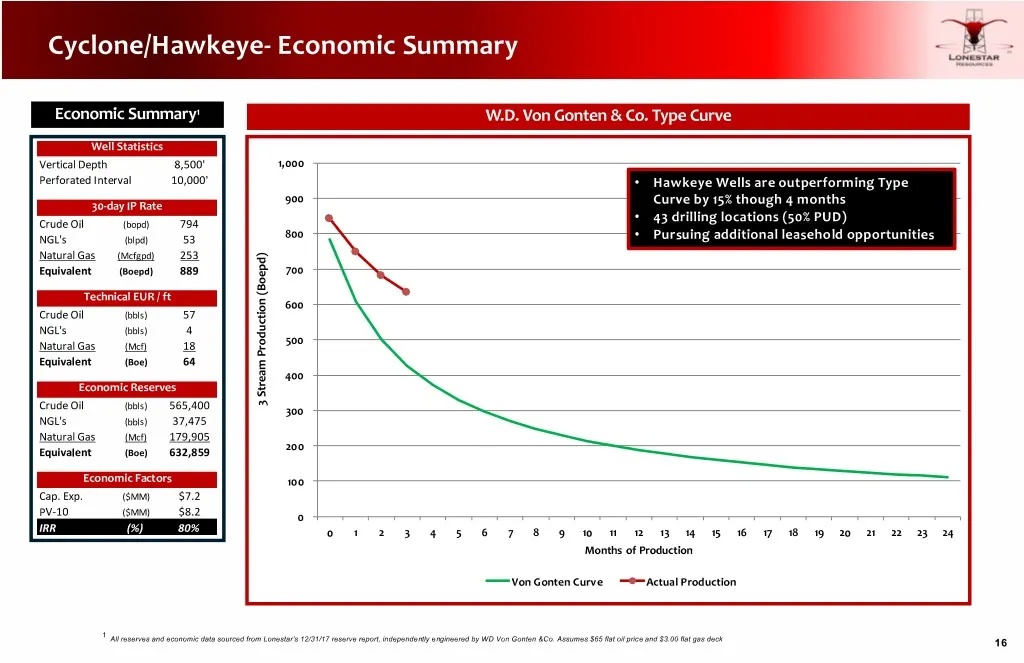
Slide 16: Cyclone/Hawkeye - Economic Summary
Cyclone/Hawkeye- Economic Summary Economic Summary1 W.D. Von Gonten & Co. Type Curve Well Statistics Vertical Depth 8,500' 1,000 Perforated Interval 10,000' • Hawkeye Wells are outperforming Type 900 30-day IP Rate Curve by 15% though 4 months • 43 drilling locations (50% PUD) Crude Oil (bopd) 794 8
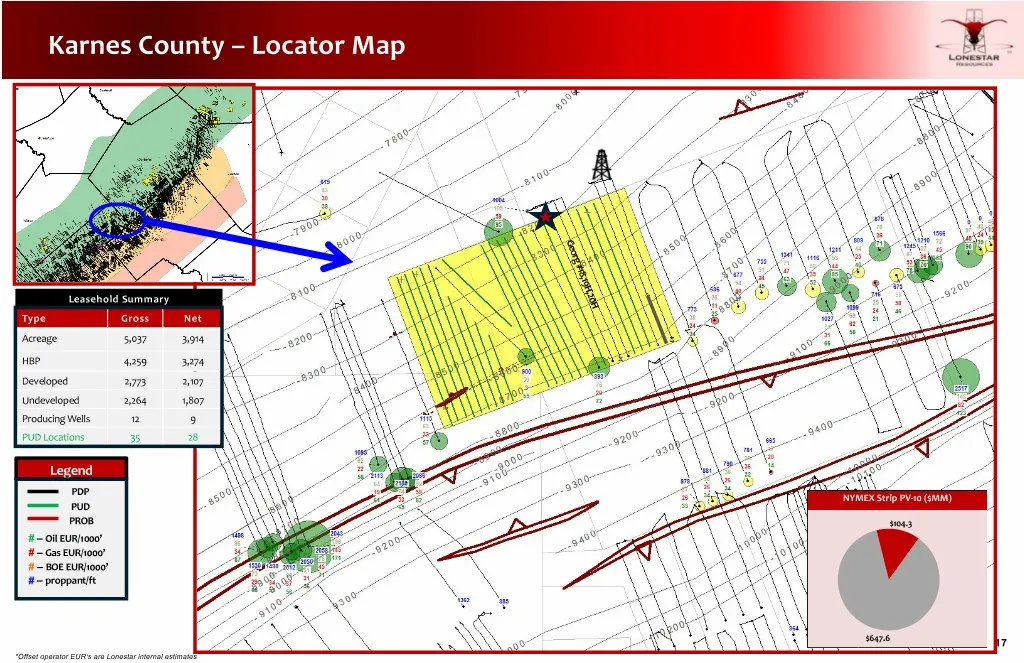
Slide 17: Karnes County – Locator Map
Karnes County – Locator Map Georg #18,19H,20H Leasehold Summary Type Gross Net Acreage 5,037 3,914 HBP 4,259 3,274 Developed 2,773 2,107 Undeveloped 2,264 1,807 Producing Wells 12 9 PUD Locations 35 28 Legend PDP NYMEX Strip PV-10 ($MM) PUD PROB $104.3 # – Oil EUR/1000’ # – Gas EUR/1000’ # – BOE EUR
Slide 18: Karnes County Economic Evaluation
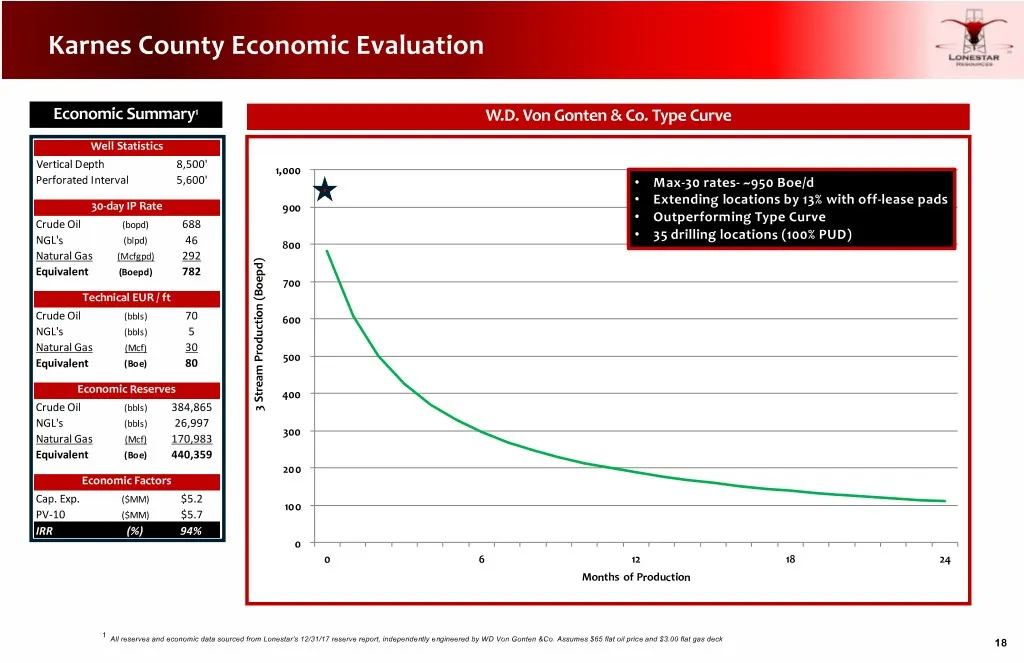
Karnes County Economic Evaluation Economic Summary1 W.D. Von Gonten & Co. Type Curve Well Statistics Vertical Depth 8,500' 1,000 Perforated Interval 5,600' • Max-30 rates- ~950 Boe/d • Extending locations by 13% with off-lease pads 30-day IP Rate 900 • Outperforming Type Curve Crude Oil (bopd) 688 •
Slide 19: Horned Frog – Locator Map
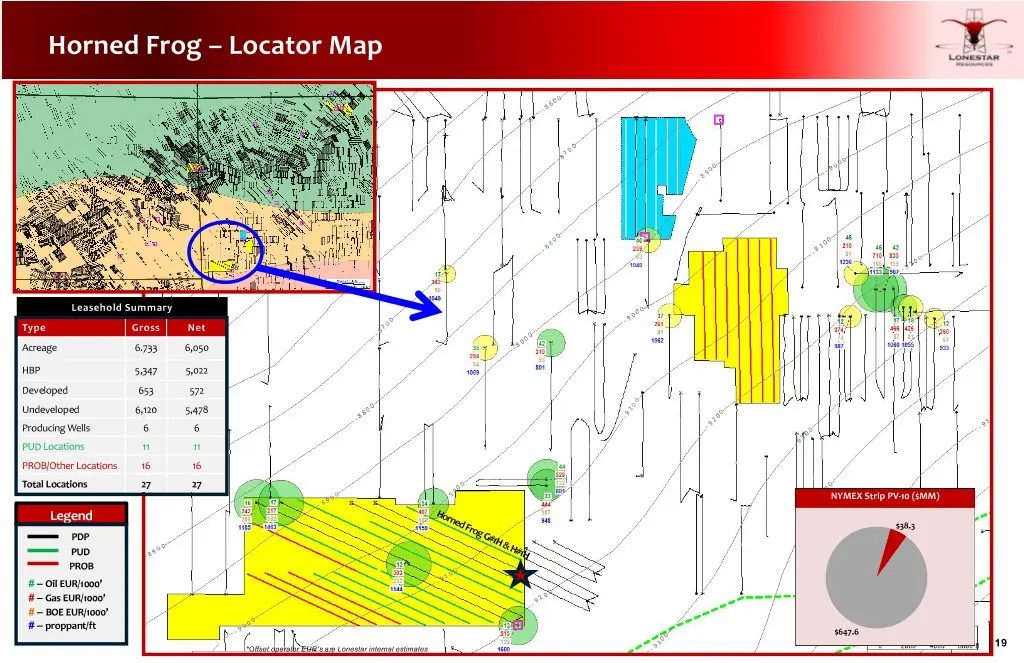
Horned Frog – Locator Map Leasehold Summary Type Gross Net Acreage 6.733 6,050 HBP 5,347 5,022 Developed 653 572 Undeveloped 6,120 5,478 Producing Wells 6 6 PUD Locations 11 11 PROB/Other Locations 16 16 Total Locations 27 27 NYMEX Strip PV-10 ($MM) Legend Horned Frog G#1H & H#1H $38.3 PDP PUD PROB
Slide 20: Horned Frog Economic Evaluation
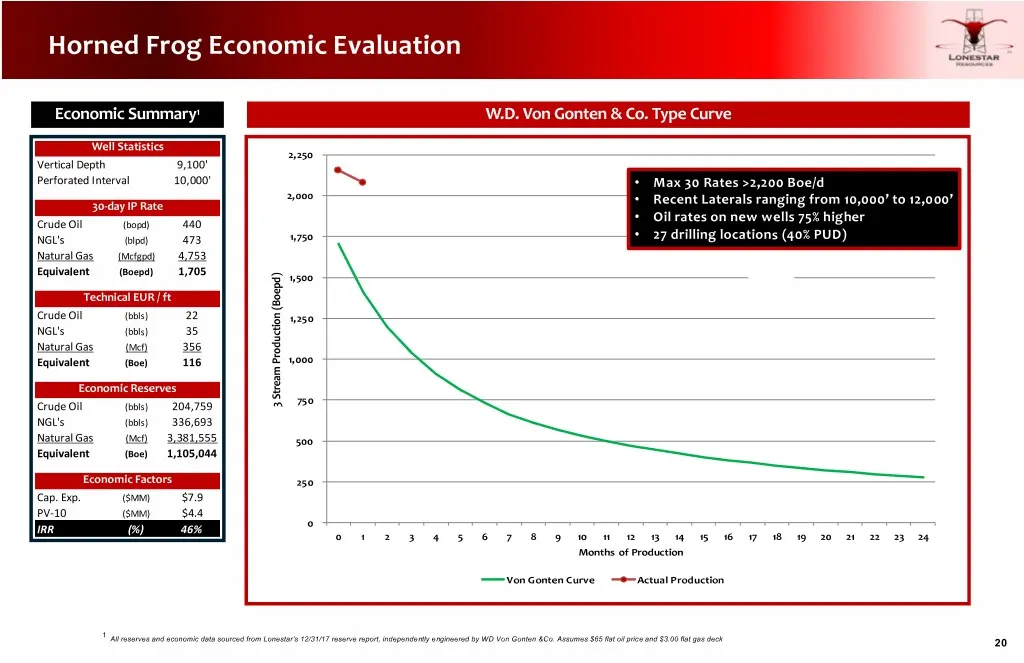
Horned Frog Economic Evaluation Economic Summary1 W.D. Von Gonten & Co. Type Curve Well Statistics 2,250 Vertical Depth 9,100' Perforated Interval 10,000' • Max 30 Rates >2,200 Boe/d 2,000 • 30-day IP Rate Recent Laterals ranging from 10,000’ to 12,000’ • Oil rates on new wells 75% higher Crude Oil
Slide 21: Horned Frog Results
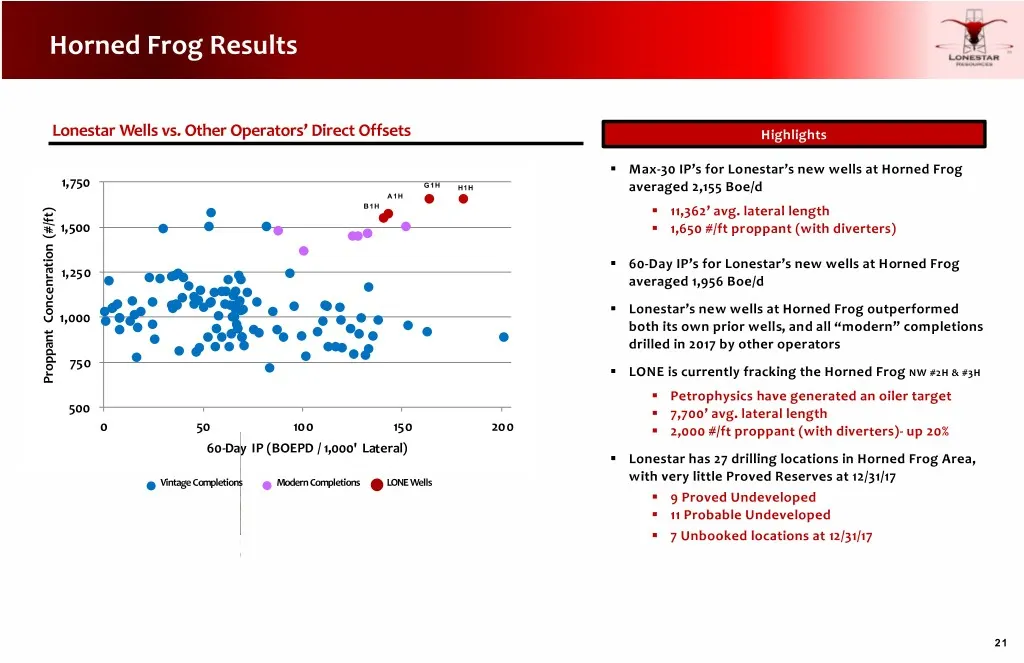
Horned Frog Results Lonestar Wells vs. Other Operators’ Direct Offsets Highlights § Max-30 IP’s for Lonestar’s new wells at Horned Frog 1,750 G1H H1H averaged 2,155 Boe/d A1H B1H § 11,362’ avg. lateral length 1,500 § 1,650 #/ft proppant (with diverters) § 60-Day IP’s for Lonestar’s new wells at Horn
Slide 22: Executive Summary
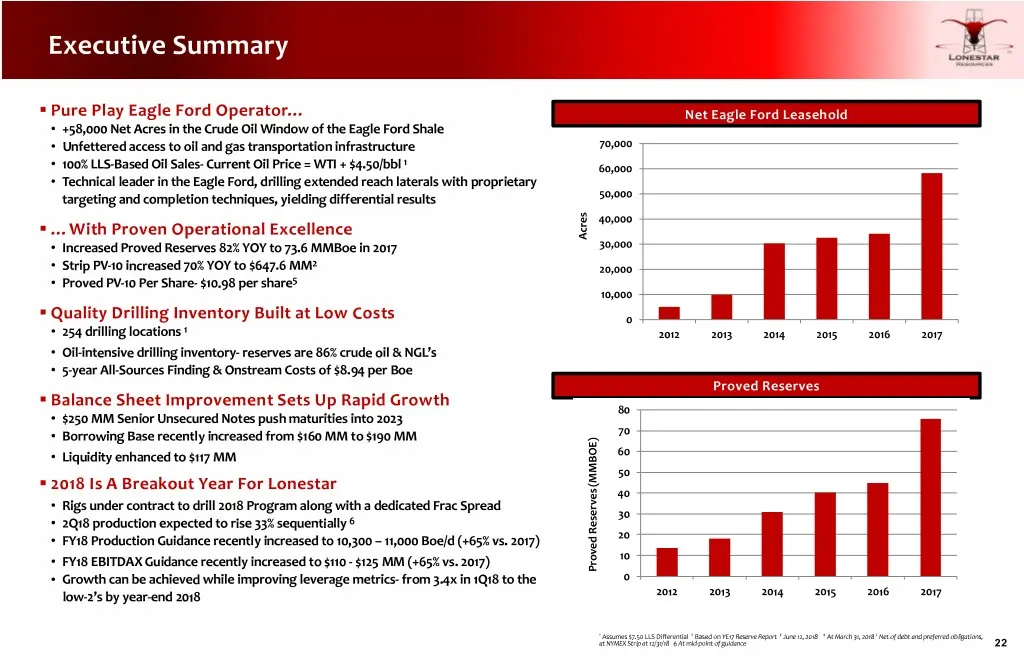
Executive Summary § Pure Play Eagle Ford Operator… Net Eagle Ford Leasehold • +58,000 Net Acres in the Crude Oil Window of the Eagle Ford Shale • Unfettered access to oil and gas transportation infrastructure 70,000 1 • 100% LLS-Based Oil Sales- Current Oil Price = WTI + $4.50/bbl 60,000 • Technical
Slide 23: Executive Summary: Key Investor Considerations
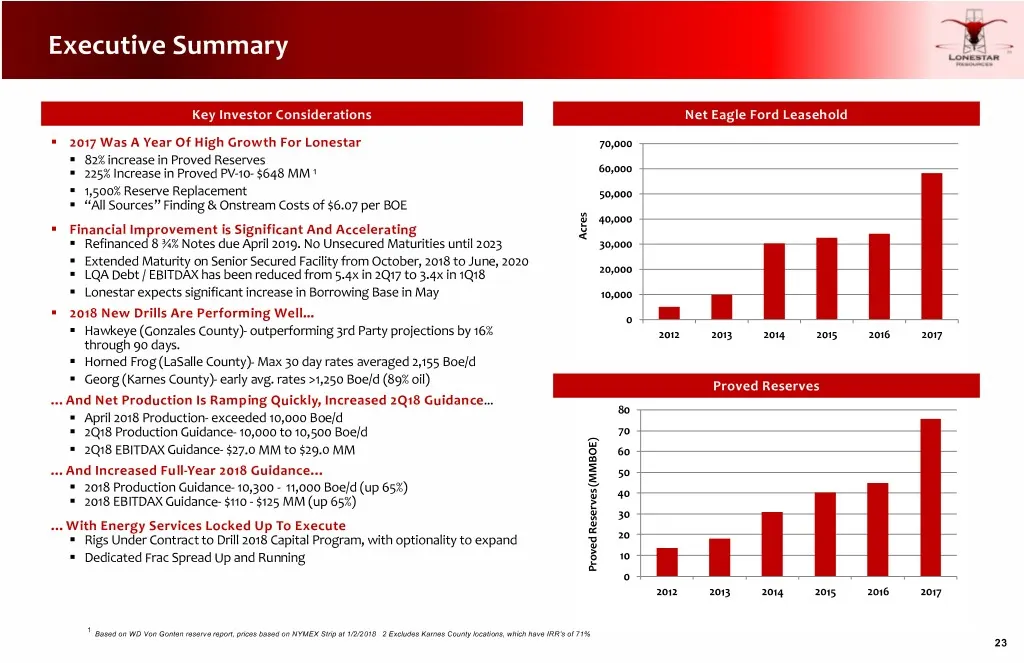
Executive Summary Key Investor Considerations Net Eagle Ford Leasehold § 2017 Was A Year Of High Growth For Lonestar 70,000 § 82% increase in Proved Reserves § 225% Increase in Proved PV-10- $648 MM 1 60,000 § 1,500% Reserve Replacement 50,000 § “All Sources” Finding & Onstream Costs of $6.07 per BO
Source: SEC EDGAR · 8-K filed Jun 18, 2018
More decks from Lonestar Resources US Inc
 CEO Energy-Power Conference (September 2021)32 slides · Sep 10, 2021
 Merger or Acquisition (August 2021)31 slides · Aug 16, 2021
 Merger or Acquisition (July 2021)21 slides · Jul 13, 2021
 Merger or Acquisition (July 2021)17 slides · Jul 13, 2021
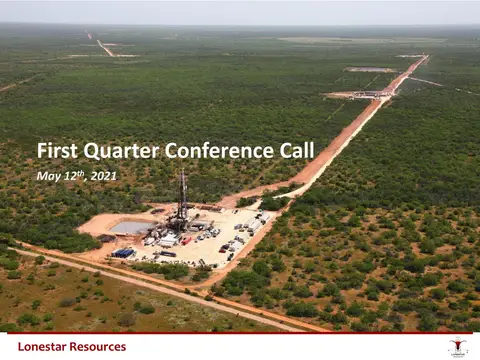 Q1 2021 Earnings Presentation21 slides · May 12, 2021
 Investor Presentation (September 2020)5 slides · Sep 15, 2020