Professional — Q4 2020 Earnings Presentation
21 slides from Professional's earnings presentation, Jan 29, 2021

Slide 1: Fourth Quarter 2020 Earnings Presentation
EARNINGS PRESENTATION FOURTH QUARTER 2020 NASDAQ:PFHD FOURTH QUARTER 2020 EARNINGS PRESENTATION PAGE 1
Slide 2: Forward Looking Statements
FORWARD LOOKING STATEMENTS 8 This slide presentation contains forward-looking statements within the meaning of the Private Securities Litigation Reform Act of 1995. Any statements contained in this presentation that are not statements of historical fact may be deemed to be forward-looking statements
Slide 3: A Growing Franchise in South Florida
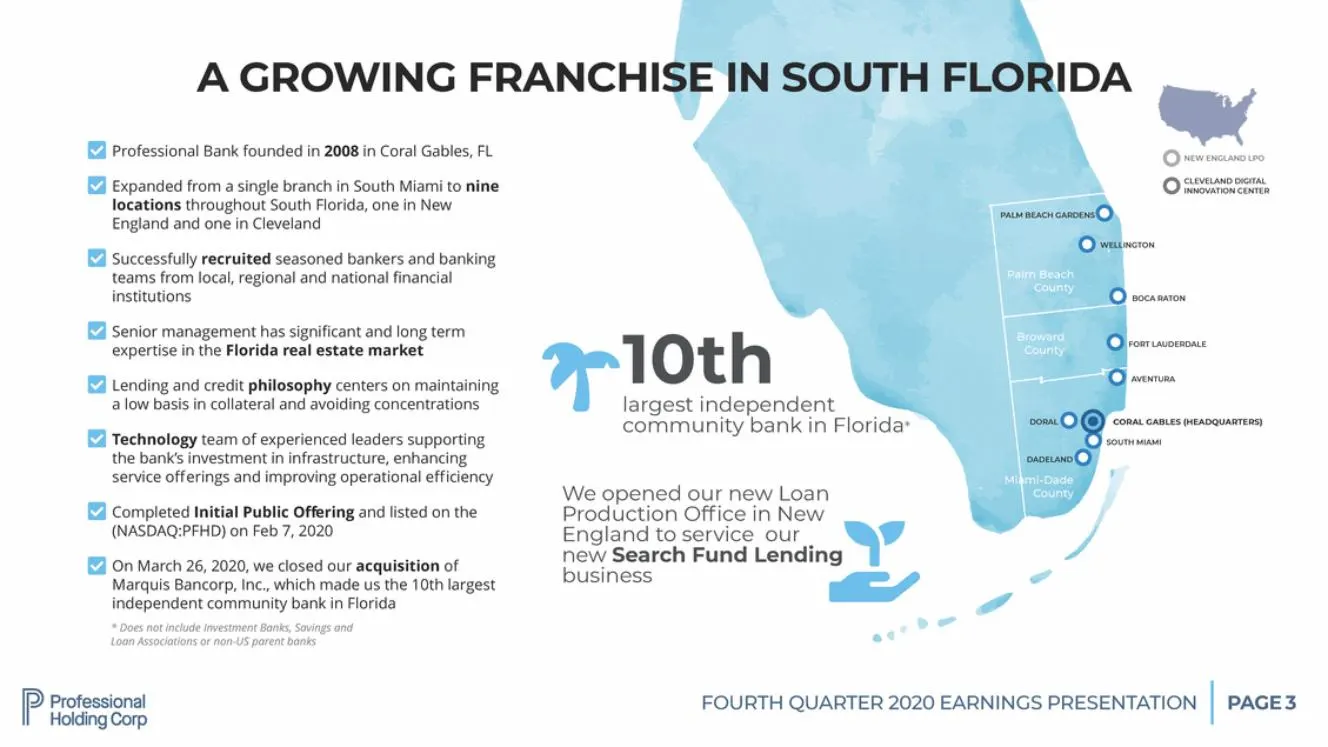
A GROWING FRANCHISE IN SOUTH FLORIDA m m Professional Bank founded in 2008 in Coral Gables, FL NEW ENGLAND LPO CLEVELAND DIGITAL INNOVATION CENTER Expanded from a single branch in South Miami to nine locations throughout South Florida, one in New England and one in Cleveland PALM BEACH GARDENS WELLI
Slide 4: Net Interest Income and Margin
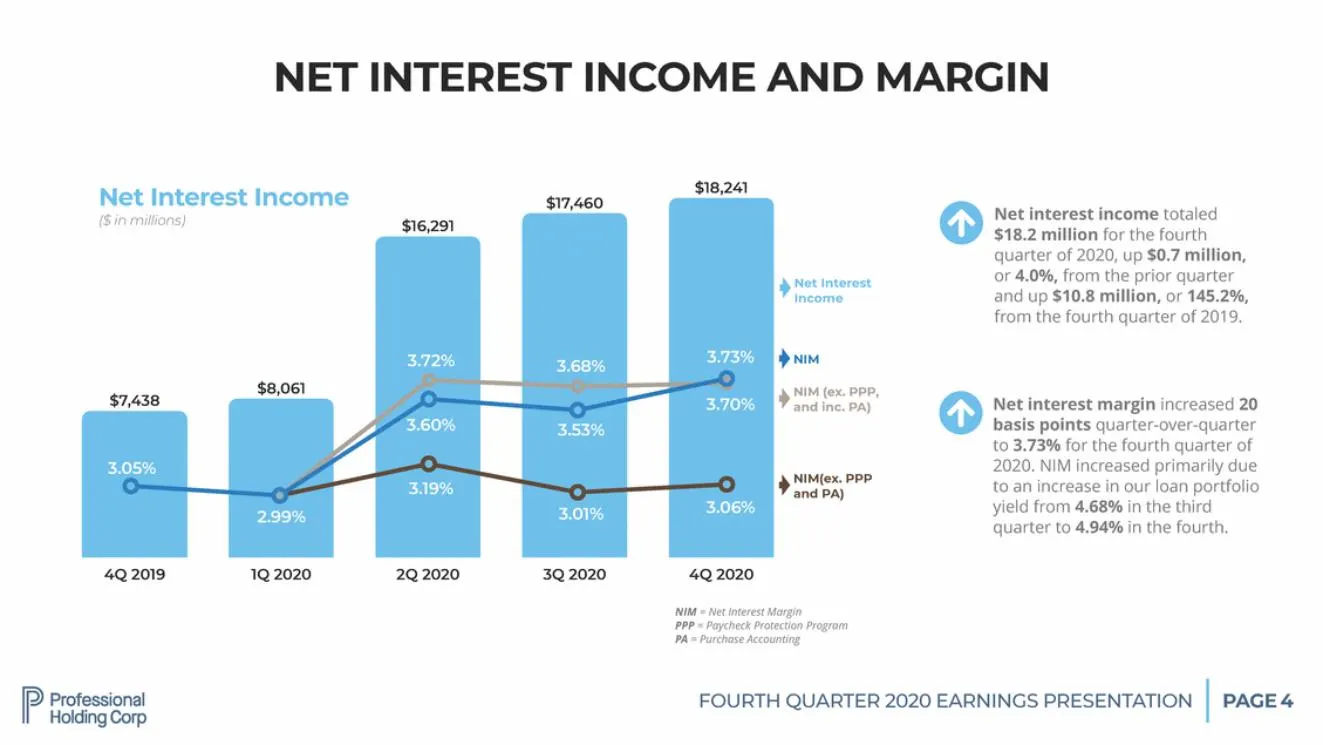
NET INTEREST INCOME AND MARGIN $18,241 Net Interest ($ in millions) Income $17,460 0 Net interest income totaled $18.2 million for the fourth quarter of 2020, up $0.7 million, or 4.0%, from the prior quarter and up $10.8 million, or 145.2%, from the fourth quarter of 2019. $16,291 Net Interest Incom
Slide 5: Consistent Loan Growth
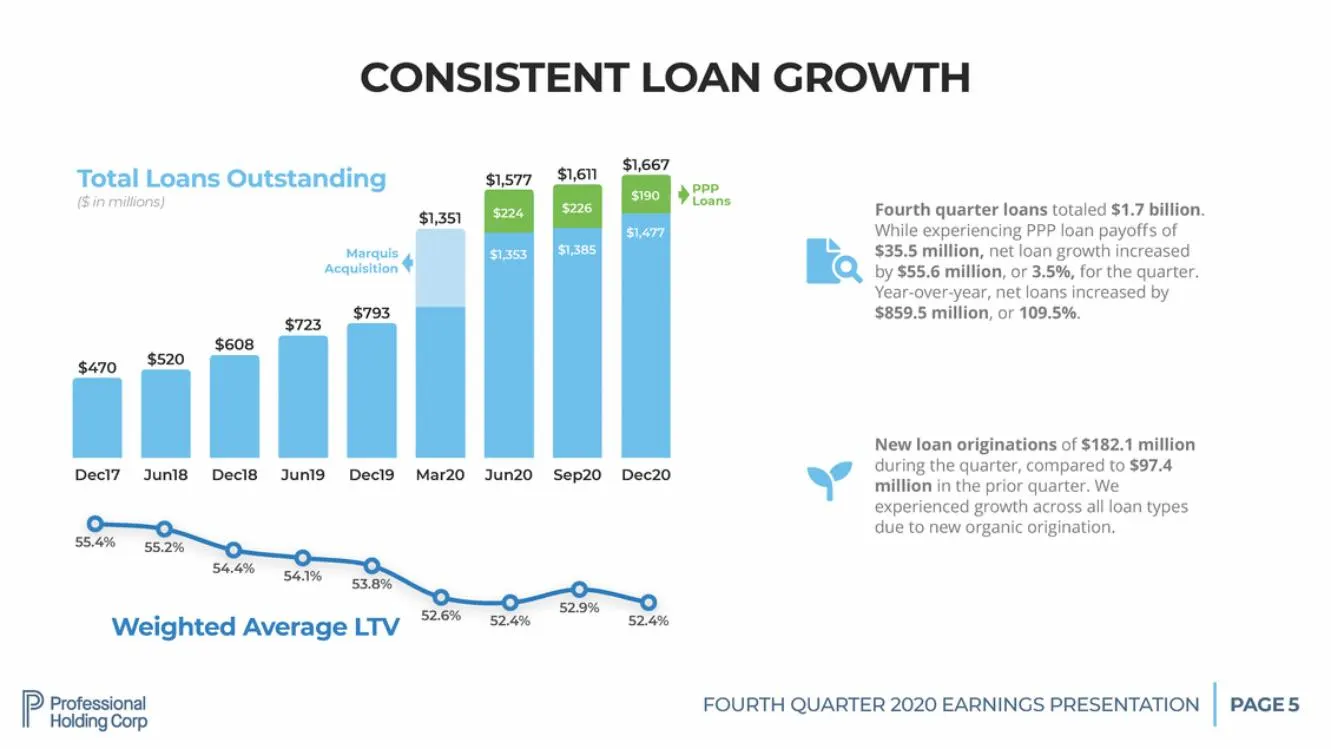
CONSISTENT LOAN GROWTH $1,667 Total Loans Outstanding ($ in millions) $1,611 $1,577 PPP Loans Fourth quarter loans totaled $1.7 billion. While experiencing PPP loan payo ff s of $35.5 million, net loan growth increased by $55.6 million, or 3.5%, for the quarter. Year-over-year, net loans increased by
Slide 6: Strong Deposit Franchise
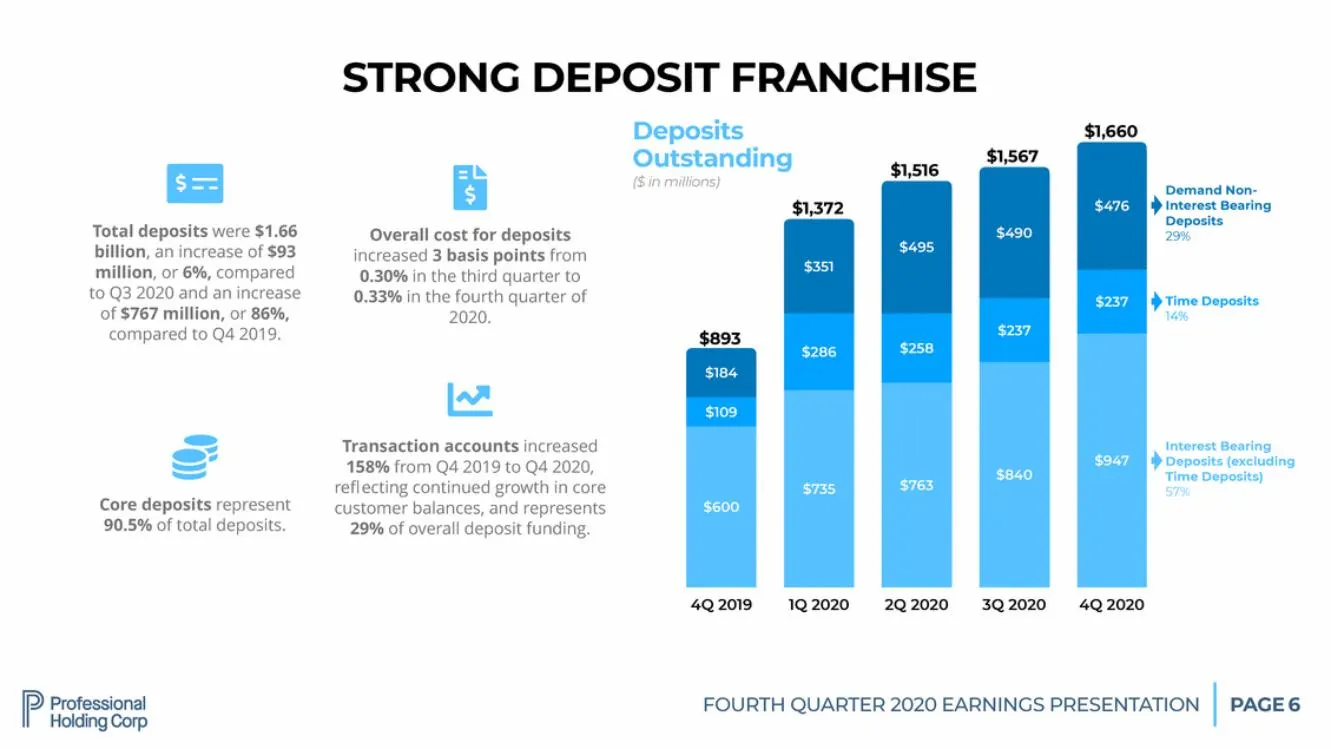
STRONG DEPOSIT FRANCHISE Deposits Outstanding ($ in millions) $1,372 $1,660 $1,567 Ill Total deposits were $1.66 billion, an increase of $93 million, or 6%, compared to Q3 2020 and an increase of $767 million, or 86%, $1,516 Demand Non-Interest Bearing Deposits 29% Overall cost for deposits increase
Slide 7: Deposit Balances and Cost
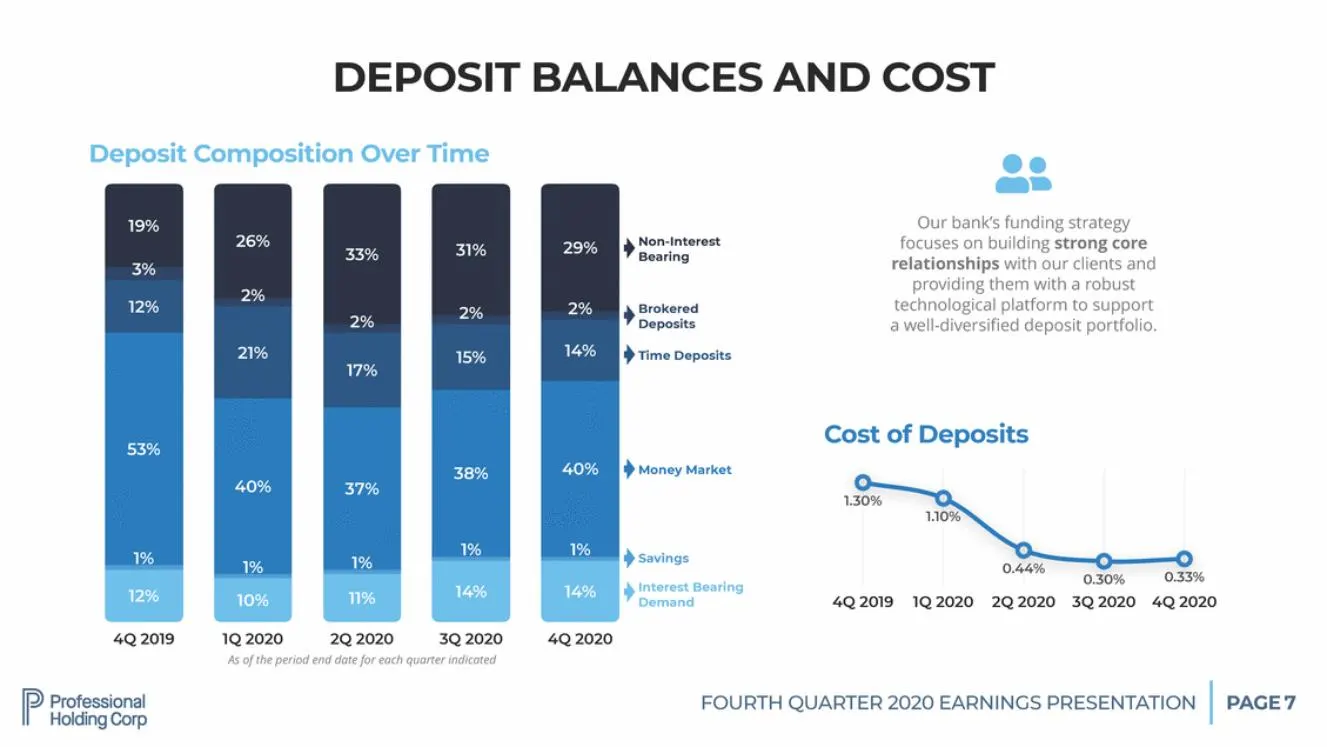
DEPOSIT BALANCES AND COST Deposit Composition Over Time - Our bank’s funding strategy focuses on building strong core relationships with our clients and providing them with a robust technological platform to support Non-Interest Bearing Brokered Deposits a well-diversified deposit portfolio. Time Dep
Slide 8: Robust Asset Quality
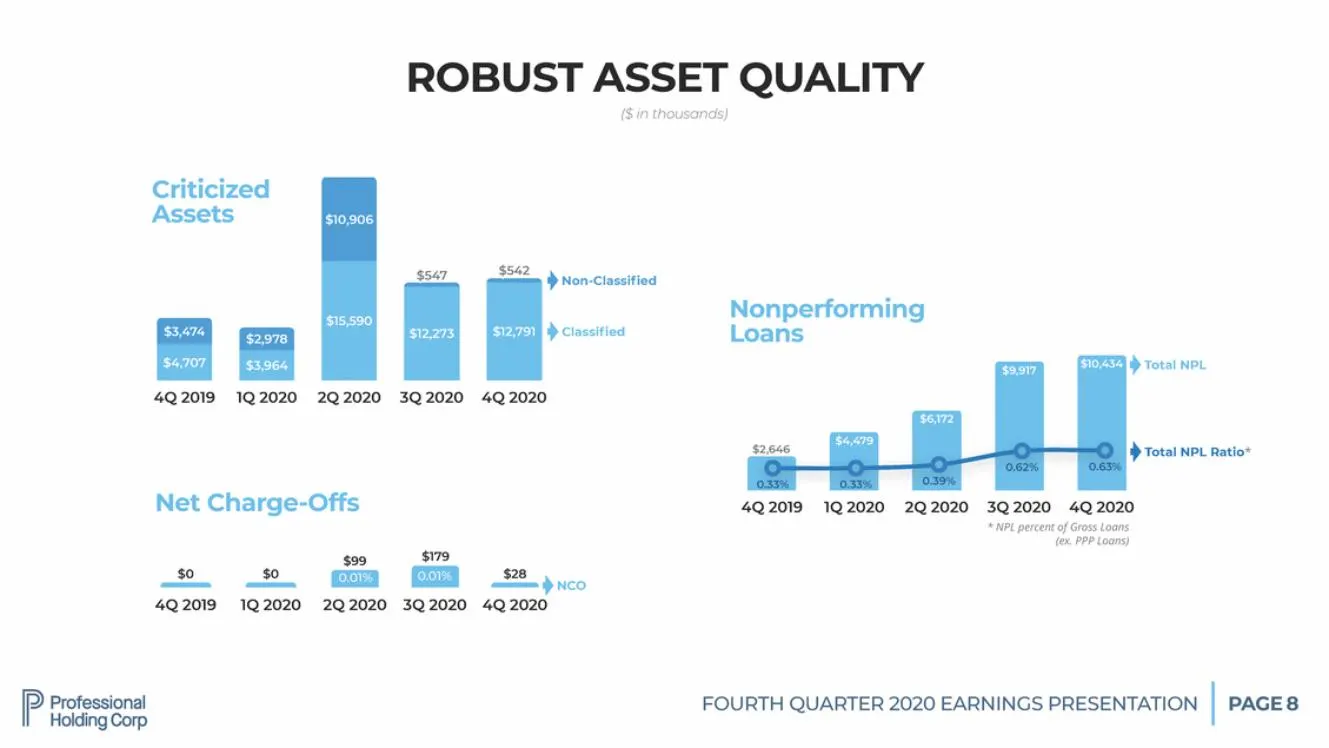
ROBUST ASSET ($ in thousands) QUALITY Criticized Assets $542 $547 Non-Classified Nonperforming Loans Classified Total NPL 4Q 2019 1Q 2020 2Q 2020 3Q 2020 4Q 2020 $4,479 $2,646 Total NPL Ratio* $2,646 0.33% 0.33% Net Charge-Offs 4Q 2019 1Q 2020 2Q 2020 3Q 2020 4Q 2020 * NPL percent of Gross Loans (ex
Slide 9: Allowance for Loan Losses
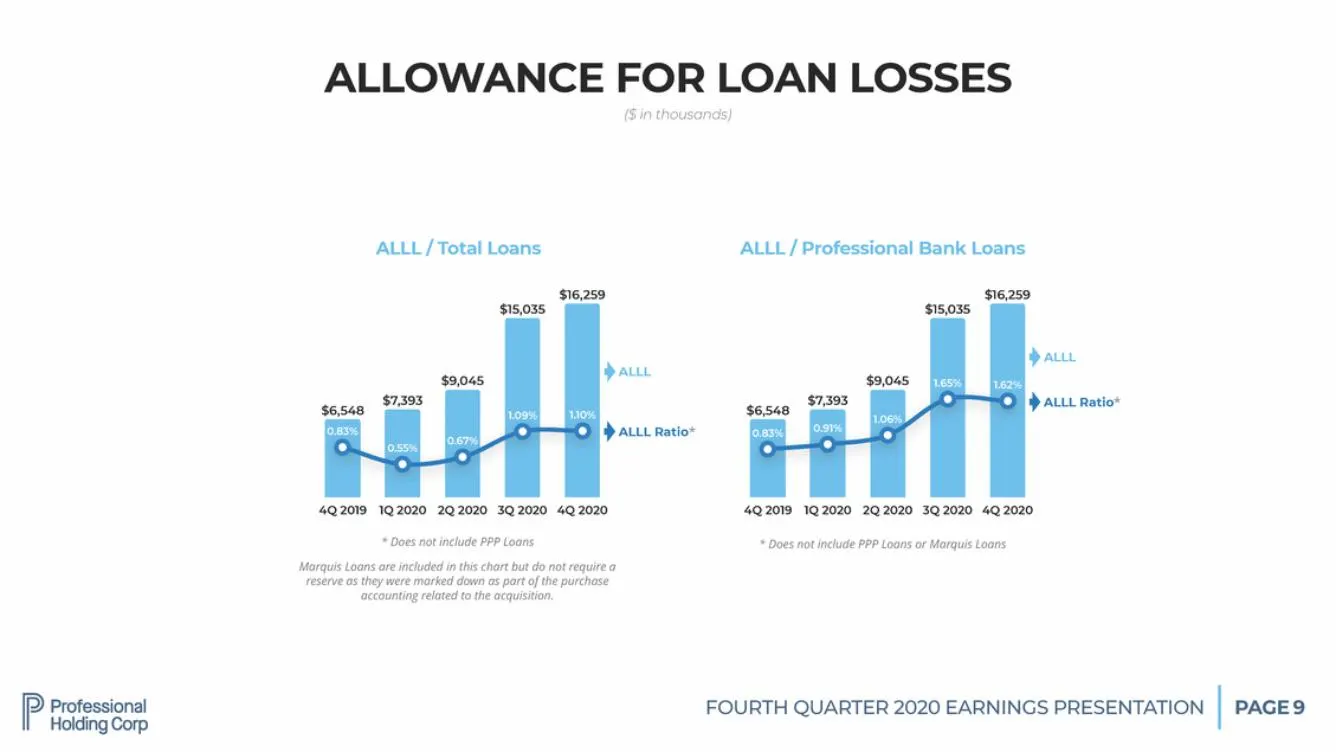
ALLOWANCE FOR LOAN LOSSES ($ in thousands) ALLL / Total Loans ALLL / Professional Bank Loans $16,259 $16,259 $15,035 $15,035 ALLL ALLL $9,045 $9,045 $7,393 $7,393 ALLL Ratio* $6,548 $6,548 ALLL Ratio* 4Q 2019 1Q 2020 2Q 2020 3Q 2020 4Q 2020 4Q 2019 1Q 2020 2Q 2020 3Q 2020 4Q 2020 * Does not include
Slide 10: Earnings and Adjusted Earnings
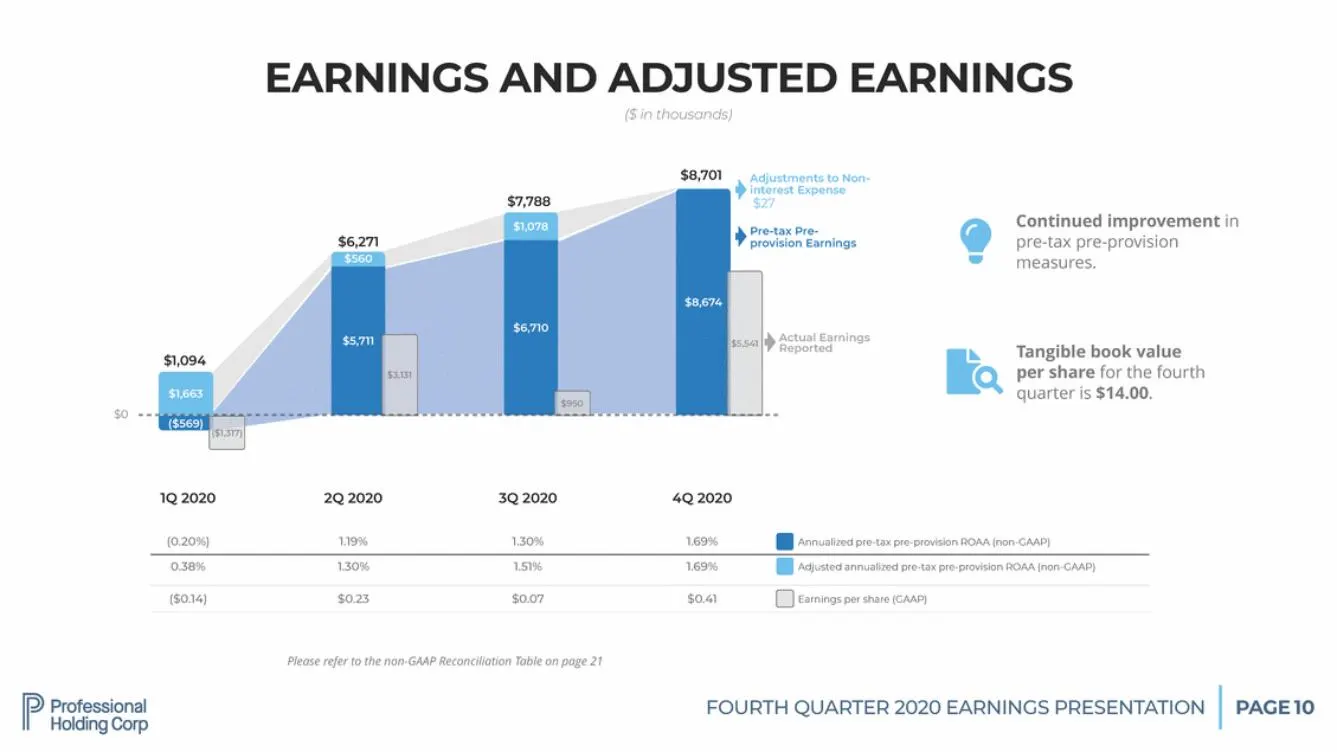
EARNINGS AND ADJUSTED ($ in thousands) EARNINGS $8,701 Adjustments to Non-interest Expense Continued improvement pre-tax pre-provision measures. in tax Pre-vision Earnings Actual Earnings Reported Tangible book value per share for the fourth l quarter is $14.00. $0 ($1,317) Please refer to the non-G
Slide 11: Loan Portfolio Highlights
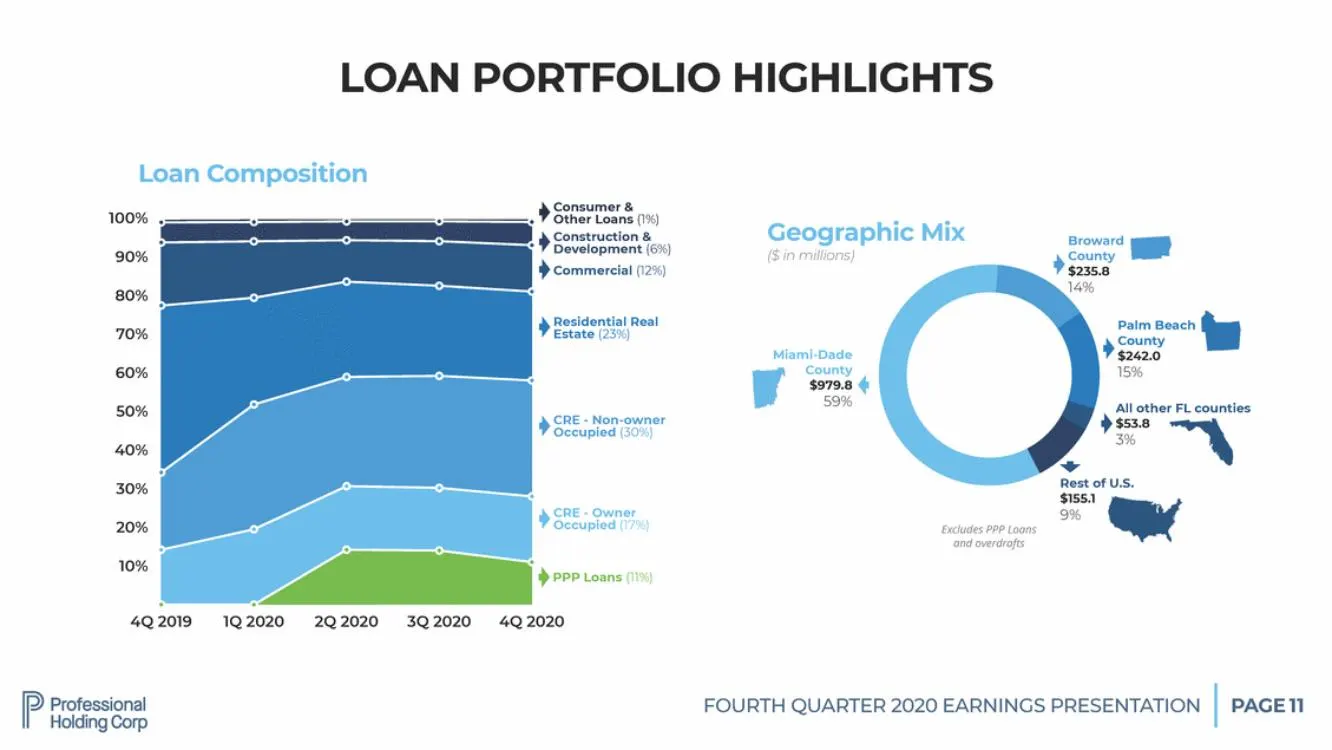
LOAN PORTFOLIO HIGHLIGHTS Loan Composition Consumer & Other Loans (1%) 100% Geographic ($ in millions) Mix Construction & Development (6%) Commercial (12%) Broward County 90% 5.8 80% Residential Real Estate (23%) Palm Beach County $242.0 15% 70% Miami-Dade County $979.8 59% 60% All other FL counties
Slide 12: Interest Rate Sensitivity
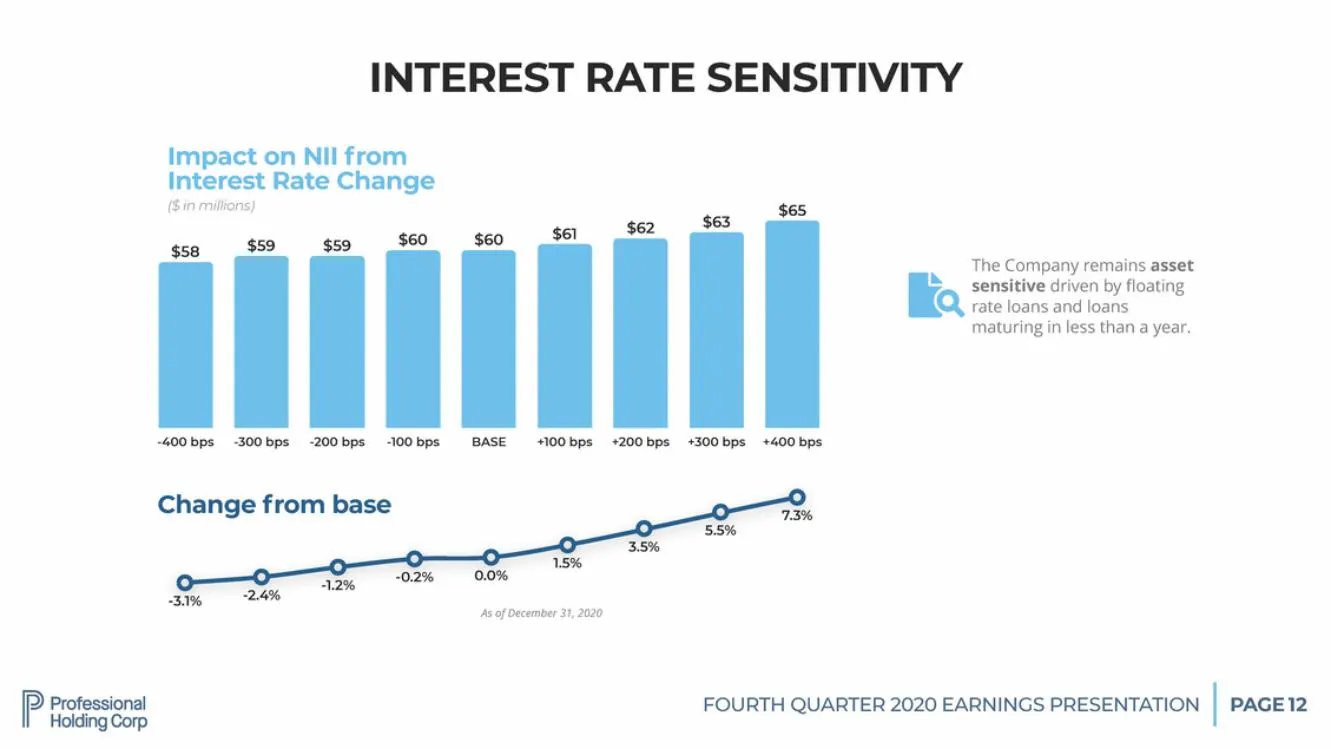
INTEREST RATE SENSITIVITY Impact on NII from Interest Rate Change ($ in millions) $65 $63 $62 $61 $60 $60 $59 $59 $58 The Company remains asset sensitive driven by floating rate loans and loans l maturing in less than a year. -400 bps -300 bps -200 bps -100 bps BASE +100 bps +200 bps +300 bps +400 bp
Slide 13: Asset Liability Management Trends
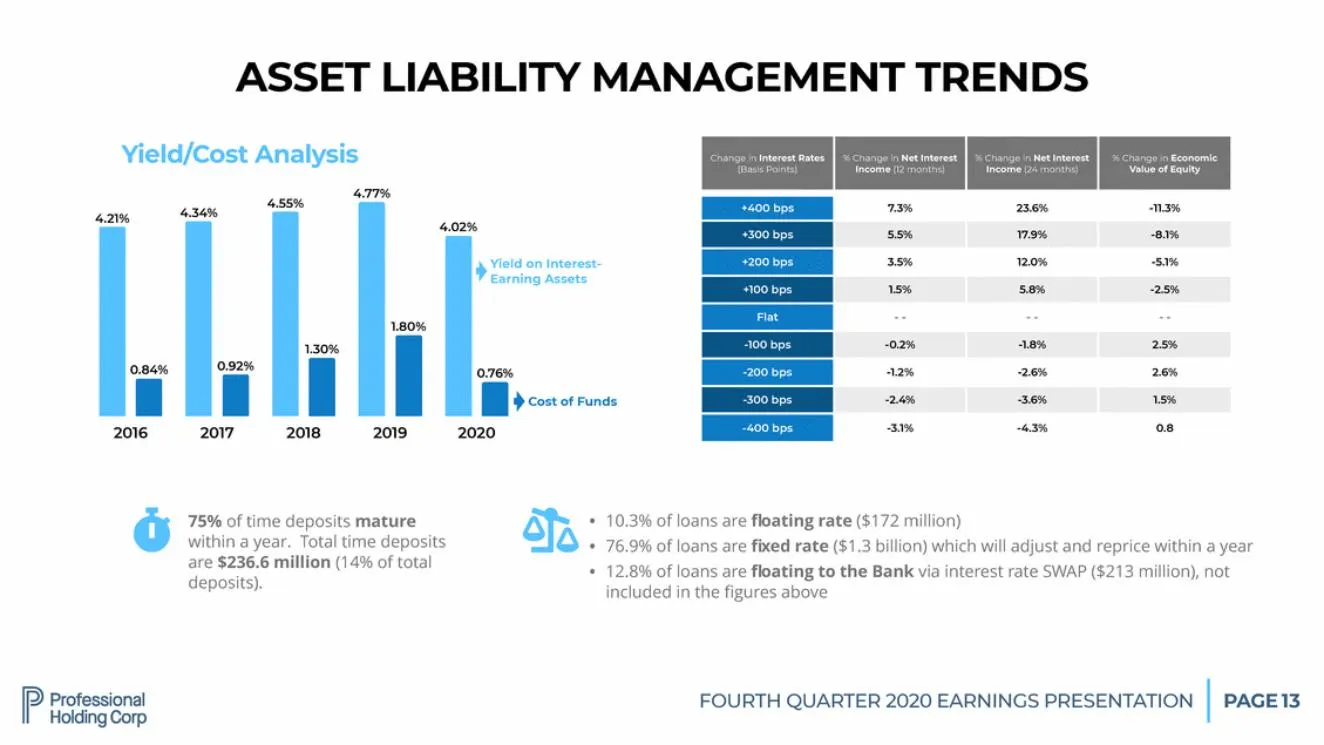
ASSET LIABILITY MANAGEMENT TRENDS Yield/Cost Analysis 4.77% 4.55% -11.3% 4.34% 4.21% 4.02% Yield on Interest-Earning Assets 1.80% 1.30% 0.92% 0.84% 0.76% Cost of Funds 2016 2017 2018 2019 2020 G � • • • 10.3% 76.9% 12.8% of of of loans loans loans are are are floating rate ($172 million) fixed rate ($
Slide 14: Investment Portfolio
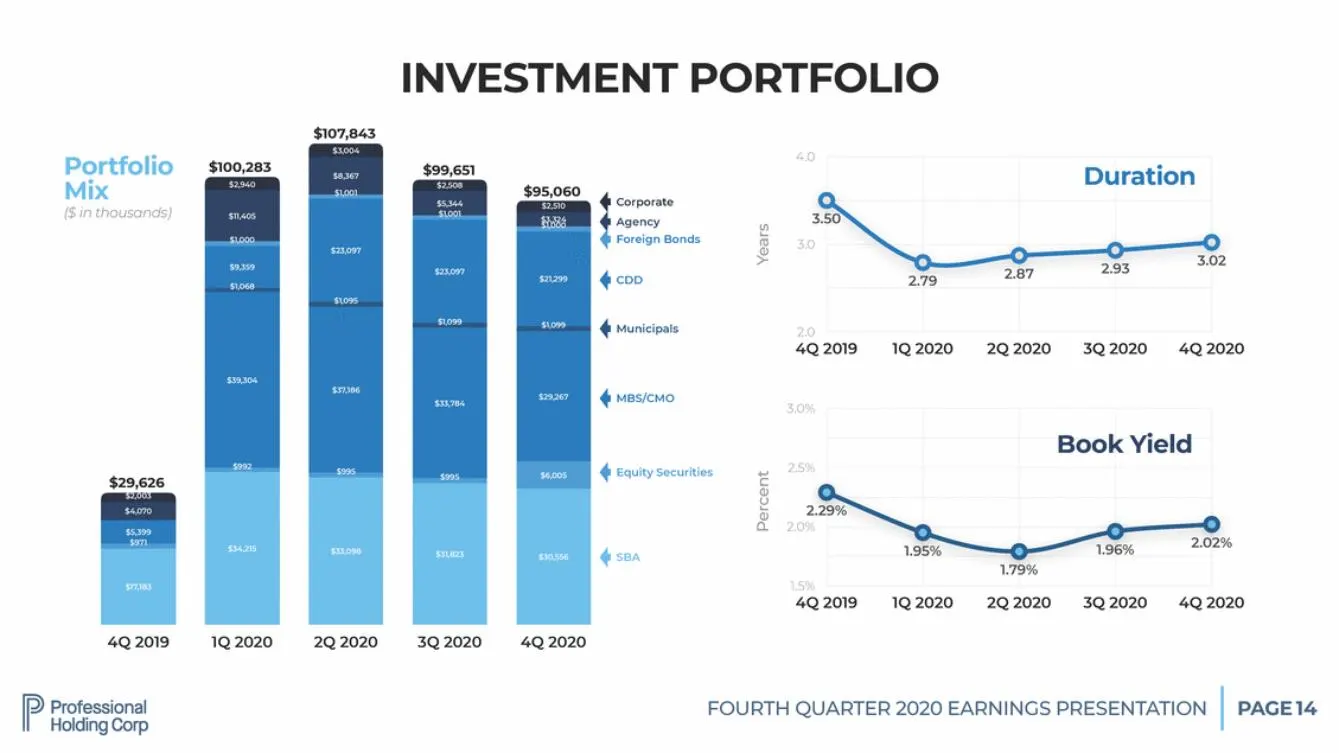
INVESTMENT PORTFOLIO $107,843 4.0 Portfolio Mix ($ in thousands) $100,283 $99,651 Duration $95,060 Corporate Agency Foreign Bonds 3.50 3.0 3.02 2.93 87 79 CDD Municipals 2.0 4Q 2019 1Q 2020 2Q 2020 3Q 2020 4Q 2020 MBS/CMO 3.0% Book Yield 2.5% Equity Securities $29,626 2.29% 2.0% 2.02% 1.96% 1.95% SB

Slide 15: COVID-19 Operational Response and Bank Preparedness
COVID-19 OPERATIONAL RESPONSE AND BANK PREPAREDNESS
Slide 16: COVID-19 Branch and Digital Play Critical Roles
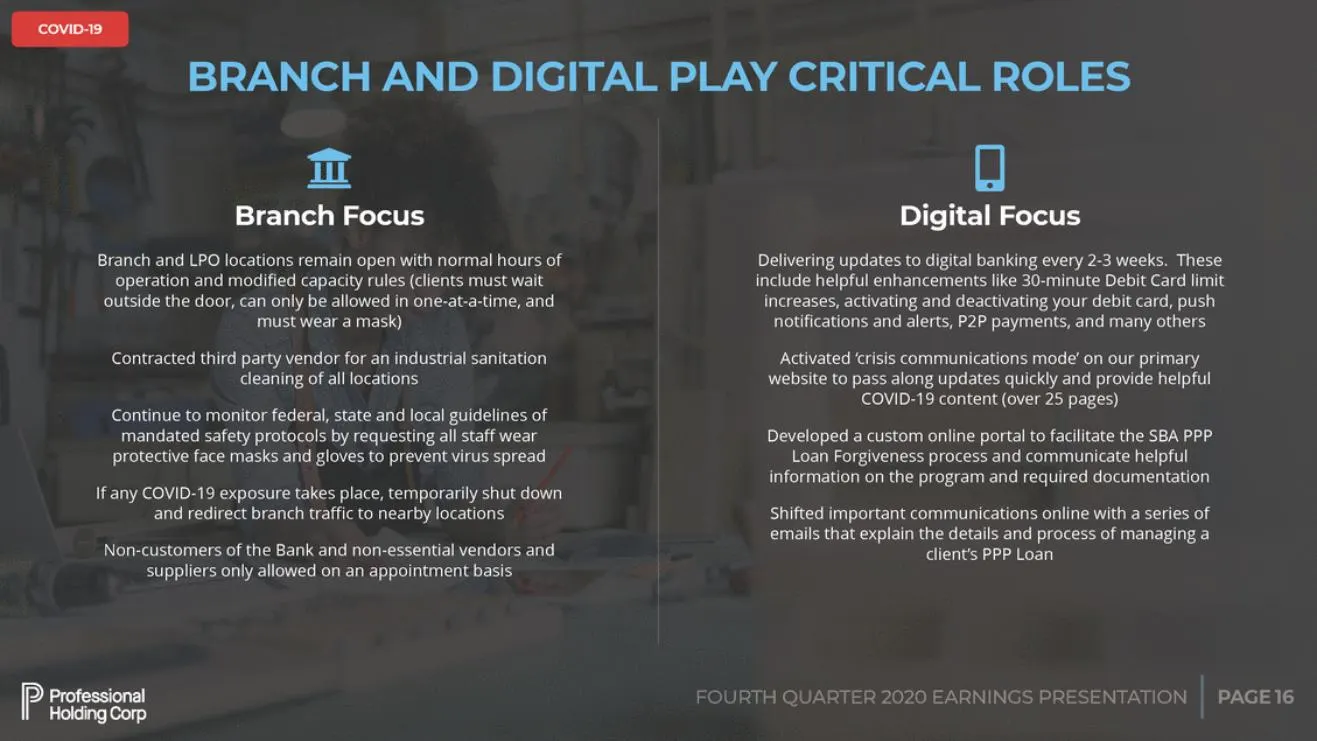
COVID-19 BRANCH AND DIGITAL PLAY CRITICAL ROLES !I! Branch Focus and LPO locations remain open with Digital Focus Delivering updates to digital banking every 2-3 weeks. These include helpful enhancements like 30-minute Debit Card limit increases, activating and deactivating your debit card, push not
Slide 17: COVID-19 Paycheck Protection Program
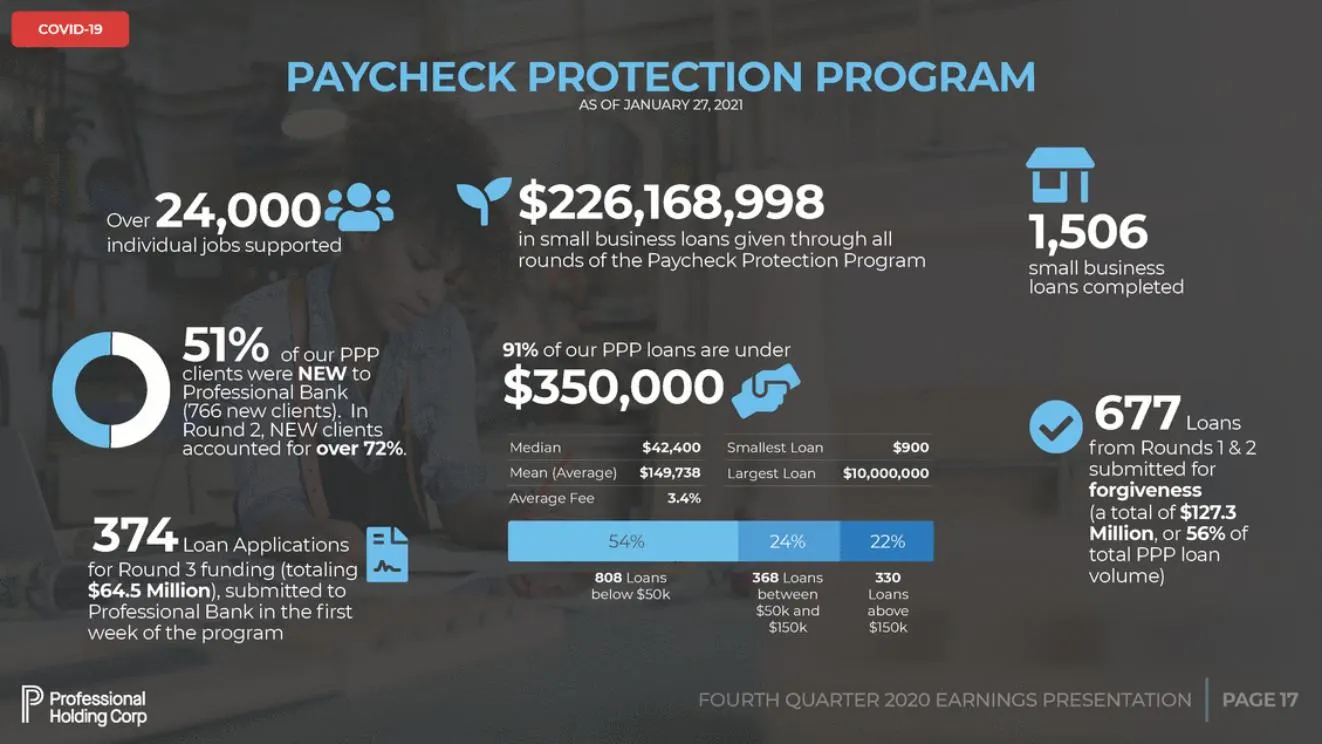
COVID-19 PAYCHECK PROTECTION AS OF JANUARY 27, 2021 PROGRAM 1,506 � 24,000la $226,168,998 in small business loans given through all Over individual jobs supported rounds of the Paycheck Protection Program small business loans completed 51% 91% of our PPP loans are under of our PPP � clients were NEW
Slide 18: COVID-19 Loan Modification Relief and Asset Quality
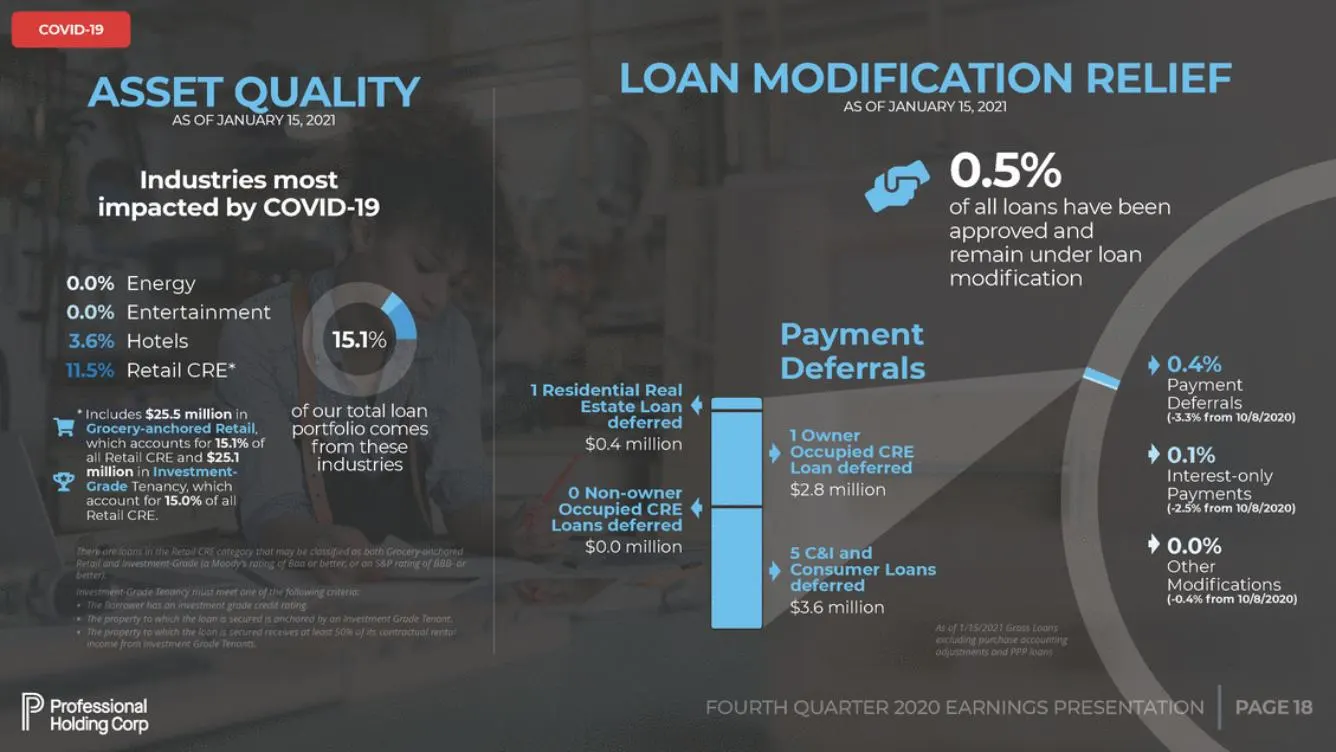
COVID-19 LOAN MODIFICATION AS OF JANUARY 15, 2021 RELIEF ASSET QUALITY AS OF JANUARY 15, 2021 0.5% of all loans have been approved and � Industries most impacted by COVID-19 remain under modification loan 0.0% 0.0% 3.6% 11.5% Energy Entertainment Hotels Retail CRE* Payment Deferrals 15.1% 0.4% Payme
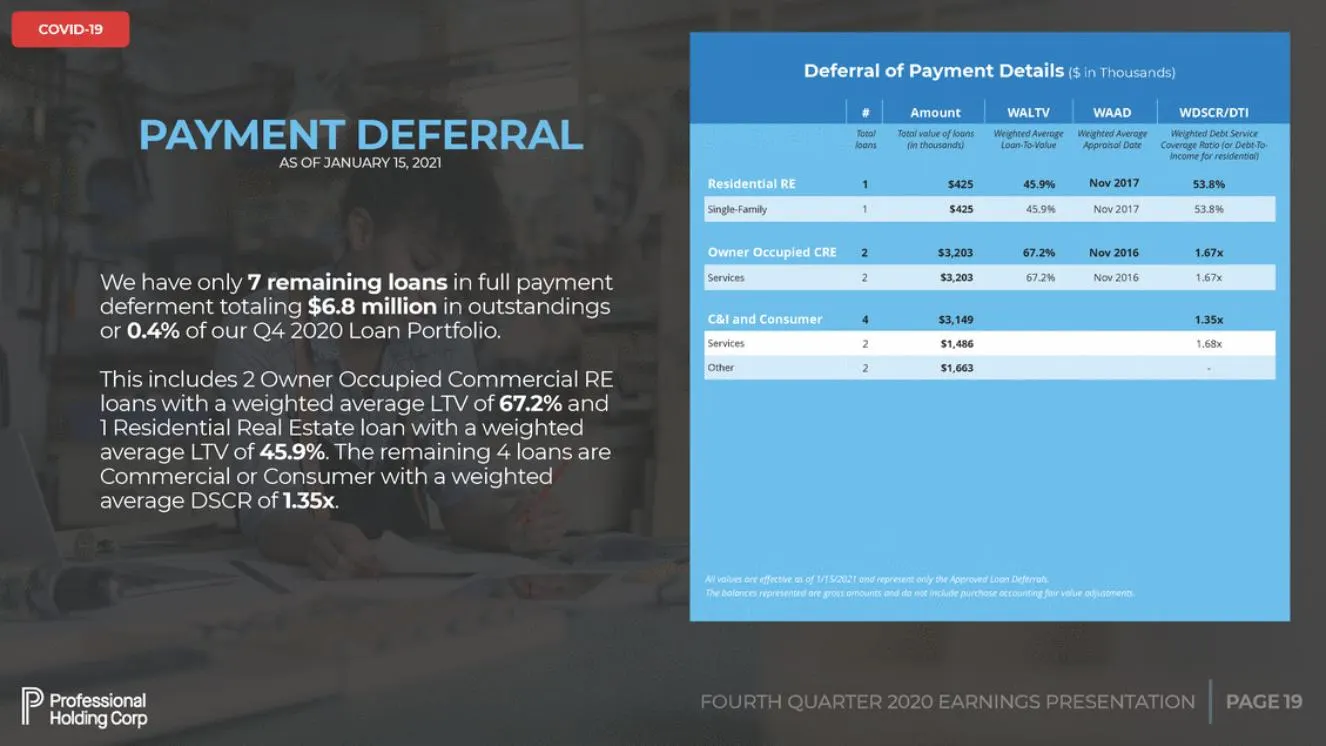
Slide 19: Total loans and weighted average loan-to-value
Total loans Total value of loans (in thousands) Weighted Average Loan-To-Value Weighted Average Appraisal Date Weighted Debt Service Coverage Ratio (or Debt-To-Income for residential) Nov 2017 53.8o/o $425 45.9o/o 1 53.8% 1 $425 45.9% Nov 2017 Single-Family 67.2o/o Nov 2016 1.67x 2 $3,203 $3,203 67.
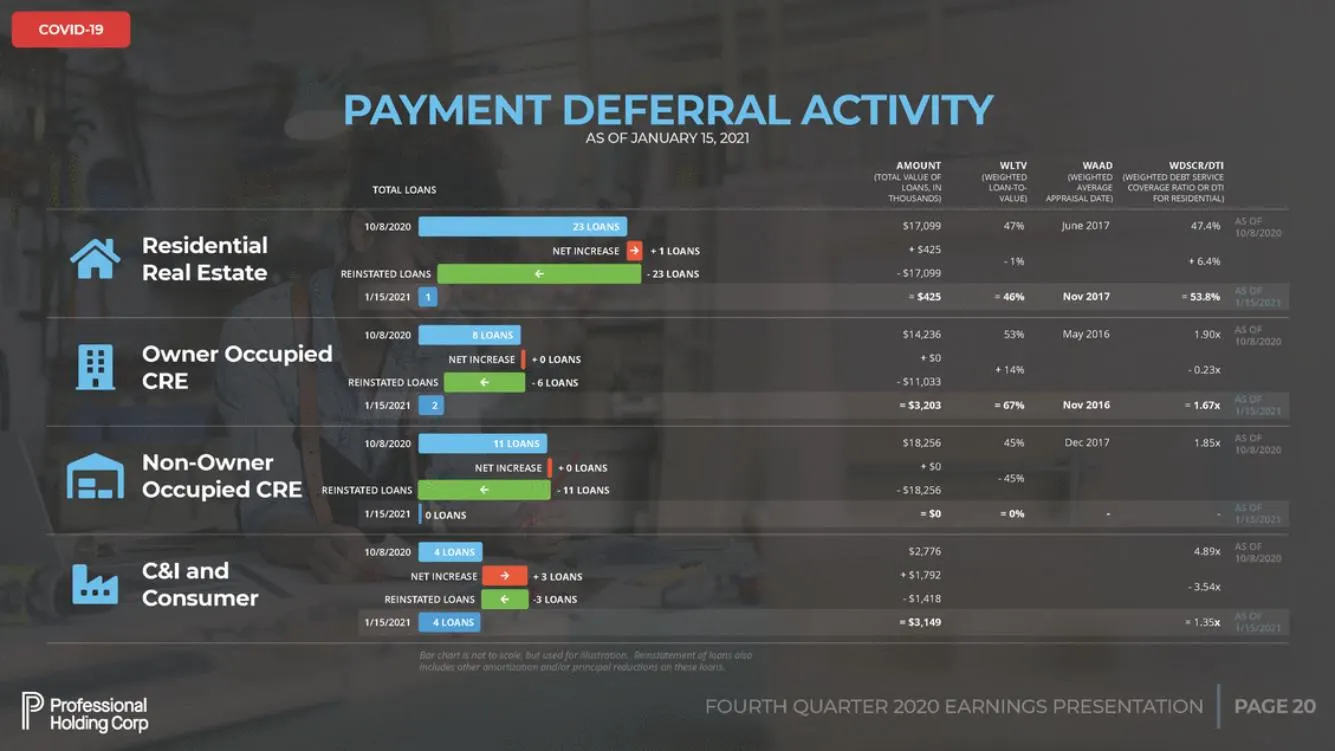
Slide 20: COVID-19 Payment Deferral
COVID-19 PAYMENT DEFERRAL AS OF JANUARY 15, 2021 ACTIVITY AMOUNT (TOTAL VALUE OF LOANS, IN THOUSANDS) WLTV (WEIGHTED LOAN-TO-VALUE) WAAD (WEIGHTED AVERAGE APPRAISAL DATE) WDSCR/DTI (WEIGHTED DEBT SERVICE COVERAGE RATIO OR DTI FOR RESIDENTIAL) TOTAL LOANS AS OF 10/8/2020 $17,099 47% June 2017 47.4% 1
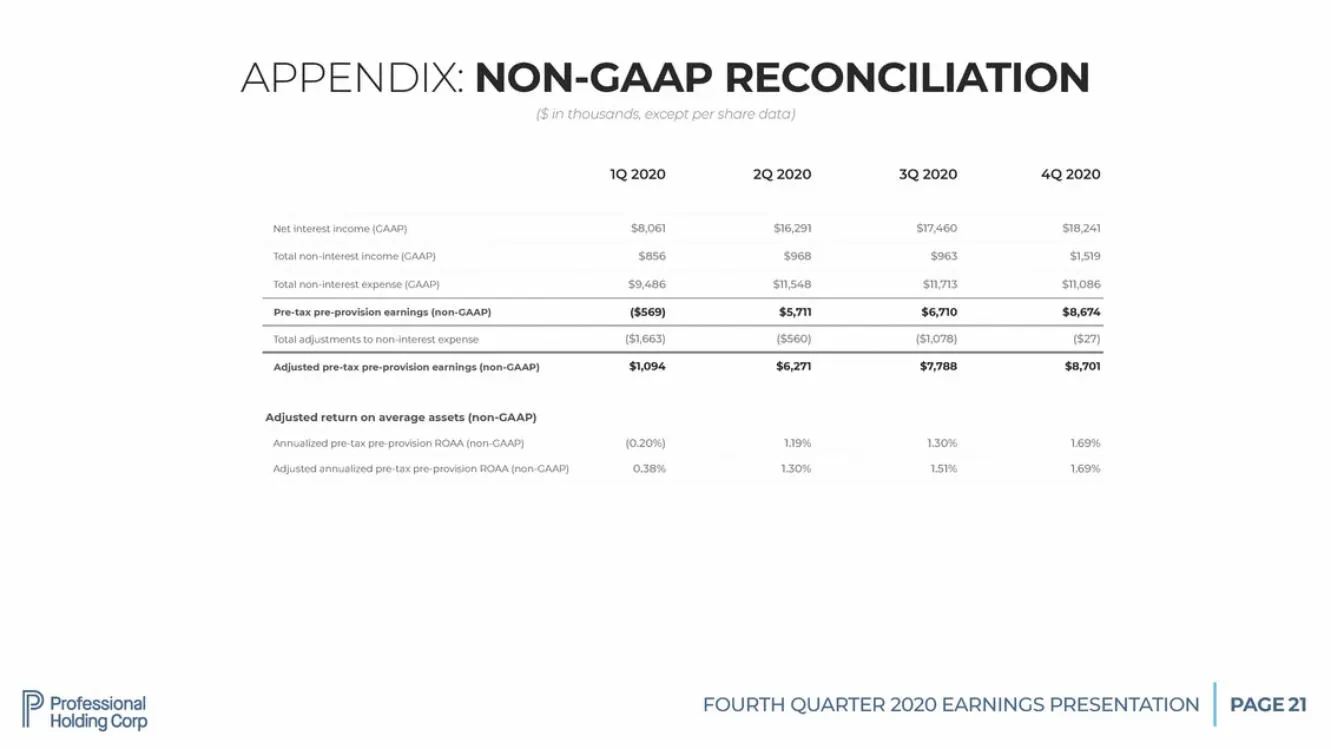
Slide 21: Appendix: Non-GAAP Reconciliation
APPENDIX: NON-GAAP RECONCILIATION ($ in thousands, except per share data) FOURTH QUARTER 2020 EARNINGS PRESENTATION PAGE 21 1Q 2020 2Q 2020 3Q 2020 4Q 2020 Net interest income (GAAP) $8,061 $16,291 $17,460 $18,241 Total non-interest income (GAAP) $856 $968 $963 $1,519 Total non-interest expense (GAA
Source: SEC EDGAR · 8-K filed Jan 29, 2021
More decks from Professional Holding Corp
 Q3 2022 Earnings Presentation19 slides · Oct 28, 2022
 Q2 2022 Earnings Presentation20 slides · Jul 28, 2022
 Q1 2022 Earnings Presentation21 slides · Apr 29, 2022
 Q4 2021 Earnings Presentation19 slides · Jan 27, 2022
 Q3 2021 Earnings Presentation19 slides · Oct 28, 2021
 Q2 2021 Earnings Presentation18 slides · Jul 29, 2021