Heidrick & Struggles International
Heidrick & Struggles International — CL King Best Ideas Conference 2003
33 slides from Heidrick & Struggles International's conference presentation, Sep 10, 2003
Slide 1: Heidrick & Struggles CL King Best Ideas Conference
H EIDRICK & S TRUGGLES C L King Best Ideas Conference September 10, 2003
Slide 2: Safe Harbor Statement
Safe Harbor Statement This news release contains forward-looking statements. The forward-looking statements are based on current expectations, estimates, forecasts and projections about the industry in which we operate and management’s beliefs and assumptions. Forward-looking statements may be ident

Slide 3: Business Overview
Business Overview
Slide 4: Heidrick & Struggles
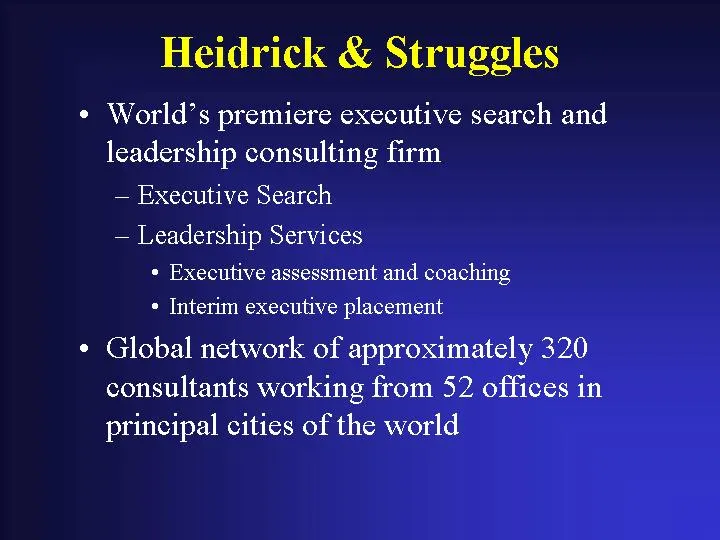
Heidrick & Struggles • World’s premiere executive search and leadership consulting firm – Executive Search – Leadership Services • Executive assessment and coaching • Interim executive placement • Global network of approximately 320 consultants working from 52 offices in principal cities of the worl
Slide 5: Global Presence
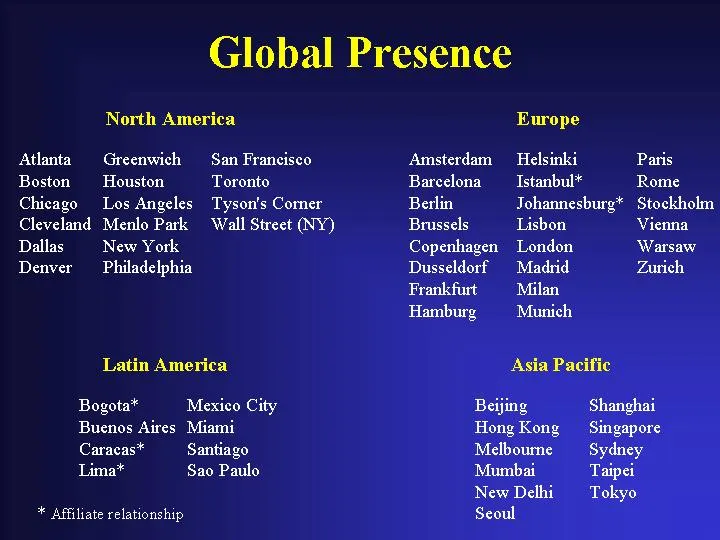
Global Presence North America Europe Atlanta Greenwich San Francisco Amsterdam Helsinki Paris Boston Houston Toronto Barcelona Istanbul* Rome Chicago Los Angeles Tyson’s Corner Berlin Johannesburg* Stockholm Cleveland Menlo Park Wall Street (NY) Brussels Lisbon Vienna Dallas New York Copenhagen Lond
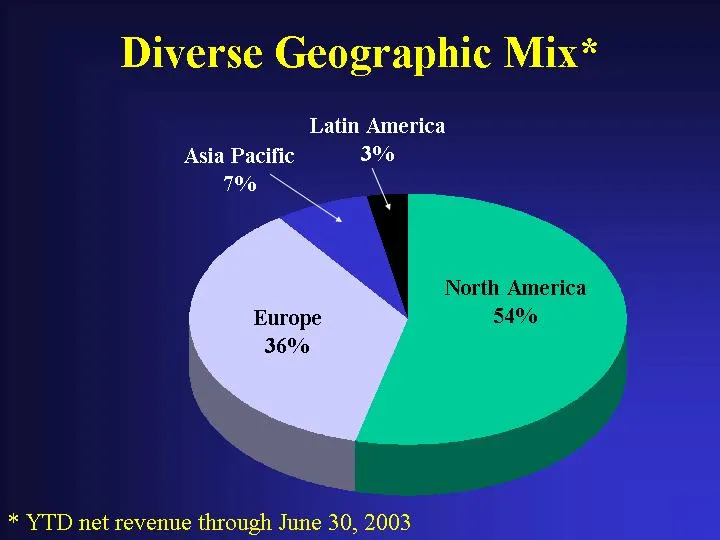
Slide 6: Diverse Geographic Mix
Diverse Geographic Mix* [PIE CHART] * YTD net revenue through June 30, 2003
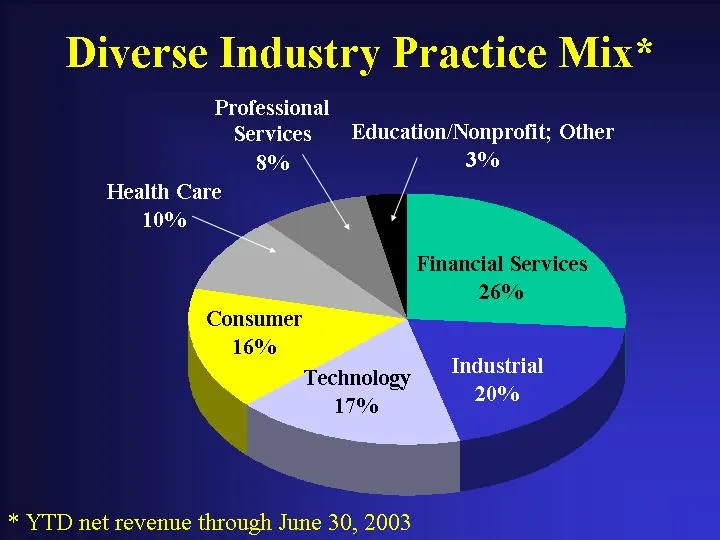
Slide 7: Diverse Industry Practice Mix
Diverse Industry Practice Mix* [PIE CHART] * YTD net revenue through June 30, 2003
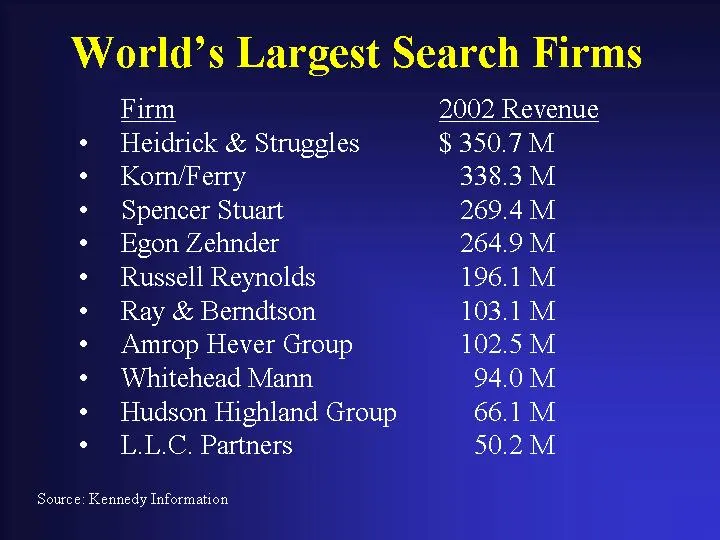
Slide 8: World's Largest Search Firms
World’s Largest Search Firms Firm 2002 Revenue • Heidrick & Struggles $ 350.7 M • Korn/Ferry 338.3 M • Spencer Stuart 269.4 M • Egon Zehnder 264.9 M • Russell Reynolds 196.1 M • Ray & Berndtson 103.1 M • Amrop Hever Group 102.5 M • Whitehead Mann 94.0 M • Hudson Highland Group 66.1 M • L.L.C. Partne
Slide 9: Our Mission
Our Mission We help our clients build the best leadership teams in the world
Slide 10: Focus on Top-Level Services
Focus on Top-Level Services • Board, CEO and other senior-level searches generate the majority of our revenue • Advantages of top-level searches – Provides access and influence with decision makers – Strengthens the Heidrick & Struggles brand – Generates higher fees per search – Establishes barriers
Slide 11: Representative CEO/Board Searches in 2002-2003
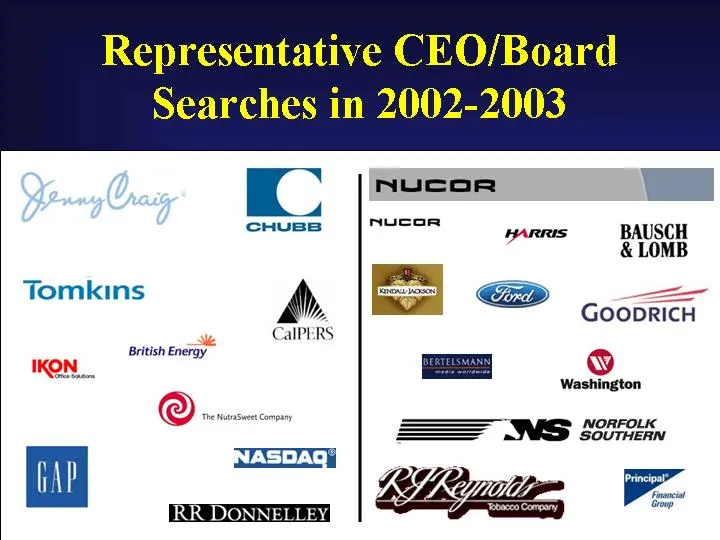
Representative CEO/Board Searches in 2002-2003 [LOGO OF JENNY CRAIG] [LOGO OF CHUBB] [LOGO OF NUCOR] [LOGO OF NUCOR] [LOGO OF HARRIS] [LOGO OF BAUSCH & LOMB [LOGO OF TOMKINS] [LOGO OF KENDALL JACKSON] [LOGO OF FORD] [LOGO OF GOODRICH] [LOGO OF CALPERS] [LOGO OF IKON] [LOGO OF BRITISH ENERGY] [LOGO O
Slide 12: Economics of the Firm
Economics of the Firm • Fees – For executive search it is one-third of placement’s first year cash compensation • Includes salary and bonus • Billed in three monthly installments – Project based for board services, leadership services • Consultant compensation – Primarily cash – 70% based on revenue
Slide 13: Financial Performance
Financial Performance
Slide 14: Revenue Performance & Consultant Headcount
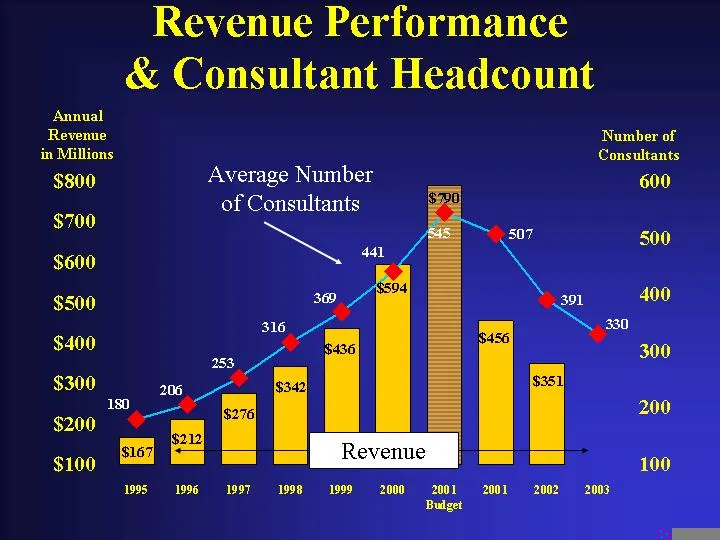
Revenue Performance & Consultant Headcount [GRAPH]
Slide 15: Realigned Cost Structure
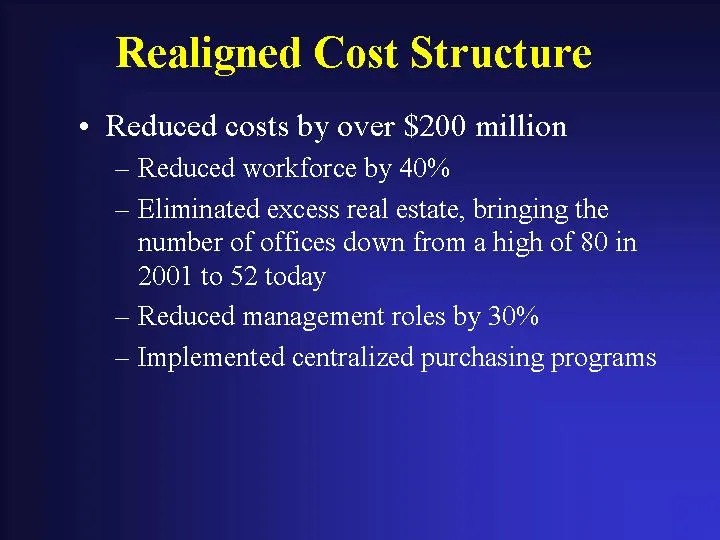
Realigned Cost Structure • Reduced costs by over $200 million – Reduced workforce by 40% – Eliminated excess real estate, bringing the number of offices down from a high of 80 in 2001 to 52 today – Reduced management roles by 30% – Implemented centralized purchasing programs
Slide 16: Pro Forma Financial Results
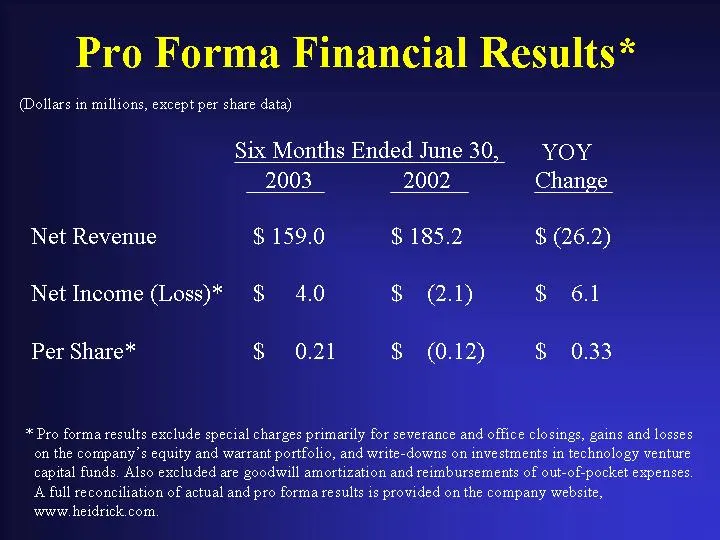
Pro Forma Financial Results* (Dollars in millions, except per share data) Six Months Ended June 30, YOY Change 2003 2002 Net Revenue $ 159.0 $ 185.2 $ (26.2 ) Net Income (Loss)* $ 4.0 $ (2.1 ) $ 6.1 Per Share* $ 0.21 $ (0.12 ) $ 0.33 * Pro forma results exclude special charges primarily for severanc
Slide 17: Outlook
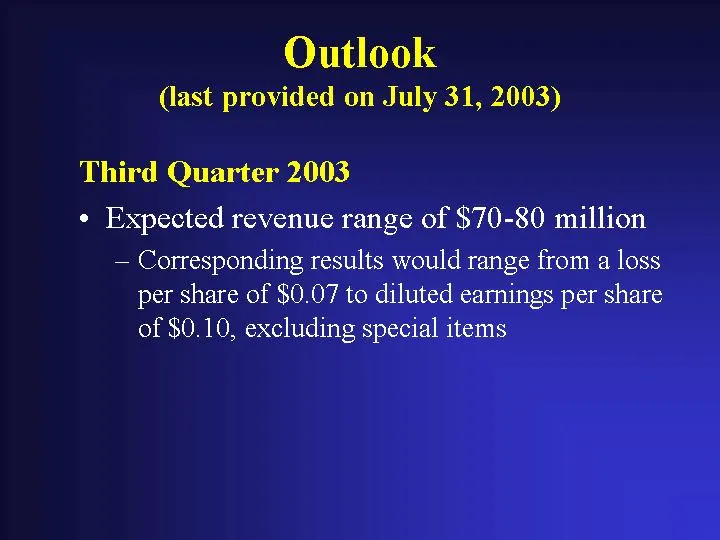
Outlook (last provided on July 31, 2003) Third Quarter 2003 • Expected revenue range of $70-80 million – Corresponding results would range from a loss per share of $0.07 to diluted earnings per share of $0.10, excluding special items
Slide 18: Strong Balance Sheet
Strong Balance Sheet • Strongest in the industry • Cash flow positive in 2002 despite significant restructuring activity • Ended second quarter of 2003 with $96 million cash and no debt • Expect $100-110 million cash at end of third quarter of 2003
Slide 19: Strategic Initiatives
Strategic Initiatives
Slide 20: Strategic Focus
Strategic Focus • Some ongoing work on the cost structure • Majority of attention will be spent on market-facing activities
Slide 21: Strategic Initiatives
Strategic Initiatives • Expand aggressively our share of senior-level search, supported by our capabilities in complementary leadership services
Slide 22: Strategic Initiatives
Strategic Initiatives • Expand aggressively our share of senior-level search, supported by our capabilities in complementary leadership services • Build broader, deeper client relationships
Slide 23: Strategic Initiatives
Strategic Initiatives • Expand aggressively our share of senior-level search, supported by our capabilities in complementary leadership services • Build broader, deeper client relationships • Attract and retain the best consultants
Slide 24: Strategic Initiatives
Strategic Initiatives • Expand aggressively our share of senior-level search, supported by our capabilities in complementary leadership services • Build broader, deeper client relationships • Attract and retain the best consultants • Improve profitability and cash flow
Slide 25: This Is A Growth Business
This Is A Growth Business • The past four years have been aberrations – 1999 and 2000 saw hyper-growth – 2001 and 2002 saw severe contraction • Cyclicality more pronounced than previous recessions • 1993-1998 CAGR was 24% • Double-digit growth rates should return when the economy improves • Fundamen
Slide 26: Fundamentals Are Strong
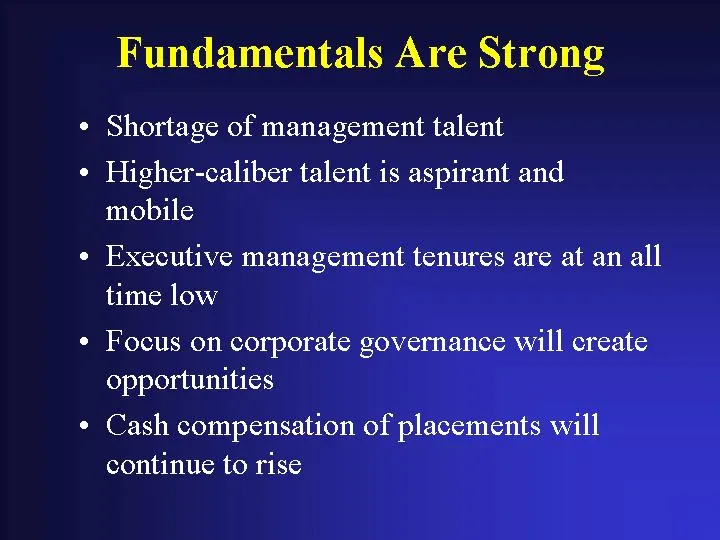
Fundamentals Are Strong • Shortage of management talent • Higher-caliber talent is aspirant and mobile • Executive management tenures are at an all time low • Focus on corporate governance will create opportunities • Cash compensation of placements will continue to rise
Slide 27: Summary
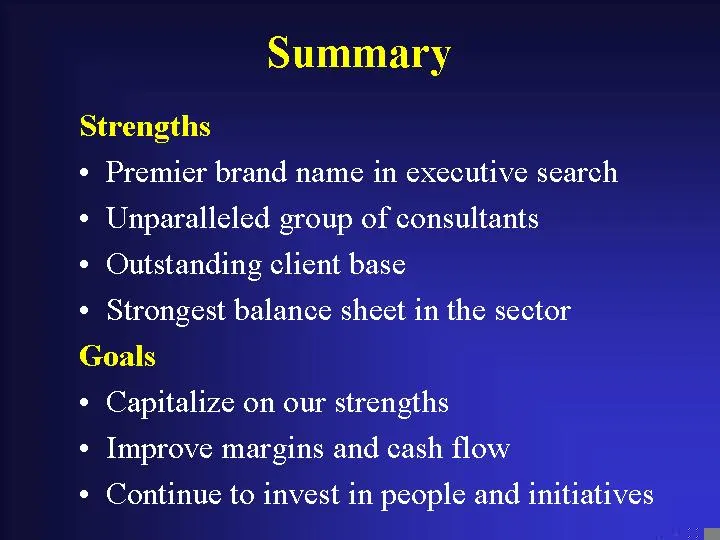
Summary Strengths • Premier brand name in executive search • Unparalleled group of consultants • Outstanding client base • Strongest balance sheet in the sector Goals • Capitalize on our strengths • Improve margins and cash flow • Continue to invest in people and initiatives
Slide 28: Heidrick & Struggles
H EIDRICK & S TRUGGLES
Slide 29: Reconciliation of Pro Forma Results
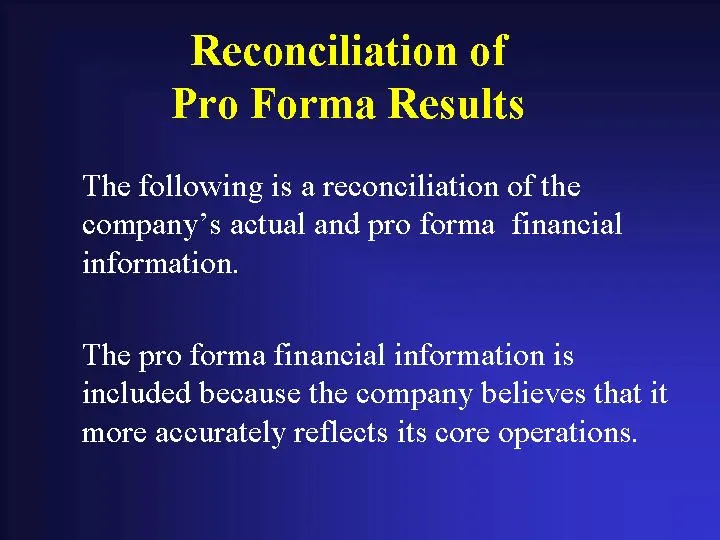
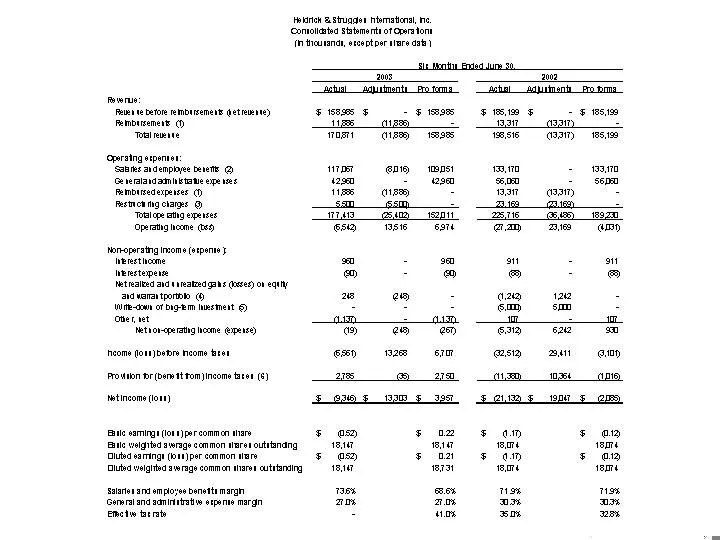
Reconciliation of Pro Forma Results The following is a reconciliation of the company’s actual and pro forma financial information. The pro forma financial information is included because the company believes that it more accurately reflects its core operations.
Slide 30: Consolidated Statements of Operations
Heidrick & Struggles International, Inc. Consolidated Statements of Operations (In thousands, except per share data) Six Months Ended June 30, 2003 2002 Actual Adjustments Pro forma Actual Adjustments Pro forma Revenue: Revenue before reimbursements (net revenue) $ 158,985 $ — $ 158,985 $ 185,199 $
Slide 31: Reconciliation footnotes: EITF 01-14 and separation charges
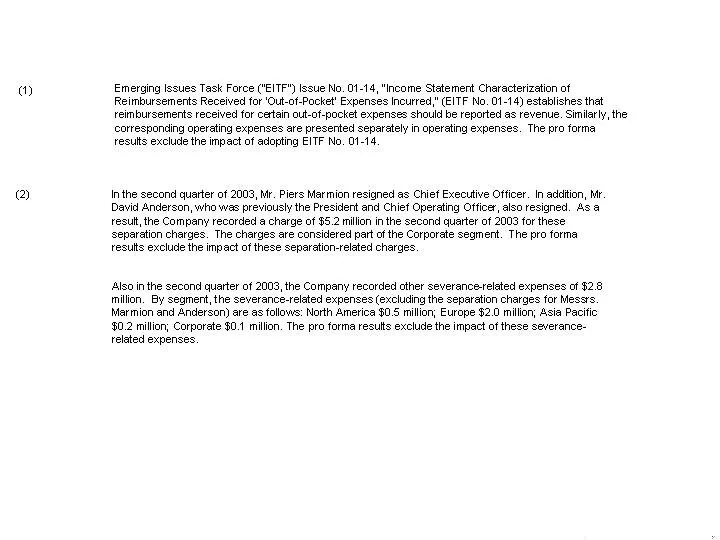
(1) Emerging Issues Task Force (“EITF”) Issue No. 01-14, “Income Statement Characterization of Reimbursements Received for ‘Out-of-Pocket’ Expenses Incurred,” (EITF No. 01-14) establishes that reimbursements received for certain out-of-pocket expenses should be reported as revenue. Similarly, the co
Slide 32: Reconciliation footnotes: restructuring charges
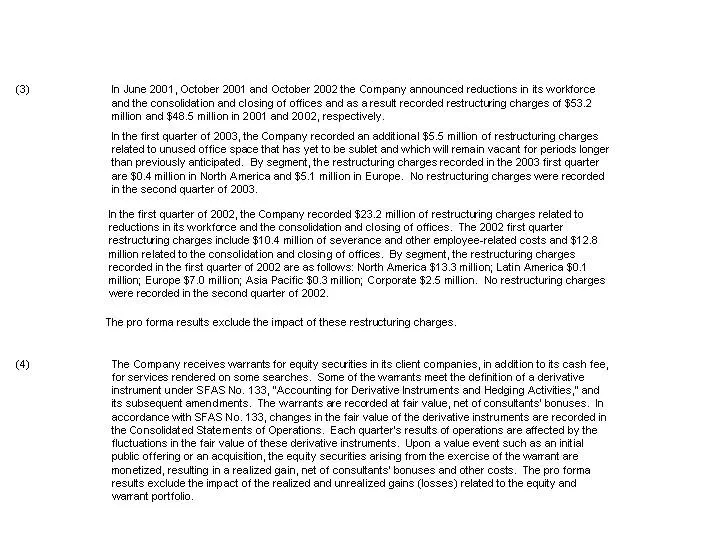
(3) In June 2001, October 2001 and October 2002 the Company announced reductions in its workforce and the consolidation and closing of offices and as a result recorded restructuring charges of $53.2 million and $48.5 million in 2001 and 2002, respectively. In the first quarter of 2003, the Company r
Slide 33: Reconciliation footnotes: ETF Group write-down and tax provision
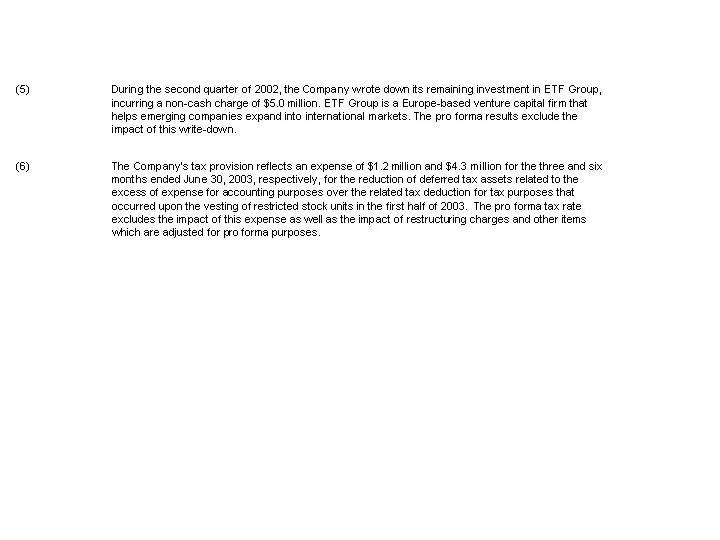
(5) During the second quarter of 2002, the Company wrote down its remaining investment in ETF Group, incurring a non-cash charge of $5.0 million. ETF Group is a Europe-based venture capital firm that helps emerging companies expand into international markets. The pro forma results exclude the impact
Source: SEC EDGAR · 8-K filed Sep 10, 2003
More decks from Heidrick & Struggles International
 Q1 2025 Earnings Presentation20 slides · May 5, 2025
 Q4 2024 Earnings Presentation26 slides · Mar 3, 2025
 Investor Day (December 2024)68 slides · Dec 3, 2024
 Q3 2024 Earnings Presentation24 slides · Nov 4, 2024
 Q2 2024 Earnings Presentation25 slides · Jul 29, 2024
 Q1 2024 Earnings Presentation25 slides · May 6, 2024