Arlington Asset Investment Corp
Arlington Asset Investment — Investor Presentation (July 2013)
12 slides from Arlington Asset Investment's investor presentation, Jul 30, 2013

Slide 1: Investor Presentation July 30, 2013
Investor Presentation July 30, 2013
Slide 2: Information Related to Forward-Looking Statements
1 Information Related to Forward - Looking Statements This presentation contains “forward - looking statements” within the meaning of the Private Securities Litigation Reform Act of 19 95. These include statements regarding future results or expectations. Forward - looking statements can be identifi
Slide 3: Consistent and attractive profitability
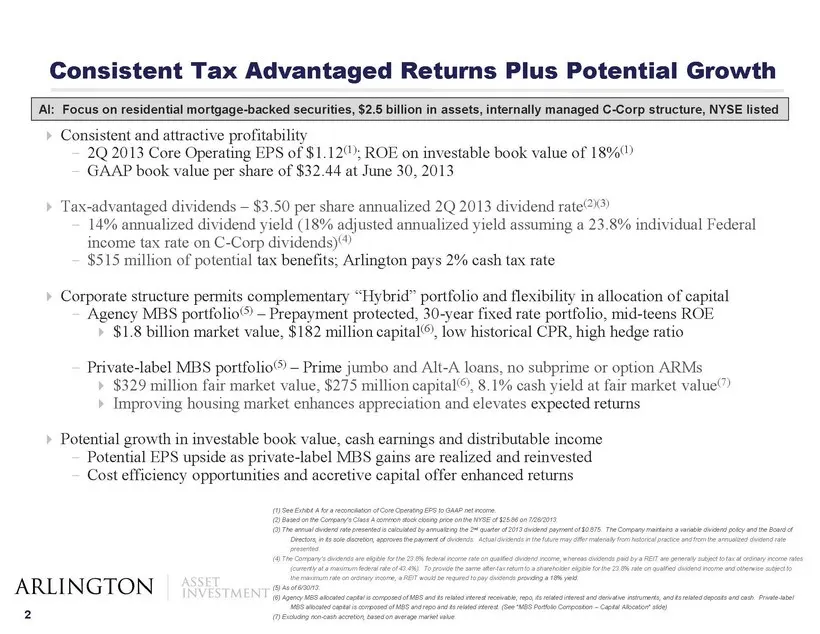
2 Consistent and attractive profitability - 2Q 2013 Core Operating EPS of $ 1.12 (1) ; ROE on investable book value of 18% (1) - GAAP book value per share of $32.44 at June 30, 2013 Tax - advantaged dividends – $3.50 per share annualized 2Q 2013 dividend rate (2)( 3 ) - 14% annualized dividend y
Slide 4: Flexibility to allocate capital to best risk/return opportunities
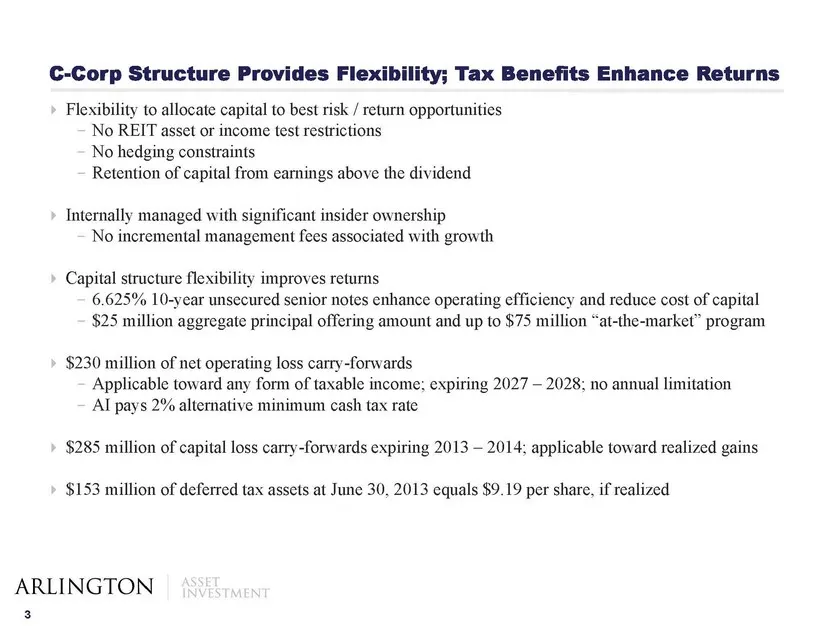
3 Flexibility to allocate capital to best risk / return opportunities - No REIT asset or income test restrictions - No hedging constraints - Retention of capital from earnings above the dividend Internally managed with significant insider ownership - No incremental management fees associated wit
Slide 5: Complementary Hybrid MBS Portfolio Generates Consistent EPS
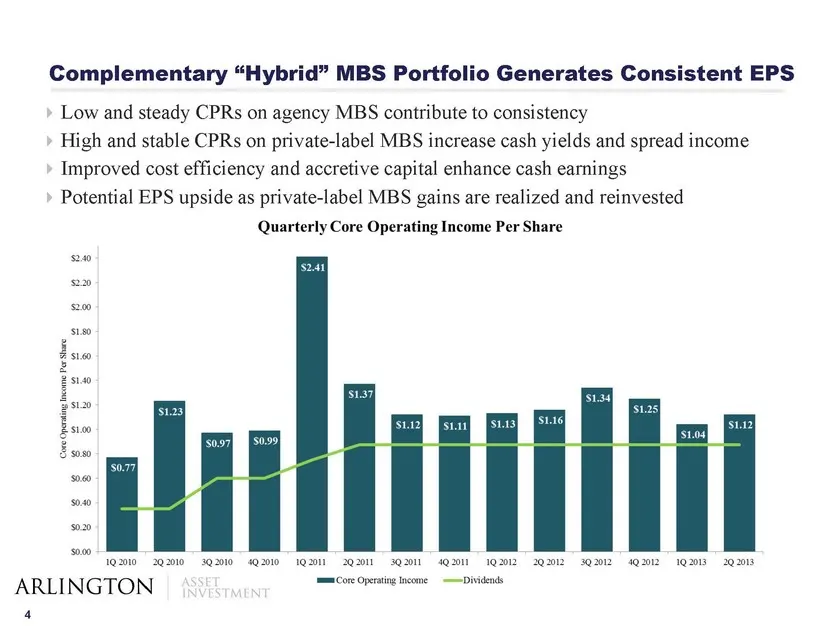
4 Complementary “Hybrid” MBS Portfolio Generates Consistent EPS Low and steady CPRs on agency MBS contribute to consistency High and stable CPRs on private - label MBS increase cash yields and spread income Improved cost efficiency and accretive capital enhance cash earnings Potential EPS up
Slide 6: MBS Portfolio Composition – Capital Allocation
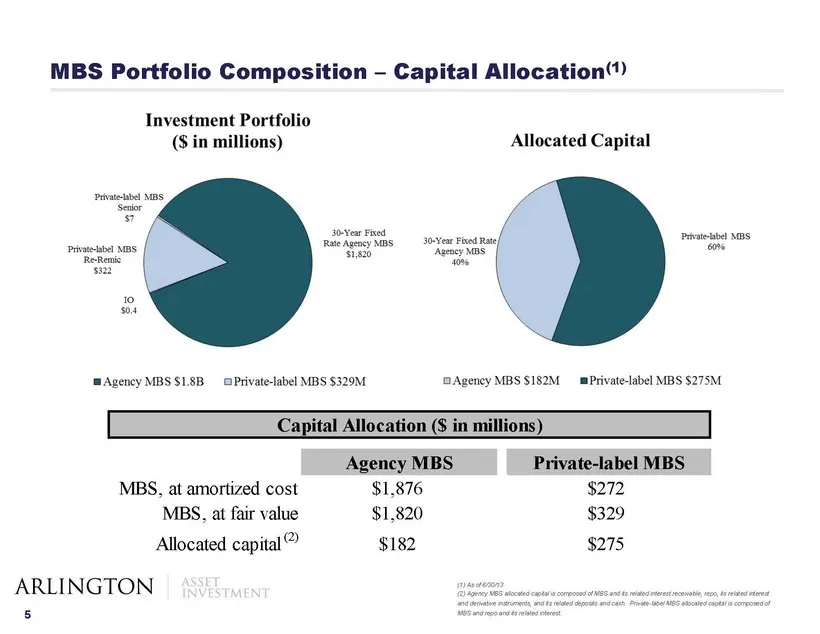
5 MBS Portfolio Composition – Capital Allocation (1) (1) As of 6/30/13 . (2) Agency MBS allocated capital is composed of MBS and its related interest receivable, repo, its related interest and derivative instruments, and its related deposits and cash. Private - label MBS allocated capital is compose
Slide 7: Illustrative MBS Portfolio Returns
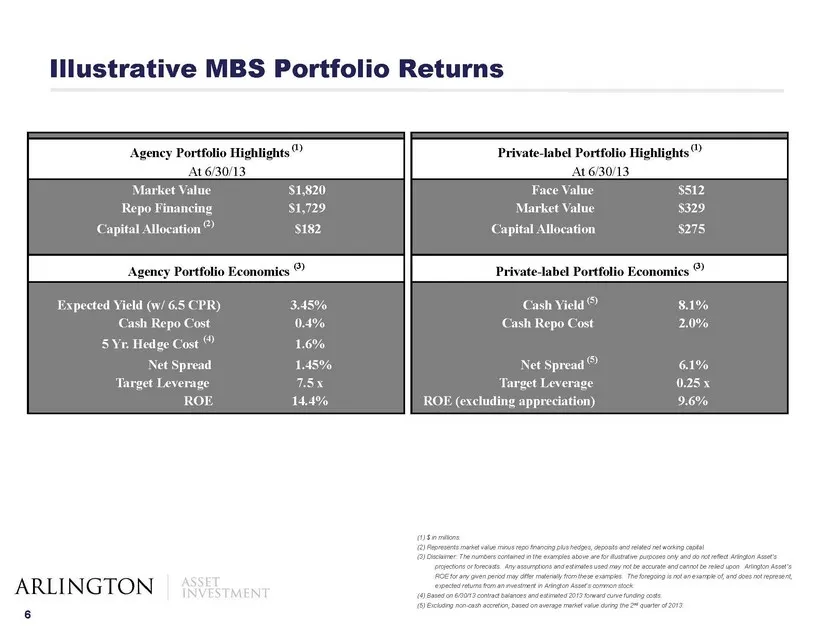
6 Illustrative MBS Portfolio Returns (1) $ in millions. (2) Represents market value minus repo financing plus hedges , deposits and related net working capital. (3) Disclaimer: The numbers contained in the examples above are for illustrative purposes only and do not reflect Arlington Asset’s project
Slide 8: MBS Portfolio Profile
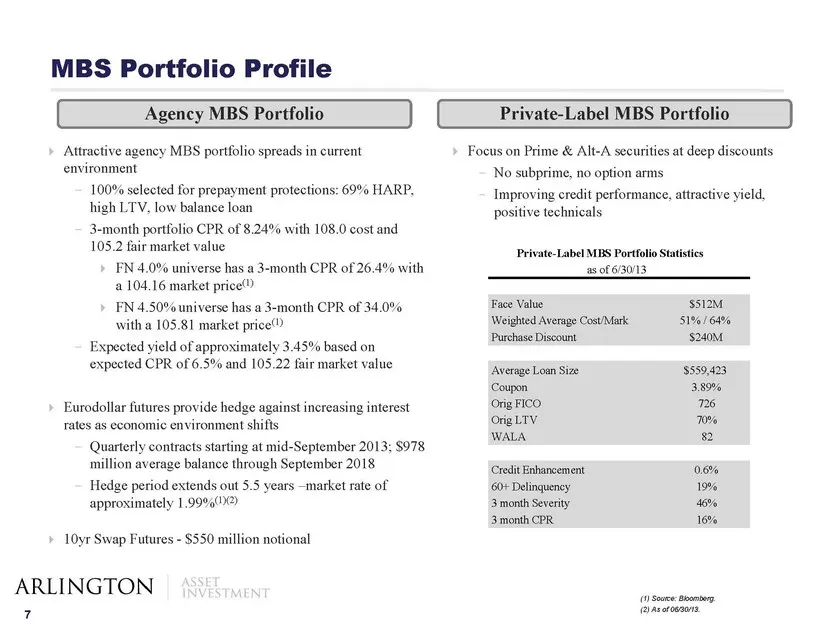
7 MBS Portfolio Profile Attractive agency MBS portfolio spreads in current environment - 100% selected for prepayment protections: 69% HARP, high LTV, low balance loan - 3 - month portfolio CPR of 8.24% with 108.0 cost and 105.2 fair market value FN 4.0% universe has a 3 - month CPR of 26.4% wit
Slide 9: Private-label MBS Portfolio: Key Characteristics
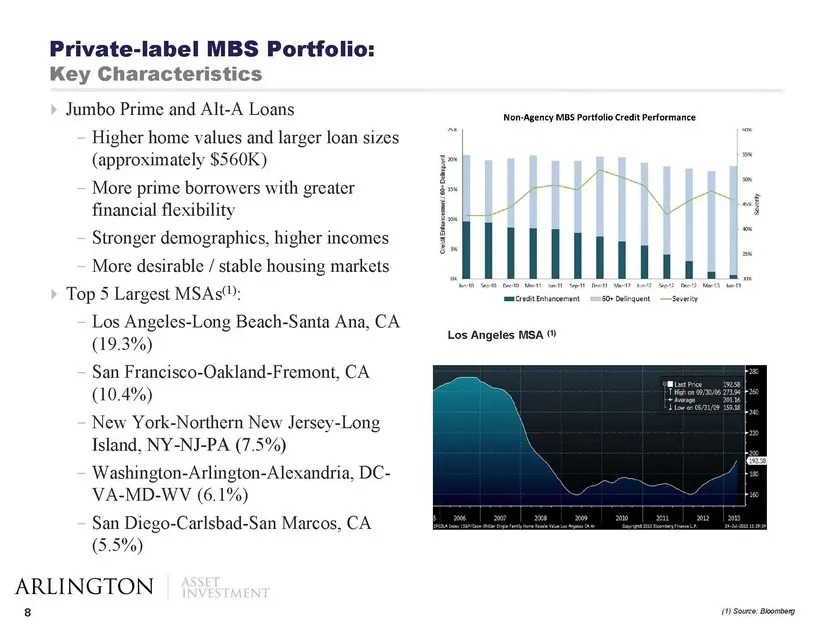
8 Private - label MBS Portfolio: Key Characteristics Jumbo Prime and Alt - A Loans - Higher home values and larger loan sizes (approximately $560K) - More prime borrowers with greater financial flexibility - Stronger demographics, higher incomes - More desirable / stable housing markets Top 5 La
Slide 10: U.S. Home Prices
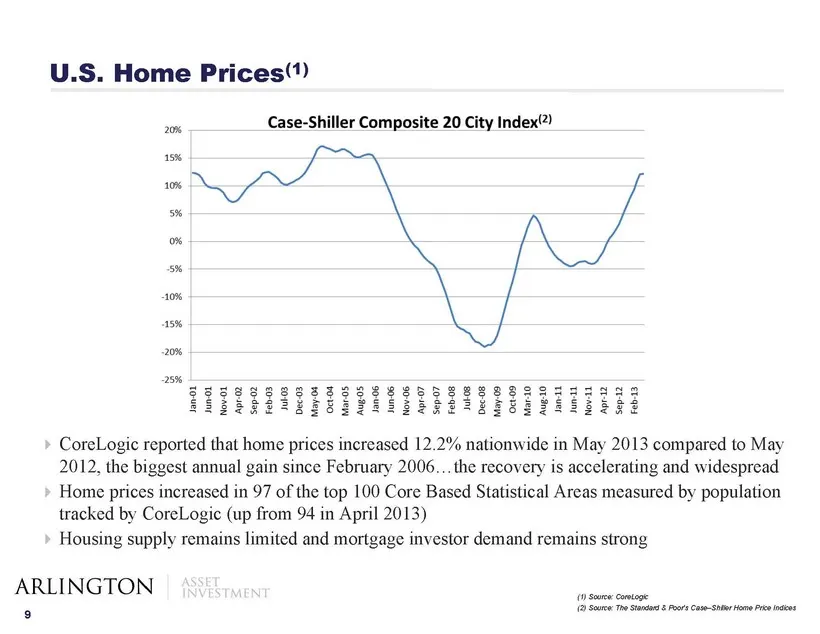
9 U.S. Home Prices (1 ) CoreLogic reported that home prices increased 12.2% nationwide in May 2013 compared to May 2012, the biggest annual gain since February 2006…the recovery is accelerating and widespread Home prices increased in 97 of the top 100 Core Based Statistical Areas measured by pop
Slide 11: Asset selection and performance provides consistent spread income and opportunity for growth
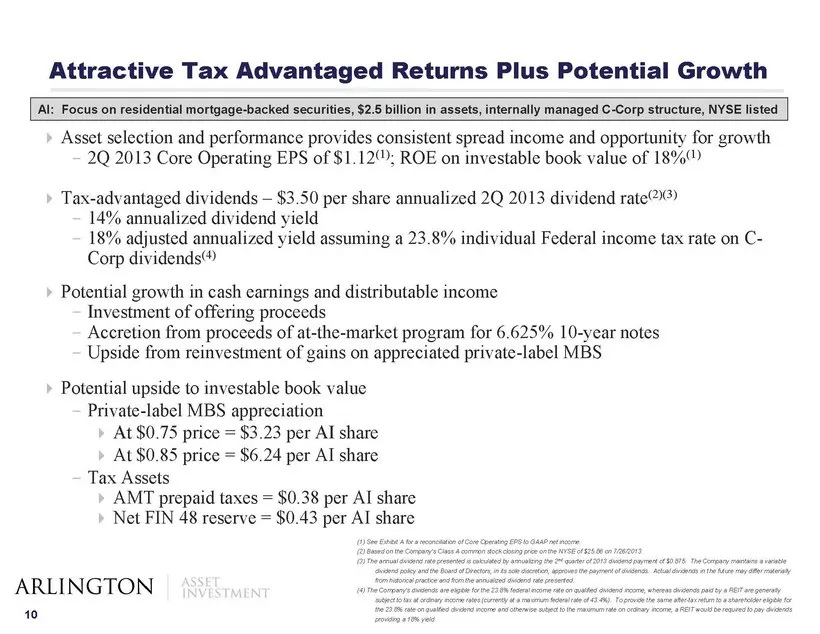
10 Asset selection and performance provides consistent spread income and opportunity for growth - 2 Q 2013 Core Operating EPS of $ 1.12 (1) ; ROE on investable book value of 18 % (1) Tax - advantaged dividends – $3.50 per share annualized 2 Q 2013 dividend rate (2)( 3 ) - 14% annualized dividend
Slide 12: Exhibit A
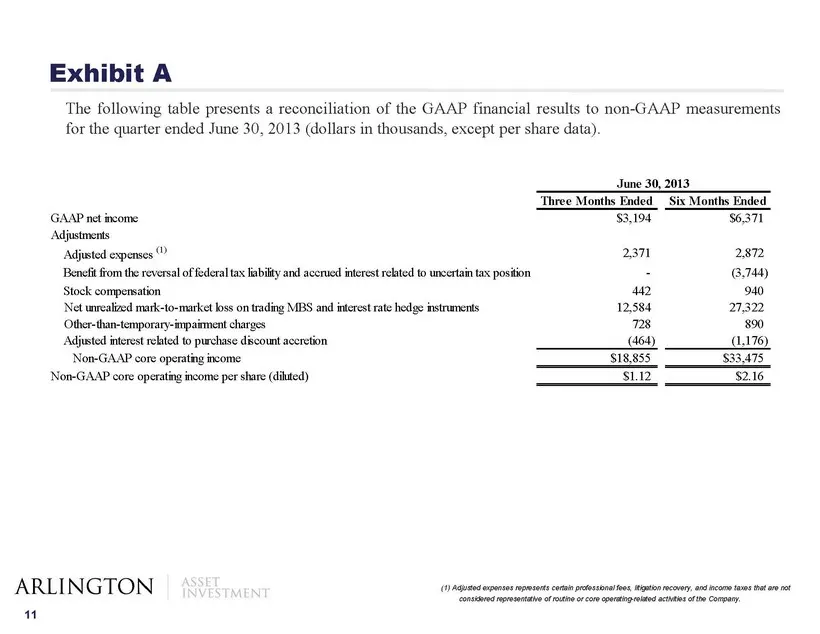
11 Exhibit A The following table presents a reconciliation of the GAAP financial results to non - GAAP measurements for the quarter ended June 30 , 2013 (dollars in thousands, except per share data) . ( 1) Adjusted expenses represents certain professional fees, litigation recovery, and income taxes
Source: SEC EDGAR · 8-K filed Jul 30, 2013
More decks from Arlington Asset Investment Corp
 Q3 2023 Earnings Presentation12 slides · Nov 13, 2023
 Q2 2023 Earnings Presentation12 slides · Aug 14, 2023
 Q1 2023 Earnings Presentation16 slides · May 15, 2023
 Q4 2022 Earnings Presentation20 slides · Mar 31, 2023
 Q3 2022 Earnings Presentation29 slides · Nov 15, 2022
 Q2 2022 Earnings Presentation31 slides · Aug 10, 2022