James River Coal — Raymond James 30th Annual Institutional Investors Conference (March 2009)
24 slides from James River Coal's conference presentation, Mar 10, 2009
Slide 1: Raymond James 30th Annual Institutional Investors Conference
Raymond James 30 th Annual Institutional Investors Conference Peter T. Socha Chief Executive Officer March 10, 2009
Slide 2: Forward-Looking Statements
Forward-Looking Statements Certain statements in this presentation, and other written or oral statements made by or on behalf of us, are "forward-looking statements" within the meaning of the federal securities laws. Statements regarding future events and developments and our future performance, as
Slide 3: The Market View in 2007: NYMEX Coal Prices 2005-2008
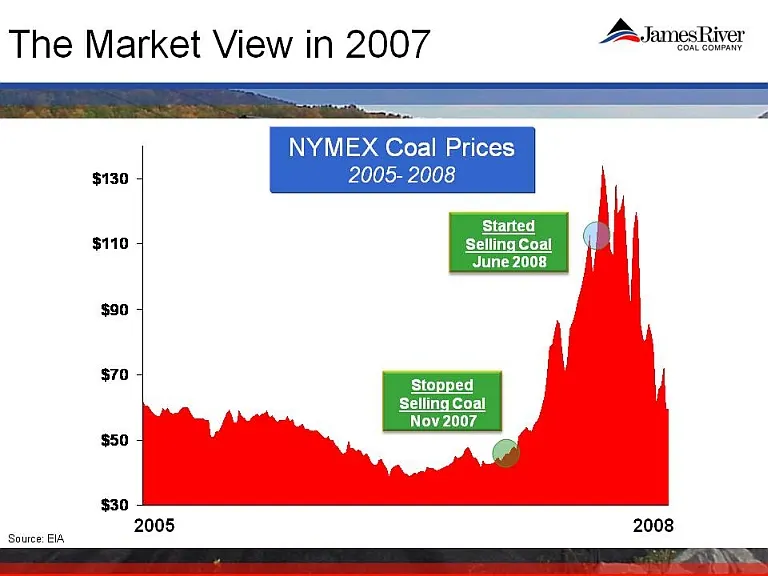
The Market View in 2007 NYMEX Coal Prices2005-2008 Started Selling Coal June 2008 Stopped Selling Coal Nov 2007 $130 $110 $90 $70 $50 $30 2005 2008
Slide 4: 2009…..FINALLY!!
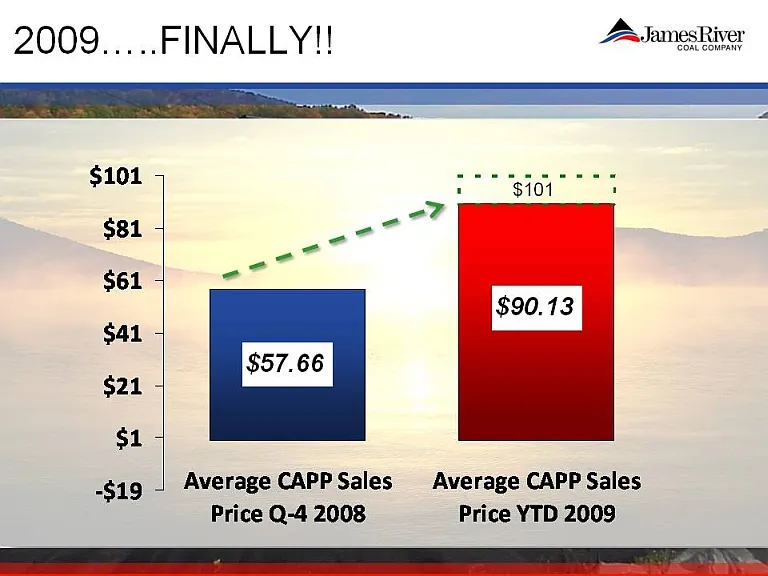
2009…..FINALLY!! $81 $101 $61 $41 $21 $19$1 Average CAPP Sales $19 Price Q4 2008 Price YTD 2009 $57.66 $90.13 $101
Slide 5: Agenda
Agenda ●Company Profile●2009 Guidance●Thing We Are Watching ●Market Analysis and Strategy
Slide 6: Company Profile
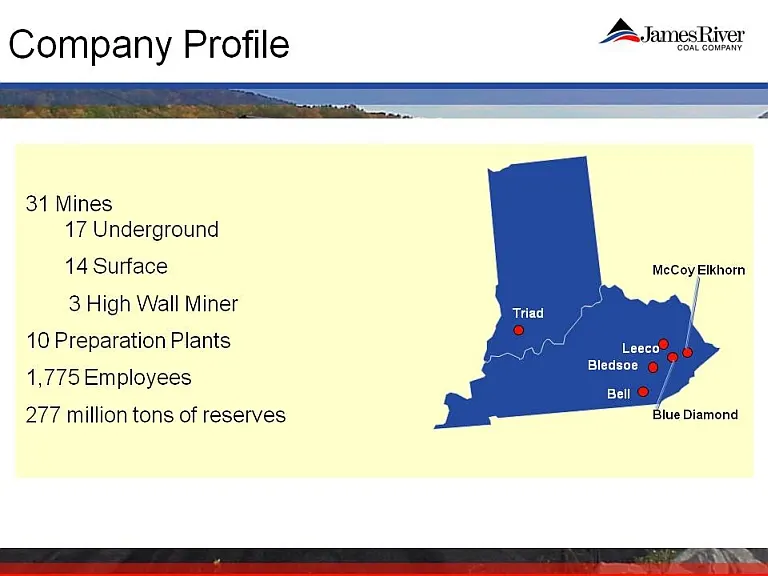
Company Profile 31 Mines 17 Underground14 Surface 3 High Wall Miner 10 Preparation Plants 1,775 EmployeesMillion Triad Leeco Bledsoe Bell McCoy Elkhorn l Blue Diamond
Slide 7: Company Profile: Production by Region and Method
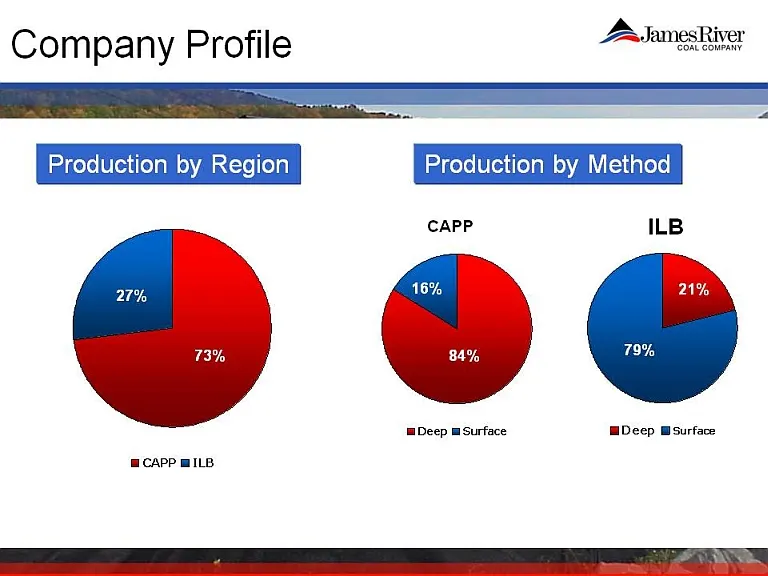
Company Profile Production by Region Production by Method16% 27% 21% 84% 73% 79% CAPP ILB Deep Surface
Slide 8: Agenda
Agenda ●Company Profile ●2009 Guidance●Things We Are Watching ●Market Analysis
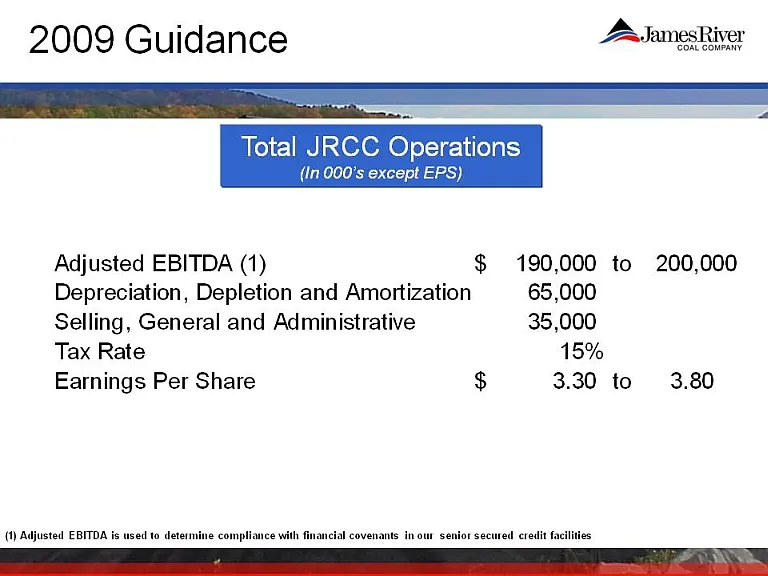
Slide 9: 2009 Guidance: Total JRCC Operations
2009 Guidance Total JRCC Operations(In 000’s except EPS)Adjusted EBITDA (1)$190,000 to200,000 Depreciation, Depletion and Amortization 65,000 Selling, General and Administrative 35,000 Rax Rate15%Earnings Per Share$3.30 to3.80 (1) Adjusted EBITDA is used to determine compliance with financial covena
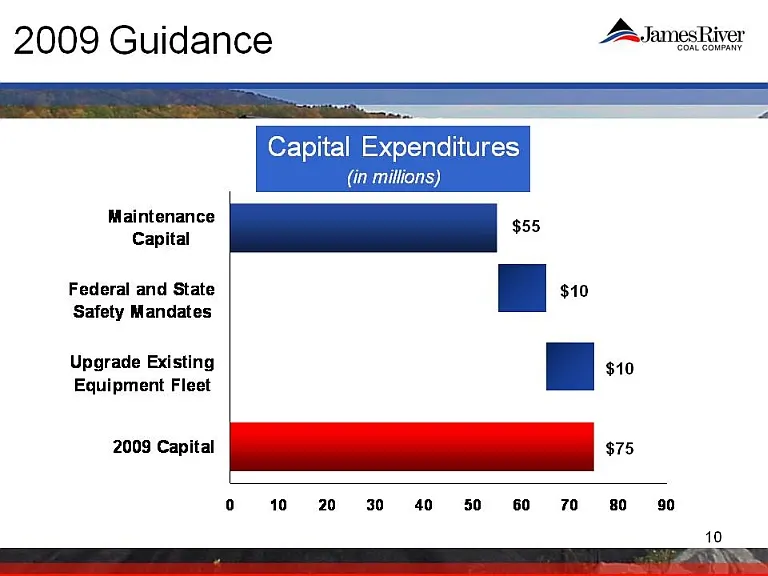
Slide 10: 2009 Guidance: Capital Expenditures
2009 Guidance Capital Expenditures(in millions)$55 Maintenance Capital Federal and State Safety Mandates Upgrade Existing Equipment Fleet$10 2009 Capital $750 10 20 30 40 50 60 70 80 90
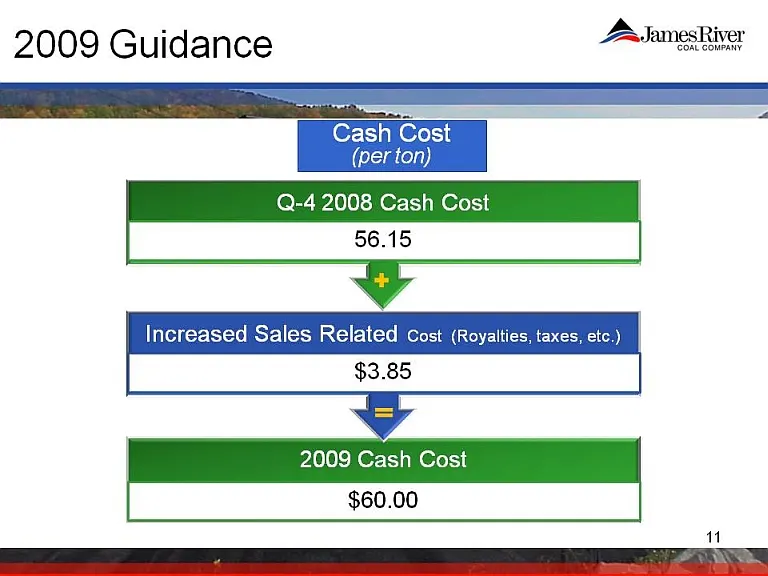
Slide 11: 2009 Guidance: Cash Cost
2009 Guidance Cash Cost(per ton)(p) Q-4 2008 Cash Cost 56.15 Increased Sales Related Cost (Royalties, taxes, etc.) $3.852009 Cash Cost $60.00
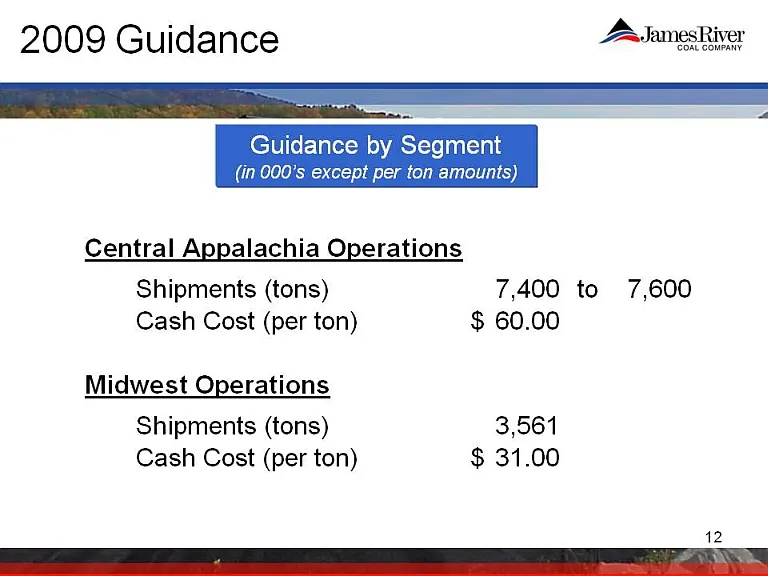
Slide 12: 2009 Guidance by Segment
2009 Guidance Guidance by Segment(in 000’s except per ton amounts)Central Appalachia Operations Shipments (tons)7,400 to 7,600 Cash Cost (per ton) Midwest Operations Shipments (tons)3,561 Cash Cost (per ton)31.00$
Slide 13: Agenda
Agenda●Company Profile ●2009 Guidance●Things We Are Watching ●Market Analysis
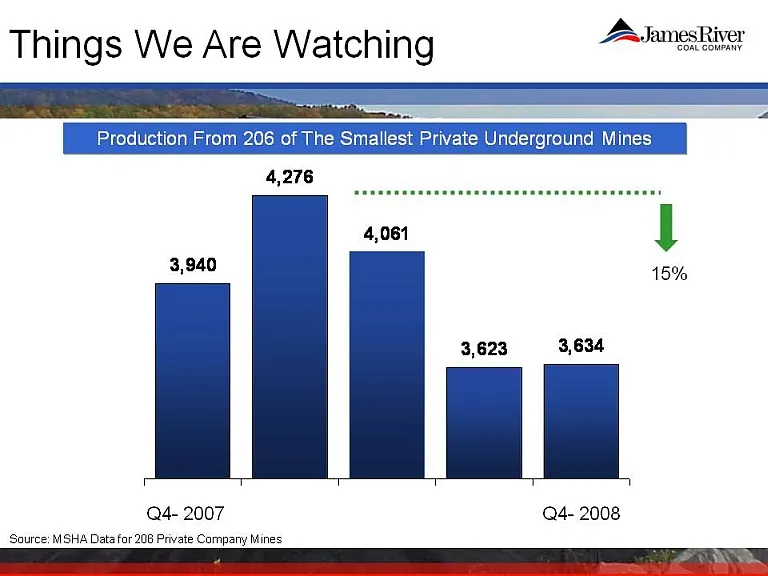
Slide 14: Production From the Smallest Private Underground Mines
Things We Are Watching Production From 206 of The Smallest Private Underground Mines 3,940 4,276 4,061 3,623 3,634 15% Q4-2007Q4-2008Source: MSHA Data for 206 Private Company Mines
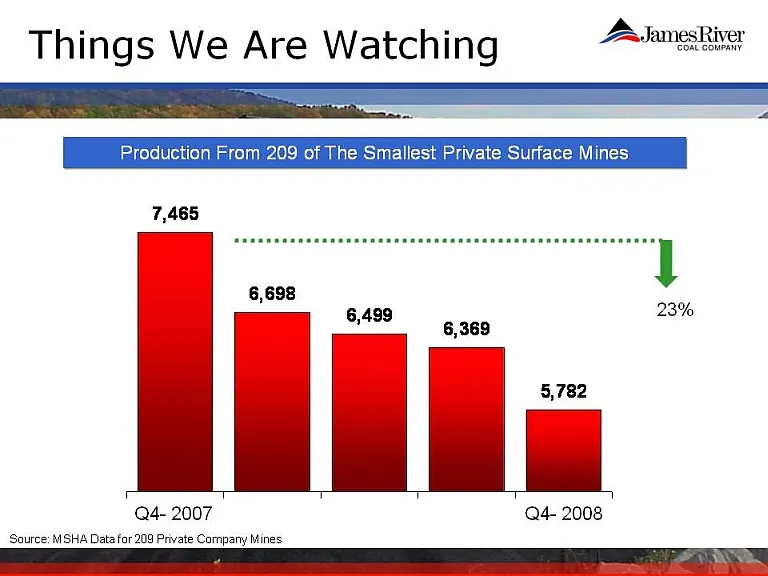
Slide 15: Production From the Smallest Private Surface Mines
Things We Are Watching Production From 209 of The Smallest Private Surface Mines 7,4656,698 6,499 6,3696,369 23% Q4-2007Q4-2008Source: MSHA Data for 209 Private Company Mines
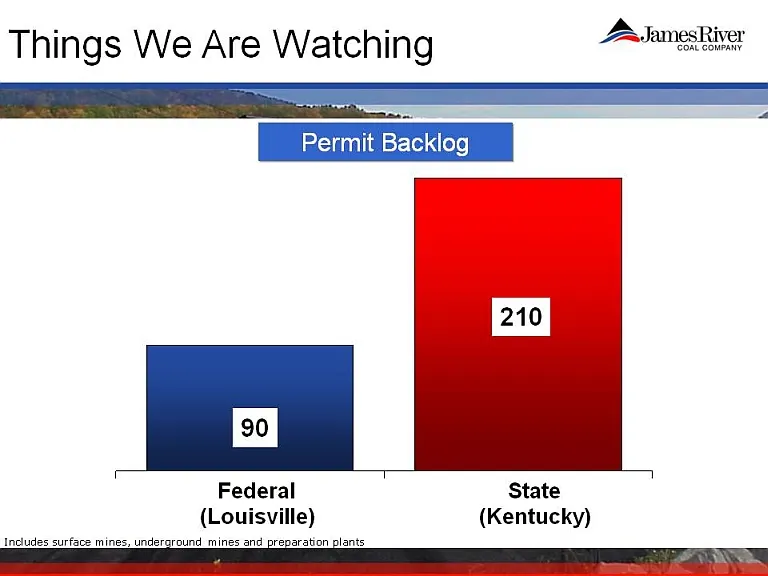
Slide 16: Permit Backlog
Things We Are Watching Permit Backlog90 210 Federal (Louisville)State(Kentucky)Includes surface mines, underground mines and preparation plants
Slide 17: Weekly EIA Production Data
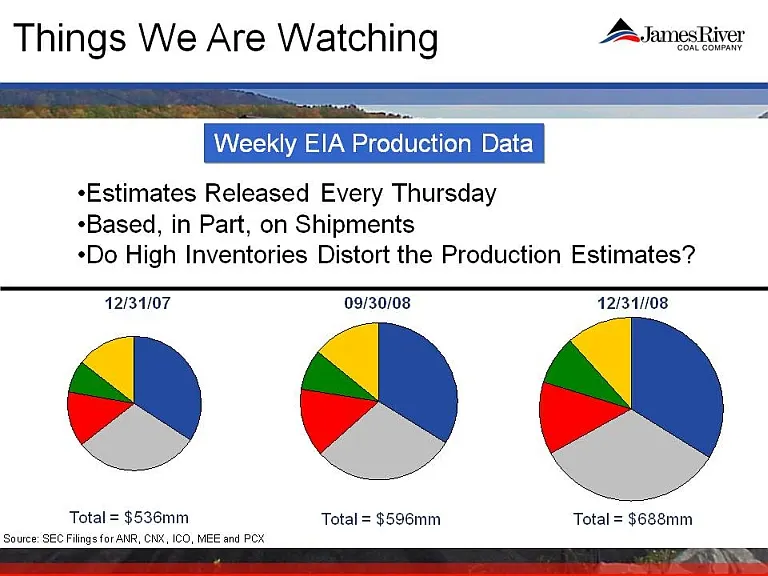
Things We Are Watching Weekly EIA Production Data •Estimates Released Every Thursday•Based, in Part, on Shipments•Do High Inventories Distort the Production Estimates 12/31/07 09/30/08 12/31/08 Total = $536mmTotal = $596mmTotal = $688mmSource: SEC Filings for ANR, CNX, ICO, MEE and PCX
Slide 18: Fuel Switching Year Over Year Change
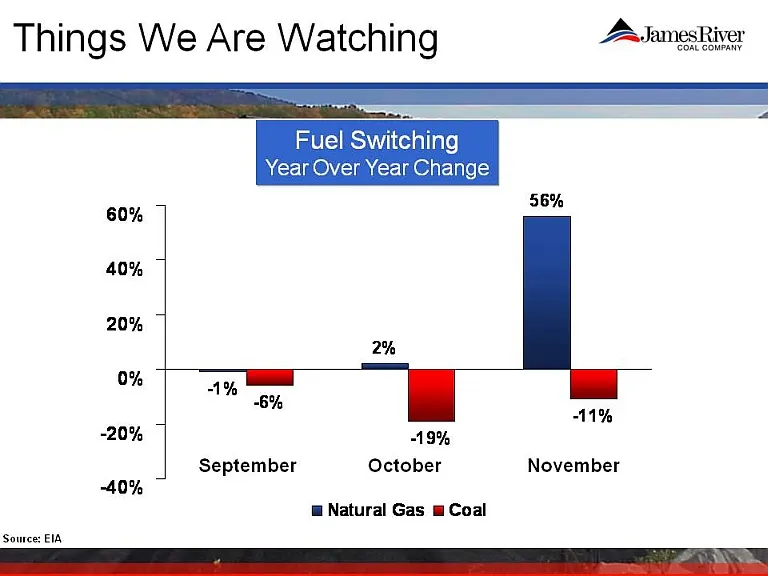
Things We Are Watching Fuel Switching Year Over Year Change 56% 60% 40% 20% 0% - -1%2%-6%11%0%-19%-11%-40%-20%SeptemberOctoberNovember0%Natural Gas Coal
Slide 19: Natural Gas Shale Well Production
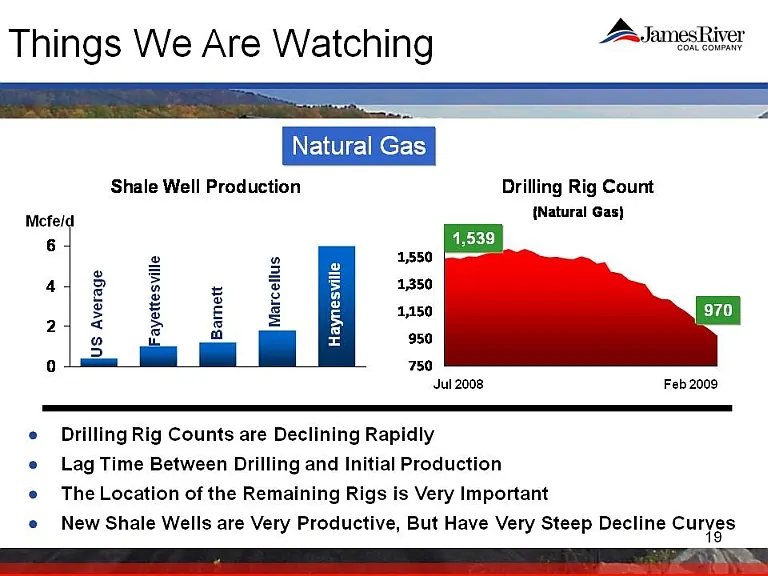
Things We Are Watching Natural Gas Shale Well Production Shale Well Production 6 Drilling Rig Count (Natural Gas)1,539Mcfe/d2461,1501,3501,550,970 Average Fayettesville Barnett Marcellus Haynesville02750950Jul 2008Feb 2009US ●Drilling Rig Counts are Declining Rapidly●Lag Time Between Drilling and In
Slide 20: Foreign Economies and Exchange Rates
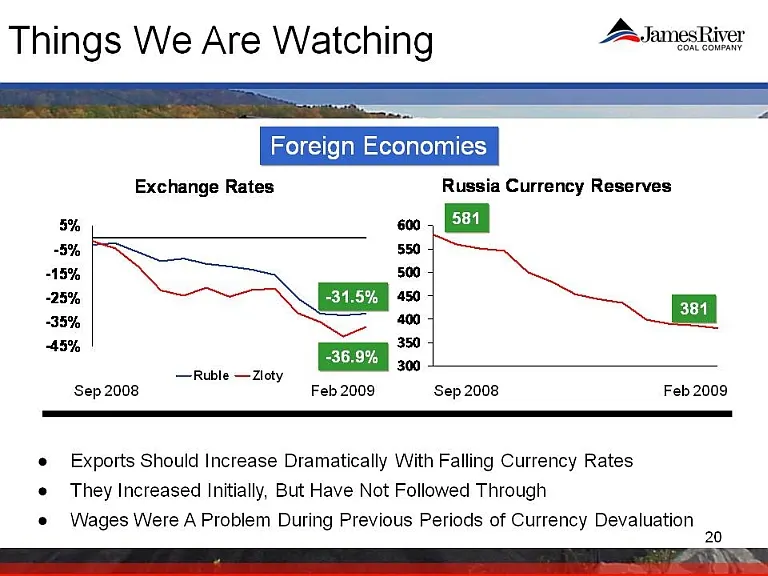
Things We Are Watching Foreign Economies Exchange Rates Russia Currency Reserves -45%RubleZloty300350Sep 2008Feb 2009Sep 2008Feb 2009-36.9% 5% -5% -15% -25% -35% -45% -31.5% 600 550 500 450 400 350 300 581 381 ●Exports Should Increase Dramatically With Falling Currency Rates They Increased Initially
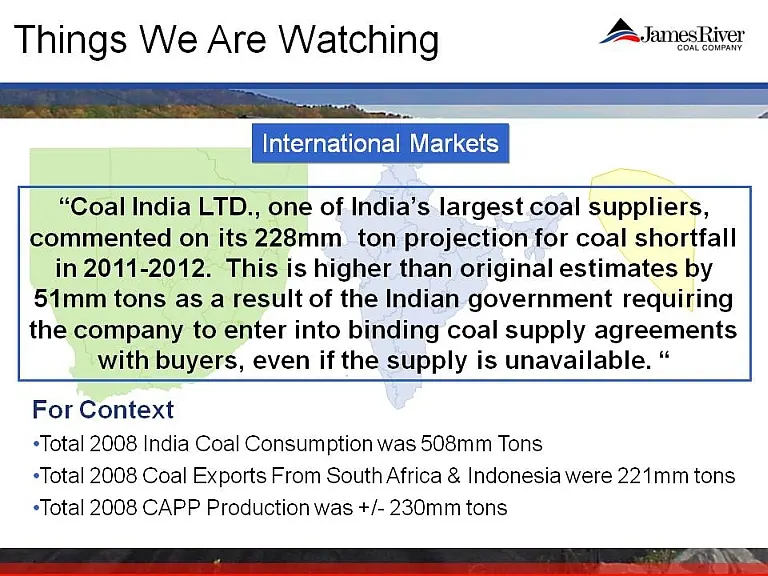
Slide 21: International Markets
Things We Are Watching International Markets “Coal India LTD., one of India’s largest coal suppliers, commented on its 228mm ton projection for coal shortfall 8pjin 2011-2012. This is higher than original estimates by 51mm tons as a result of the Indian government requiring the company to enter into
Slide 22: Agenda
Agenda ●Company Profile●2009 Guidance●Things We Are Watching ●Market Analysis
Slide 23: Market Analysis
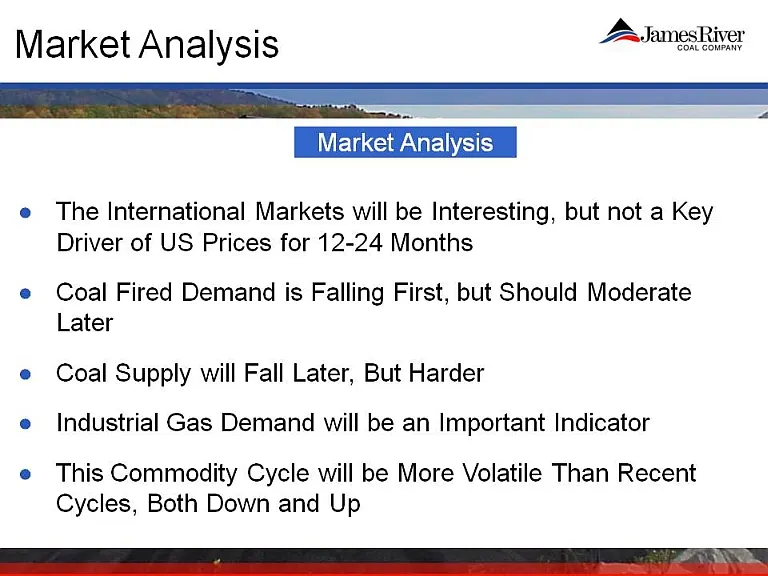
Market Analysis ● The International Markets will be Interesting, but not a Key Driver of US Prices for 1224 Months ● Coal Fired Demand is Falling First, but Should Moderate Later ● Coal Supply will Fall Later, But Harder ● Industrial Gas Demand will be an Important Indicator ● This Commodity Cycle w

Slide 24: James River Coal Company
By JamesRiver COAL COMPANY
Source: SEC EDGAR · 8-K filed Mar 10, 2009
More decks from James River Coal Company
 Corporate Update (November 2013)19 slides · Nov 7, 2013
 Q2 2013 Earnings Presentation20 slides · Aug 9, 2013
 Q1 2013 Earnings Presentation18 slides · May 1, 2013
 Corporate Update (March 2013)19 slides · Mar 7, 2013
 Corporate Update (November 2012)17 slides · Nov 7, 2012
 Q2 2012 Earnings Presentation19 slides · Aug 9, 2012