TransAtlantic Petroleum — Investor Presentation (May 2009)
95 slides from TransAtlantic Petroleum's investor presentation, May 11, 2009
Slide 1: Applying old lessons to new frontiers
Permian Basin, TX ‘38 SE Basin, Turkey ‘09 Applying old lessons to new frontiers May 11, ‘09 Exhibit 99.1

Slide 2: Disclaimer
Disclaimer Forward-Looking Statements Outlooks, projections, estimates, targets, and business plans in this presentation or any related subsequent discussions are forward-looking statements. Actual future results, including TransAtlantic Petroleum Corp.’s own production growth and mix; financial res
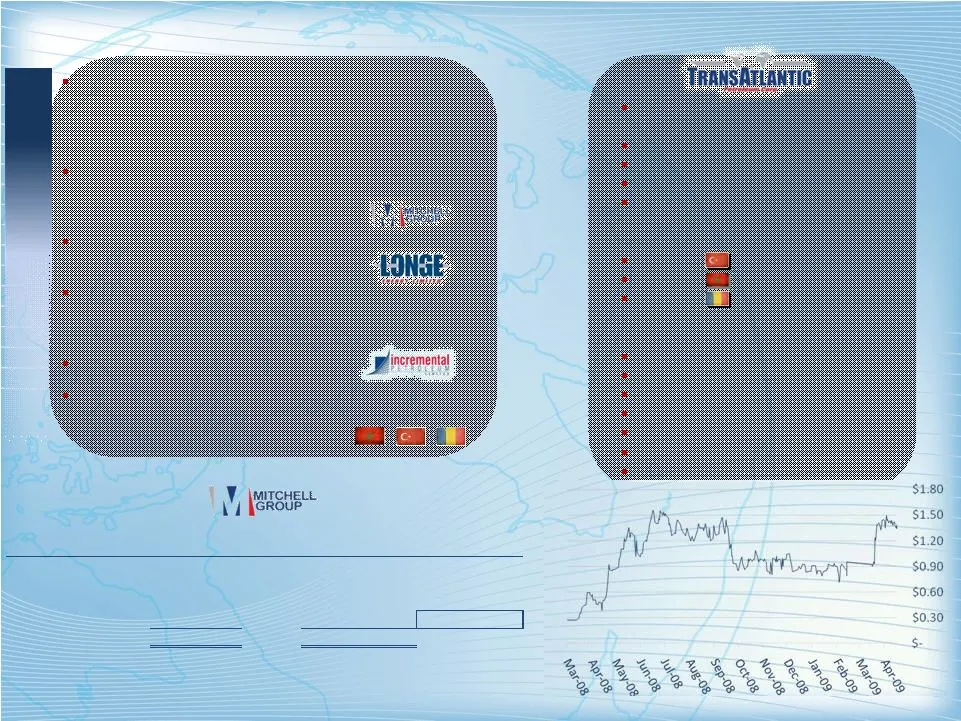
Slide 3: VY jwircene
VY jwircene \") (GROUP:
Slide 4
Slide 5
Slide 6: TransAtlantic
TRANSATLANTIC
Slide 7: Introduction
May08 Apr08 Introduction Stage I private placement – Mitchell Group added capital, management, and technical expertise to develop and expand the Company’s international projects. Mr. Malone Mitchell 3 is appointed Director. Stage II private placement – Mr. Mitchell and former Riata executive Mr. Mat
Slide 8: ‘Tease
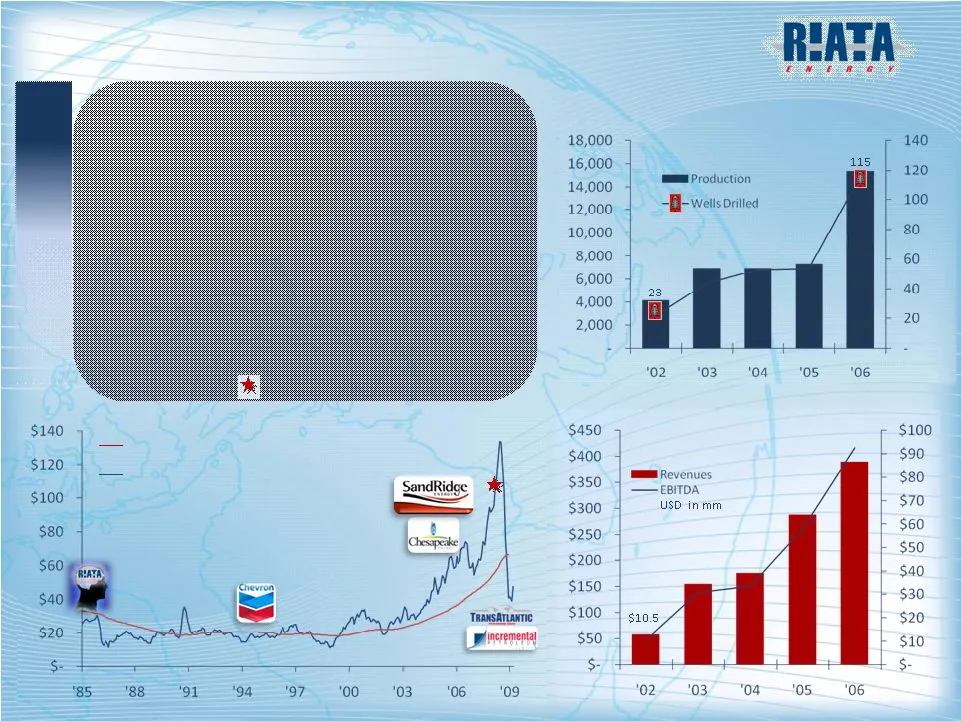
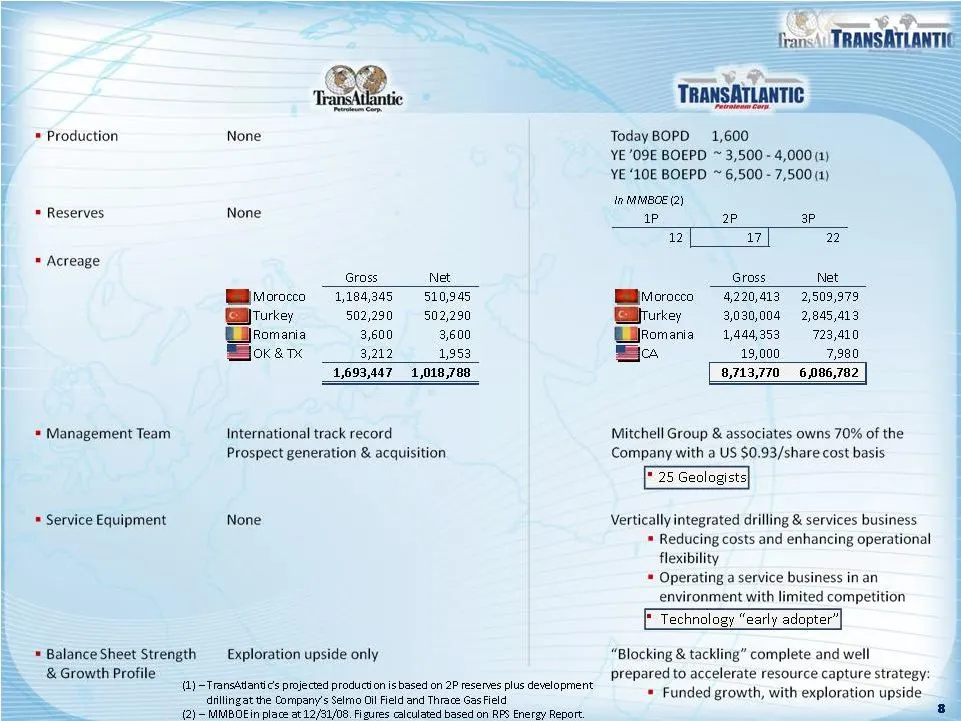
‘Tease princrementay 18,000 16,000 14,000 12,000 10,000 8,000 6,000 4,000 2,000 $400 $350 $300 $250 S105, mm Production a= 03 Revenue USD in ram 03 Yells Drilled 115
Slide 9
Slide 10: Best-In-Class Operator
‘85 ‘91 ‘94 ’99 –‘06 ‘95 A Best-In-Class Operator ‘08 ‘06 Malone Mitchell 3 founded Riata Energy with $500 Acquired interest in Pakenham Field (West Texas) (1) After drilling 34 wells, sold Pakenham Field to Chevron for $97mm Purchased >200,000 prospective acres in Pinon Field Riata expanded its ser
Slide 11: Cs
Cs
Slide 12
Slide 13: The Case For International - Why TransAtlantic?
The Case For International – Why TransAtlantic? Determined that greater, conventional opportunities existed internationally o Known petroleum systems o Lower cost acreage than the U.S. o Less fragmentation o Bureaucracy limited innovation and exploration Targeted investments with the following chara
Slide 14: Seismic equipment
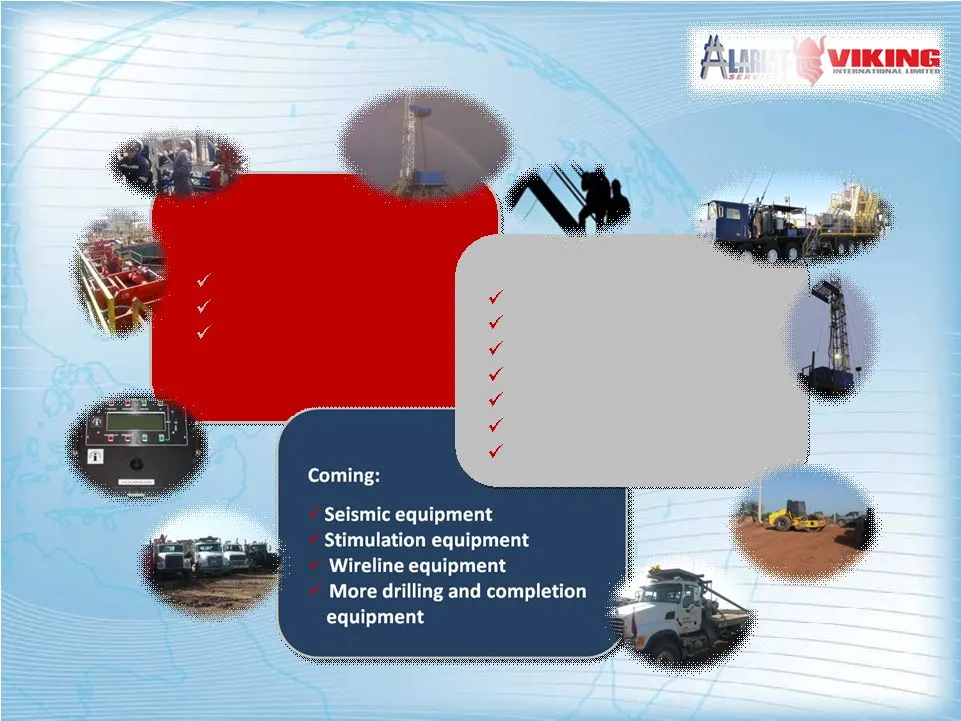
_ Seismic equipment _ Stimulation equipment je equipment _ More drilling and completion equipment

Slide 15

Slide 16

Slide 17: oe Se
oe Se

Slide 18: Vertical Integration - We've Done This Before
$175 mm assets $139 mm 3 rd party sales $33 mm 3 rd party net income * pg F38 ‘08 SandRidge Energy Annual Report Rigs in Turkey and Morocco Trucks to move equipment Equipment to build locations Underbalanced equipment Mud Logging equipment Cementing equipment Supply depots Vertical Integration – “We
Slide 19: BBG CHK COG KCS L RRC XTO._DNR
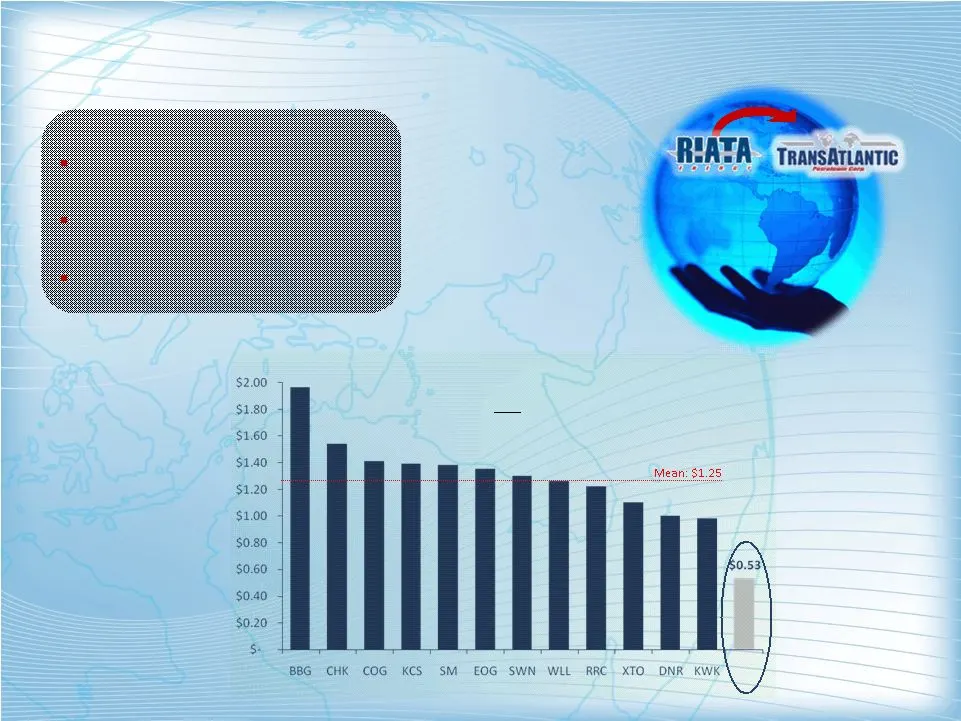
BBG CHK COG KCS L RRC XTO._DNR $2.00 $1.80 = $1.60 <i Mean: $1.25 $1.20 $1.00 $0.80 $0.60 $0.40 30.20 5

Slide 20

Slide 21: Deja Vu: The Vertical Integration Shoe Still Fits
Dèjá Vu: The Vertical Integration Shoe Still Fits 3yr Avg F&D Cost ($/Mcfe) Riata was the low cost leader in finding reserves Key Takeaways Lower costs / stretches dollars Boosts operational flexibility Profit from party work As of 12/31/04 John S. Herold Database Riata rd
Slide 22: TransAtlantic's Transformation in Year
TransAtlantic’s Transformation in Year 1
Slide 23: Key Investment Highlights
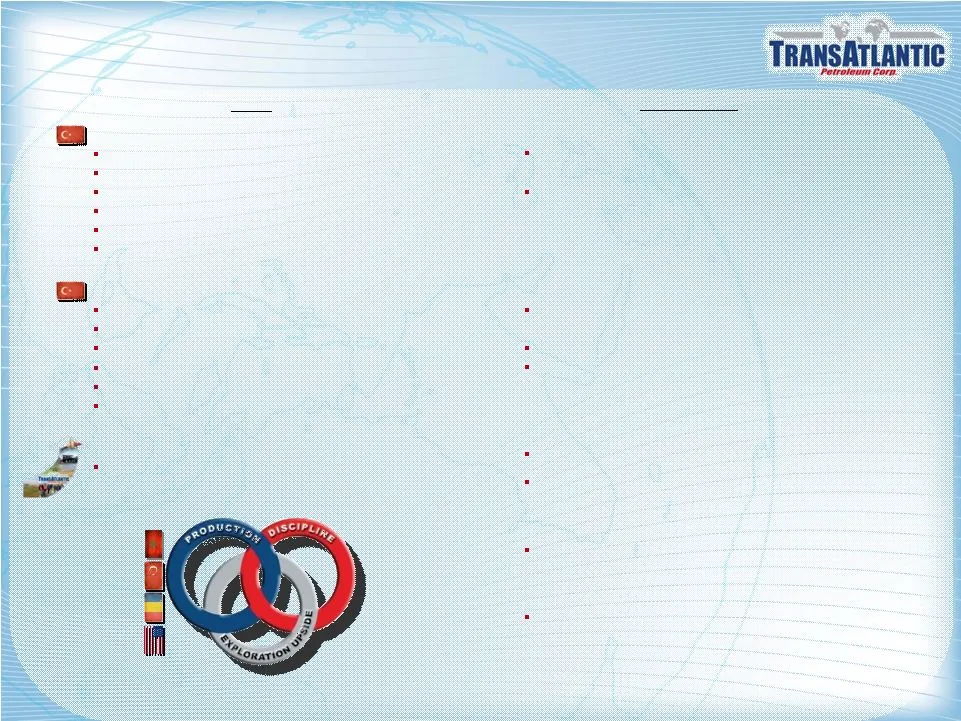
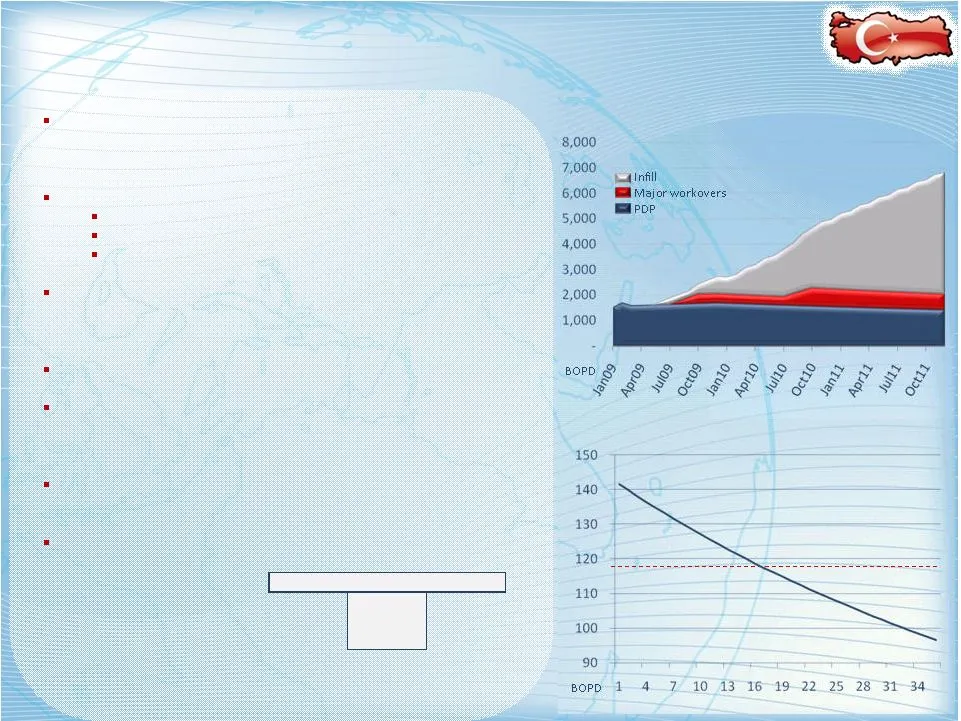
Key Investment Highlights ASSET Southeast Turkey 100% Interest / Operator 8,700-acre reservoir 1 well per 188 acres, low recovery factor to date 1P & 2P reserves of 11 & 16 mmbls, respectively 34° API Selmo Oil Field (1) OPPORTUNITY Increase production from 1,600 BOPD to over 6,500 BOPD by year end
Slide 24: TransAtlantic Petroleum Corp.
TRANSATLANTIC Petroleum Corp.
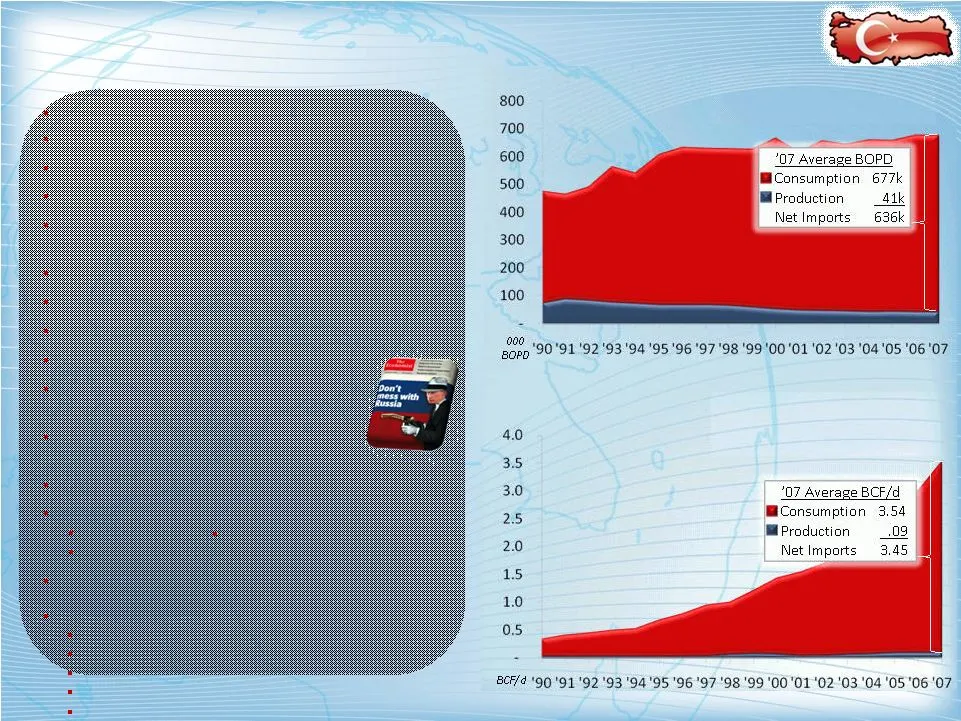
Slide 25: ‘07 Average BOPD Consumption 677k
700 600 ‘07 Average BOPD 500 Consumption 677k Production _41k 400 Net Imports 636k 300 200 100 000 nopp'90'91 '92'93'94 '95'96 '97'98 '99'00'01 '02'03 '04'05 '06'07 i i 40 35 3.0 7 Average BCF/d AG AConsumption 3.54 : Mi Production 09 2.0 Net Imports 3.45 15 1.0 05 8CF/4 '90 '91'92 '93'94'95 '96 '97
Slide 26
Slide 27: Turkey's Energy Profile
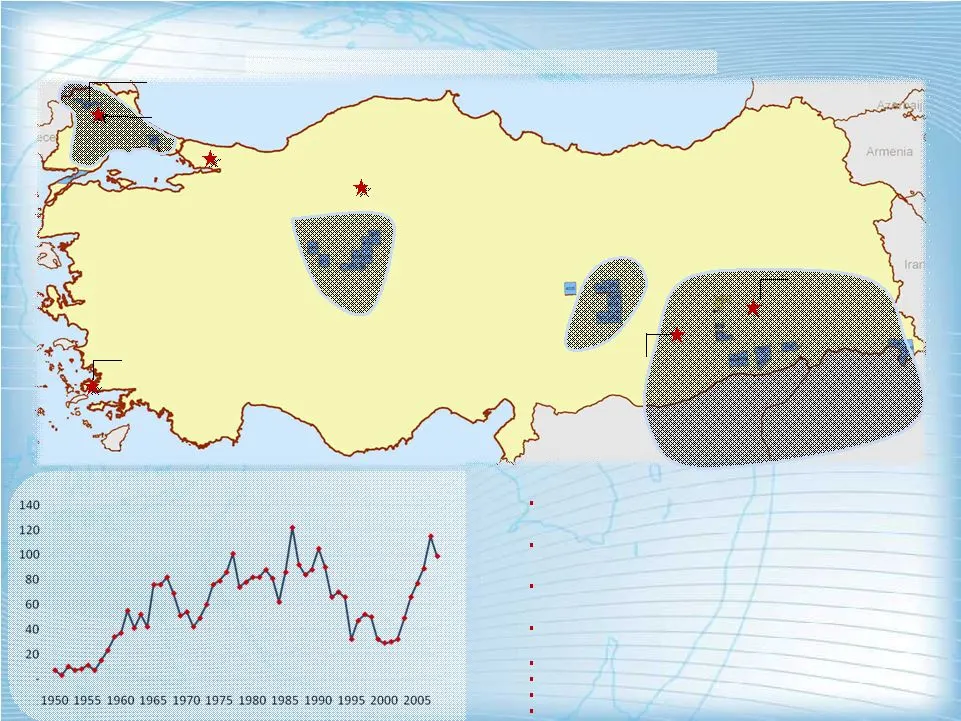
Turkey’s Energy Profile Area 780,580 km Comparative Area Slightly larger than Texas ‘08 Population 71,892,808 ’08 GDP / Growth $798.9 billion / 4.5% Fitch Sovereign BB, with stable outlook Risk Rating ’07 Proved Reserves 0.3 billion bbls / 300 Bcf ‘07 Daily Consumption 677k BOPD / 3.54 BCF/d ‘07 Dai
Slide 28: 1950 1955 1960 1965 1970 1975 1980 1985 1990 1995 2000 2005
1950 1955 1960 1965 1970 1975 1980 1985 1990 1995 2000 2005
Slide 29
Slide 30
Slide 31: Introduction to Selmo Oil Field (100% Interest)
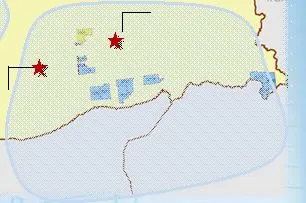
Introduction to Selmo Oil Field (100% Interest) Discovered by Mobil in 1964, Selmo is located in southeastern Turkey near the prolific Zagros fold belt, which encompasses the oil fields of Iran and Iraq Formerly owned by Incremental Petroleum Strategy to produce current wells, not develop Workover c
Slide 32: Selmo Development Drilling - First Candidates
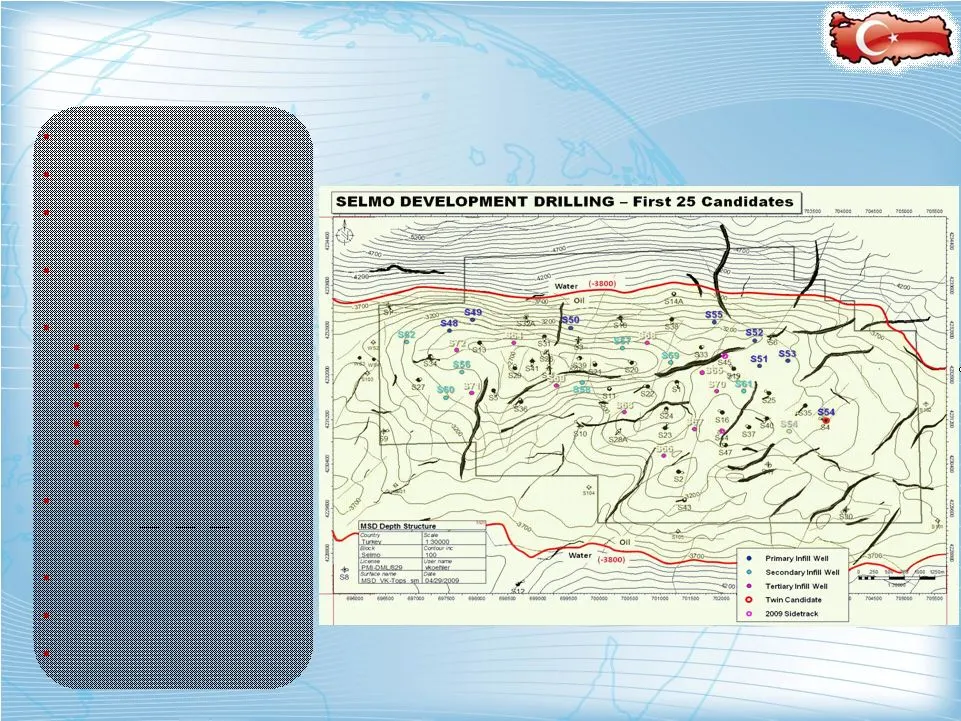
SELMO DEVELOPMENT DRILLING - First 25 Candidates |
Slide 33: CLEC
CLEC
Slide 34
Slide 35
Slide 36
Slide 37

Slide 38

Slide 39: Thrace Basin (55% Interest) - 3D Is Key
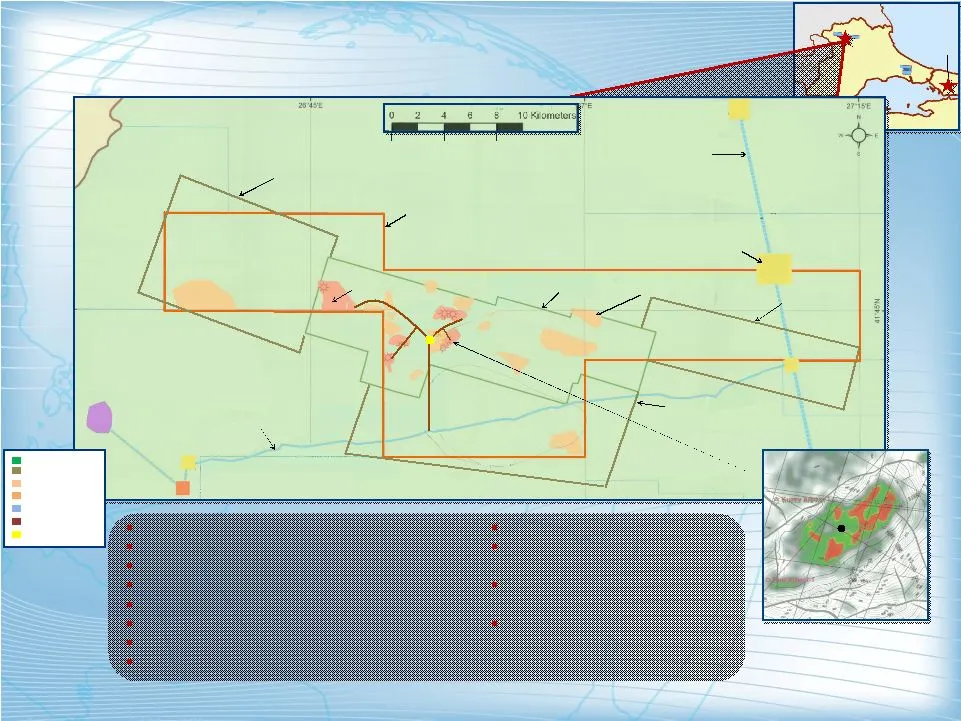
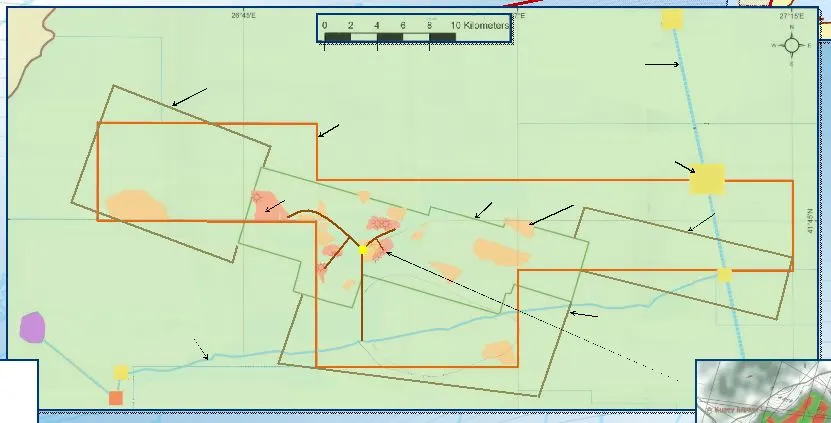
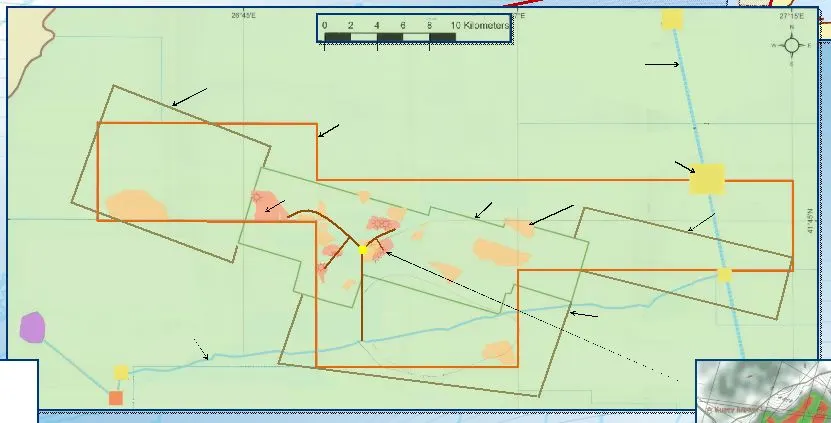
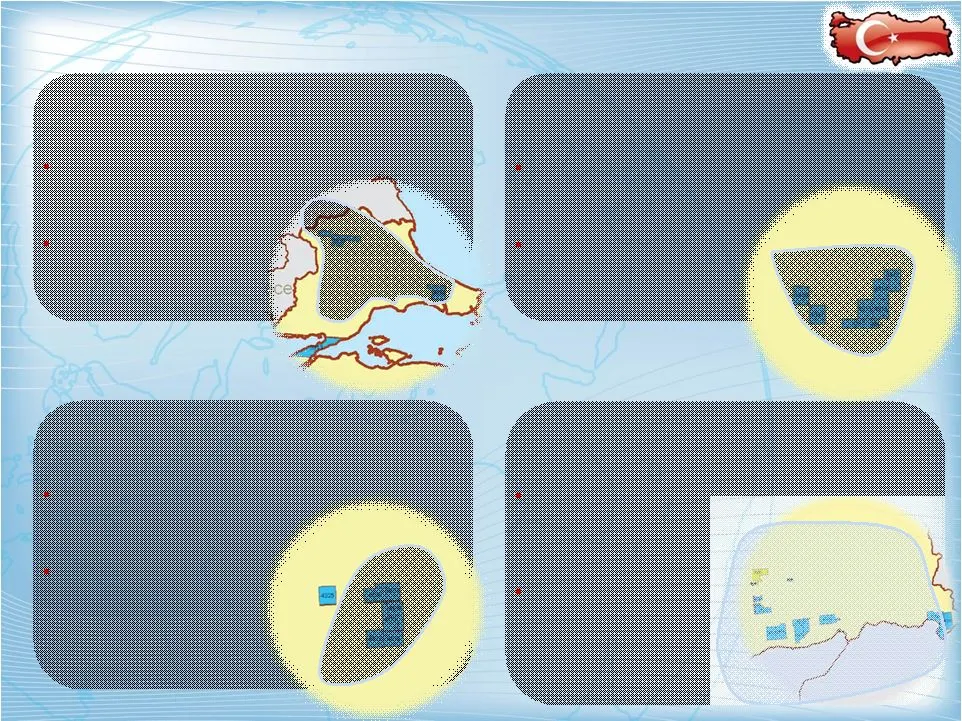
Thrace Basin (55% Interest) - “3D Is Key” A-2A Well D Zone: 285-300m/bp O Zone: 340-350m / 2.3 mmcf/d EDIRNE Zorlu TPN 55% 2D Zorlu 2D 2009-2010 3D TPAO 2007 3D Outline 3D Prospect 2009-2010 3D License Outline Compressor Station 2.5 Miles BOTAS 14” BOTAS 36” 100 ² km 75 ² km 150 ² km 3D Drilled 2009
Slide 40: bad
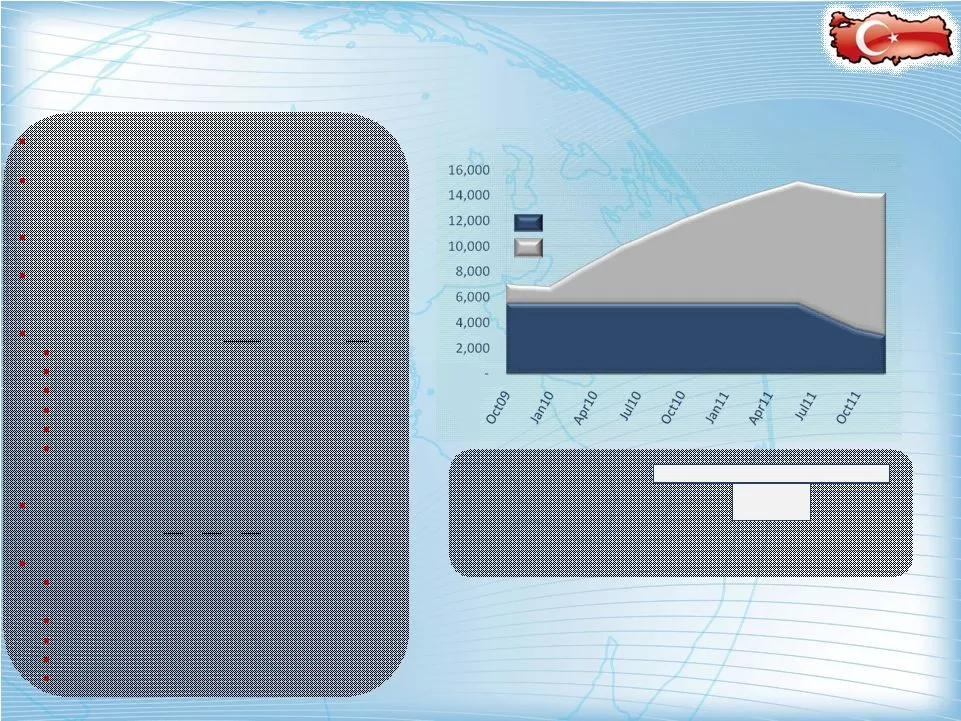
16,000 14,000 nl i=! bad 12,000 10,000 8,000 3,000 4,000 2,000
Slide 41
Slide 42
Slide 43
Slide 44
Slide 45

Slide 46

Slide 47

Slide 48

Slide 49
Slide 50
Slide 51
Slide 52: TransAtlantic Petroleum Corp.
TRANSATLANTIC Petroleum Corp.
Slide 53: BORD
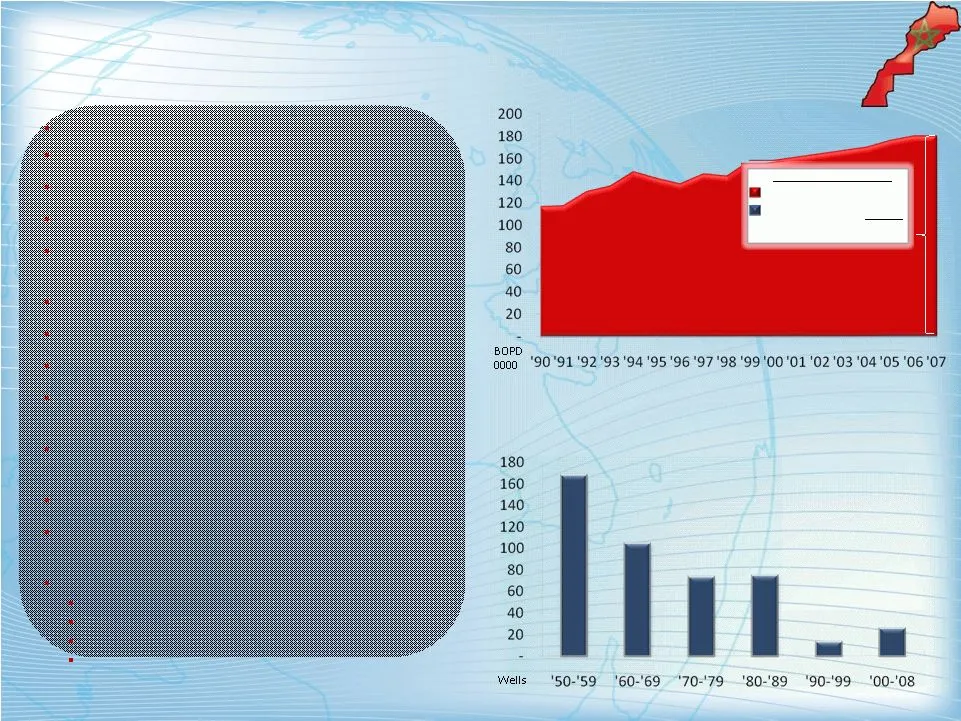
"90'91 '92'93'94 '95 '96 '97 '98 '99'00'01 '02'03 '04'05 '06'07 BORD ‘00
Slide 54
Slide 55: Morocco's Energy Profile
Morocco’s Energy Profile Source: IEA, CIA - The World Fact Book, and IHS Area 446,550 km ² Comparative Area Slightly larger than California ‘08 Population 34,343,220 ’08 GDP / Growth $90.4 billion / 5.3% Fitch Sovereign BBB with stable outlook Risk Rating ‘07 Proved Reserves 836k bbls / 58 Bcf ‘07 D
Slide 56
Slide 57
Slide 58: Morocco
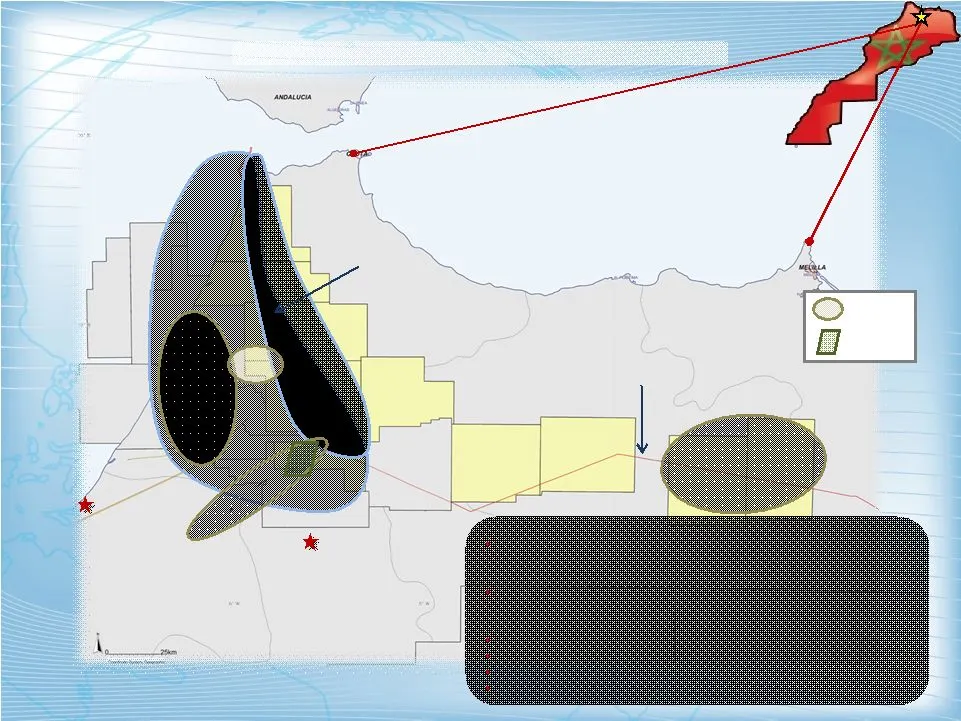
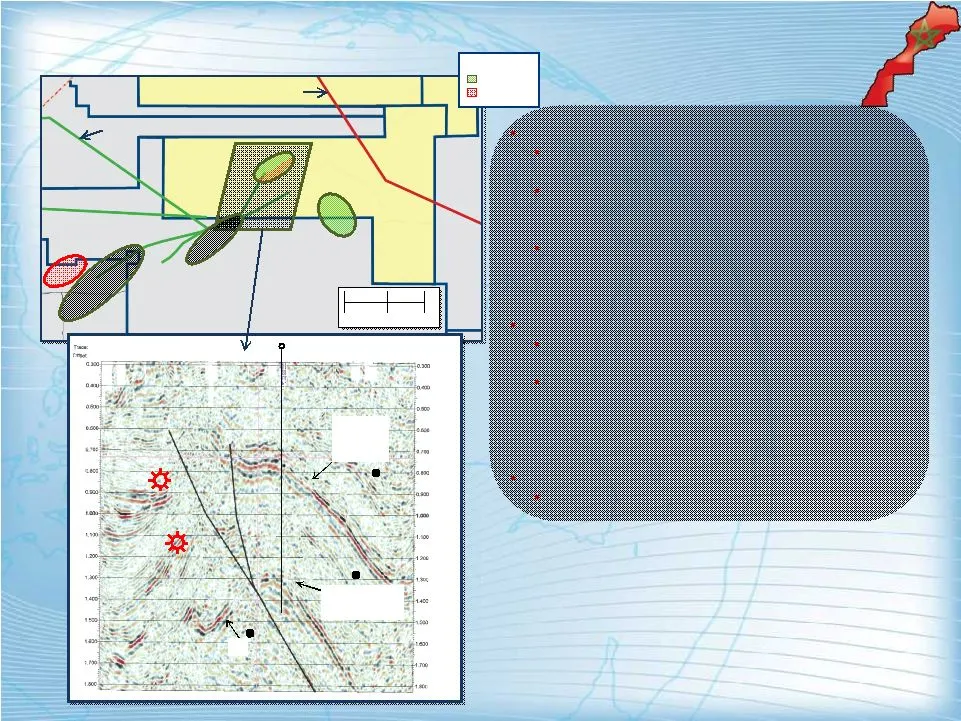
Morocco Basin Structures (numerous gas fields) Oil Oil Trend 3D Atlantic Ocean TransAtlantic’s Acreage: 4.2 million gross / 2.5 million net East Area Basin Structures Gas Pipeline Thrusted Structures West Area Overview TransAtlantic’s exploration and development acreage is situated along the Rif Thr
Slide 59
Slide 60
Slide 61
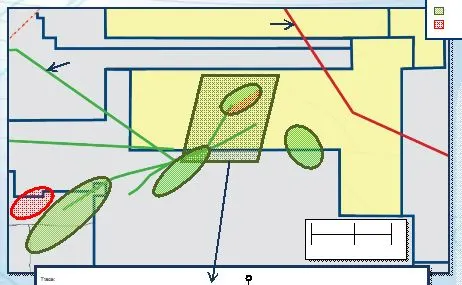
Slide 62
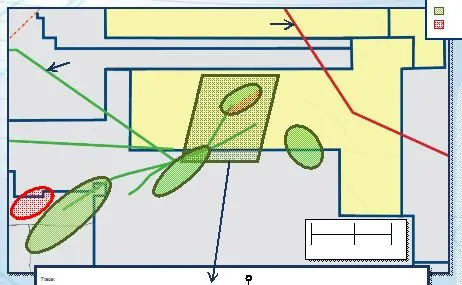
Slide 63
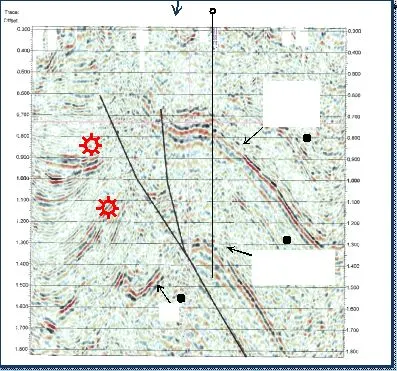
Slide 64
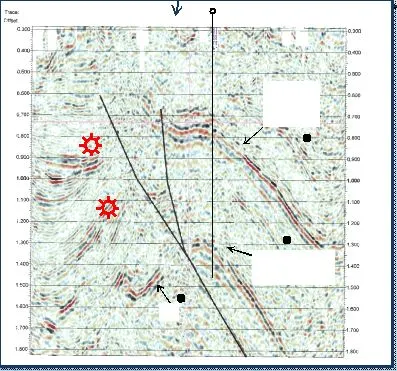
Slide 65
Slide 66: TransAtlantic Petroleum Corp.
TRANSATLANTIC Petroleum Corp.
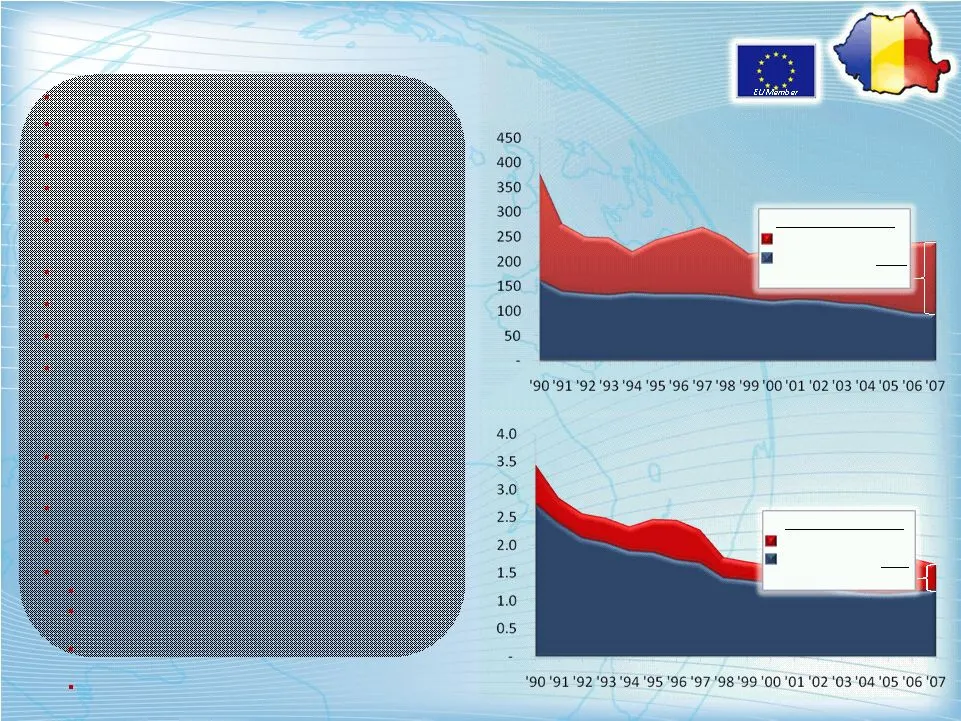
Slide 67: : "90'91'92'93'94 '95 '96 '97 '98 '99'00'01 '02 '03 '04'05 '06'07 *90'91'92''93'94 '95 '96
450 400 350 300 250 200 150 100 50 40 35 : "90'91'92'93'94 '95 '96 '97 '98 '99'00'01 '02 '03 '04'05 '06'07 *90'91'92''93'94 '95 '96 '97'98'99 '00 '01 ‘0203 '04.'05 '06 '07
Slide 68
Slide 69: Romania's Energy Profile
Romania’s Energy Profile Area 237,500 km Comparative Area Slightly larger than Oklahoma ‘08 Population 22,246,862 ’08 GDP / Growth $213.9 billion / 8.0% Fitch Sovereign BBB Risk Rating ‘07 Proved Reserves 0.6 billion bbls / 2.2 Bcf ‘07 Daily Consumption 241k BOPD / 1.65 BCF/d ‘07 Daily Production 94
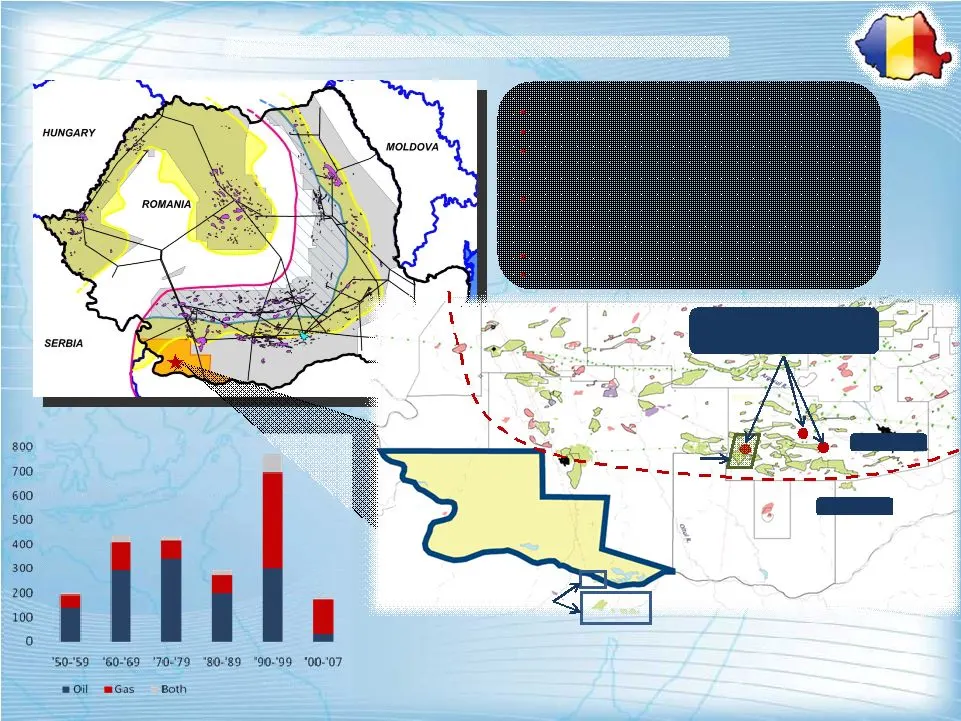
Slide 70: Hungary
HUNGARY ‘moLvova 400 300 200 100 al | ° °S0-'S9 “60-69 "70-79 “80.'89 “90-99 ‘00-07 moll mGas Both

Slide 71

Slide 72
Slide 73
Slide 74
Slide 75
Slide 76: Romania
Gas Prone Oil Prone 3 Blocks: 5mmbbl Redevelopment Potential Romania Basin Data: 3D Bulgarian Jurassic Oilfields Exploration Block One of the richest hydrocarbon systems in the world Birthplace of the petroleum industry Like coming to Oklahoma in 1950 Communist system prior to the 1990’s produced “f
Slide 77: TransAtlantic Petroleum Corp.
==} TRANSATLANTIC Petroleum Corp.
Slide 78: Projected Financial Summary & Drilling
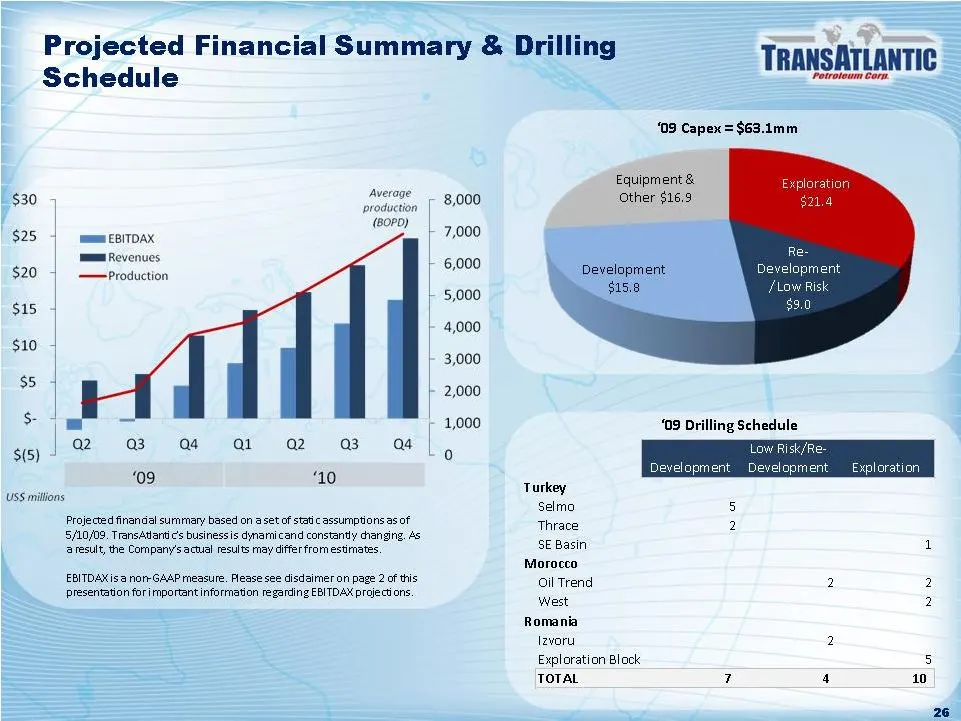
Projected Financial Summary & Drilling Ss $(5) USS millions chedule hoon (B0PD) ‘mem ESITOAK mmm Revenues Production a2 03 a4 ai a 3 “09 ‘10 Projected finandial summary based on a setof static assumptions sof 5/10/09, TransAttartic's business is dynarnicand constantly changing. As ‘result, the Compa
Slide 79: TransAtlantic Net Asset Value
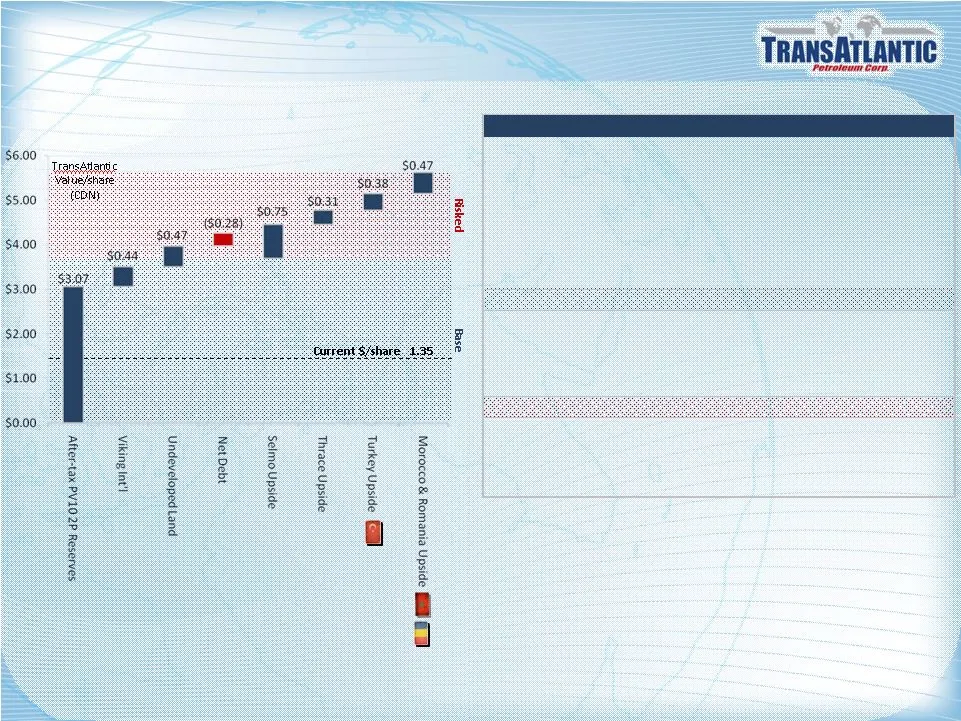
TransAtlantic Net Asset Value A Commitment To Growing Net Asset Value/Share (In C$ millions, unless otherwise stated) NAV / Share % of tot. After-tax PV10 2P reserve value (1) $488 $3.07 54.6% Viking International (equipment @ cost) $70 $0.44 7.9% Undeveloped land value (2) $75 $0.47 8.4% Less: Net
Slide 80: TransAtlantic
a = TRANSATLANTIC &
Slide 81
Slide 82: We've Done This Before - Encore
We’ve Done This Before – Encore Development: Seek to maximize our cash-on-cash returns by continually searching to reduce drilling and operating costs Pursue projects that will permit us to develop out of cash flow, without the need to tie up excessive capital “building reserves” Exploration: Priori
Slide 83: TransAtlantic Petroleum Corp.
TRANSATLANTIC Petroleum Cor
Slide 84
Slide 85: Proven Management Team
Proven Management Team ’85 -’06, built Riata Energy into one of the largest privately held energy companies in the US ‘06, sold controlling stake in Riata, which was later renamed SandRidge Energy Inc. (NYSE: SD) Founded Mitchell Group in early ‘07, which includes Longfellow Energy and Riata Managem
Slide 86: Country Focus
Country Focus Name Title Caty Albert VP Various Weldon Beauchamp, Ph.D. Manager / New Ventures Turkey David McDonald, Ph.D. Geophysicist Romania Gene Pait Senior Geologist Various Wayne Campbell Geologist Various Andy Bell Geophysicist Various Neil Apak Senior Geologist Turkey Sergey Shevchenko Seni
Slide 87: TransAtlantic Petroleum Corp.
TRANSATLANTIC Petroleum Corp.
Slide 88

Slide 89: -
-

Slide 90: California - McFlurrey
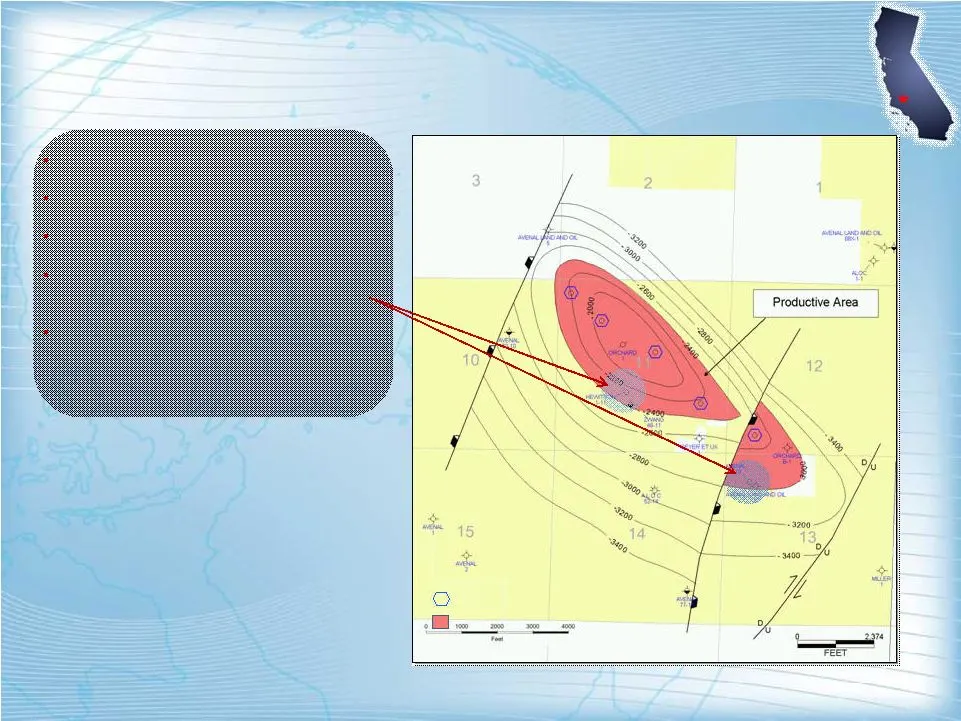
California - McFlurrey Description Shallow Gas Project Interest 50% / 37.5% NRI Location Prolific San Joaquin Basin Status 2 wells drilled, currently completing Opportunity offset old wells with gas shows – develop structure Proposed locations Productive Area
Slide 91: TransAtlantic Petroleum Corp.
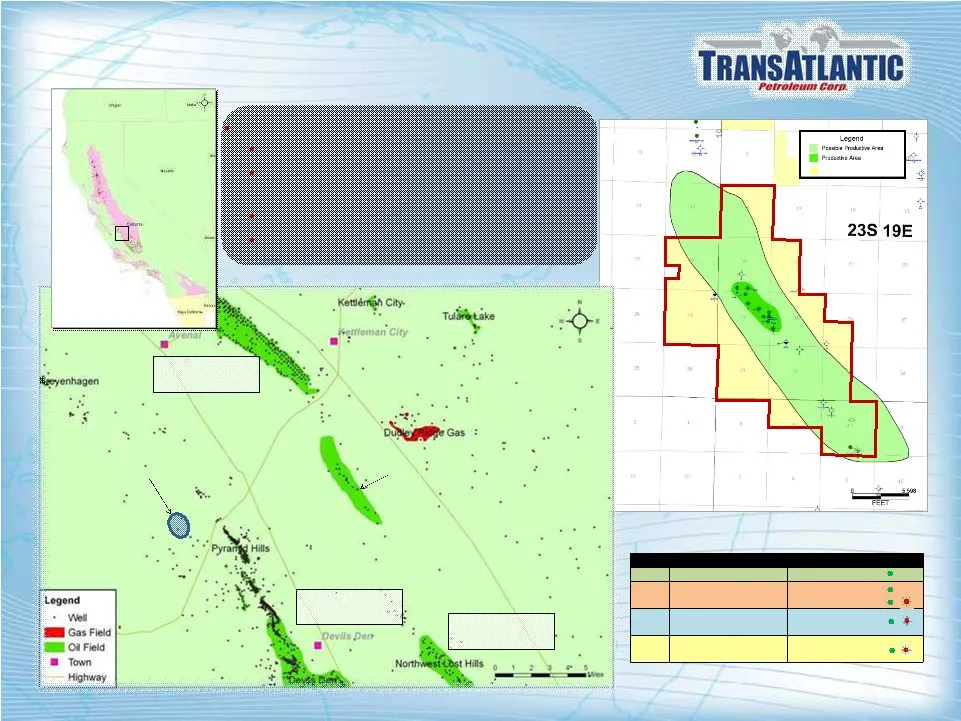
TRANSATLANTIC Petroleum Core. 23S 19E

Slide 92

Slide 93
Slide 94: Equipment detail: drilling rigs and service equipment
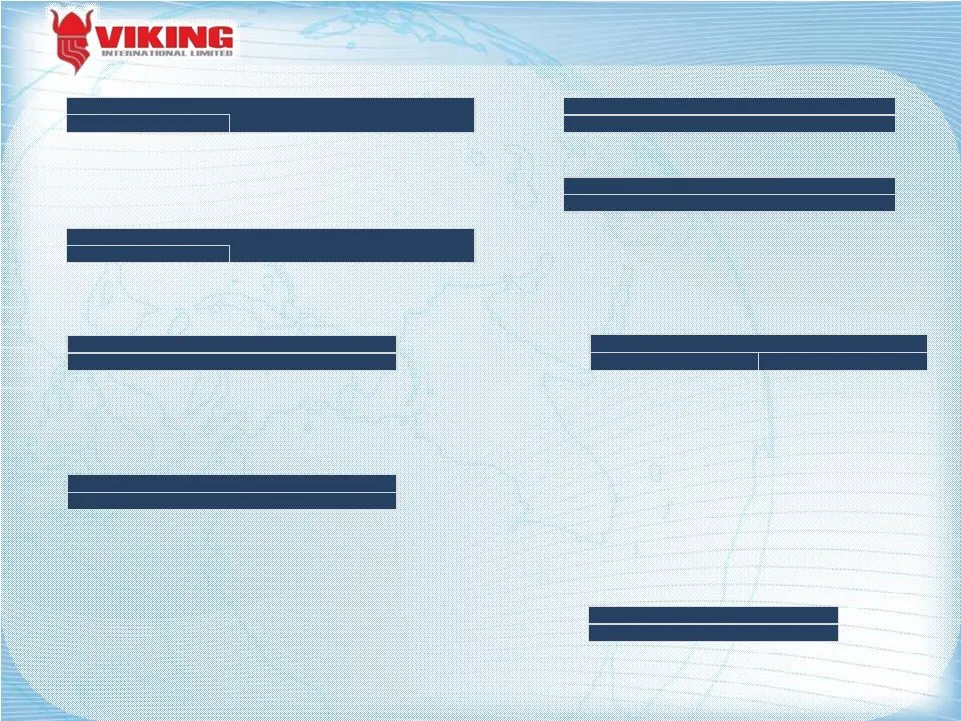
Depth Drill Name Class Capacity (ft) Pipe Size Horsepower Max Hook Class Load (lbs.) Horsepower Rig Rig CMF PSI-Max BHP Units CMF PSI-In PSI-Out Units Mobile Underbalanced Drilling Nitrogen Units Type Units Units Cementing Equipment Mud Logging Equipment Type Units Type Units Heavy Trucks Equipment
Slide 95: TransAtlantic Petroleum Corp.
==} TRANSATLANTIC Petroleum Corp.
Source: SEC EDGAR · 8-K filed May 11, 2009
More decks from TransAtlantic Petroleum Ltd
 Shareholder Meeting (June 2020)11 slides · Jun 4, 2020
 Corporate Update (March 2020)9 slides · Mar 9, 2020
 CEEC Scout Meeting, Constanta, Romania (May 2019)14 slides · May 10, 2019
 Technical Presentation (March 2019)10 slides · Mar 26, 2019
 2018 IPAA OGIS New York32 slides · Apr 6, 2018
 Investor Presentation (April 2018)14 slides · Apr 2, 2018