Mr. Cooper — Nationstar Mortgage Holdings — Investor Presentation (January 2013)
17 slides from Mr. Cooper's investor presentation, Jan 31, 2013
Slide 1: Investor Presentation
Exhibit 99.1 Investor Presentation January 31, 2013 Financial data as of September 30, 2012
Slide 2: Forward Looking Statements
Forward Looking Statements Any statements in this presentation that are not historical or current facts are forward-looking statements. Forward-looking statements include, without limitation, statements concerning plans, objectives, goals, projections, strategies, future events or performance, and u
Slide 3: Our Business
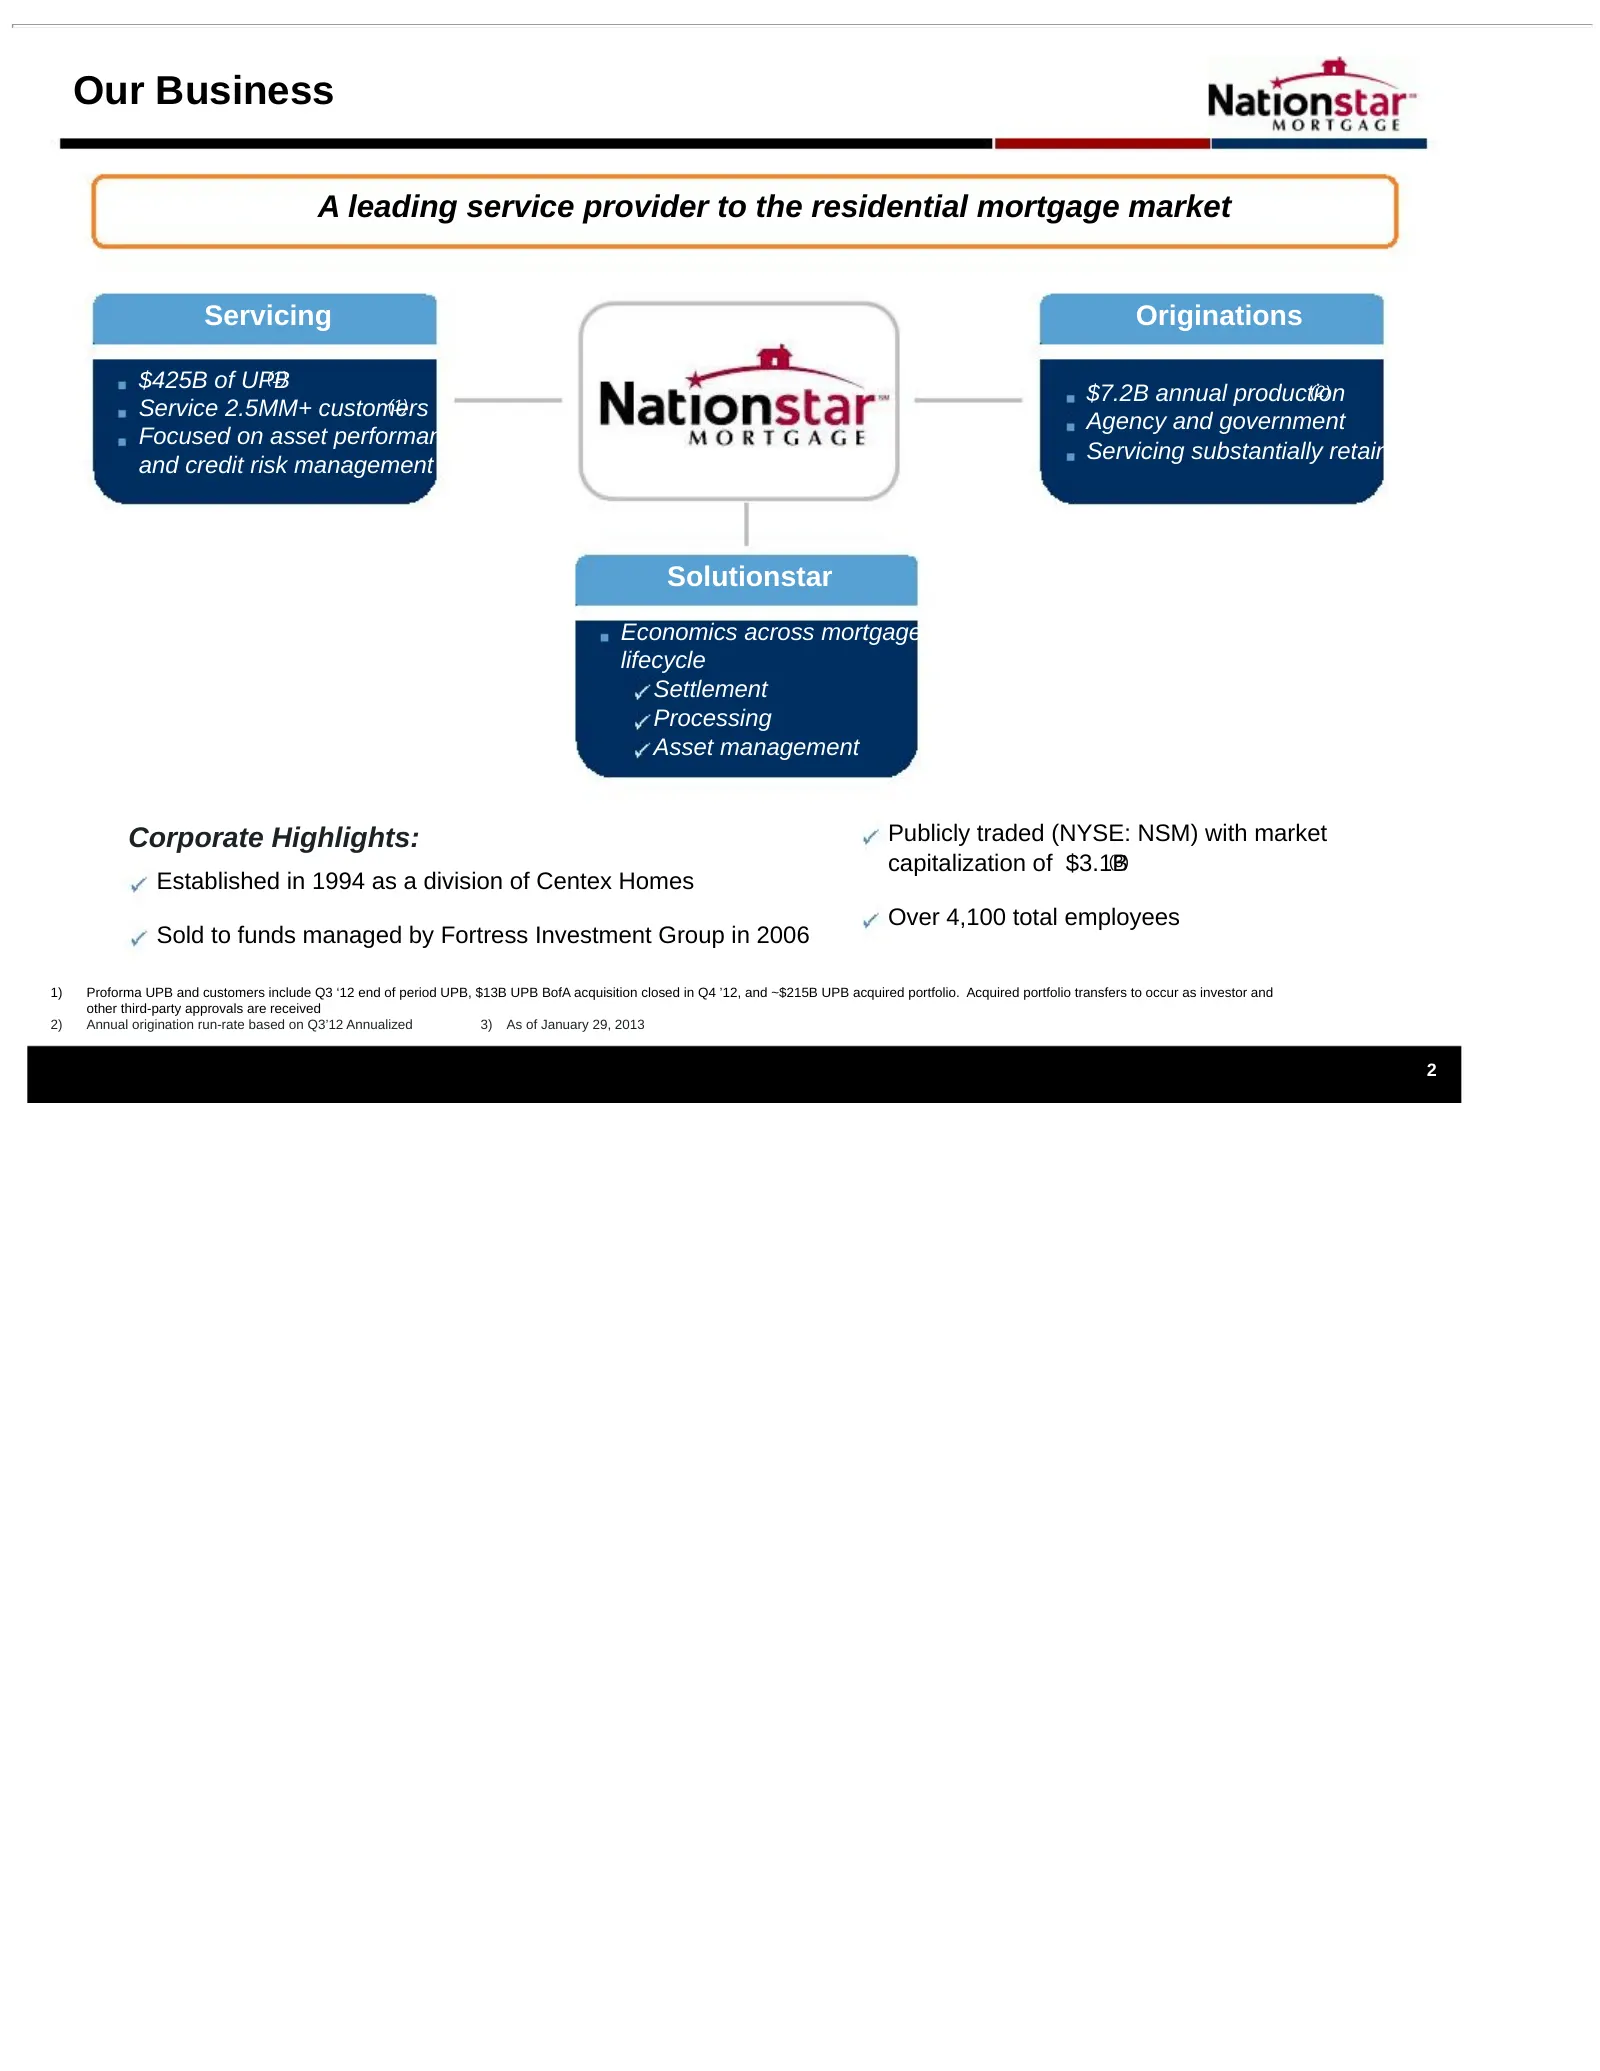
Our Business A leading service provider to the residential mortgage market Servicing Originations $425B of UPB (1) $7.2B annual production (2) Service 2.5MM+ customers (1) Agency and government Focused on asset performance Servicing substantially retained and credit risk management Solutionstar Econ
Slide 4: Strategically Positioned Platform
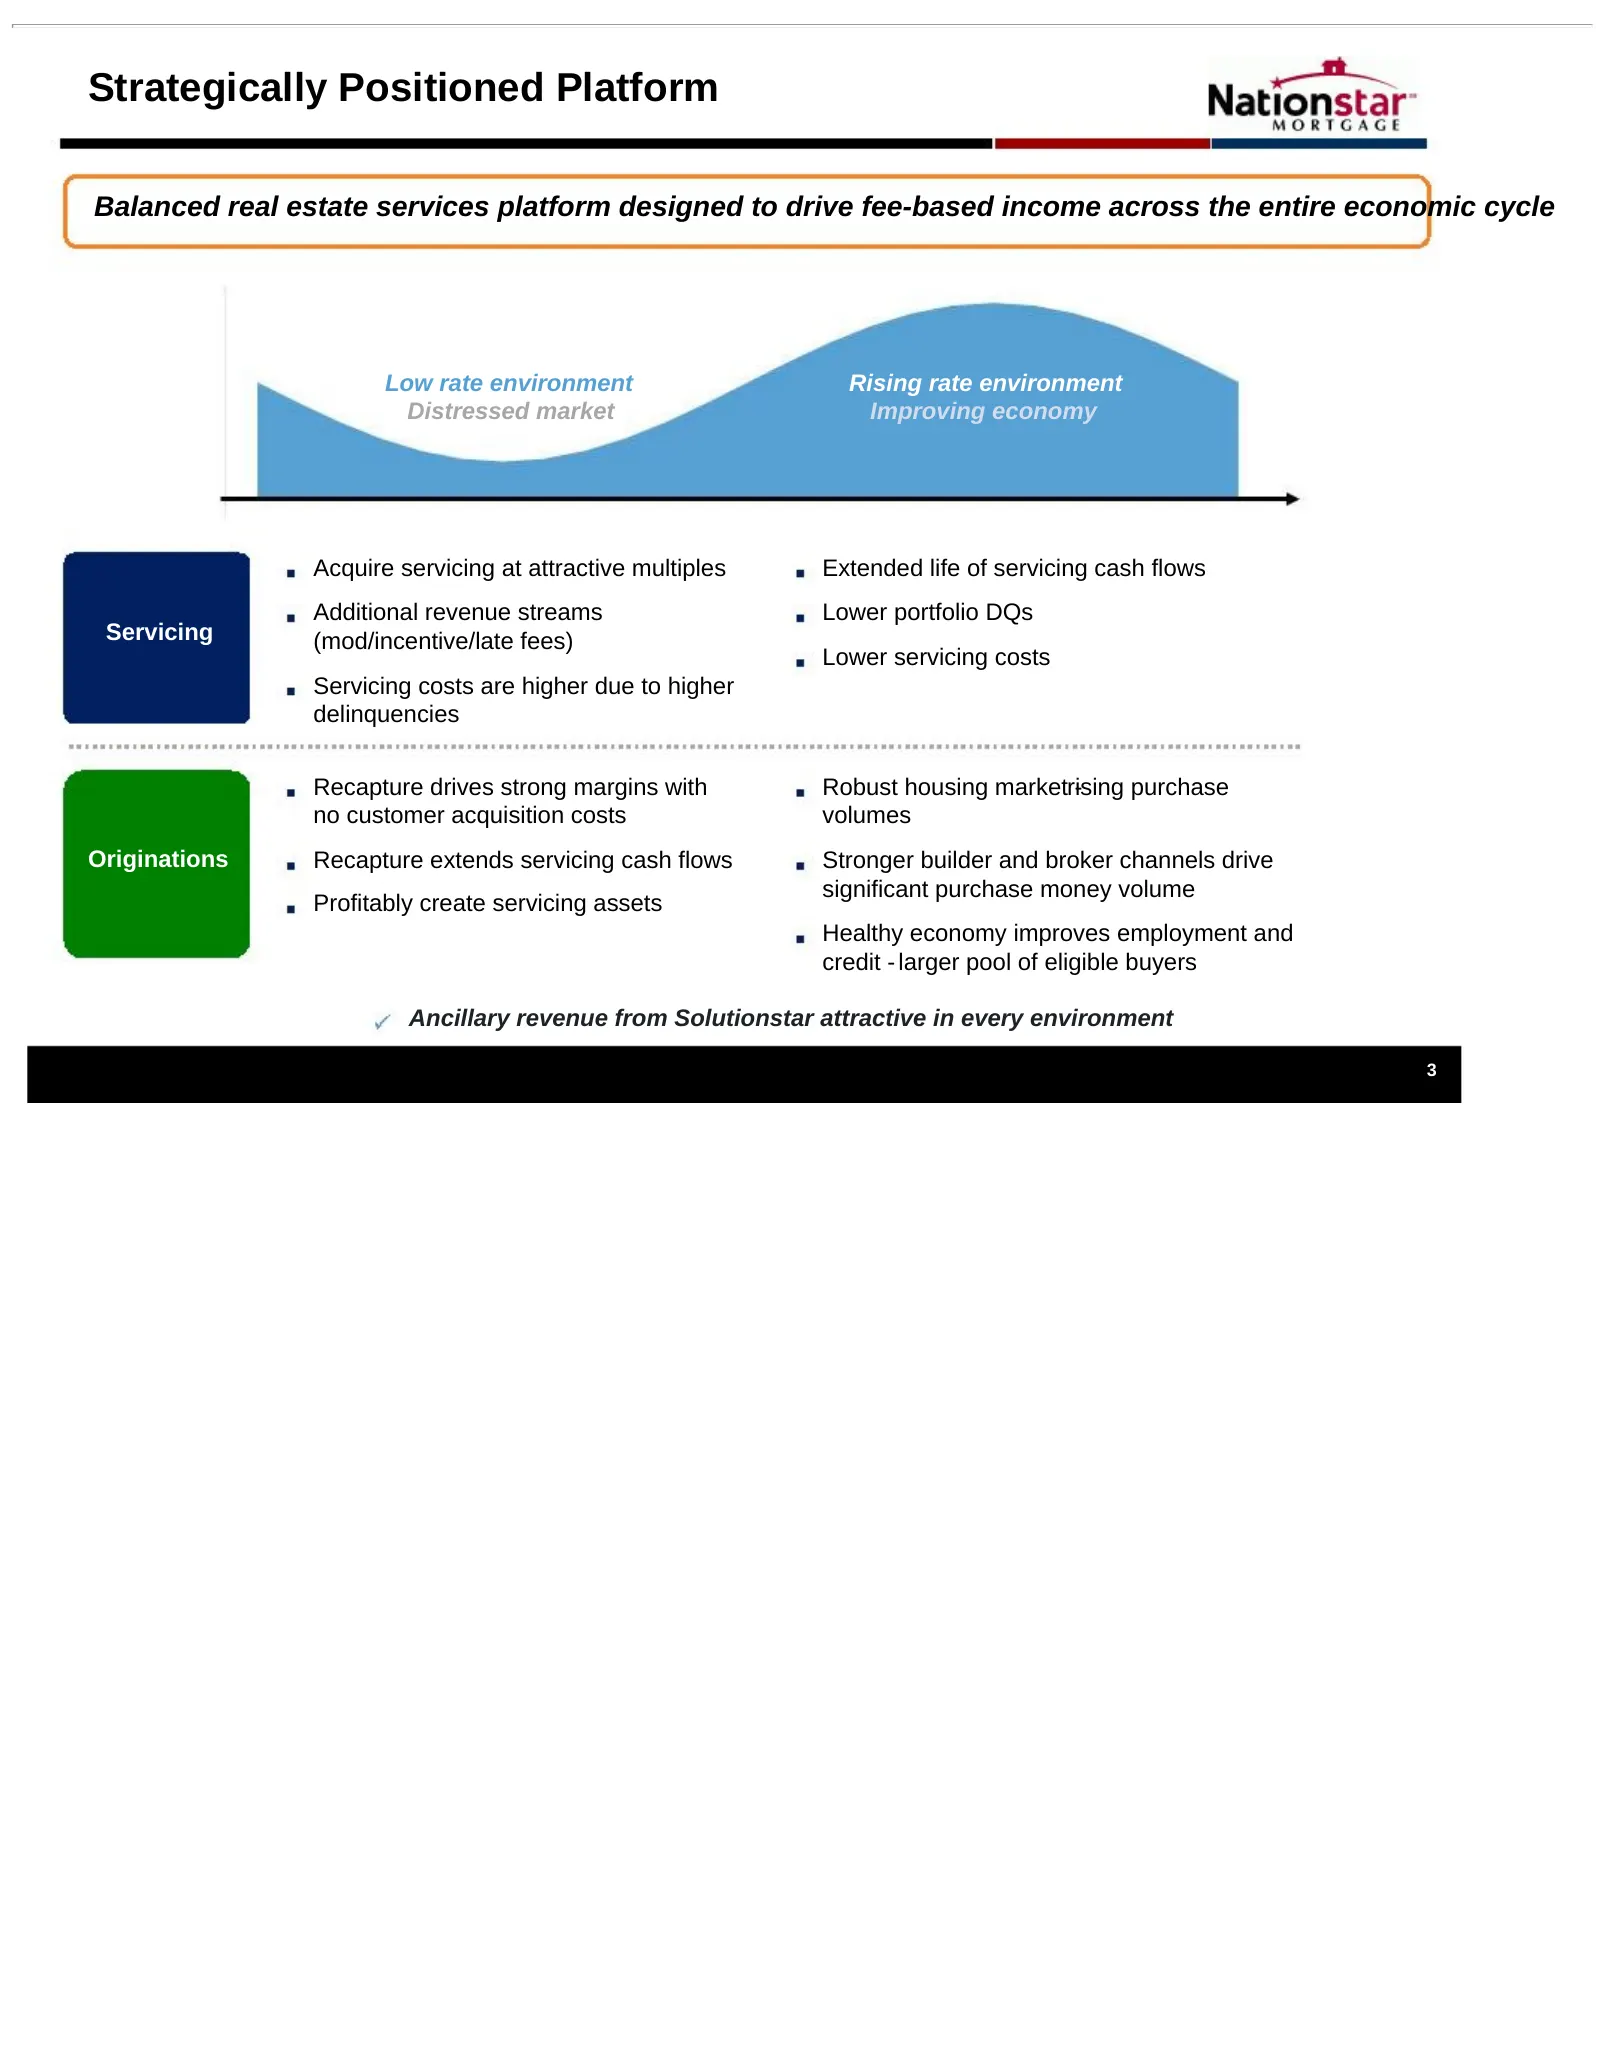
Strategically Positioned Platform Balanced real estate services platform designed to drive fee-based income across the entire economic cycle Low rate environment Rising rate environment Distressed market Improving economy Acquire servicing at attractive multiples Extended life of servicing cash flow
Slide 5: BofA Portfolio Acquisition – Landmark Acquisition
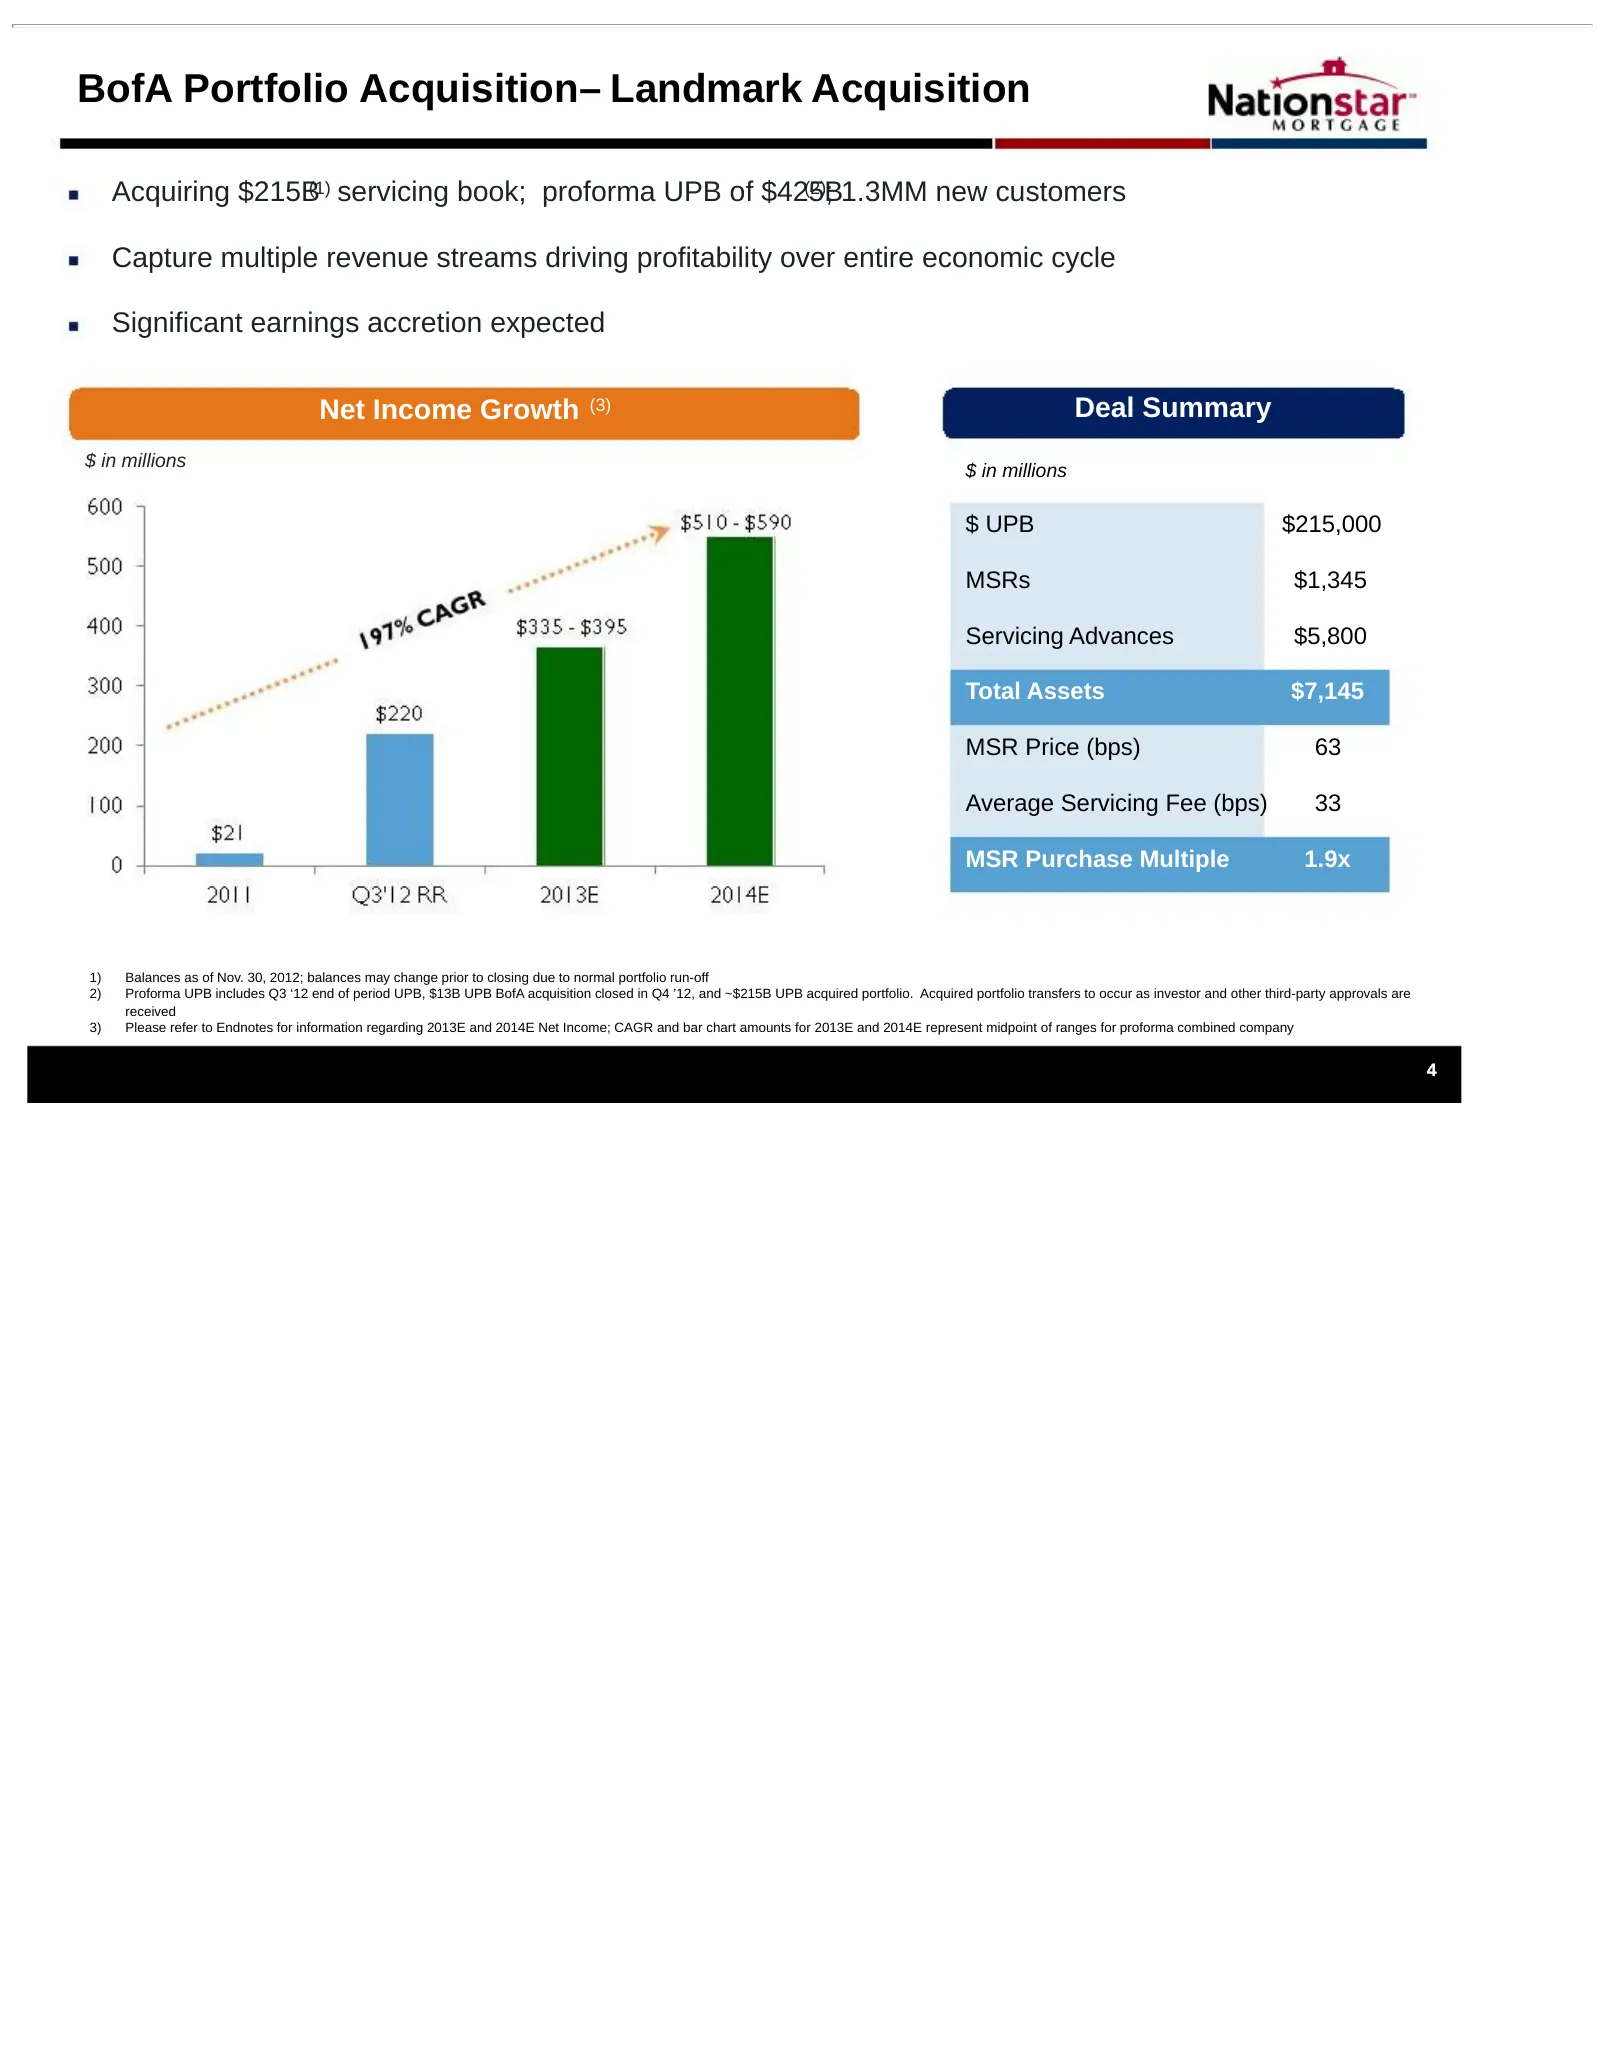
BofA Portfolio Acquisition– Landmark Acquisition Acquiring $215B(1) servicing book; proforma UPB of $425B (2); 1.3MM new customers Capture multiple revenue streams driving profitability over entire economic cycle Significant earnings accretion expected Net Income Growth (3) Deal Summary $ in million
Slide 6: Earnings Estimates
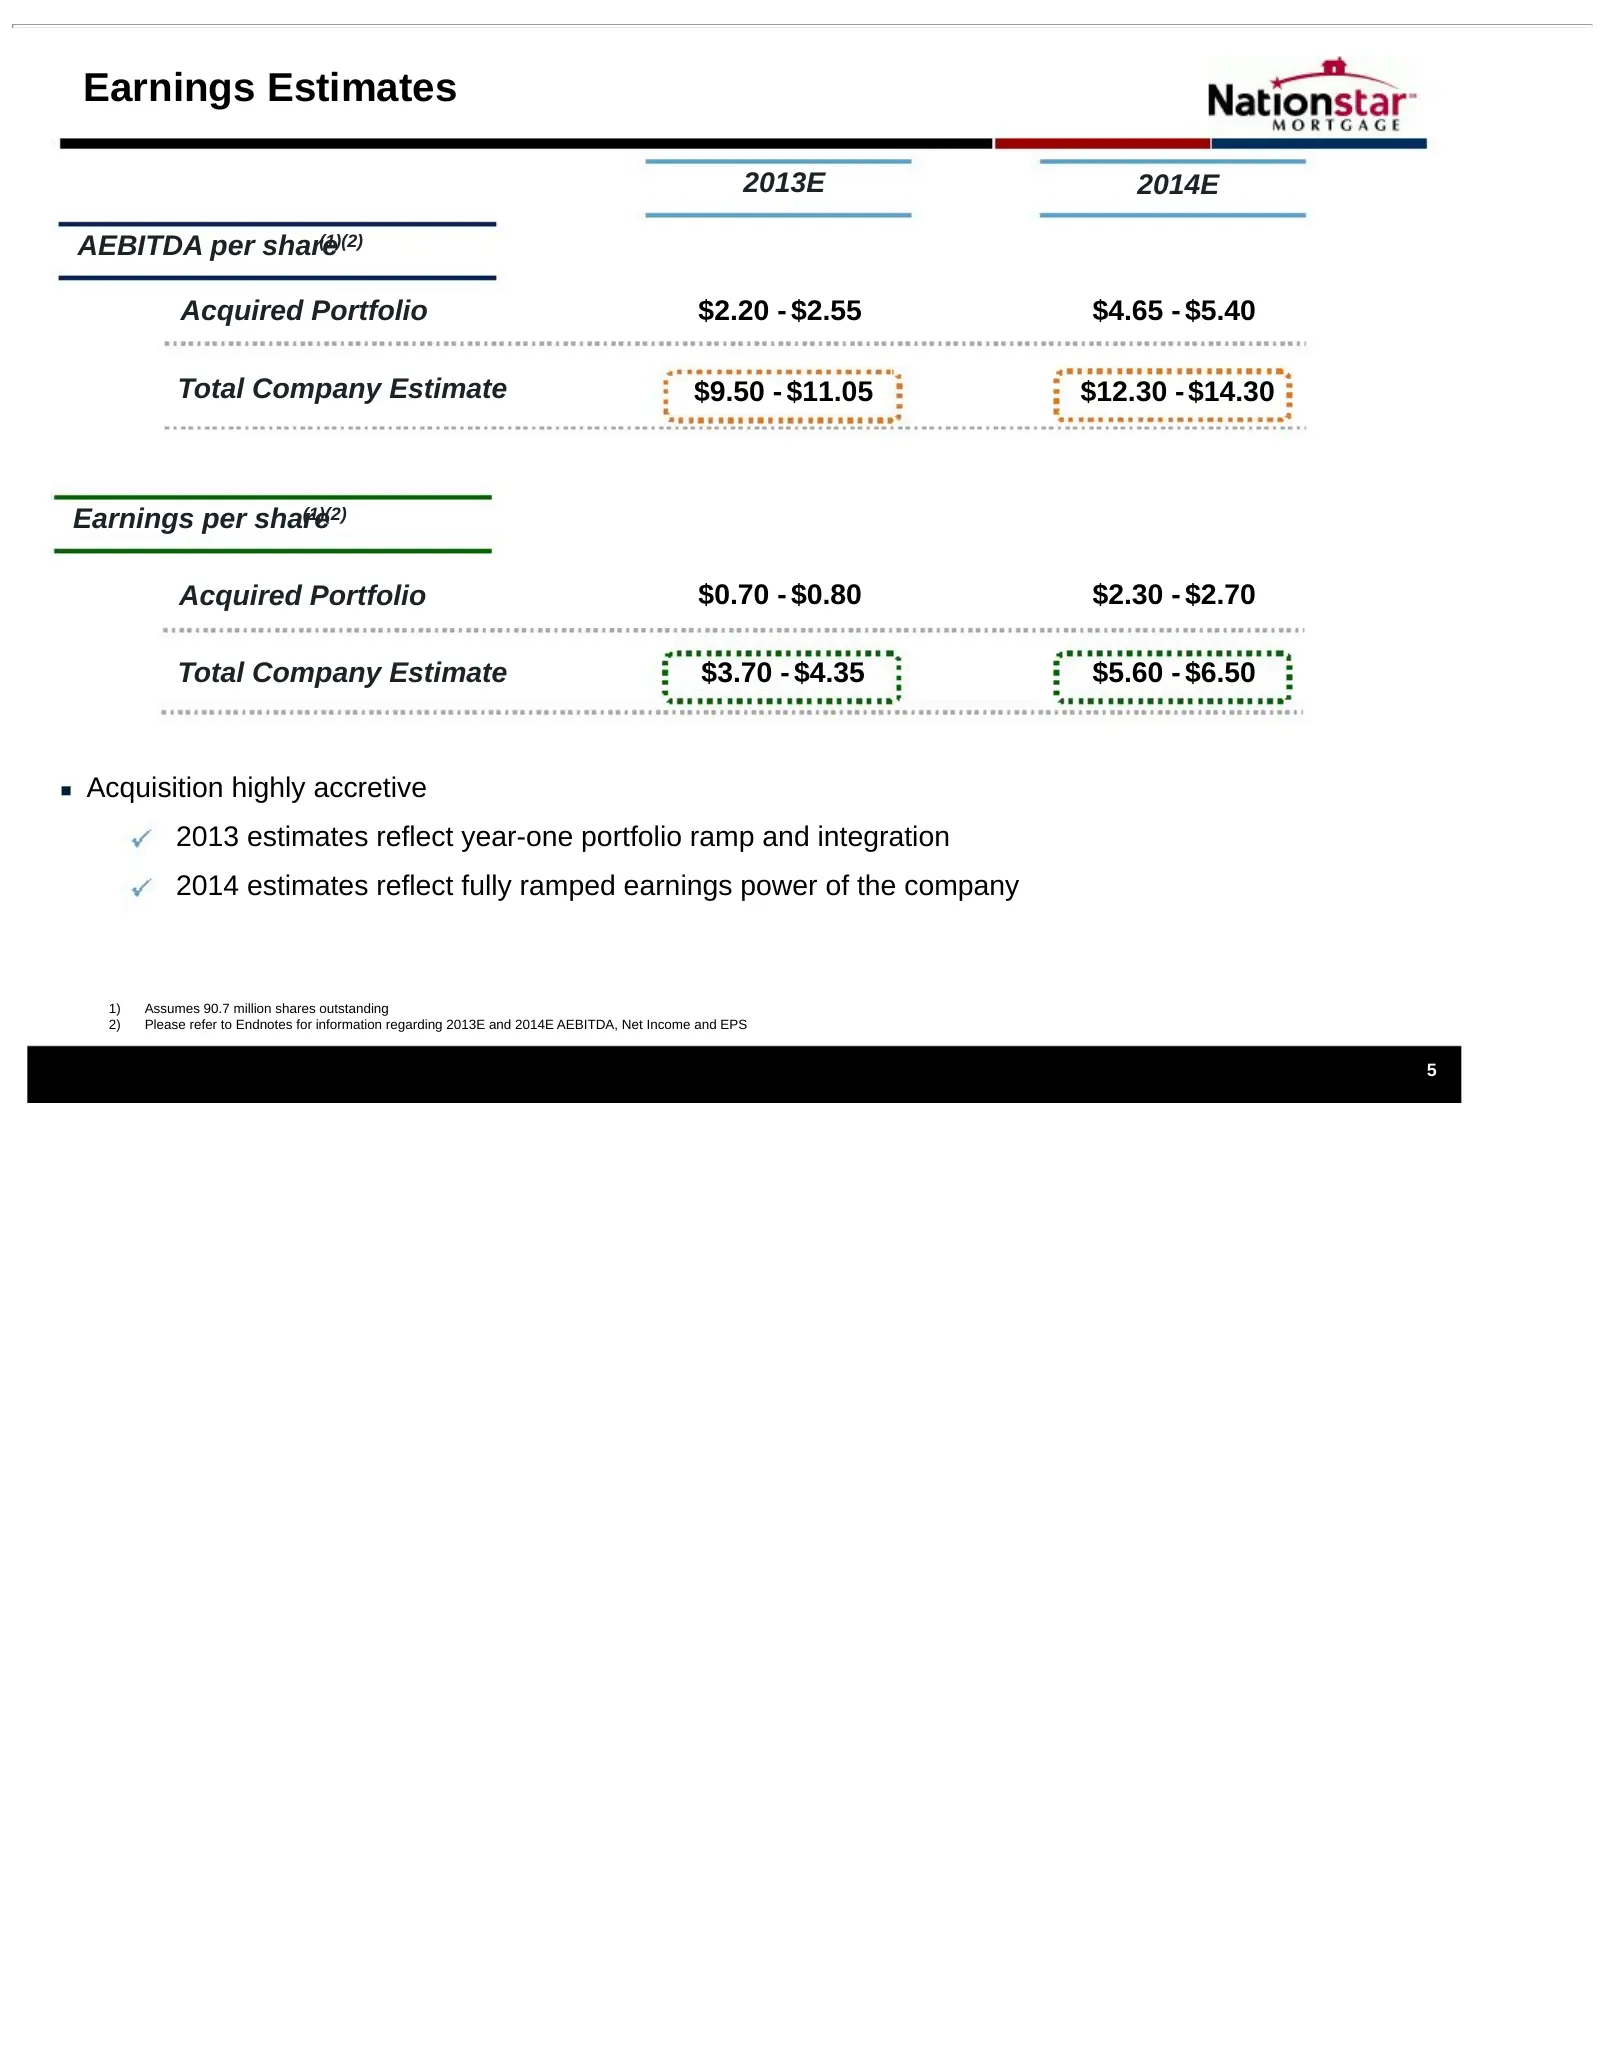
Earnings Estimates 2013E 2014E AEBITDA per share (1)(2) Acquired Portfolio $2.20 - $2.55 $4.65 - $5.40 Total Company Estimate $9.50 - $11.05 $12.30 - $14.30 Earnings per share (1)(2) Acquired Portfolio $0.70 - $0.80 $2.30 - $2.70 Total Company Estimate $3.70 - $4.35 $5.60 - $6.50 Acquisition highly
Slide 7: Future Growth Opportunities
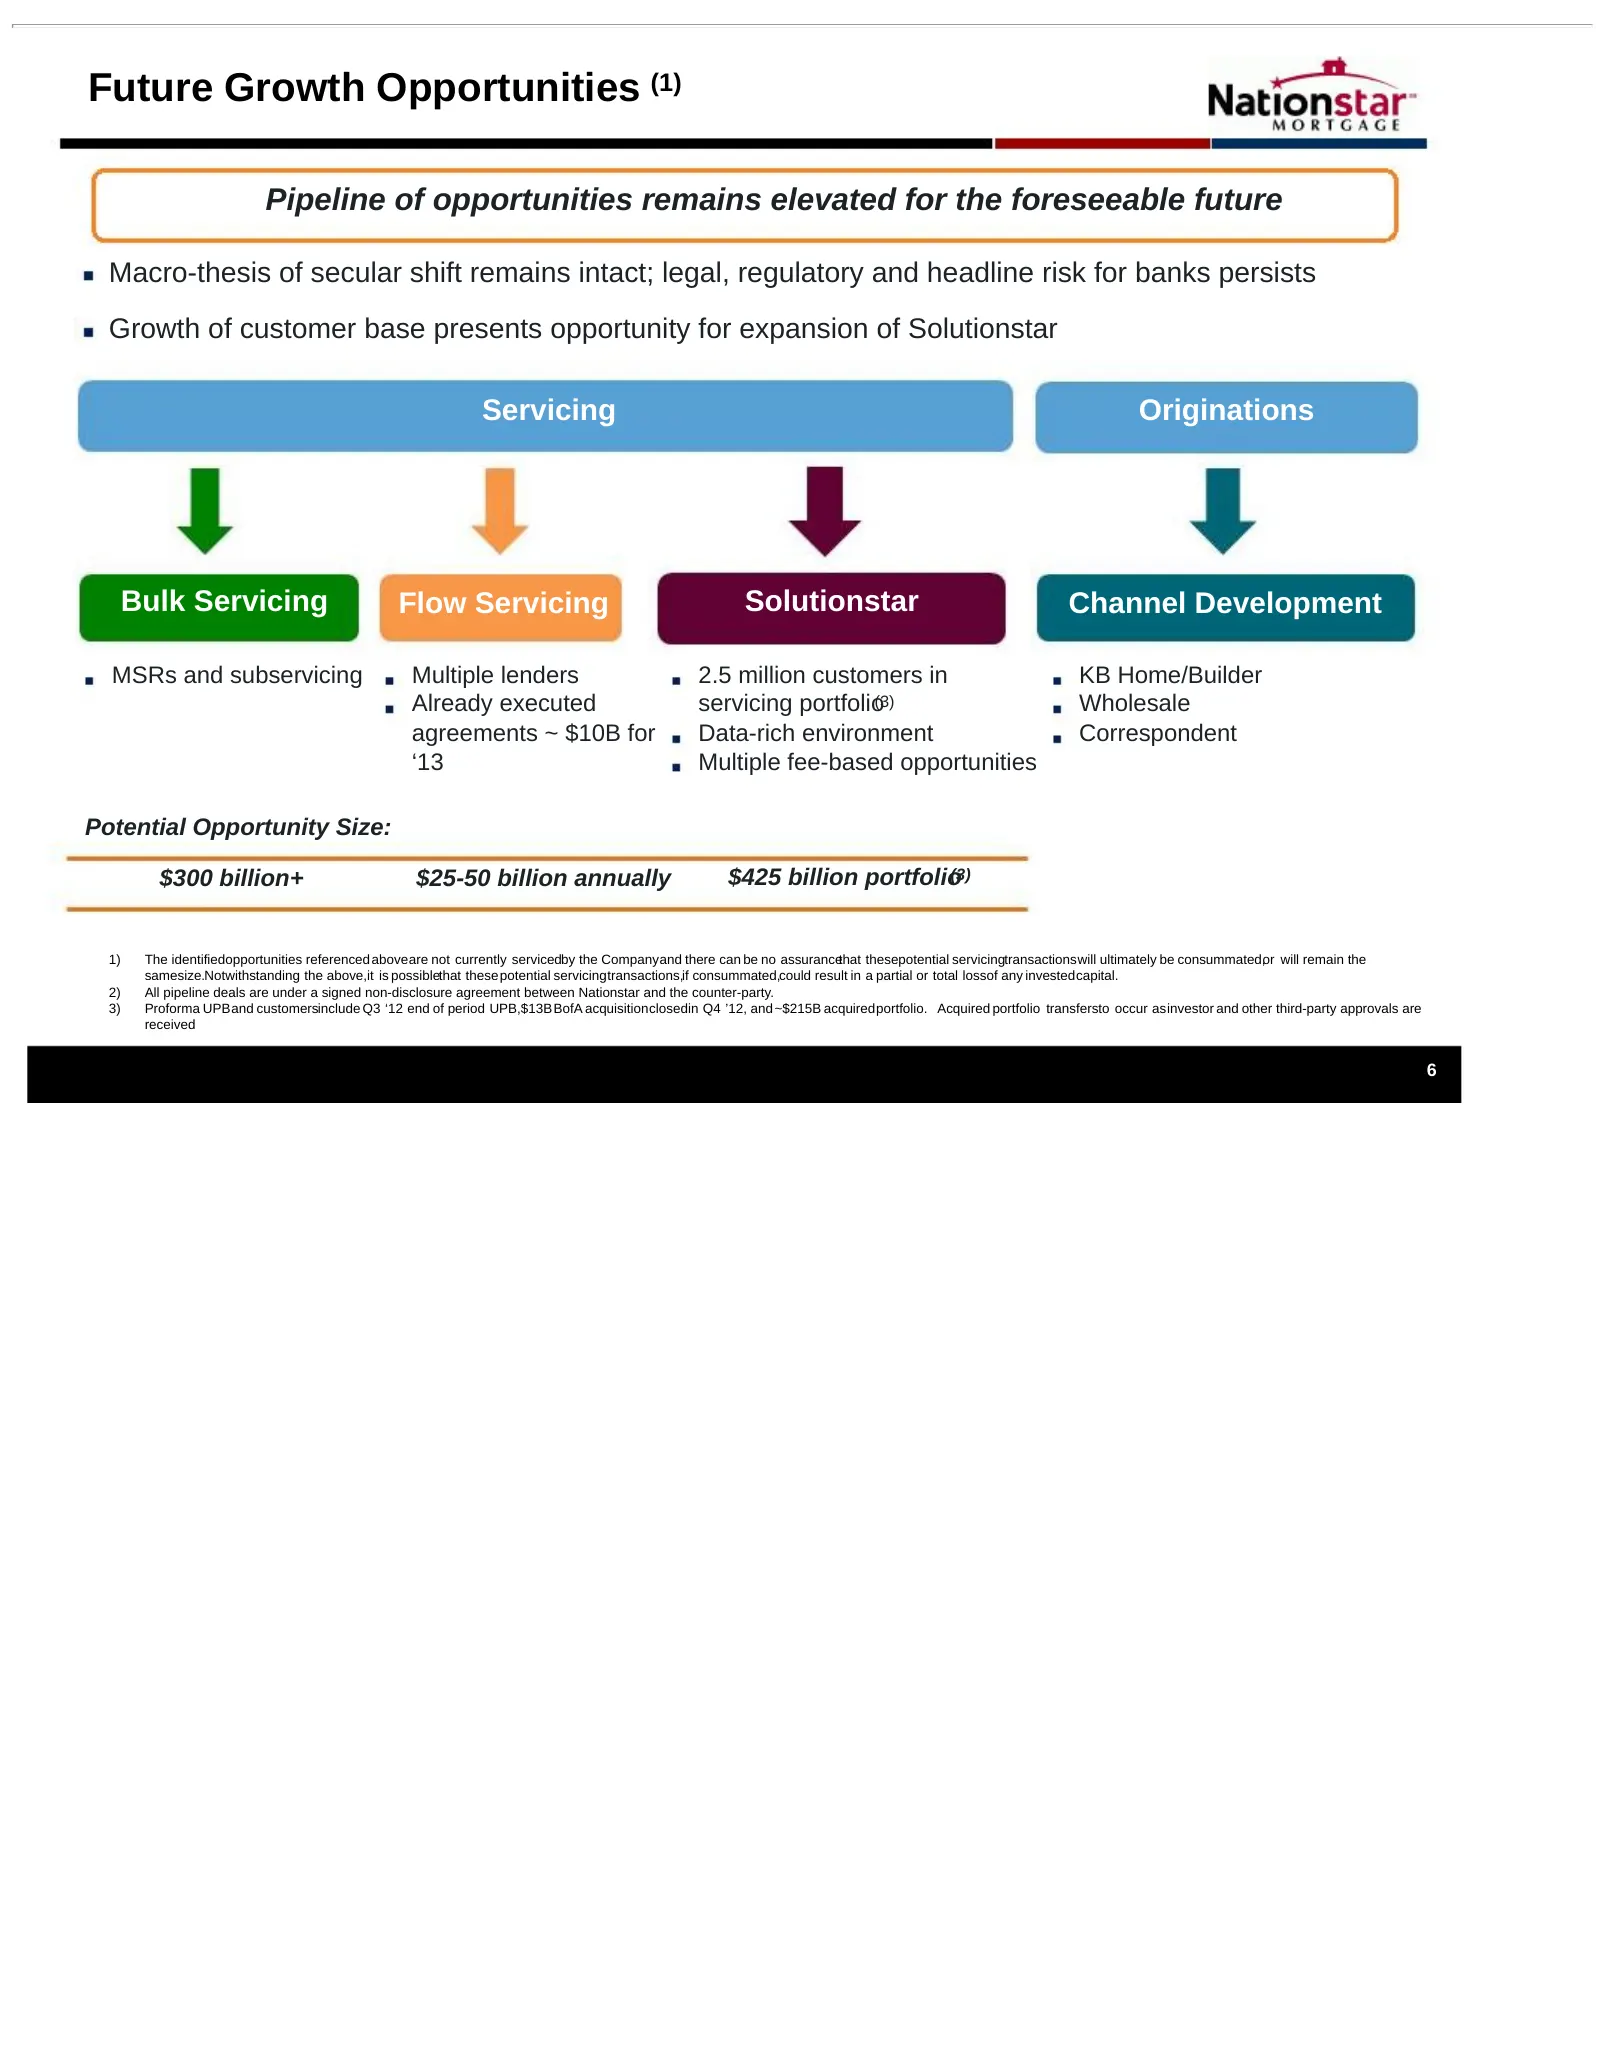
Future Growth Opportunities (1) Pipeline of opportunities remains elevated for the foreseeable future Macro-thesis of secular shift remains intact; legal, regulatory and headline risk for banks persists Growth of customer base presents opportunity for expansion of Solutionstar Servicing Originations
Slide 8: Prospective Opportunities for Nationstar
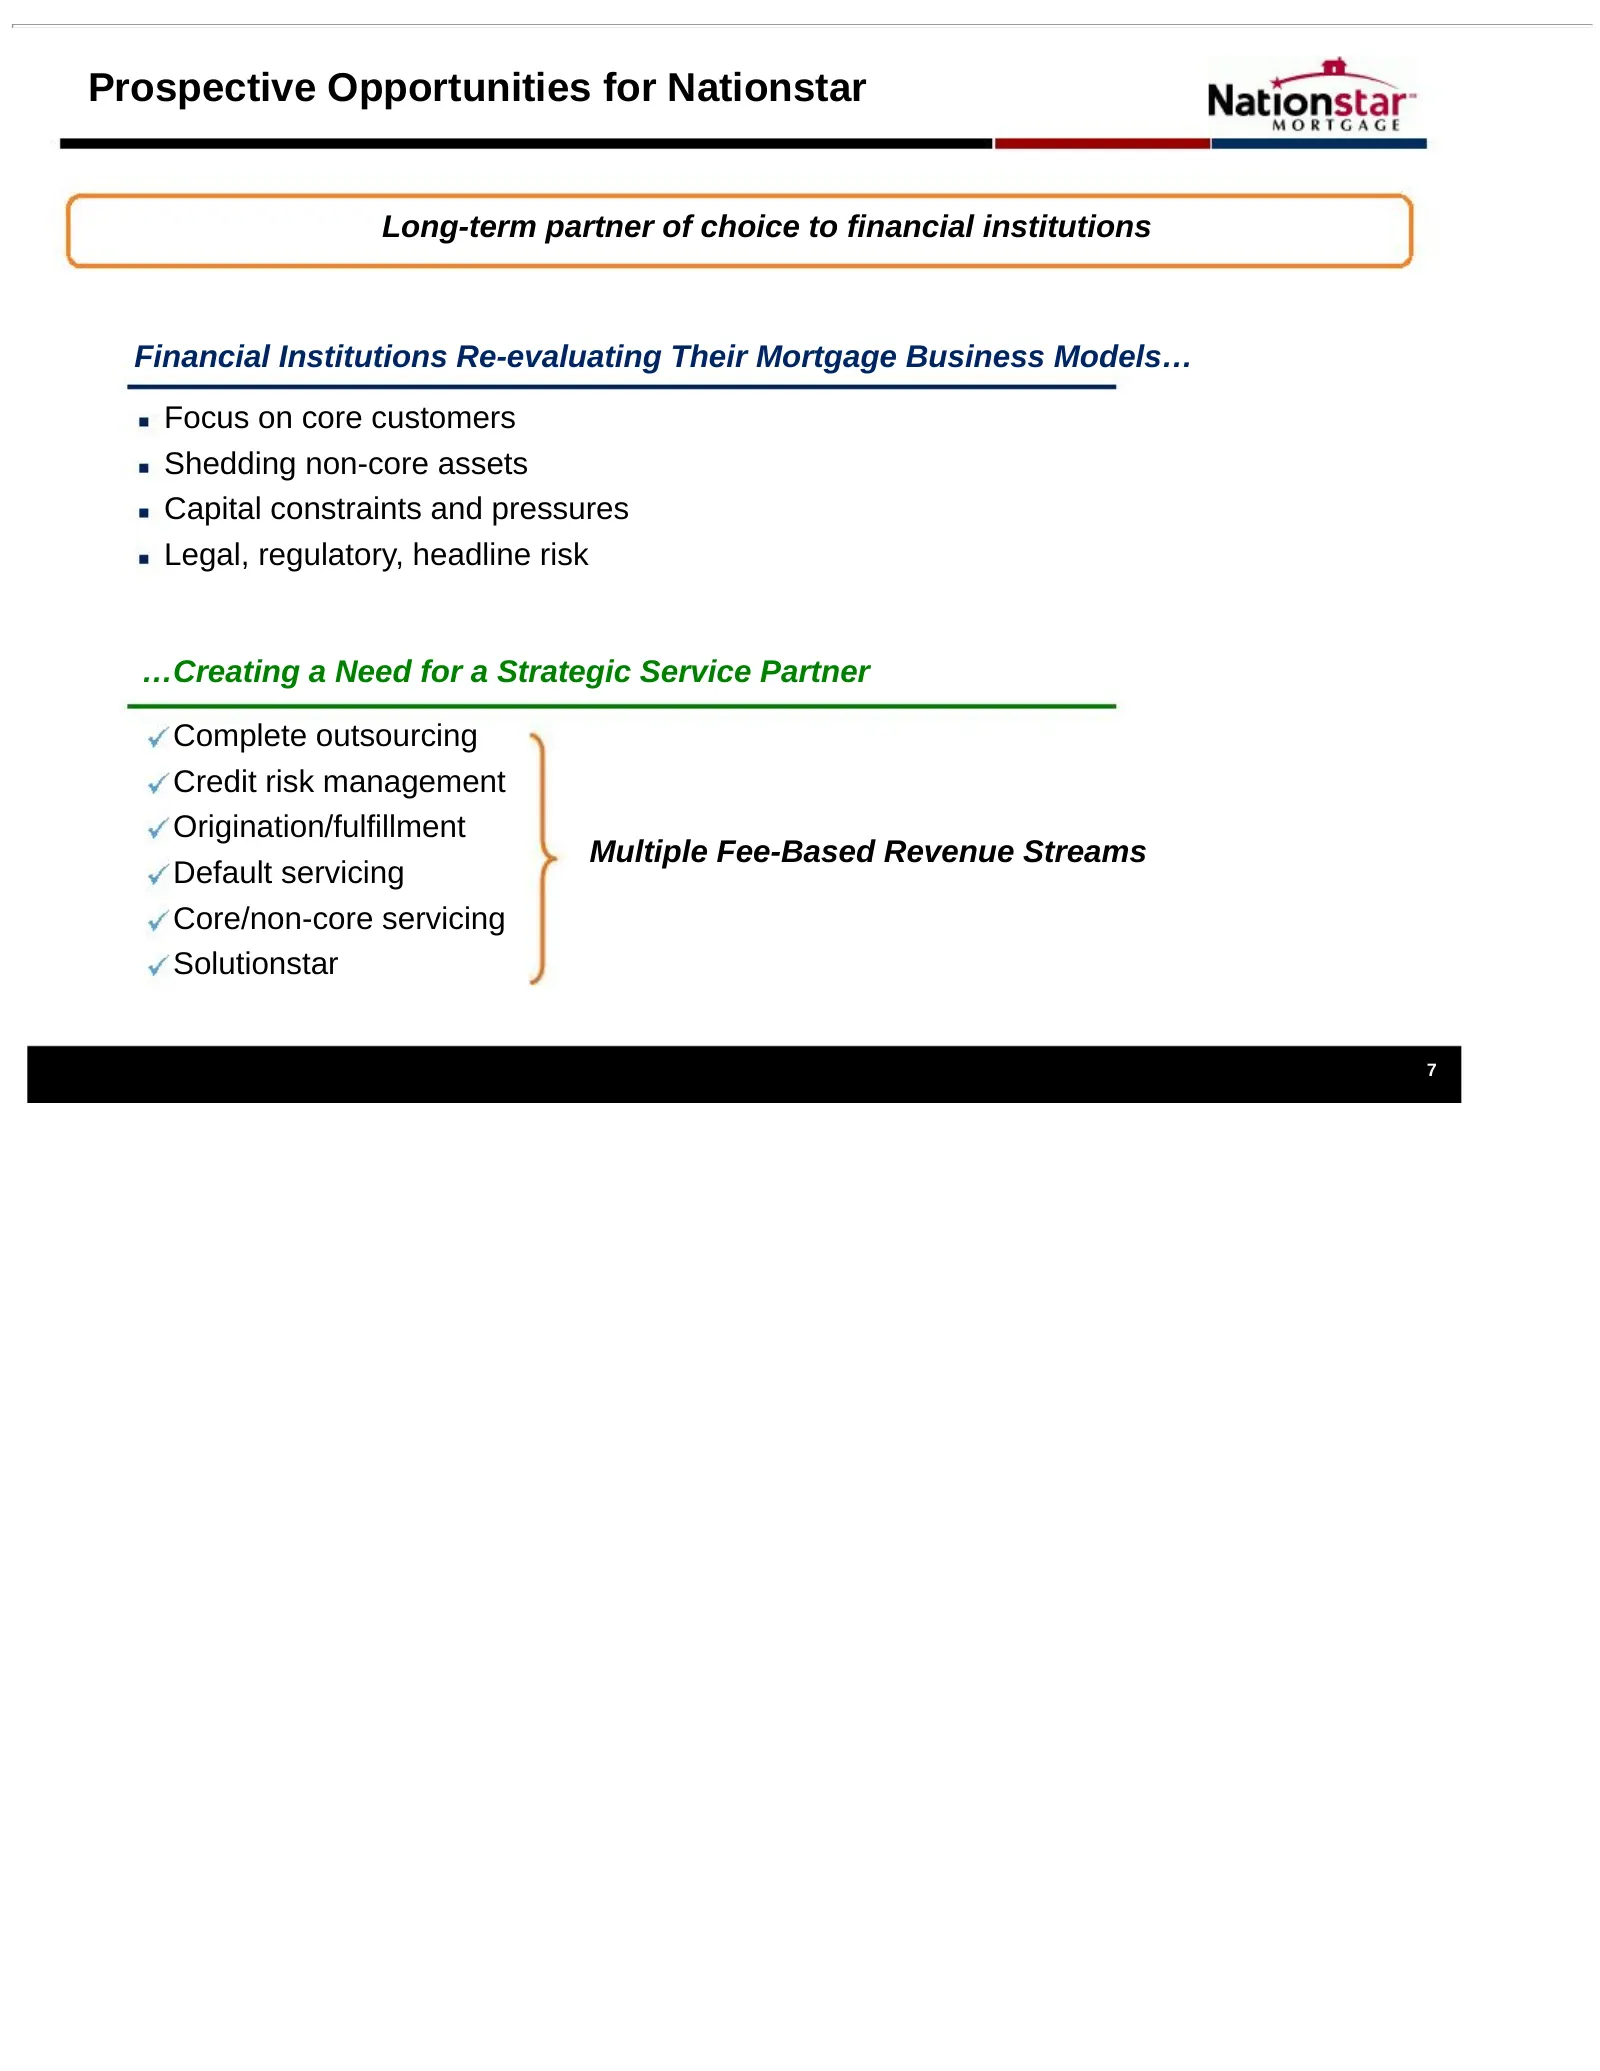
Prospective Opportunities for Nationstar Long-term partner of choice to financial institutions Financial Institutions Re-evaluating Their Mortgage Business Models… Focus on core customers Shedding non-core assets Capital constraints and pressures Legal, regulatory, headline risk …Creating a Need for
Slide 9: Servicing Profitability Ramp
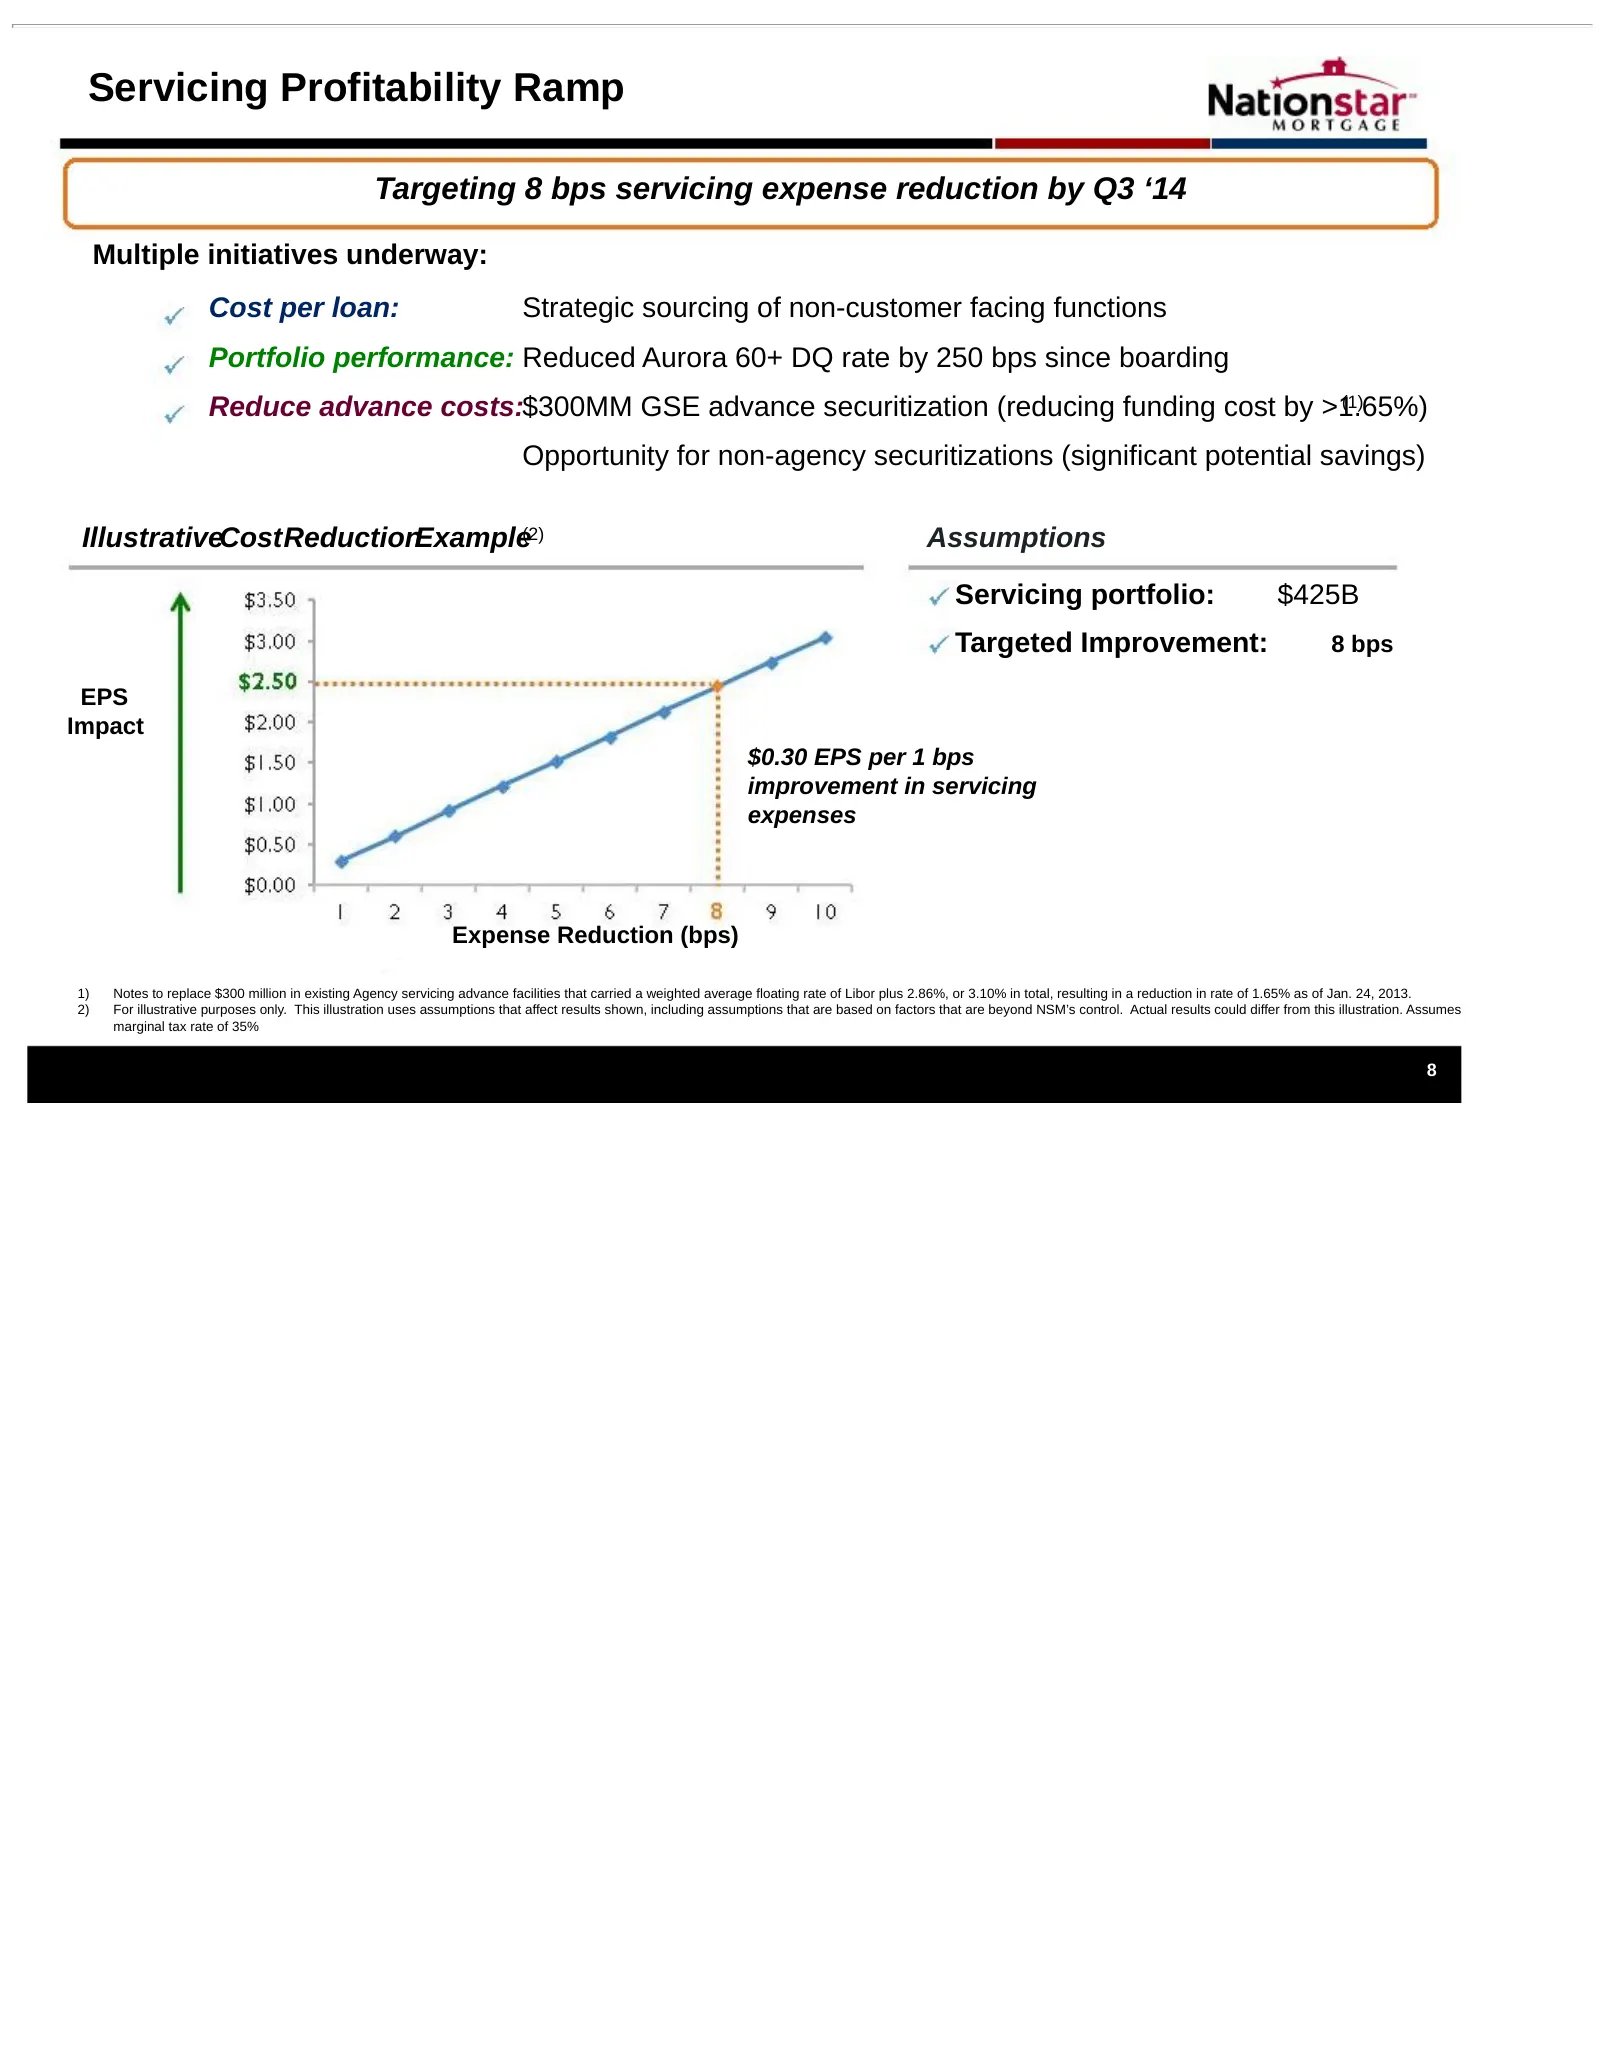
Servicing Profitability Ramp Targeting 8 bps servicing expense reduction by Q3 ‘14 Multiple initiatives underway: Cost per loan: Strategic sourcing of non-customer facing functions Portfolio performance: Reduced Aurora 60+ DQ rate by 250 bps since boarding Reduce advance costs:$300MM GSE advance sec
Slide 10: Originations: Enhances Core Servicing Platform
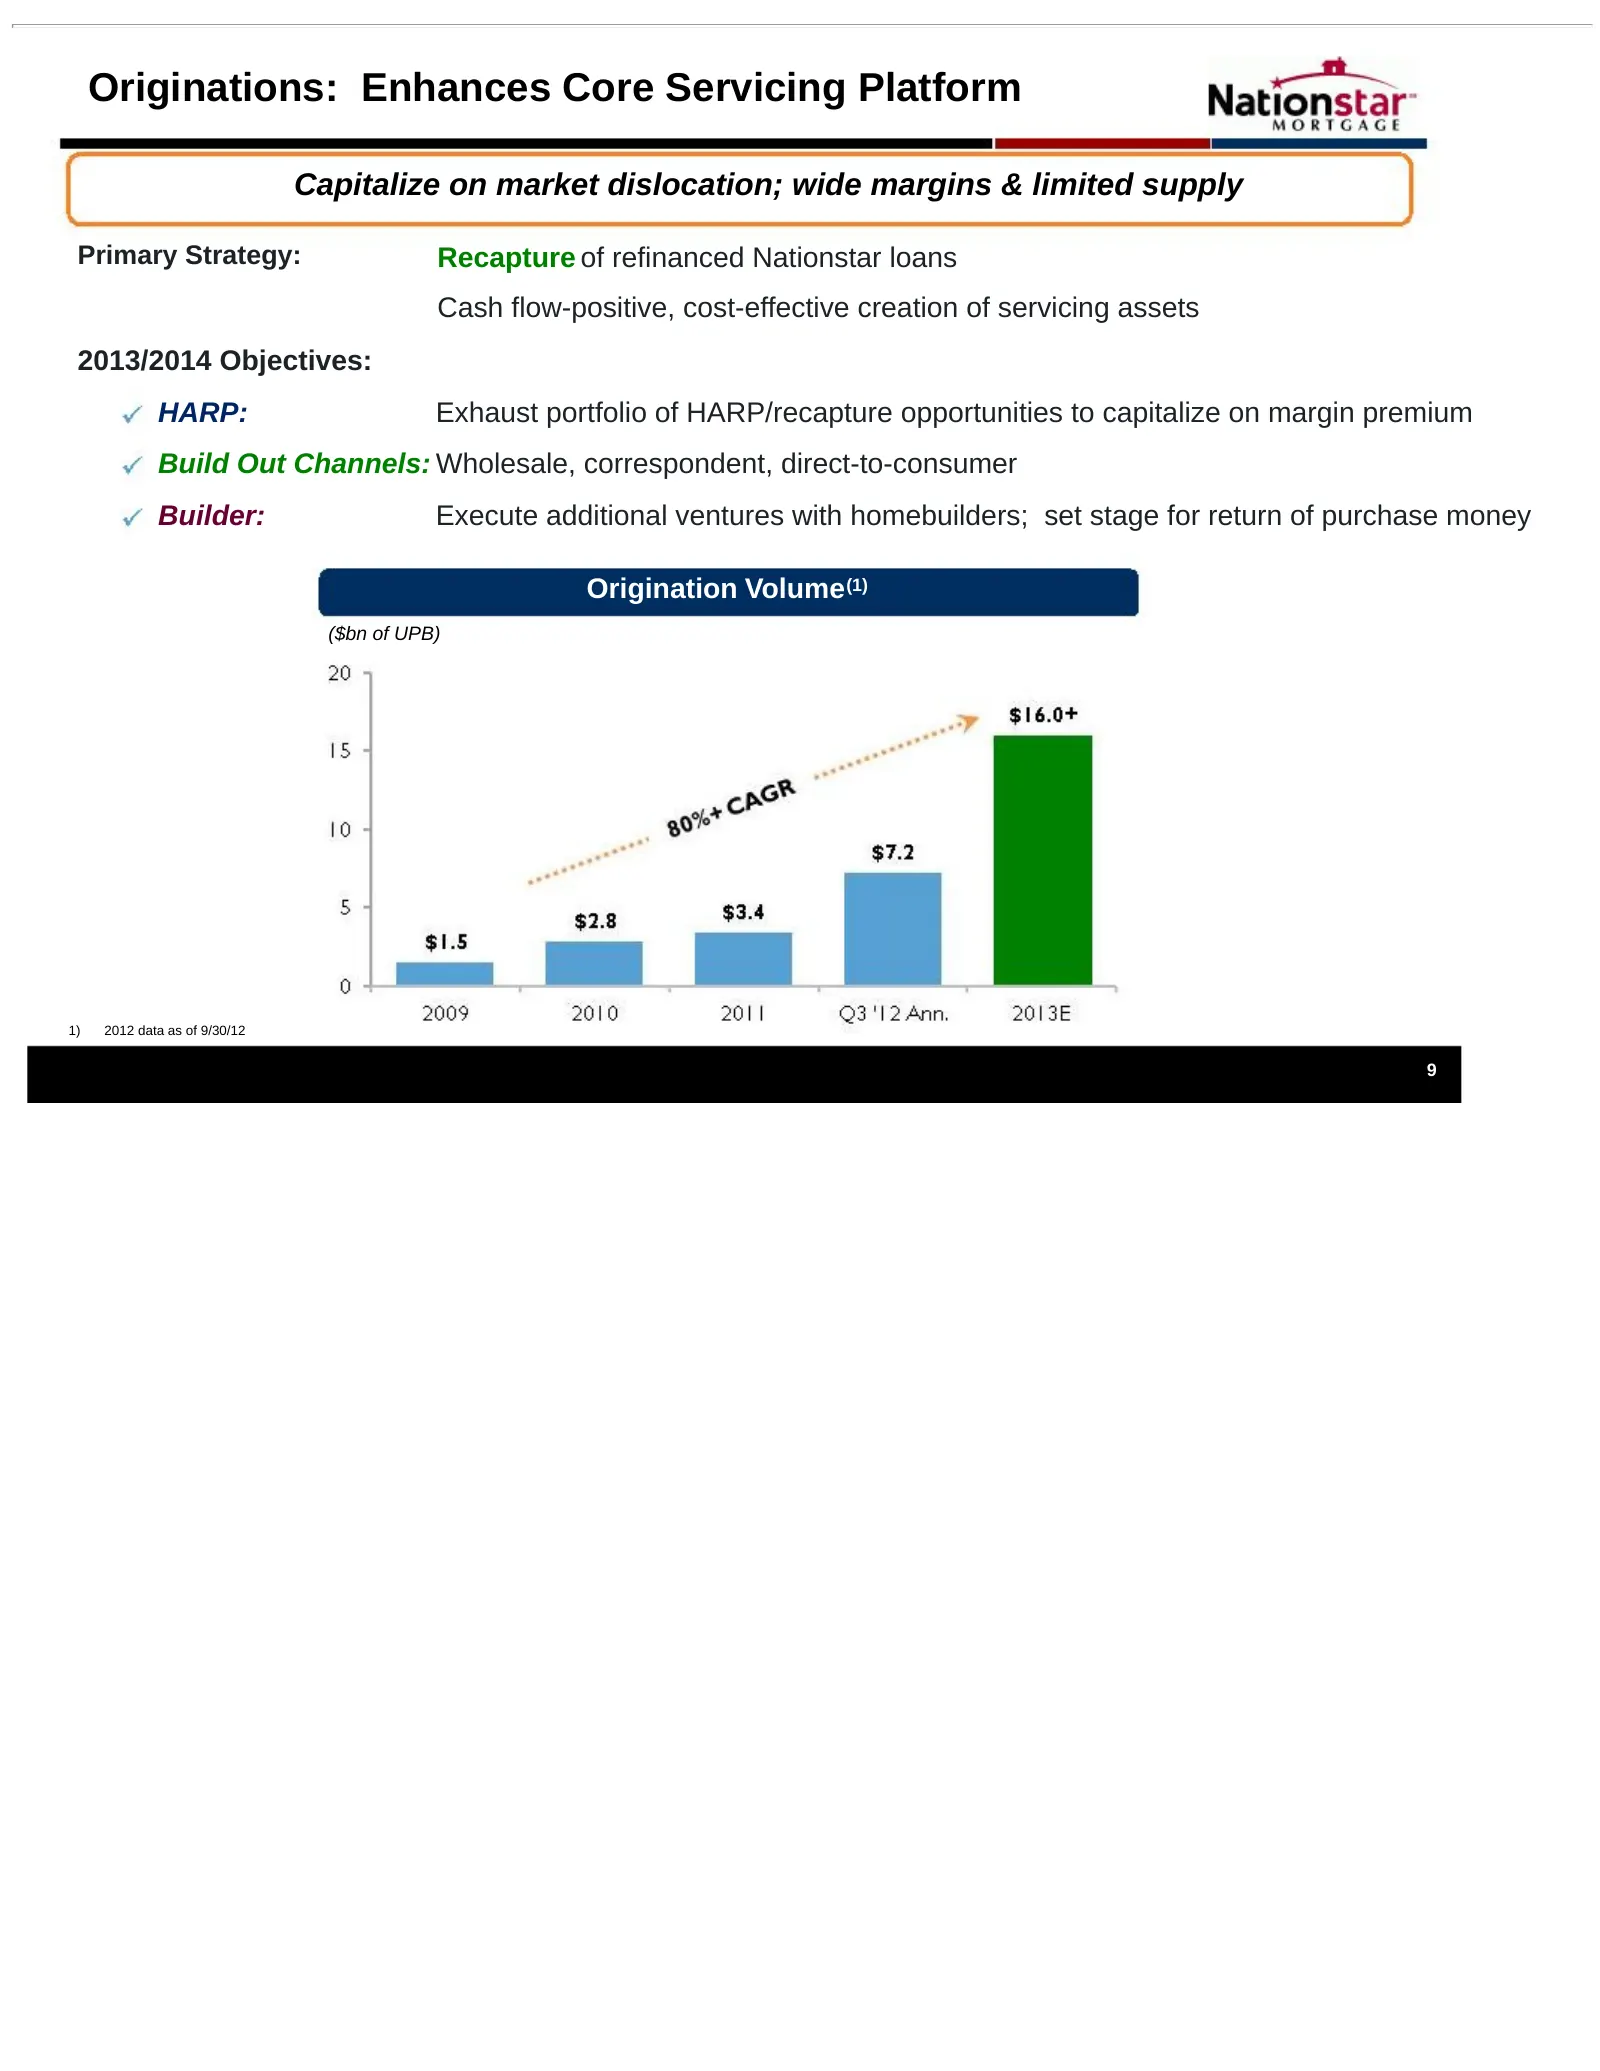
Originations: Enhances Core Servicing Platform Capitalize on market dislocation; wide margins & limited supply Primary Strategy: Recapture of refinanced Nationstar loans Cash flow-positive, cost-effective creation of servicing assets 2013/2014 Objectives: HARP: Exhaust portfolio of HARP/recapture op
Slide 11: Housing Market – Return of Residential Investment
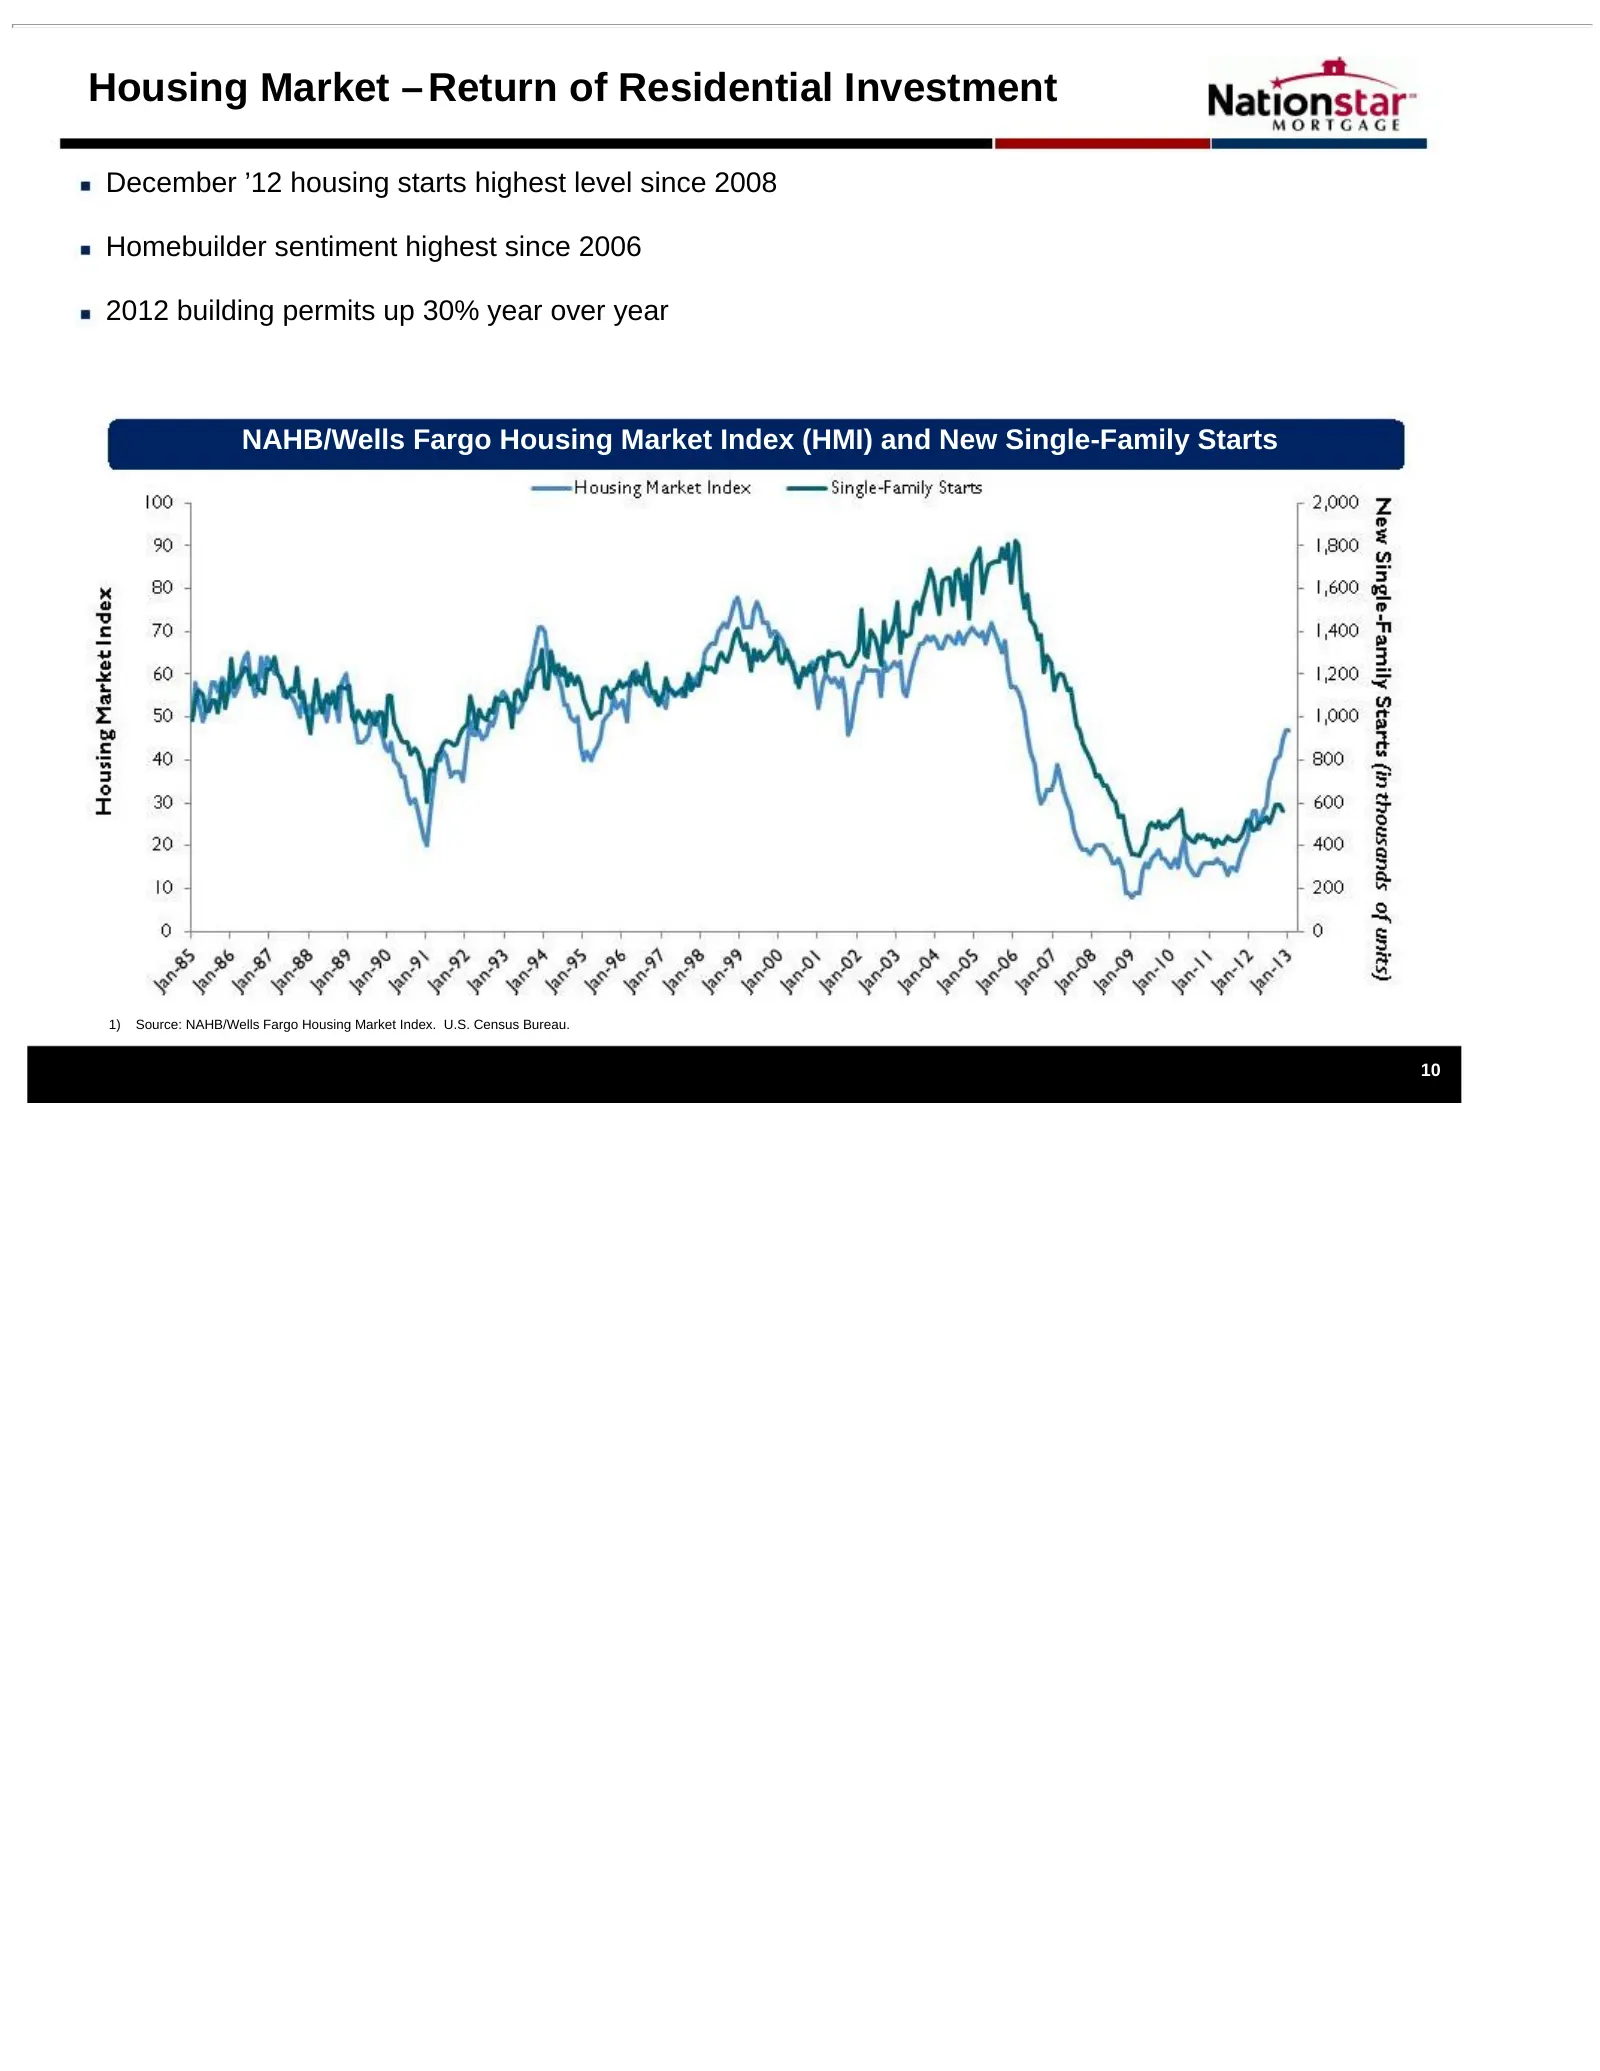
Housing Market – Return of Residential Investment December ’12 housing starts highest level since 2008 Homebuilder sentiment highest since 2006 2012 building permits up 30% year over year NAHB/Wells Fargo Housing Market Index (HMI) and New Single-Family Starts 1) Source: NAHB/Wells Fargo Housing Mar
Slide 12: HARP Rich Servicing Portfolio
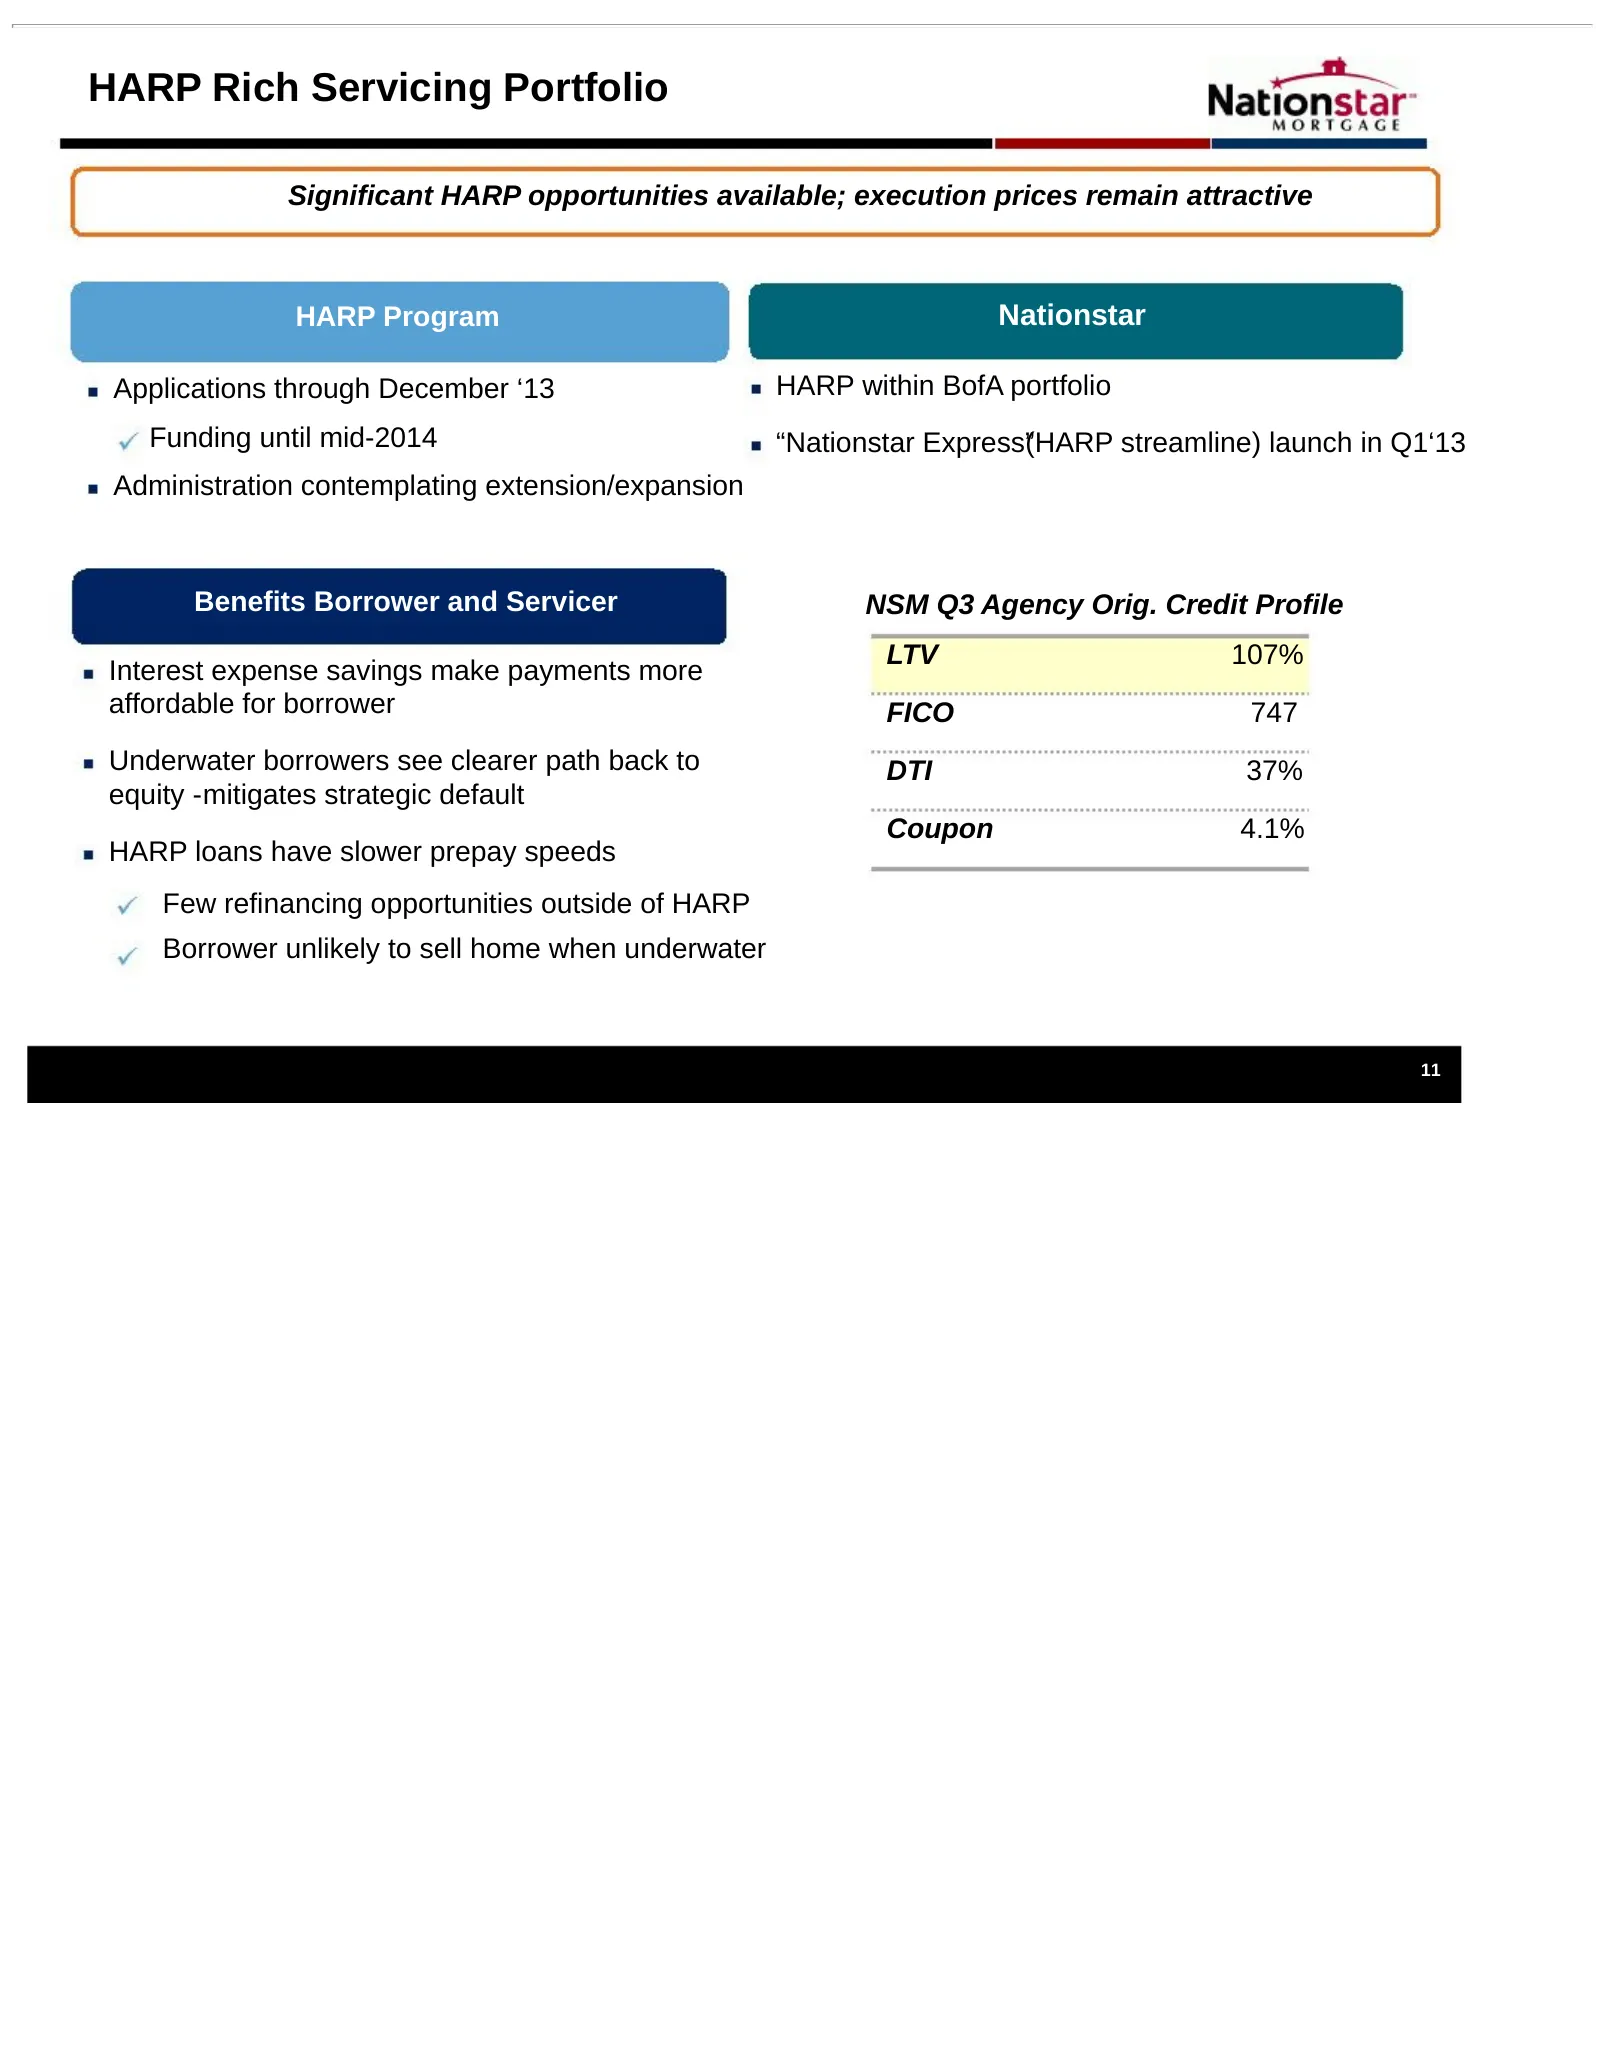
HARP Rich Servicing Portfolio Significant HARP opportunities available; execution prices remain attractive HARP Program Nationstar Applications through December ‘13 HARP within BofA portfolio Funding until mid-2014 “Nationstar Express”(HARP streamline) launch in Q1‘13 Administration contemplating ex
Slide 13: Solutionstar
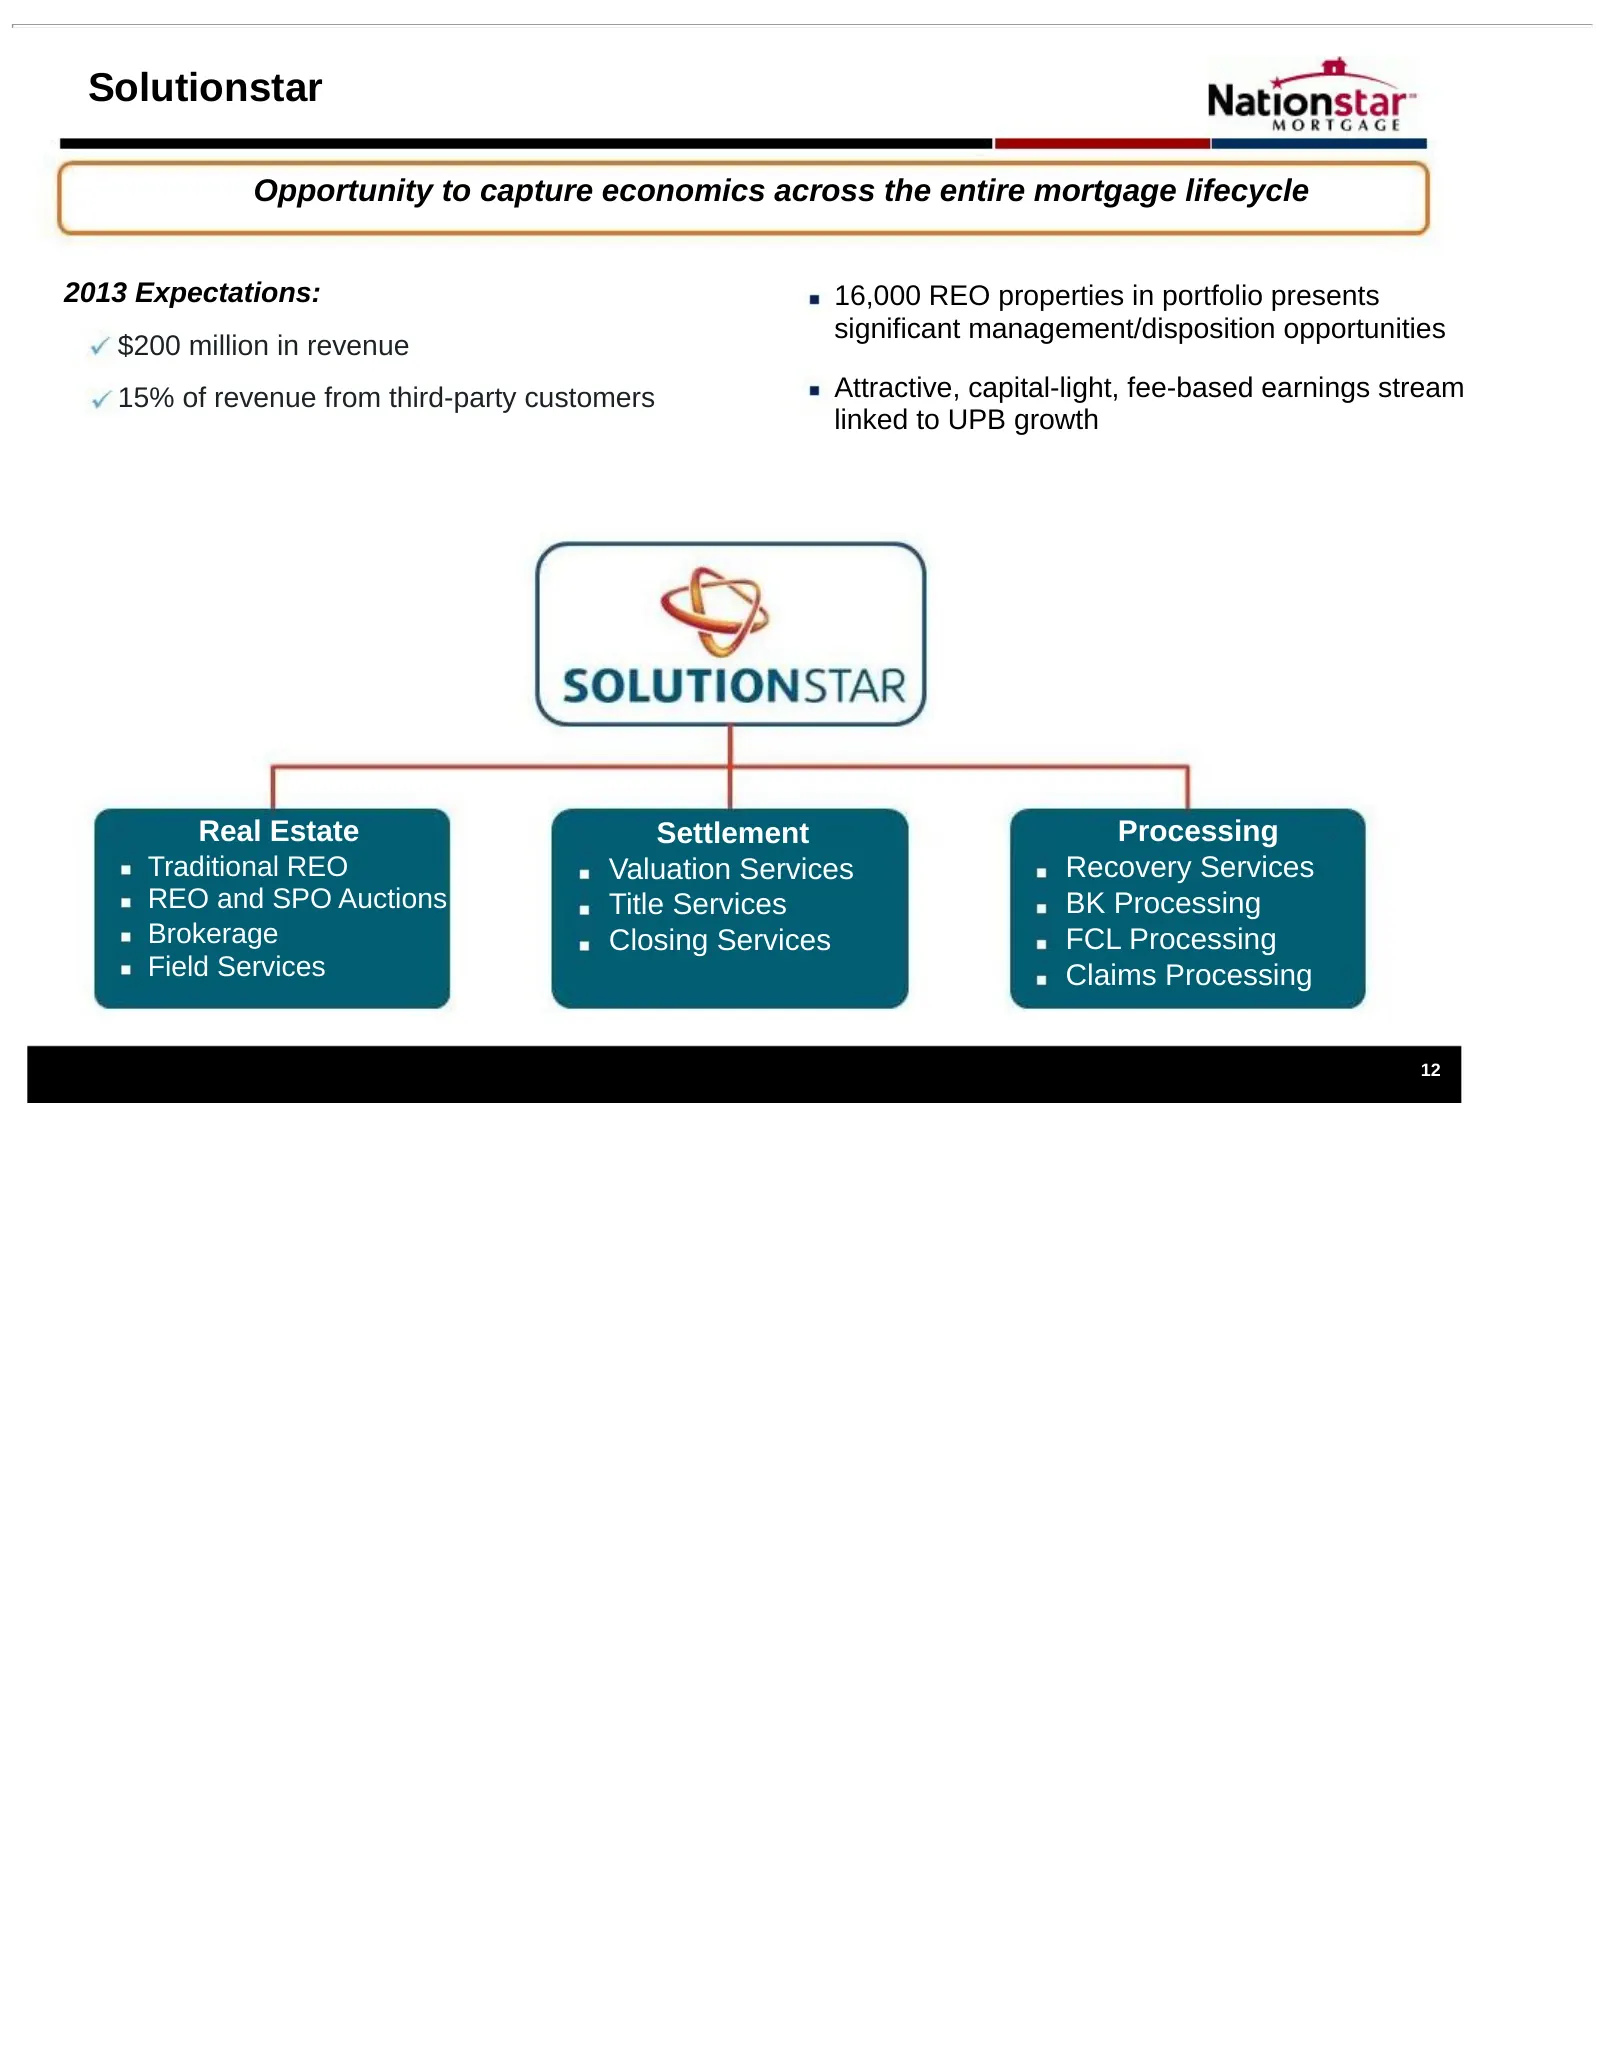
Solutionstar Opportunity to capture economics across the entire mortgage lifecycle 2013 Expectations: 16,000 REO properties in portfolio presents significant management/disposition opportunities $200 million in revenue 15% of revenue from third-party customers Attractive, capital-light, fee-based ea
Slide 14: At Current Levels, NSM Represents Value Proposition
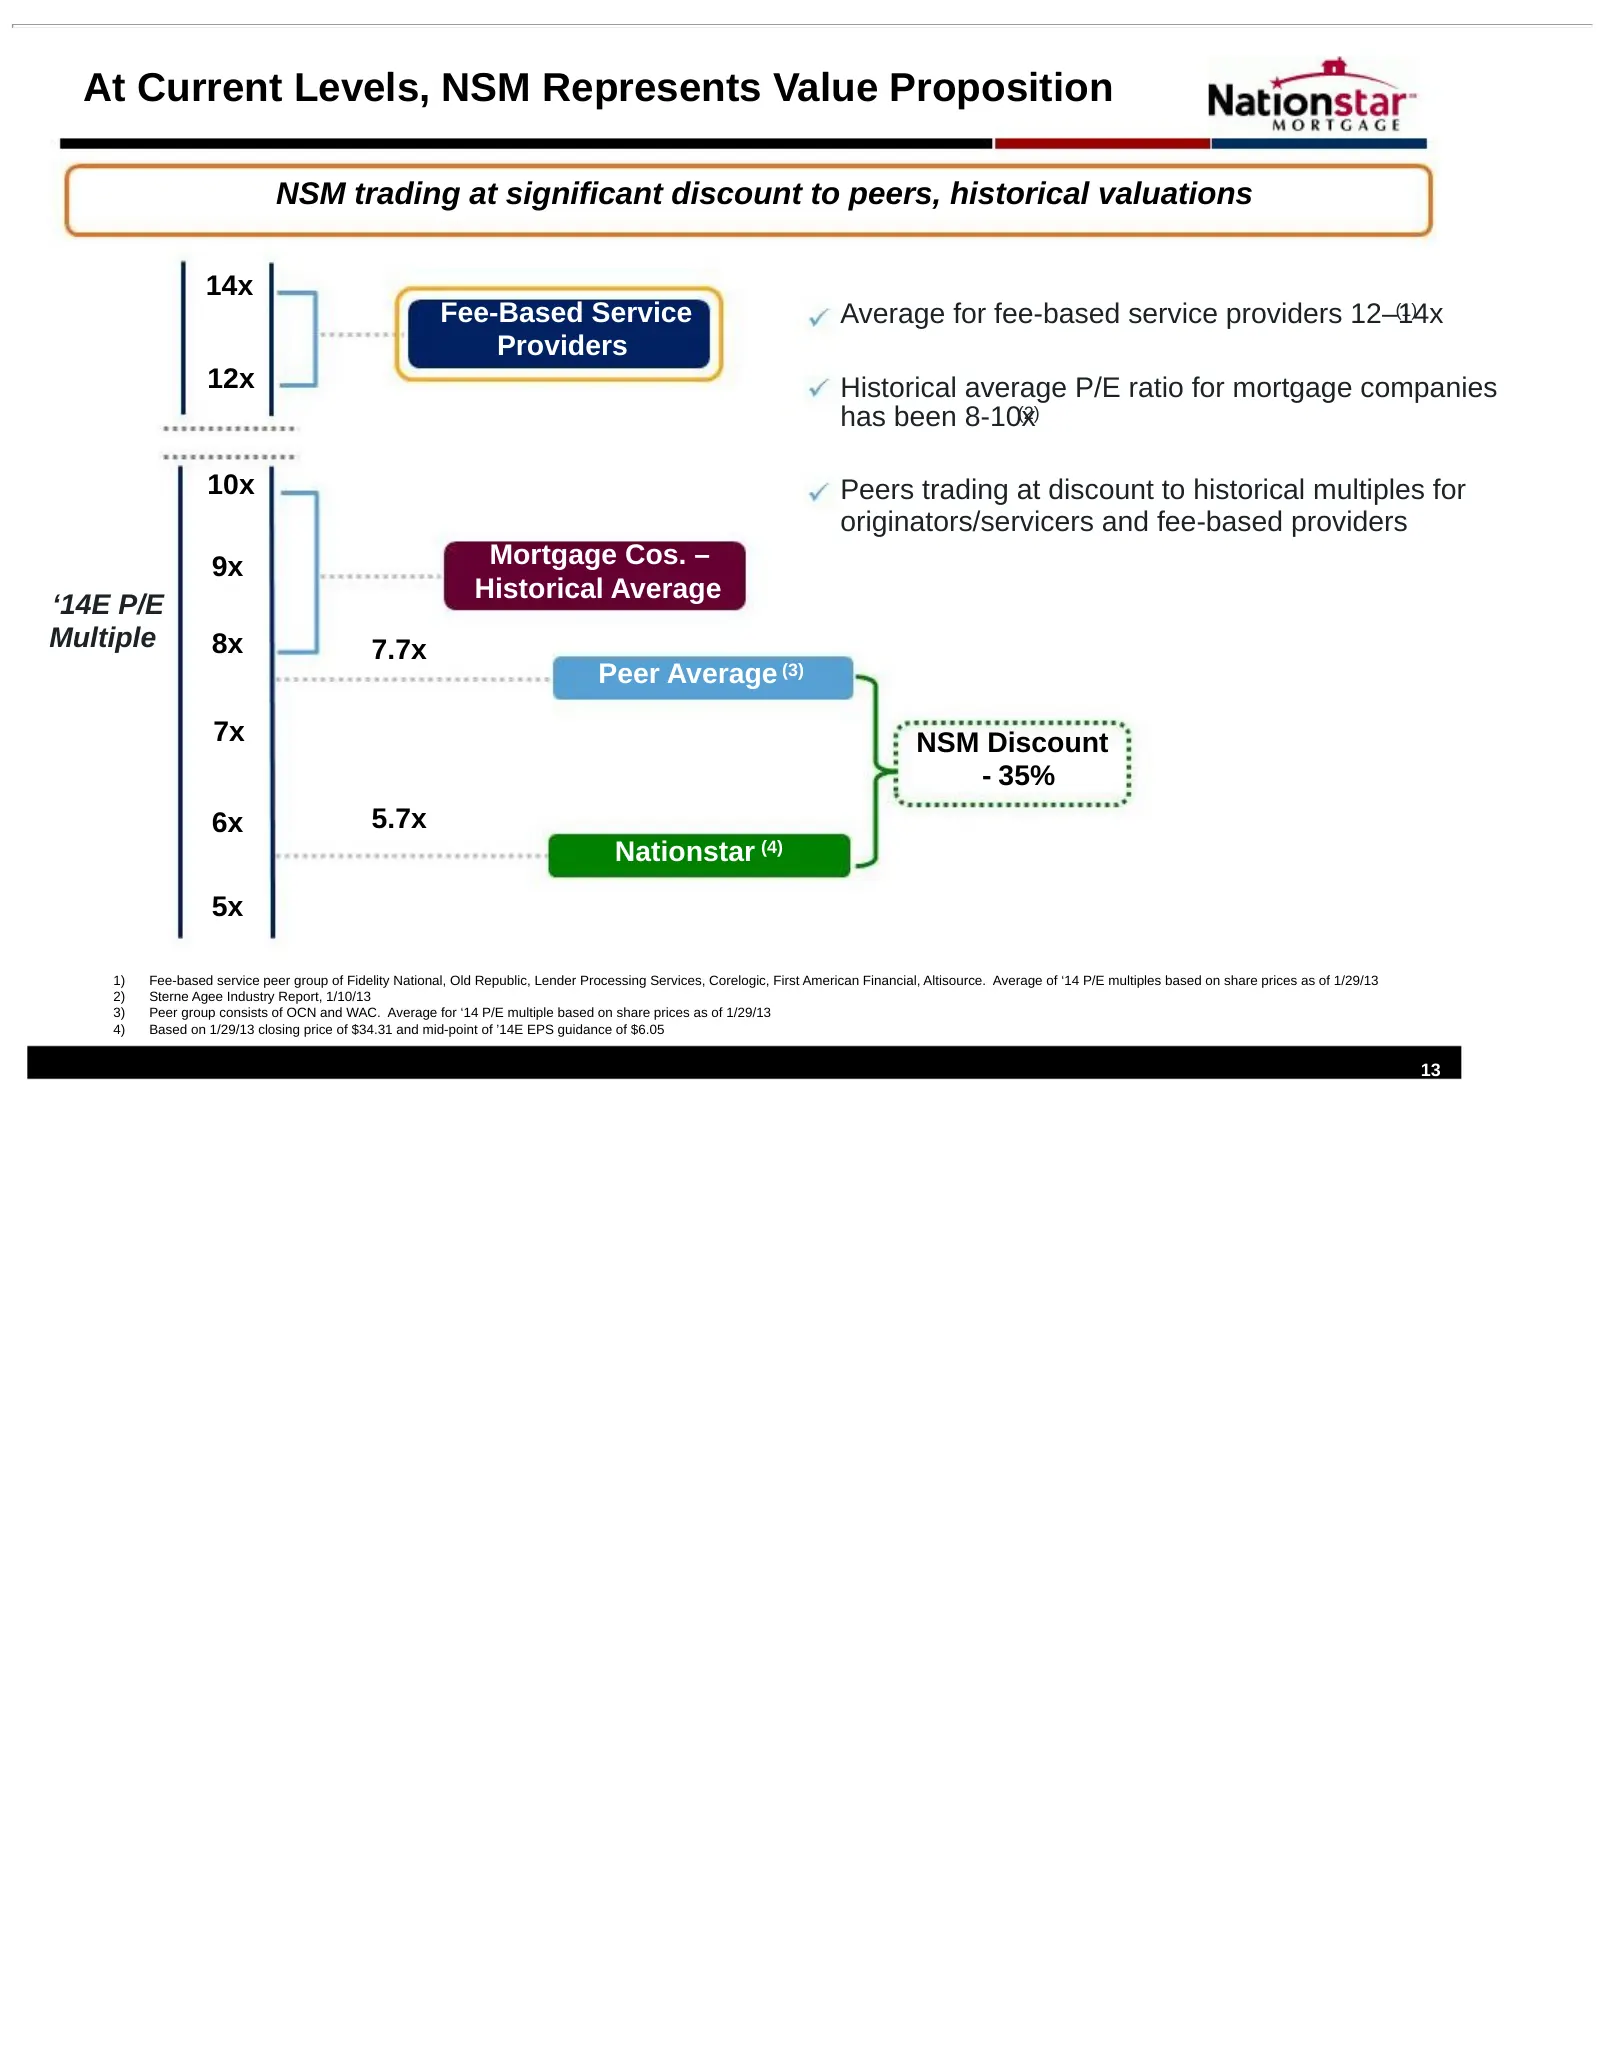
At Current Levels, NSM Represents Value Proposition NSM trading at significant discount to peers, historical valuations 14x Fee-Based Service Average for fee-based service providers 12–14x (1) Providers 12x Historical average P/E ratio for mortgage companies has been 8-10x (2) 10x Peers trading at d
Slide 15: Focused on Profitable Growth
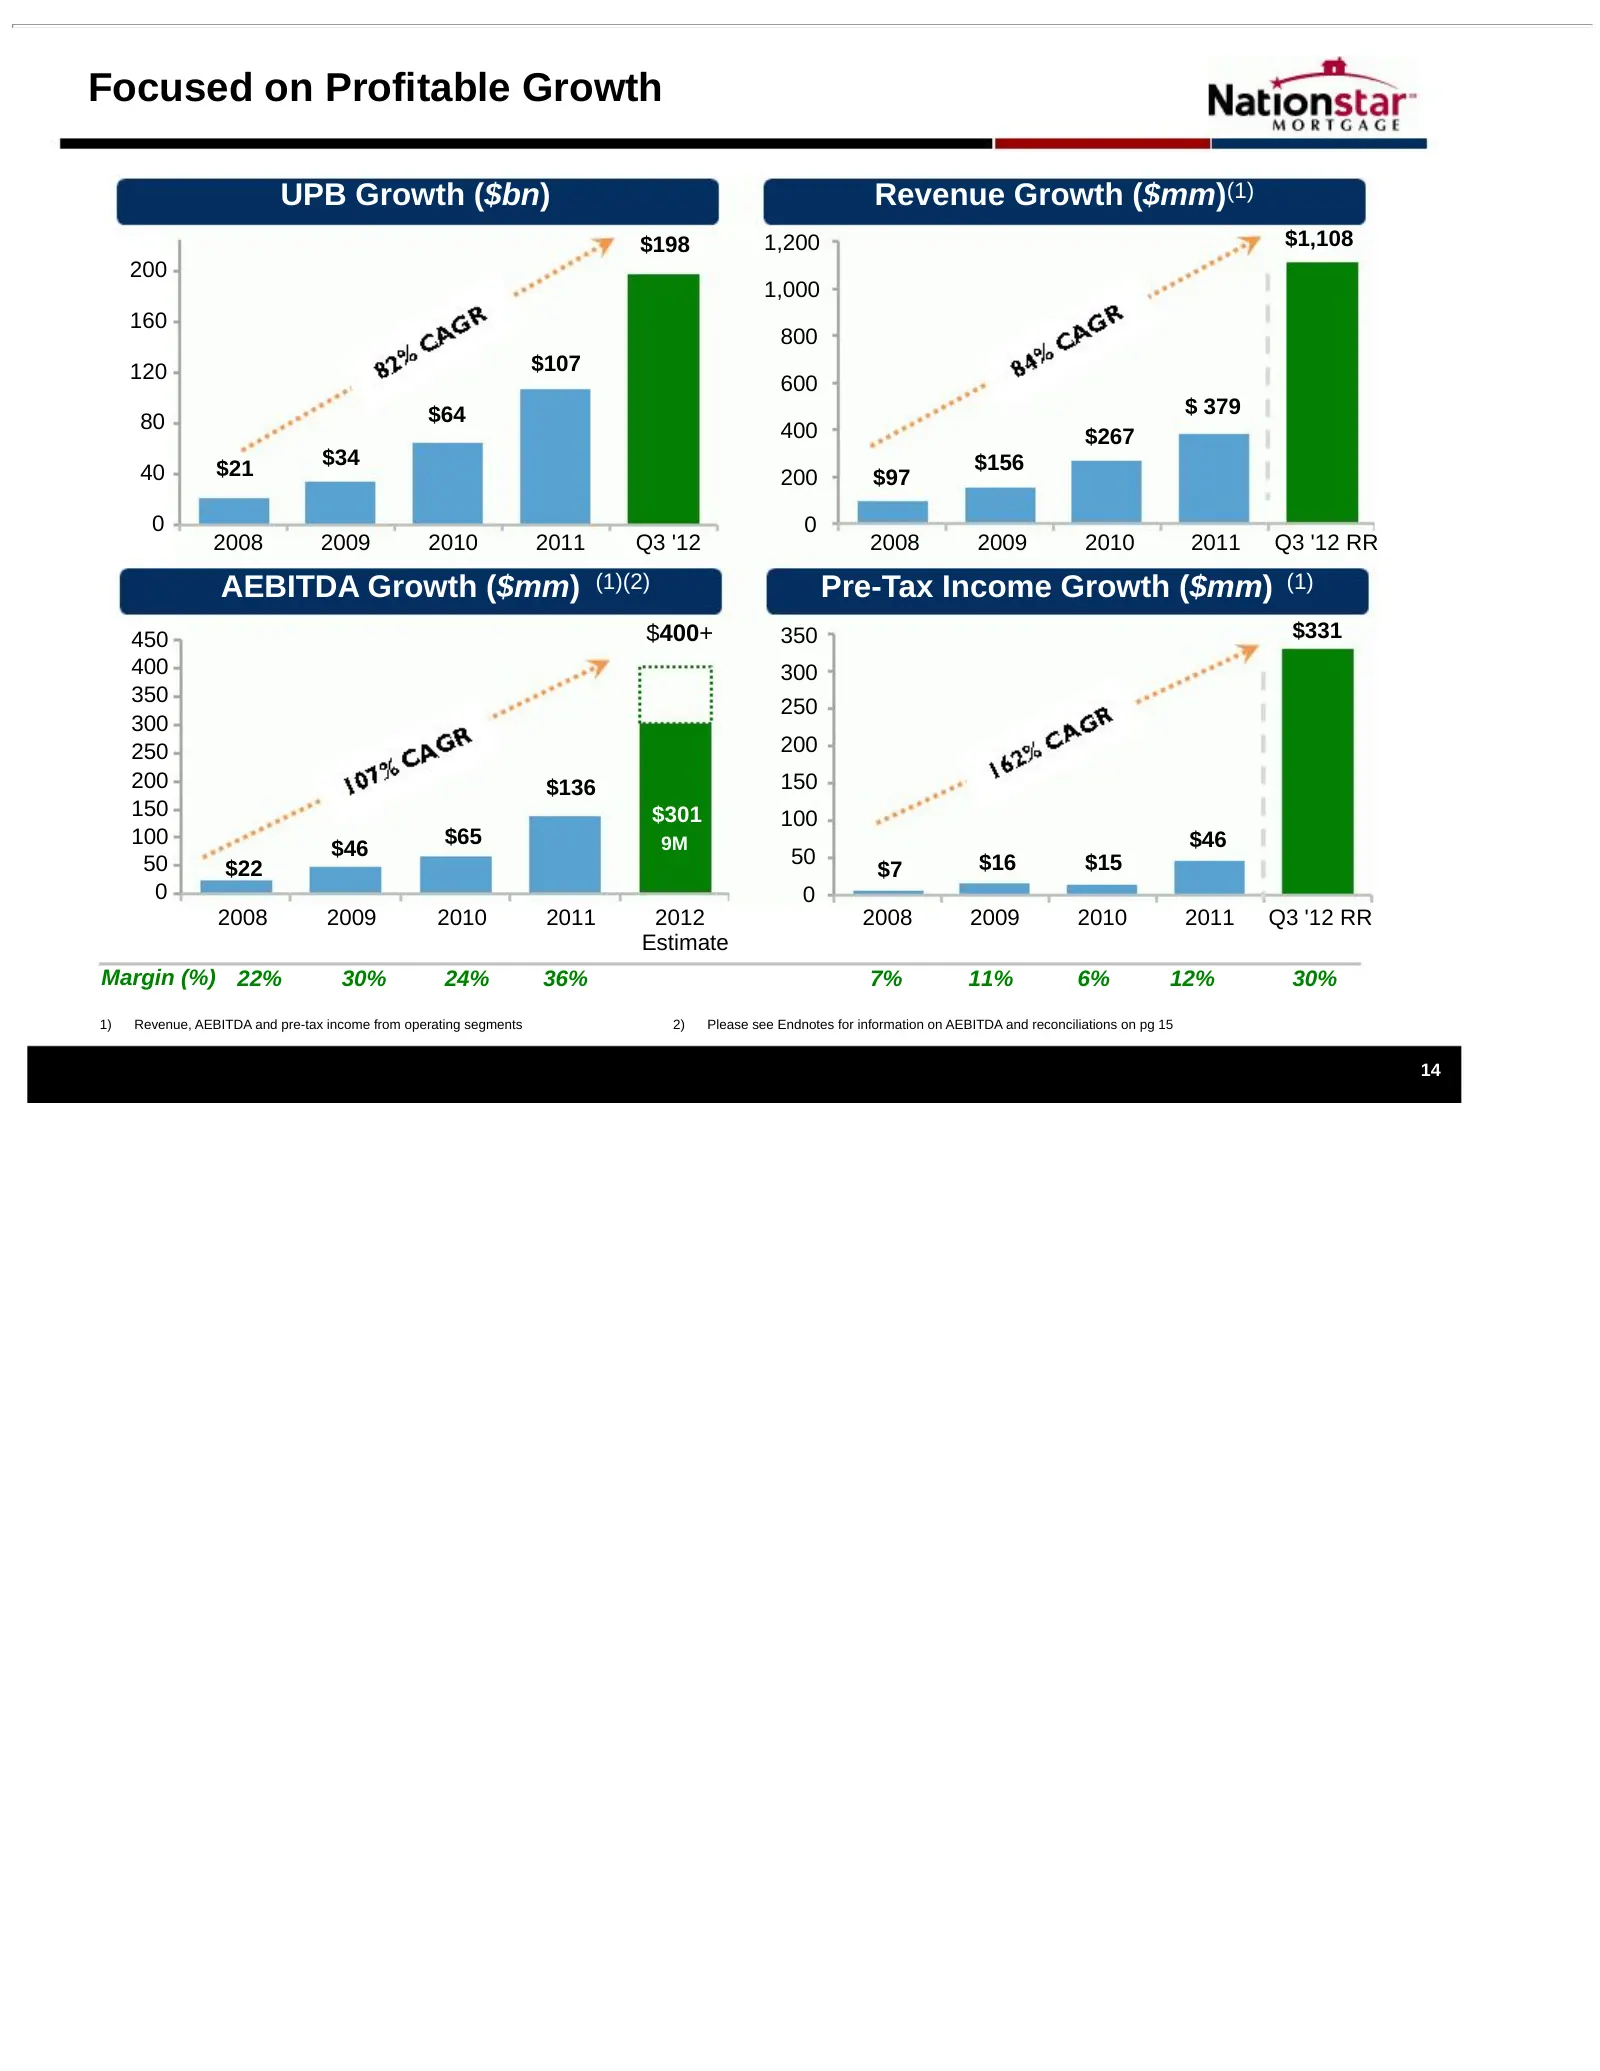
Focused on Profitable Growth UPB Growth ($bn) Revenue Growth ($mm)(1) $198 1,200 $1,108 200 1,000 160 800 120 $107 600 $64 $ 379 80 400 $267 $21 $34 $156 40 200 $97 0 0 2008 2009 2010 2011 Q3 '12 2008 2009 2010 2011 Q3 '12 RR AEBITDA Growth ($mm) (1)(2) Pre-Tax Income Growth ($mm) (1) 450 $400+ 350
Slide 16: AEBITDA Reconciliation
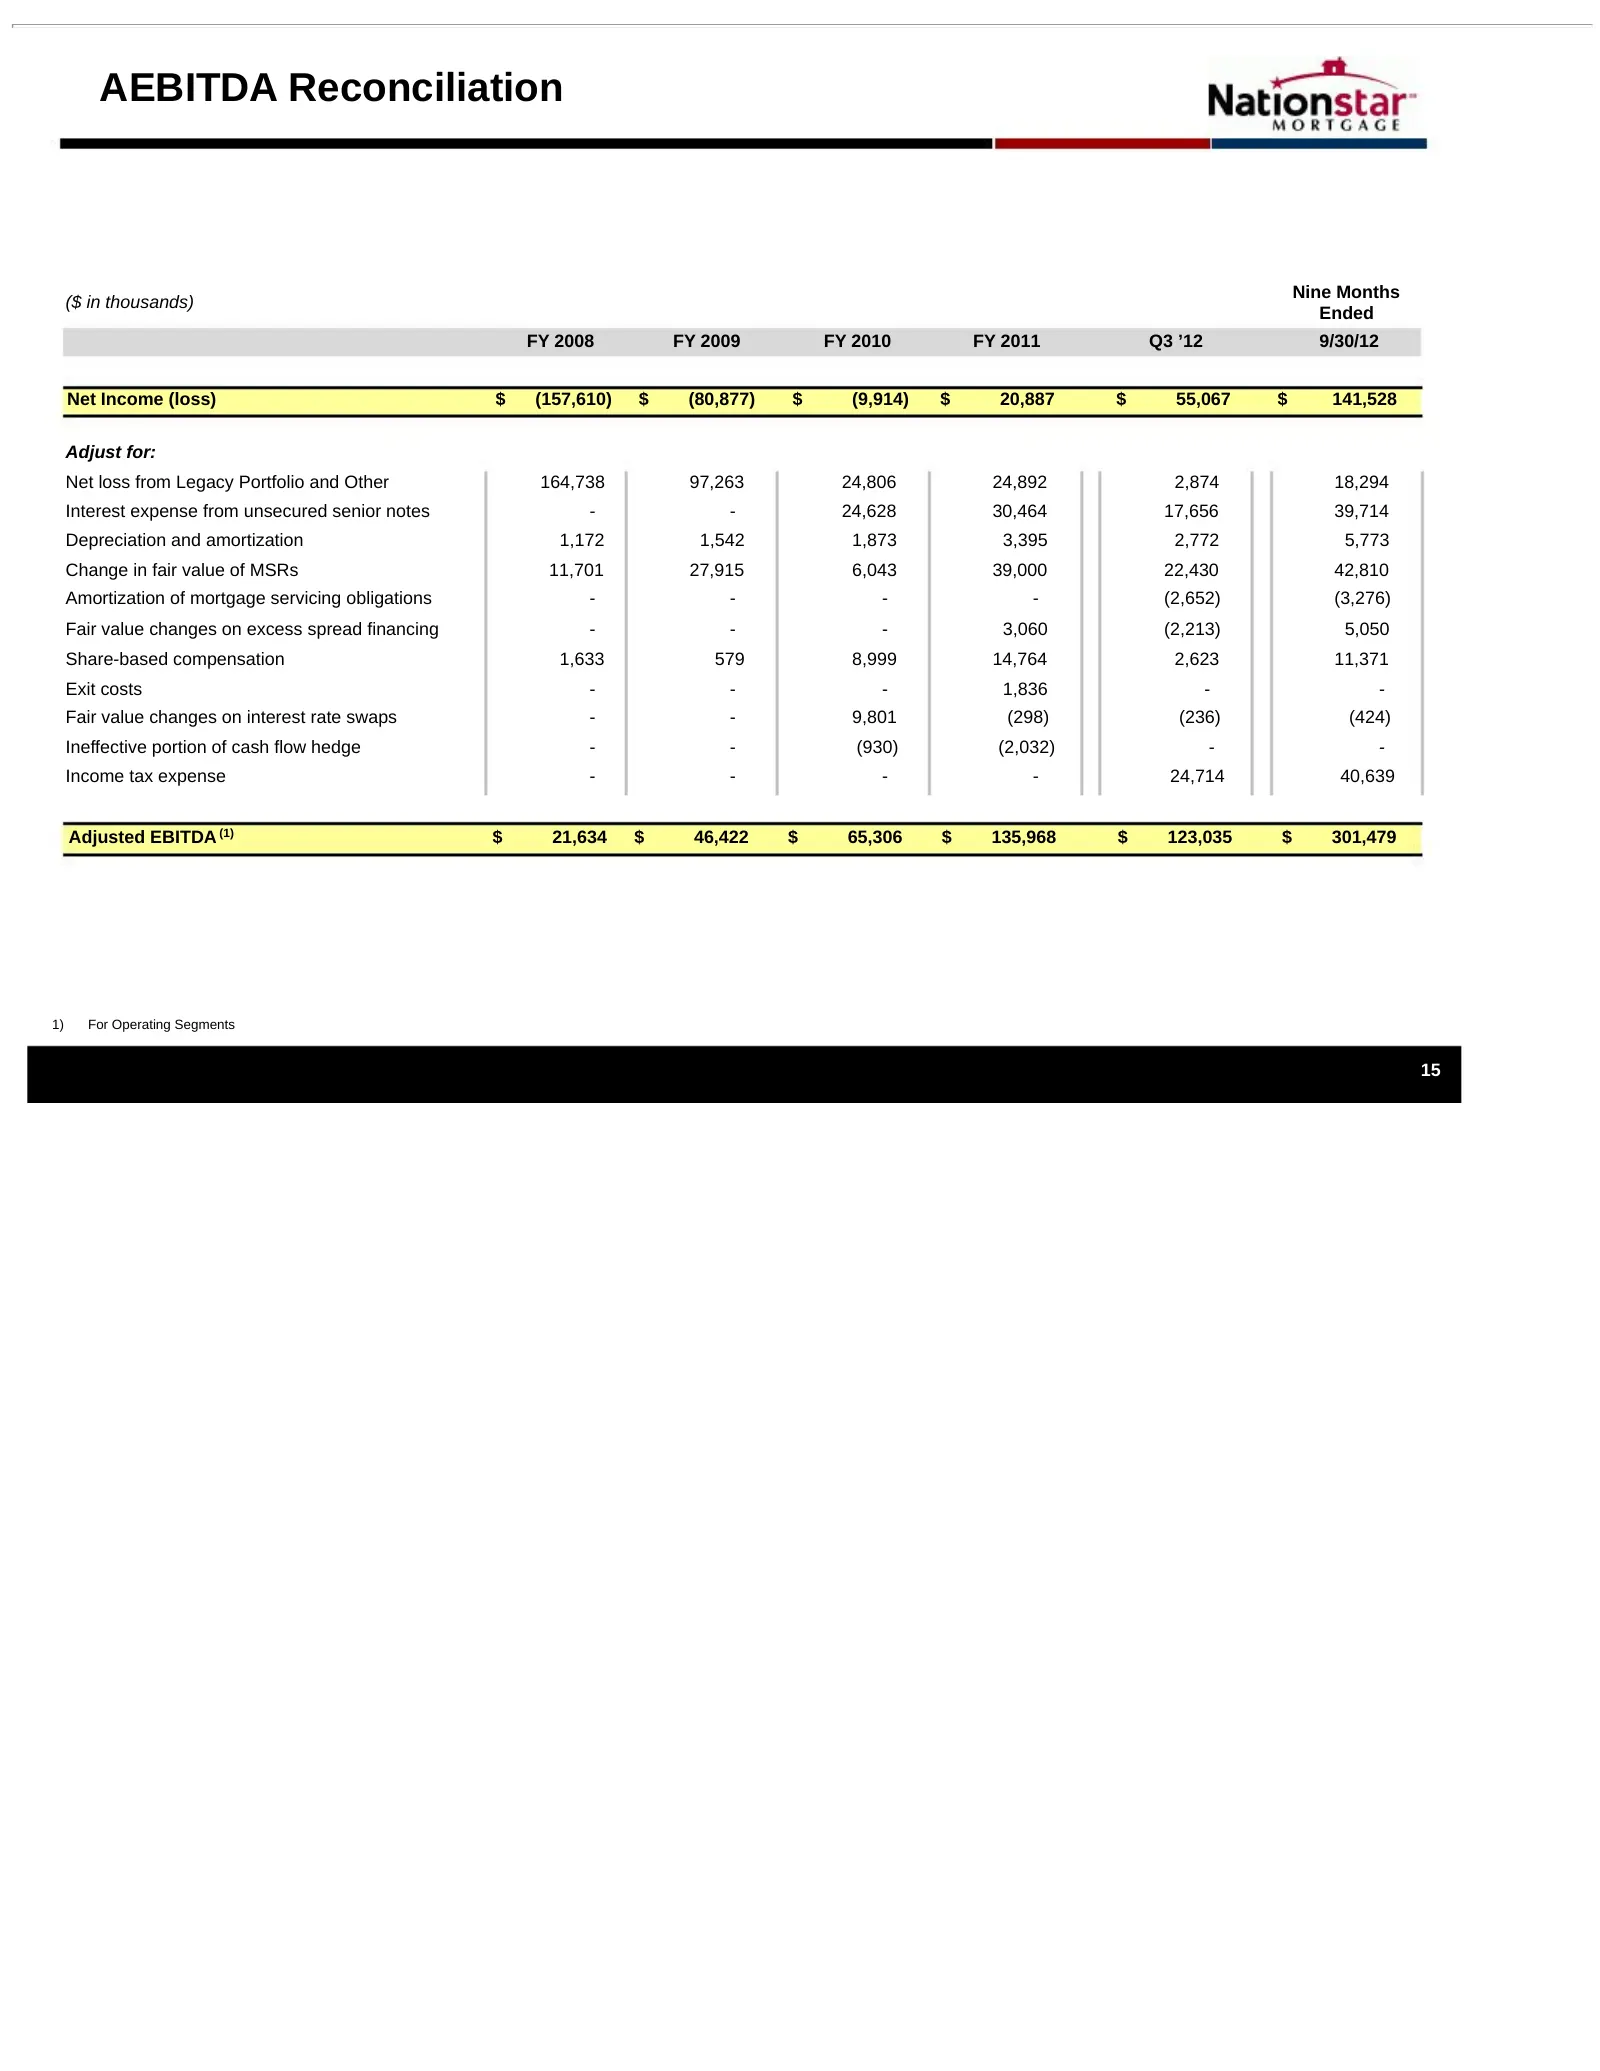
AEBITDA Reconciliation Nine Months ($ in thousands) Ended FY 2008 FY 2009 FY 2010 FY 2011 Q3 ’12 9/30/12 Net Income (loss) $ (157,610) $ (80,877) $ (9,914) $ 20,887 $ 55,067 $ 141,528 Adjust for: Net loss from Legacy Portfolio and Other 164,738 97,263 24,806 24,892 2,874 18,294 Interest expense from
Slide 17: Endnotes
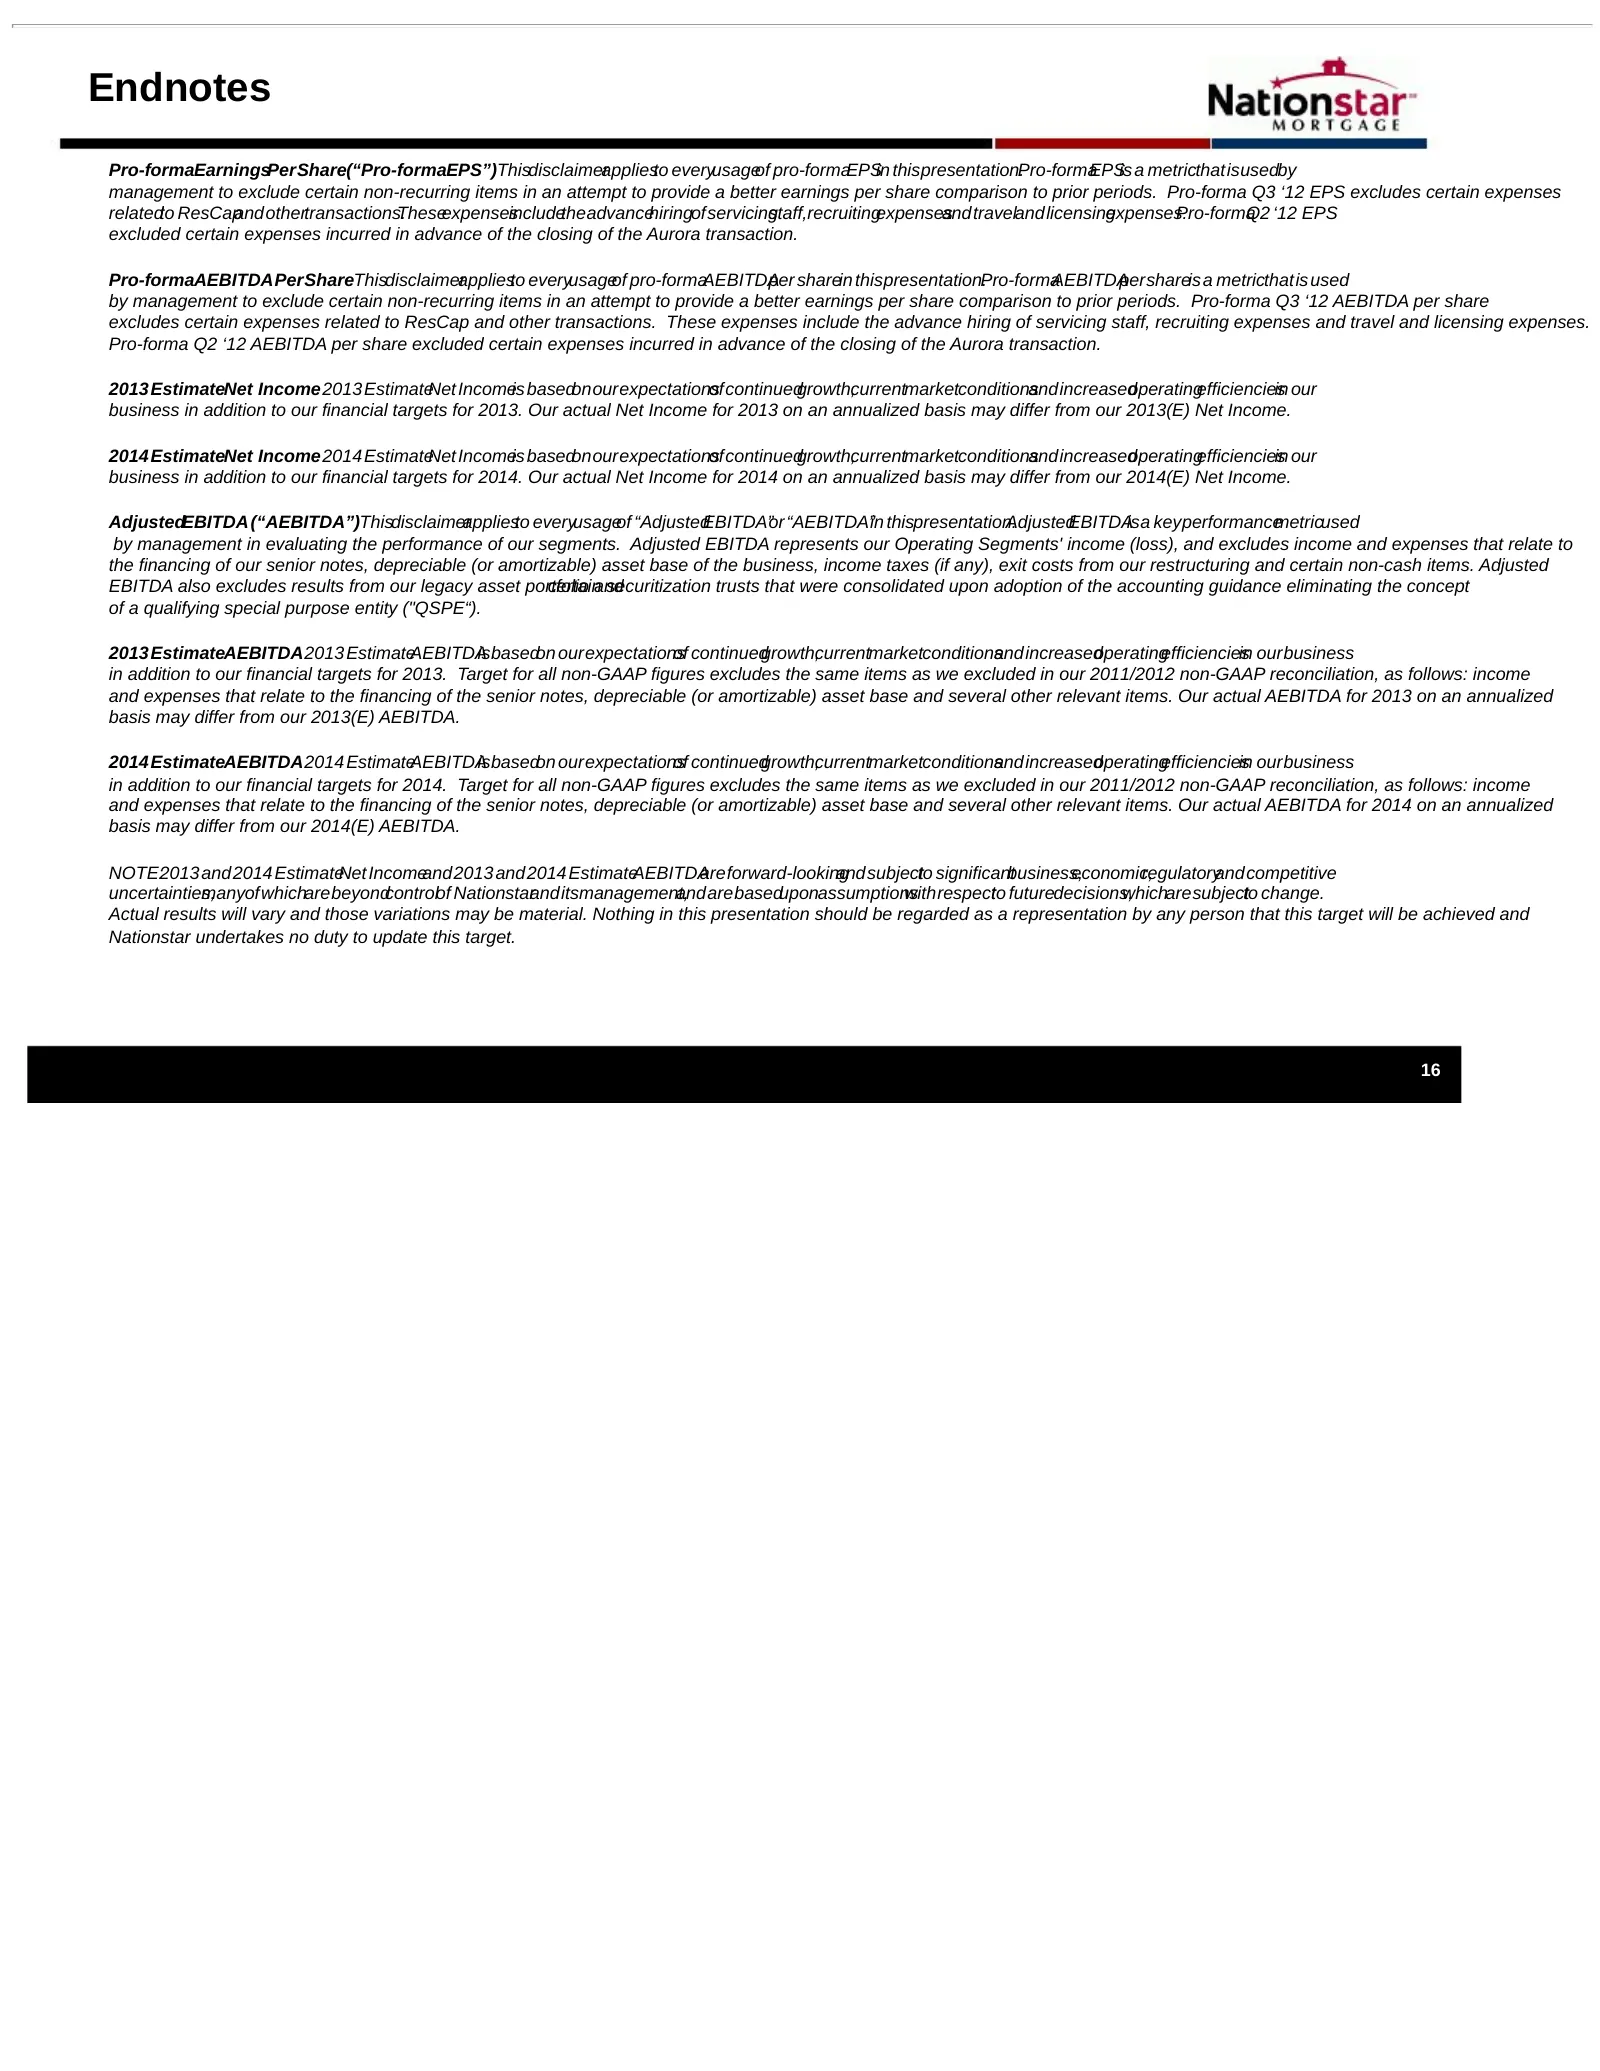
Endnotes Pro-formaEarningsPerShare(“Pro-formaEPS”)Thisdisclaimerappliesto everyusageof pro-formaEPSin thispresentation.Pro-formaEPSis a metricthatisusedby management to exclude certain non-recurring items in an attempt to provide a better earnings per share comparison to prior periods. Pro-forma Q3
Source: SEC EDGAR · 8-K filed Jan 31, 2013
More decks from Mr. Cooper Group Inc
 Q2 2025 Earnings Presentation25 slides · Jul 23, 2025
 Q1 2025 Earnings Presentation24 slides · Apr 23, 2025
 Merger or Acquisition (March 2025)23 slides · Mar 31, 2025
 Q4 2024 Earnings Presentation29 slides · Feb 12, 2025
 Q3 2024 Earnings Presentation29 slides · Oct 23, 2024
 Q2 2024 Earnings Presentation26 slides · Jul 25, 2024