Chaparral Energy — JPMorgan High Yield Conference January 2007
35 slides from Chaparral Energy's conference presentation, Jan 19, 2007
Slide 1: JPMorgan High Yield Conference
Exhibit 99.1 JPMorgan High Yield Conference January 2007
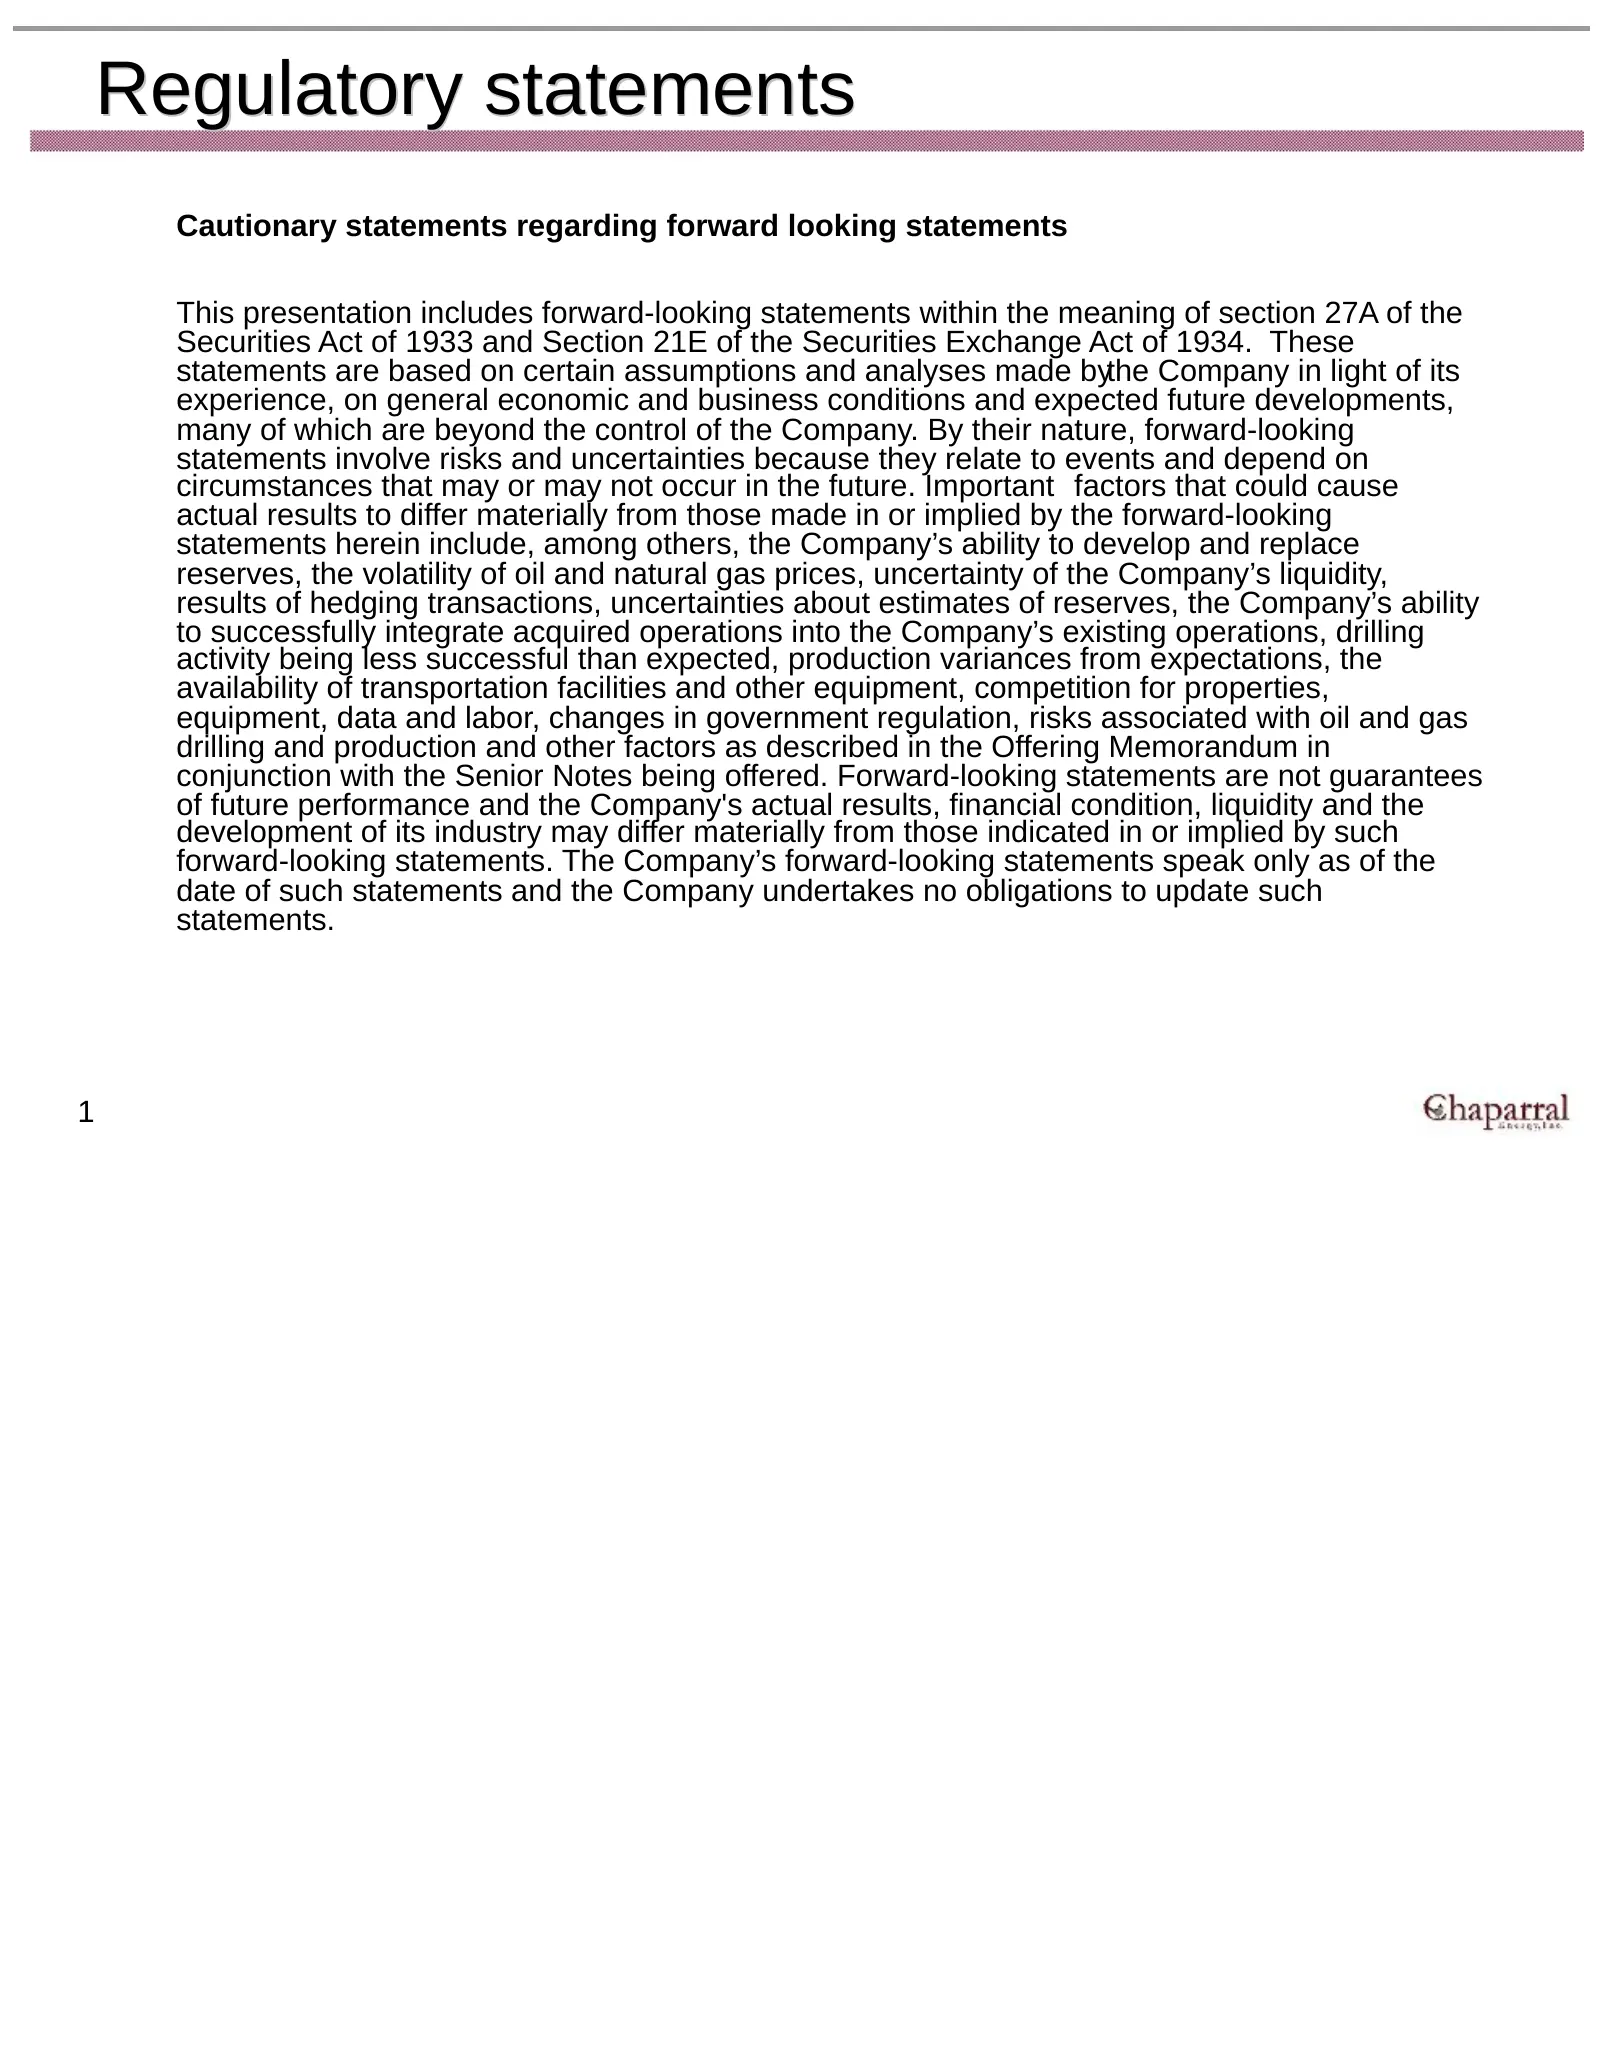
Slide 2: Regulatory statements
Regulatory statements Cautionary statements regarding forward looking statements This presentation includes forward-looking statements within the meaning of section 27A of the Securities Act of 1933 and Section 21E of the Securities Exchange Act of 1934. These statements are based on certain assumpt
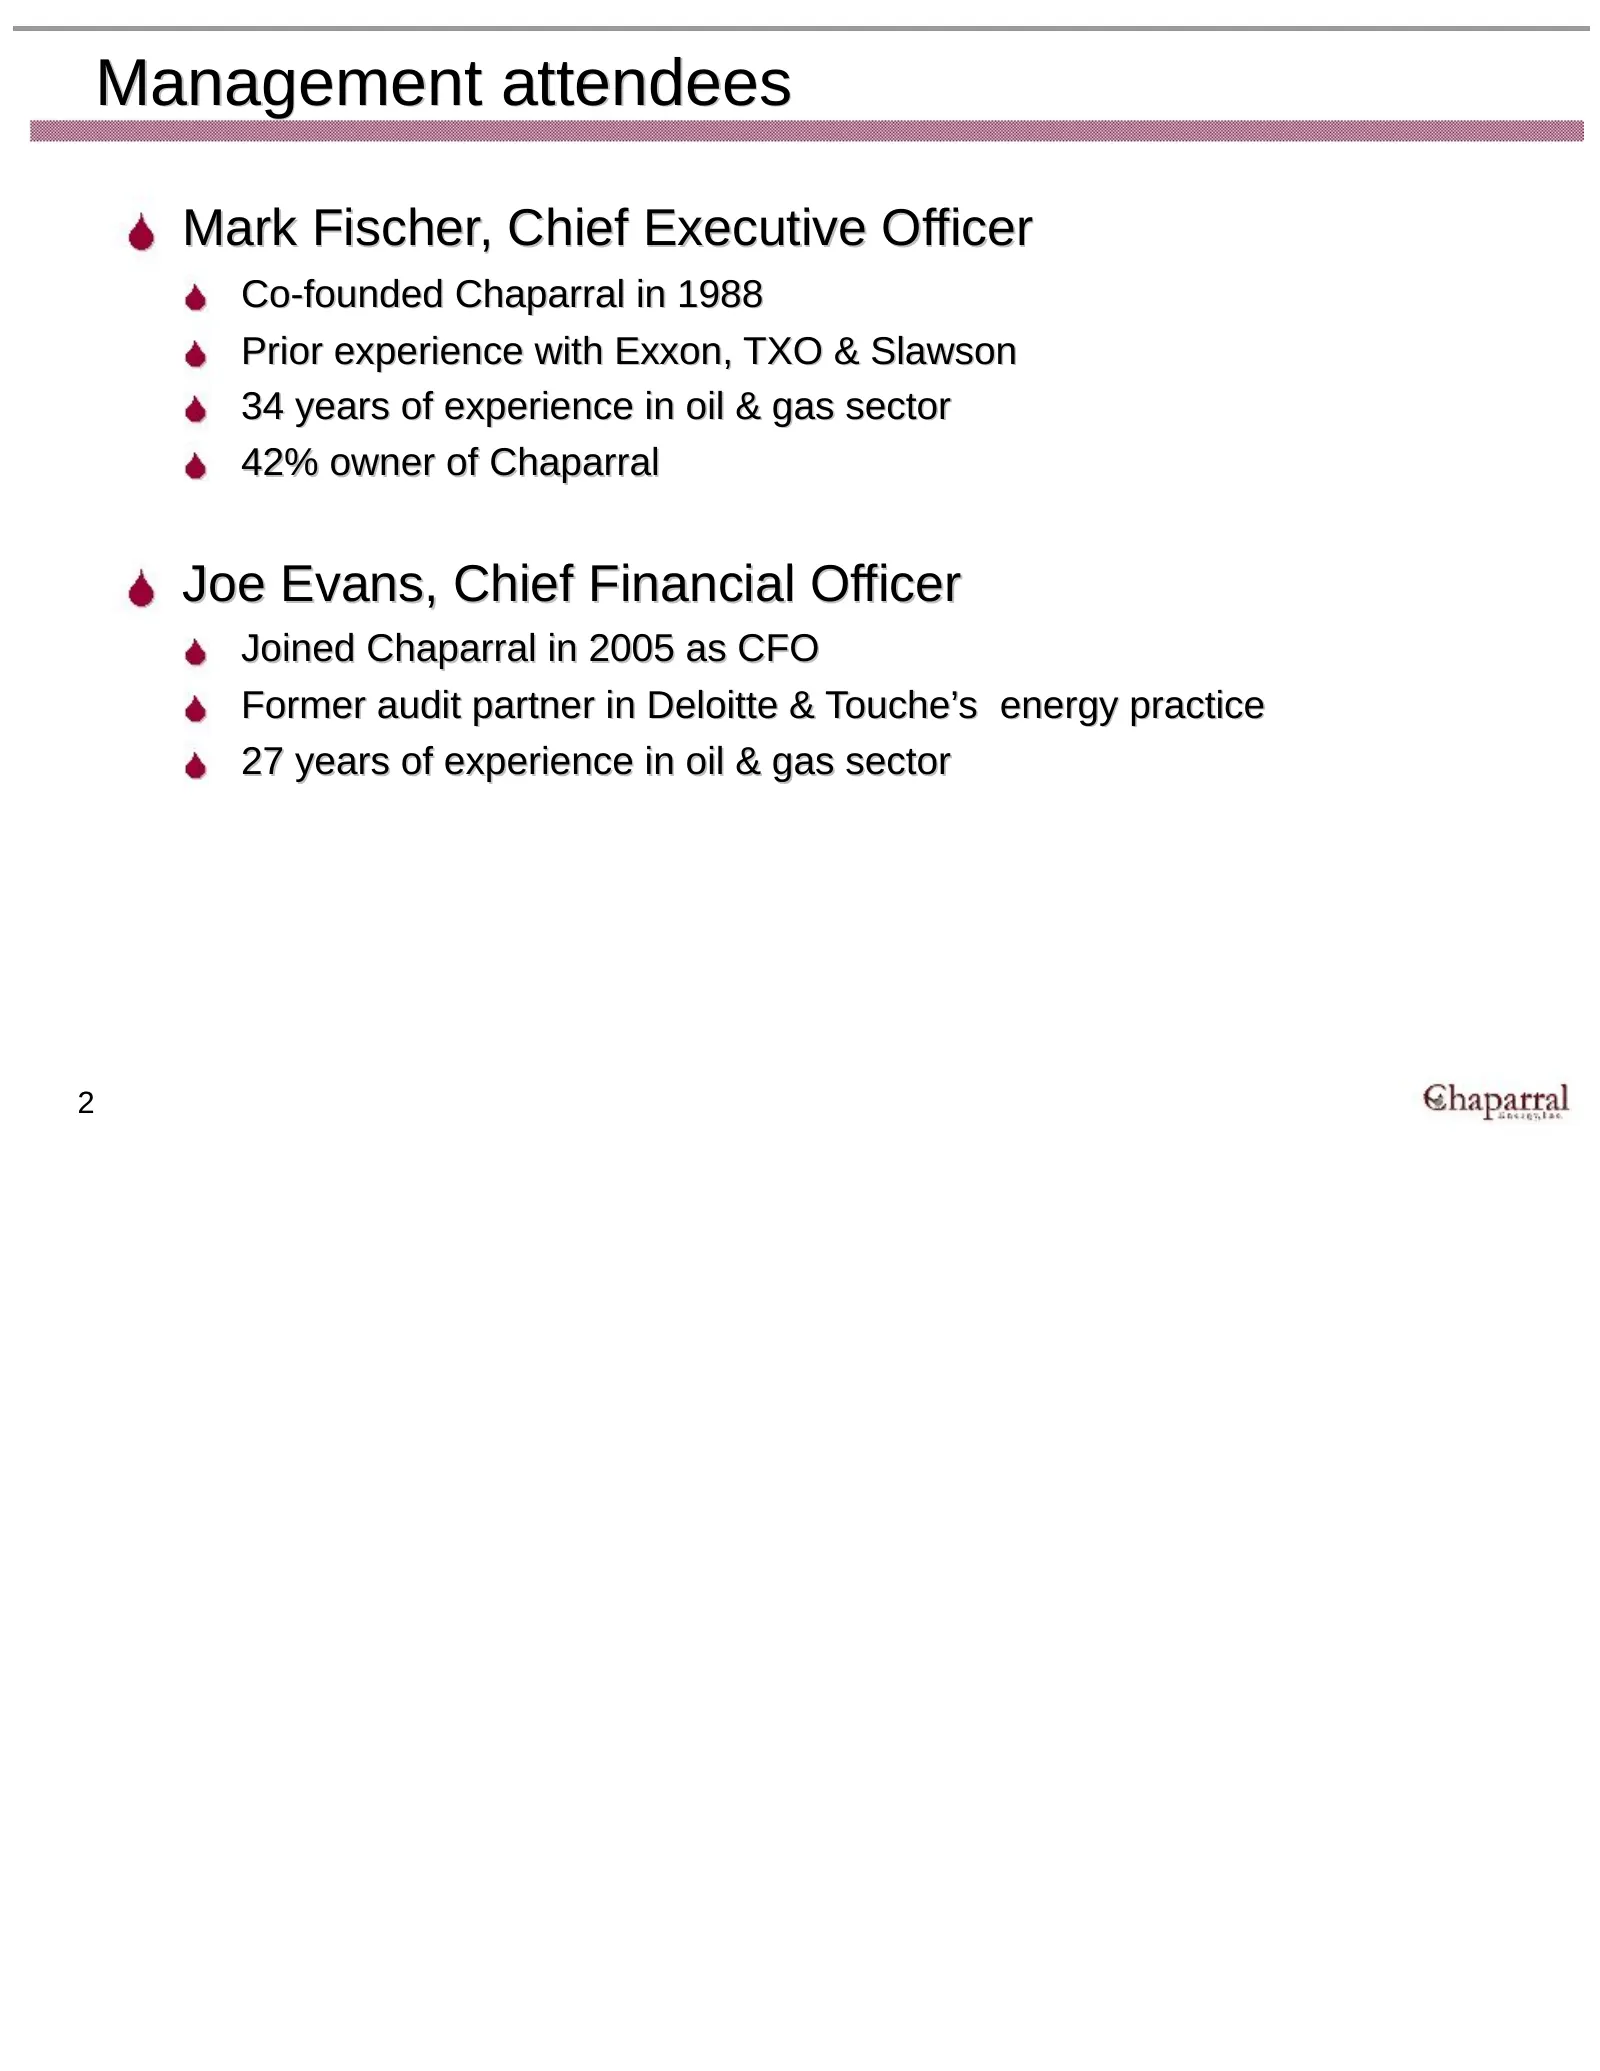
Slide 3: Management attendees
Management attendees Mark Fischer, Chief Executive Officer Co-founded Chaparral in 1988 Prior experience with Exxon, TXO & Slawson 34 years of experience in oil & gas sector 42% owner of Chaparral Joe Evans, Chief Financial Officer Joined Chaparral in 2005 as CFO Former audit partner in Deloitte & T

Slide 4: Agenda
Agenda Company overview Strategy and project overview Financials 3
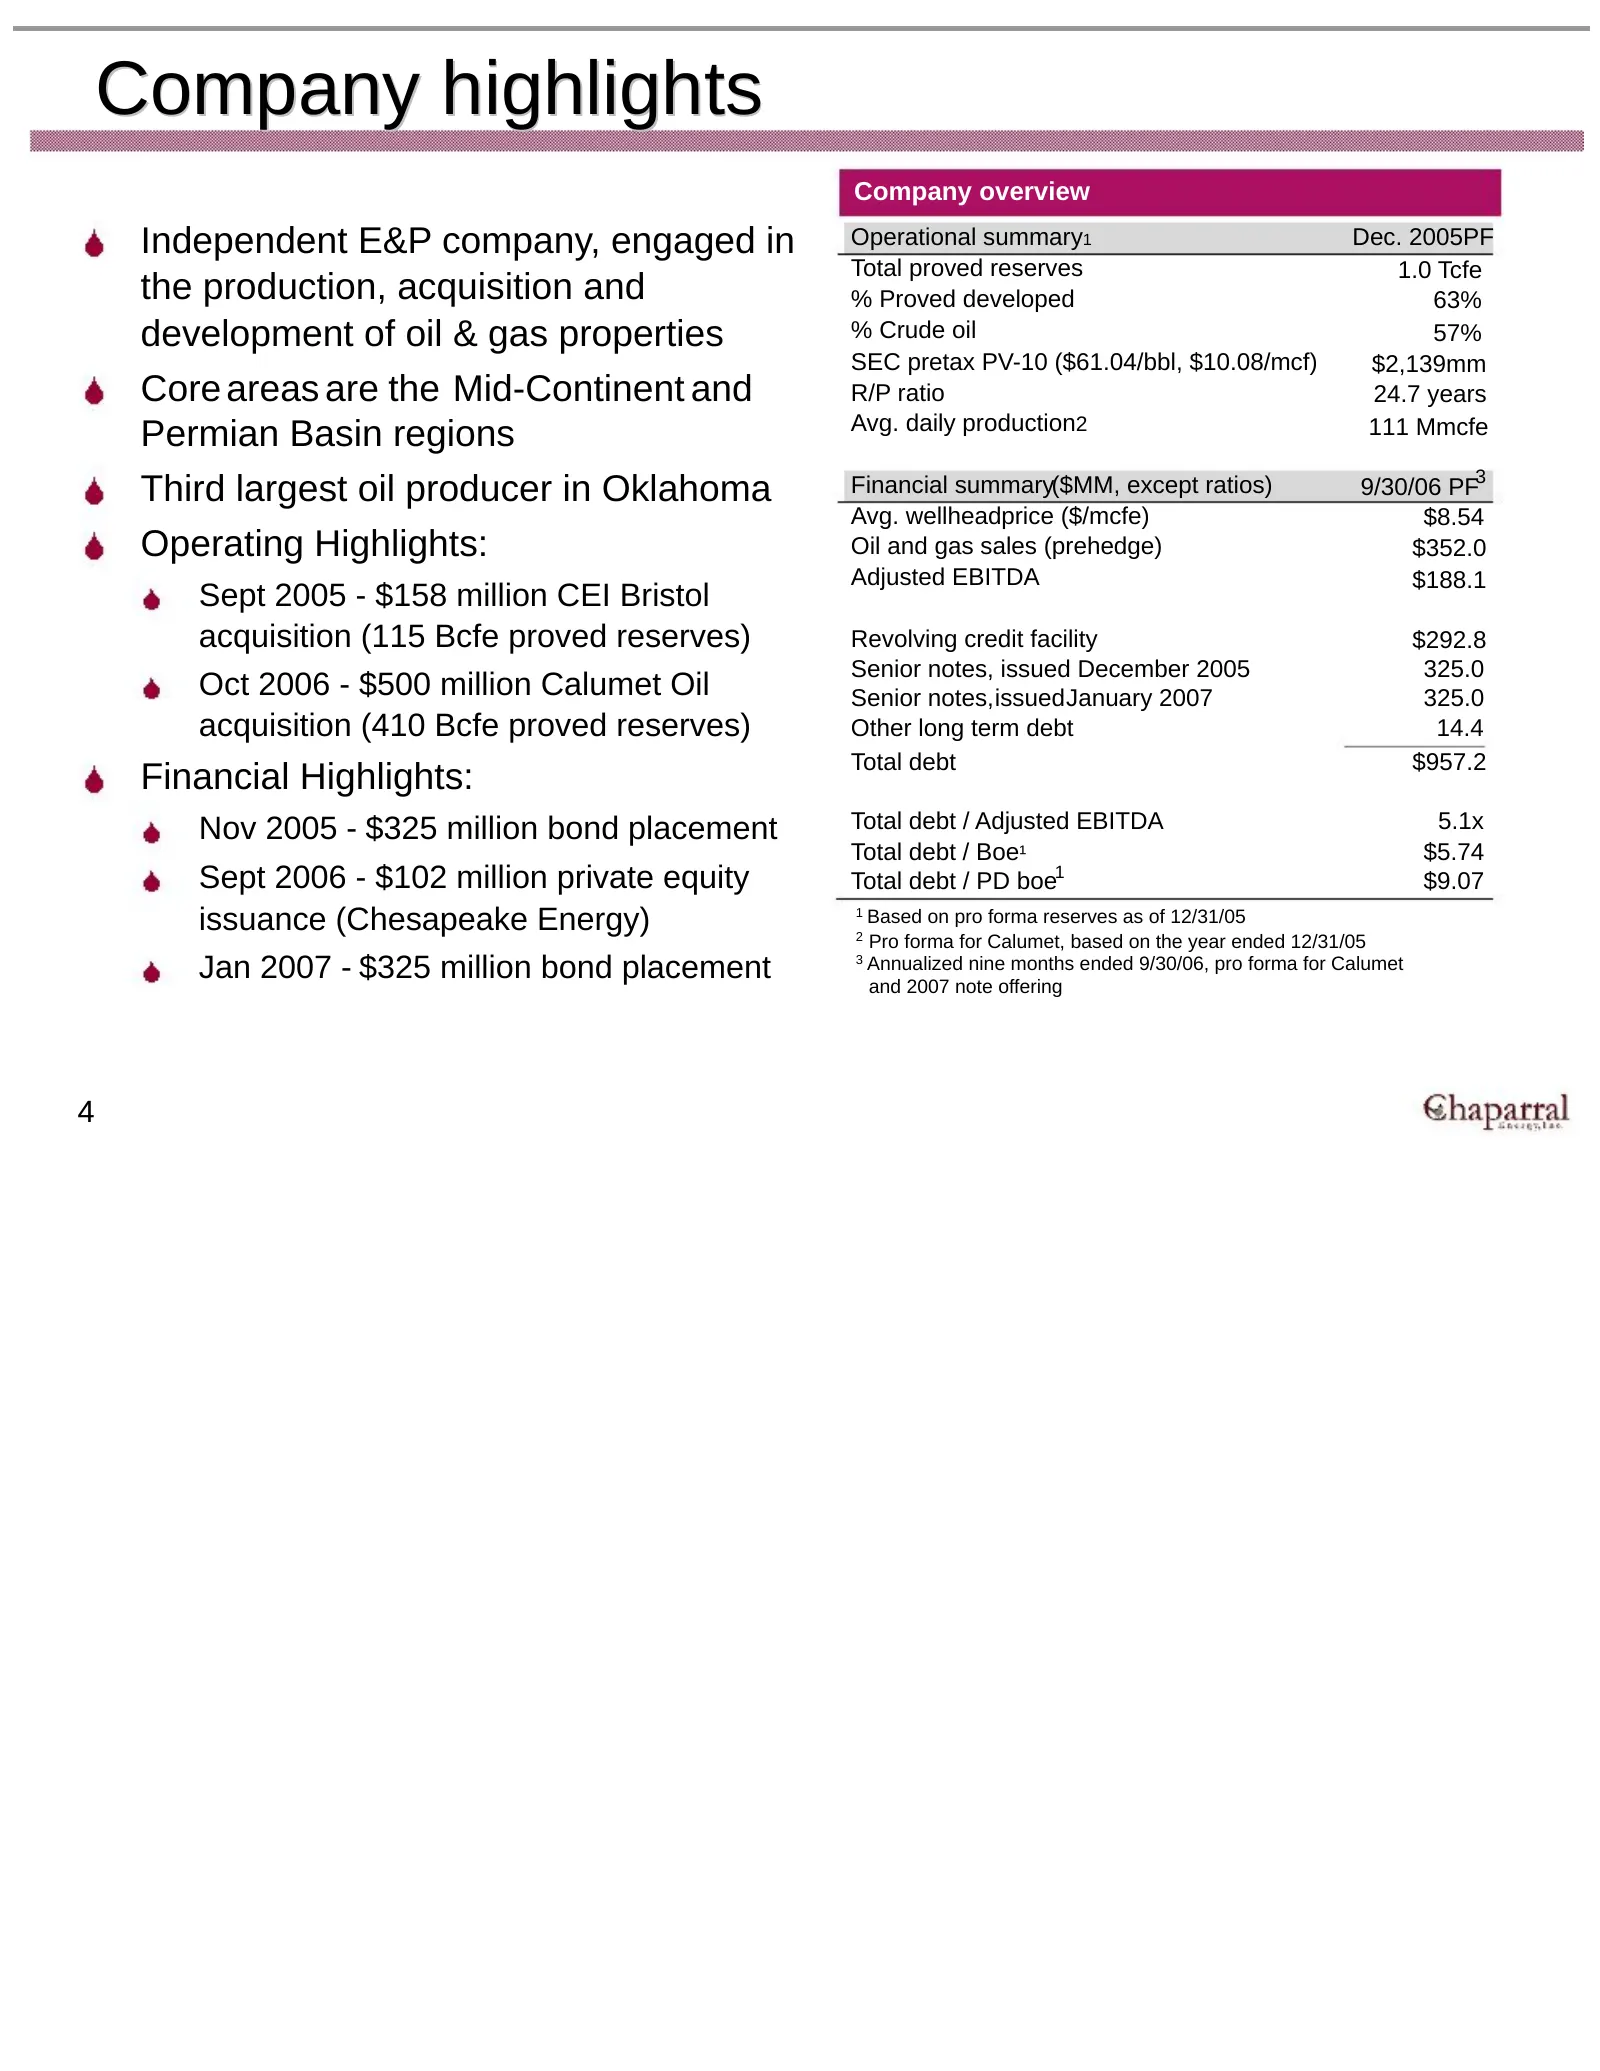
Slide 5: Company highlights
Company highlights Company overview Independent E&P company, engaged in Operational summary1 Dec. 2005PF Total proved reserves 1.0 Tcfe the production, acquisition and % Proved developed 63% development of oil & gas properties % Crude oil 57% SEC pretax PV-10 ($61.04/bbl, $10.08/mcf) $2,139mm Core a
Slide 6: Operational overview
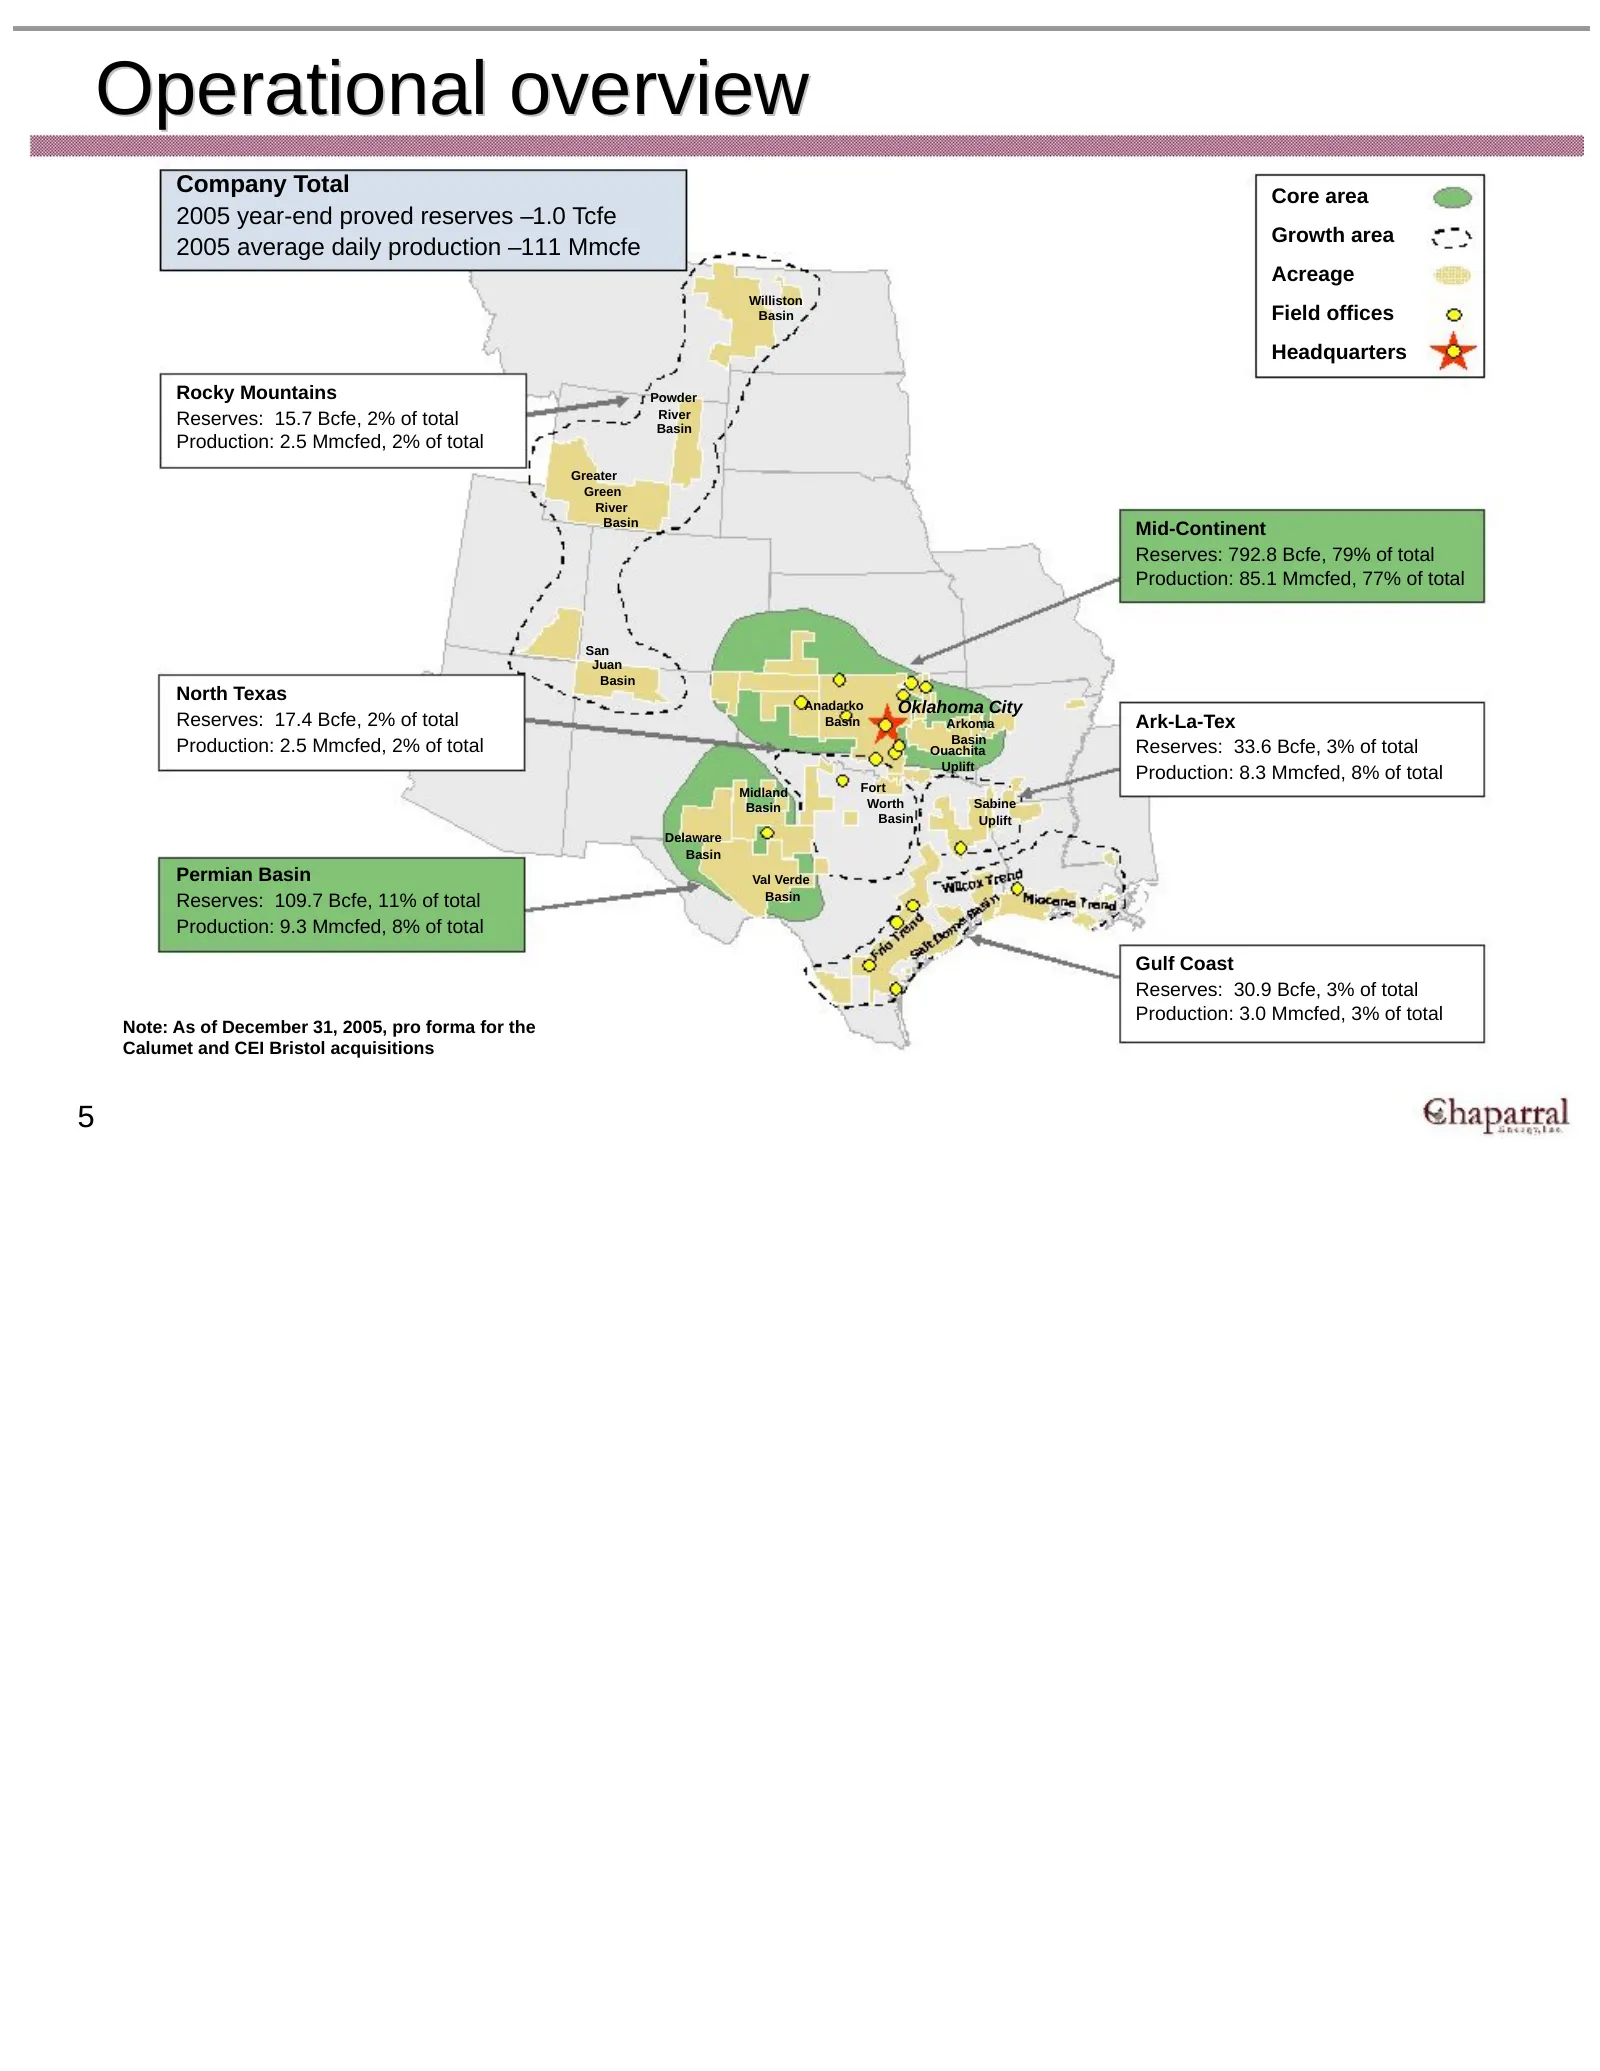
Operational overview Company Total Core area 2005 year-end proved reserves –1.0 Tcfe Growth area 2005 average daily production –111 Mmcfe Acreage Williston Basin Field offices Headquarters Rocky Mountains Powder River Reserves: 15.7 Bcfe, 2% of total Basin Production: 2.5 Mmcfed, 2% of total Greater
Slide 7: Key investment considerations
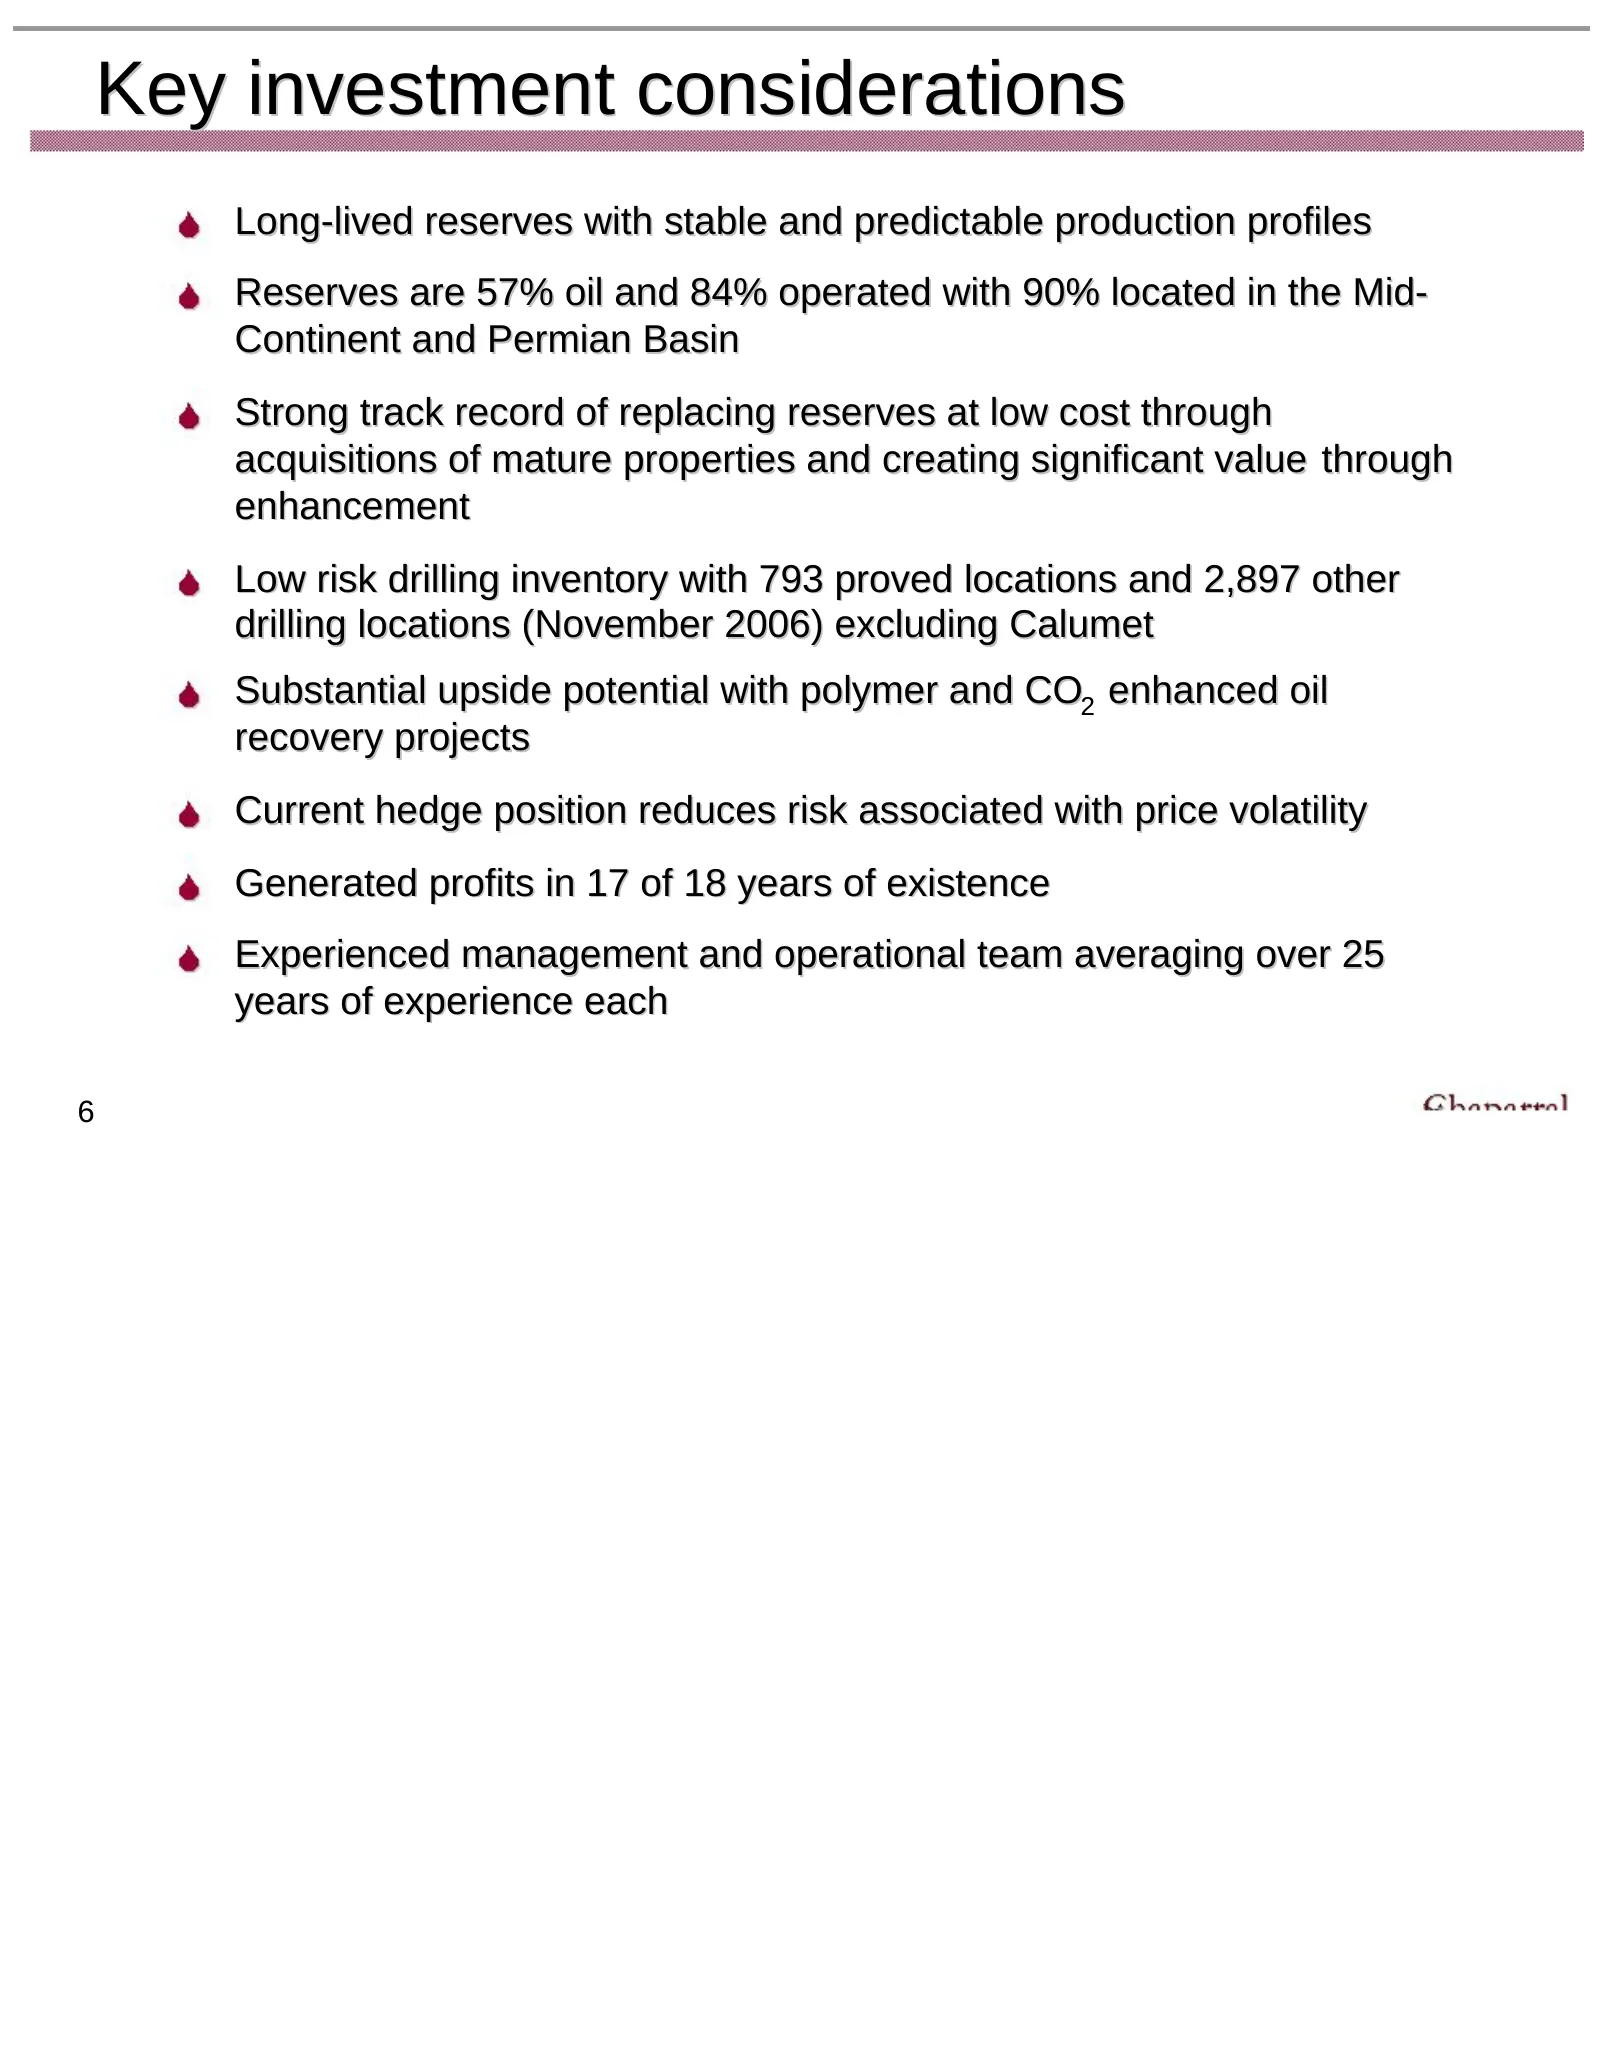
Key investment considerations Long-lived reserves with stable and predictable production profiles Reserves are 57% oil and 84% operated with 90% located in the Mid- Continent and Permian Basin Strong track record of replacing reserves at low cost through acquisitions of mature properties and creatin
Slide 8: Strong record of reserve and production growth
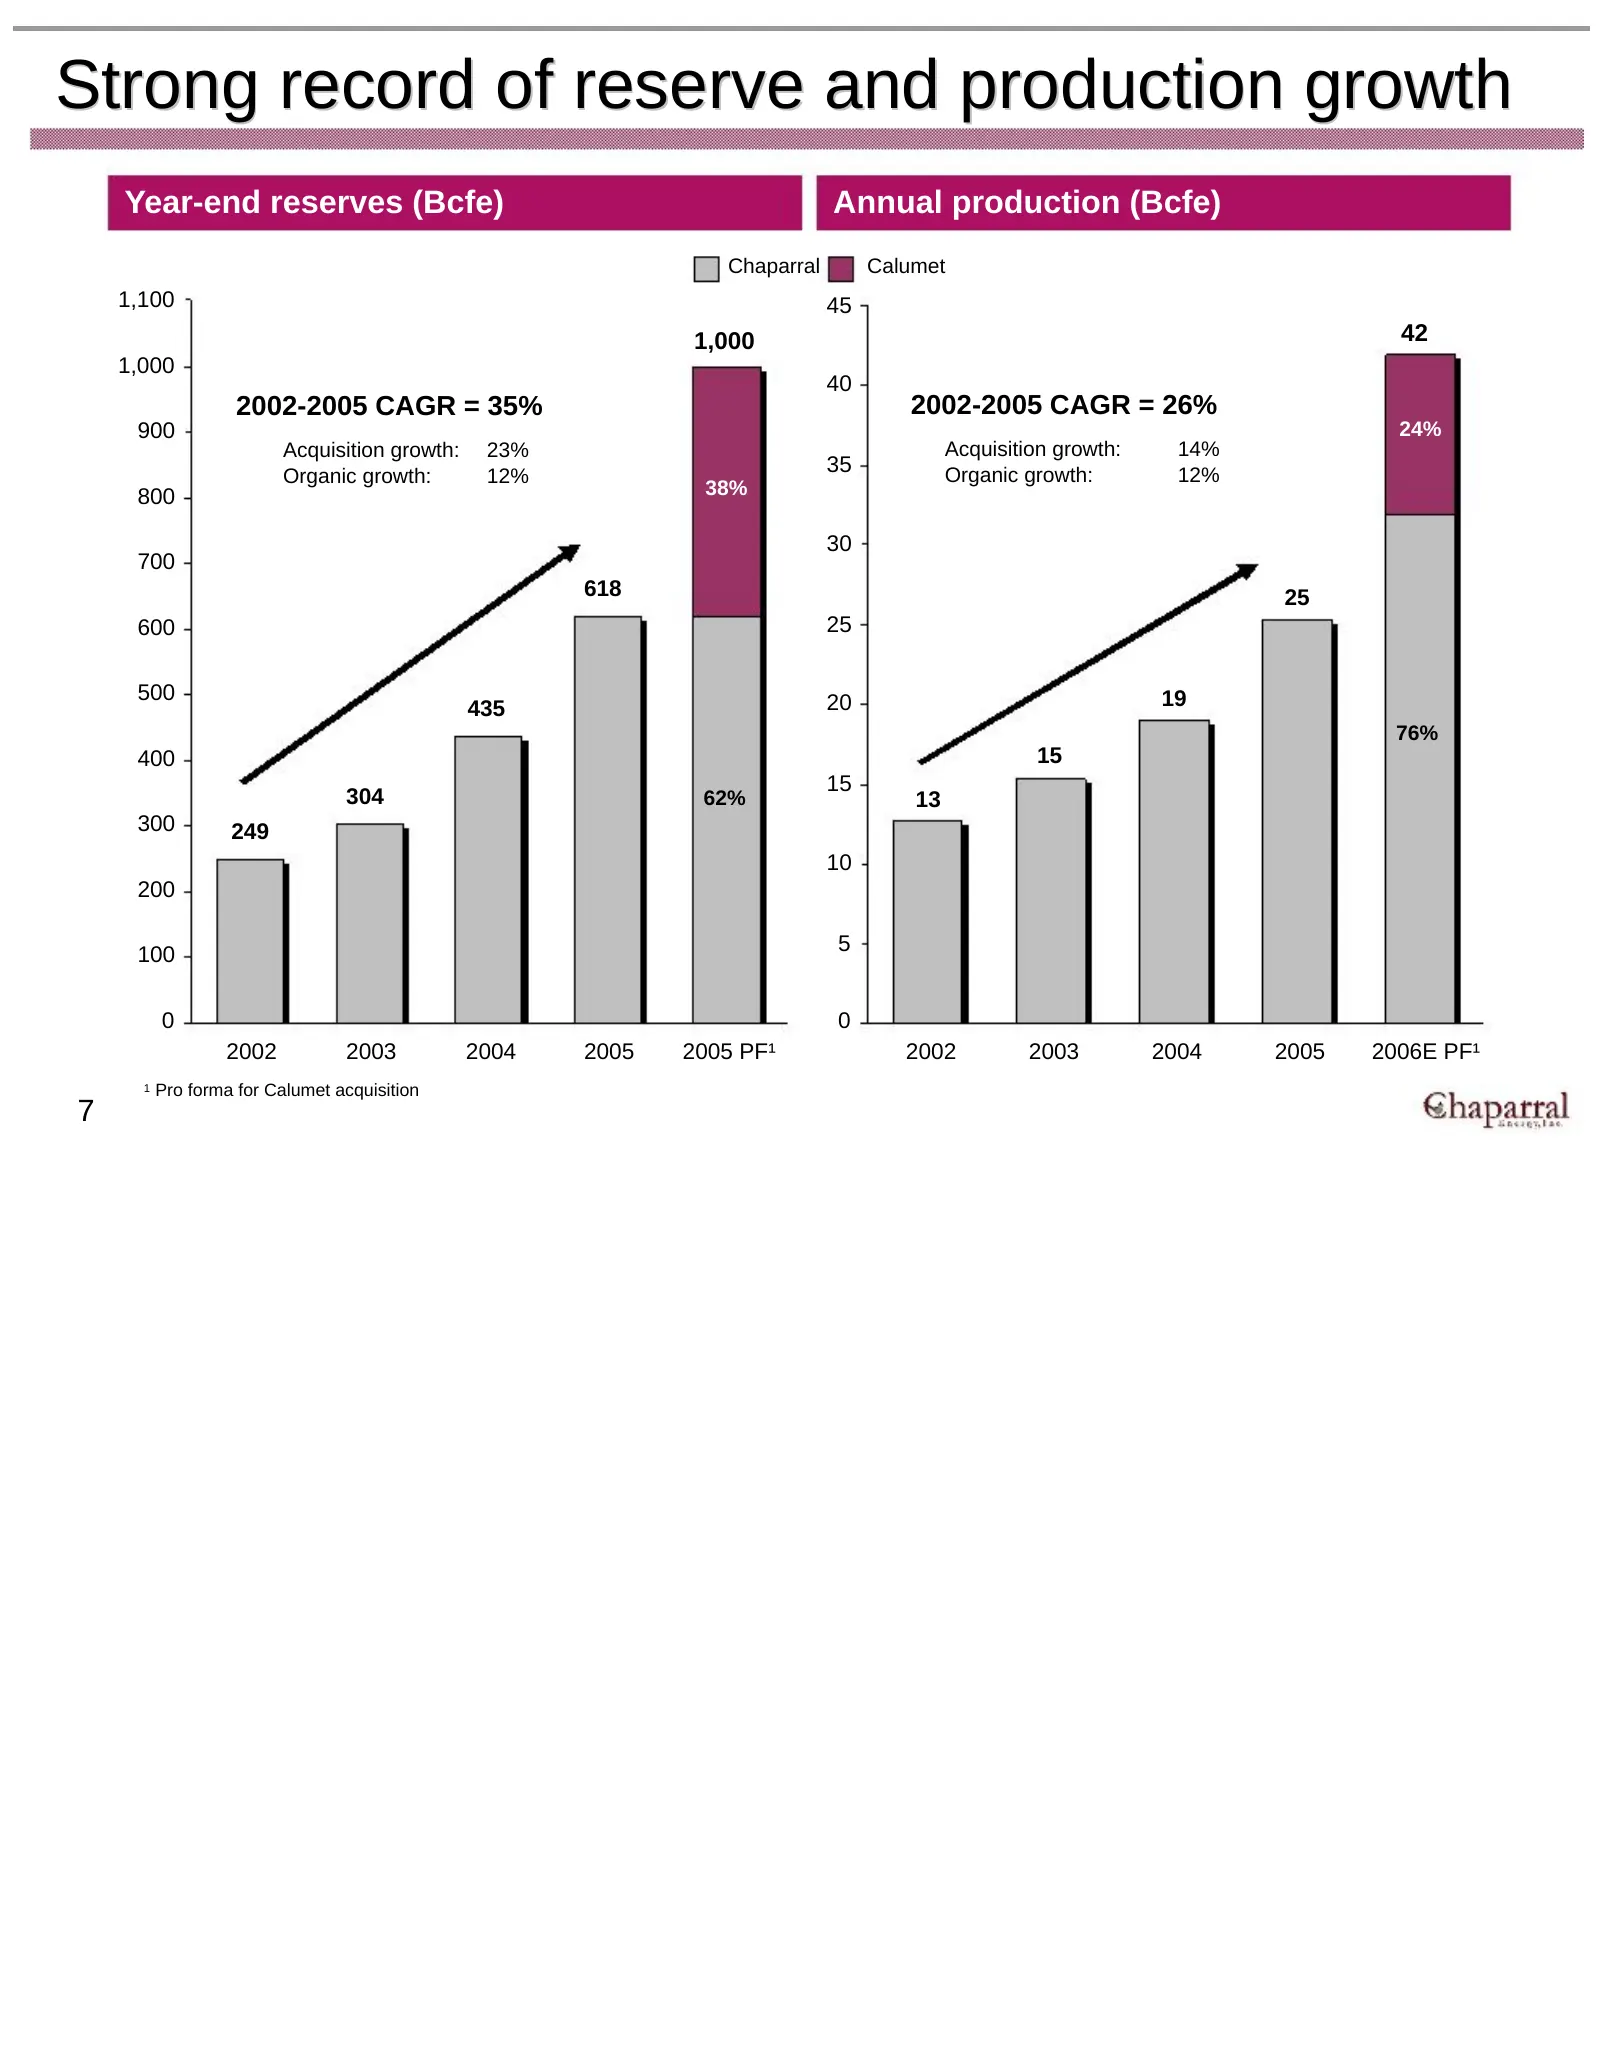
Strong record of reserve and production growth Year-end reserves (Bcfe) Annual production (Bcfe) Chaparral Calumet 1,100 45 1,000 42 1,000 40 2002-2005 CAGR = 35% 2002-2005 CAGR = 26% 900 24% Acquisition growth: 23% Acquisition growth: 14% 35 Organic growth: 12% Organic growth: 12% 800 38% 30 700 61
Slide 9: Impressive reserve replacement at attractive costs
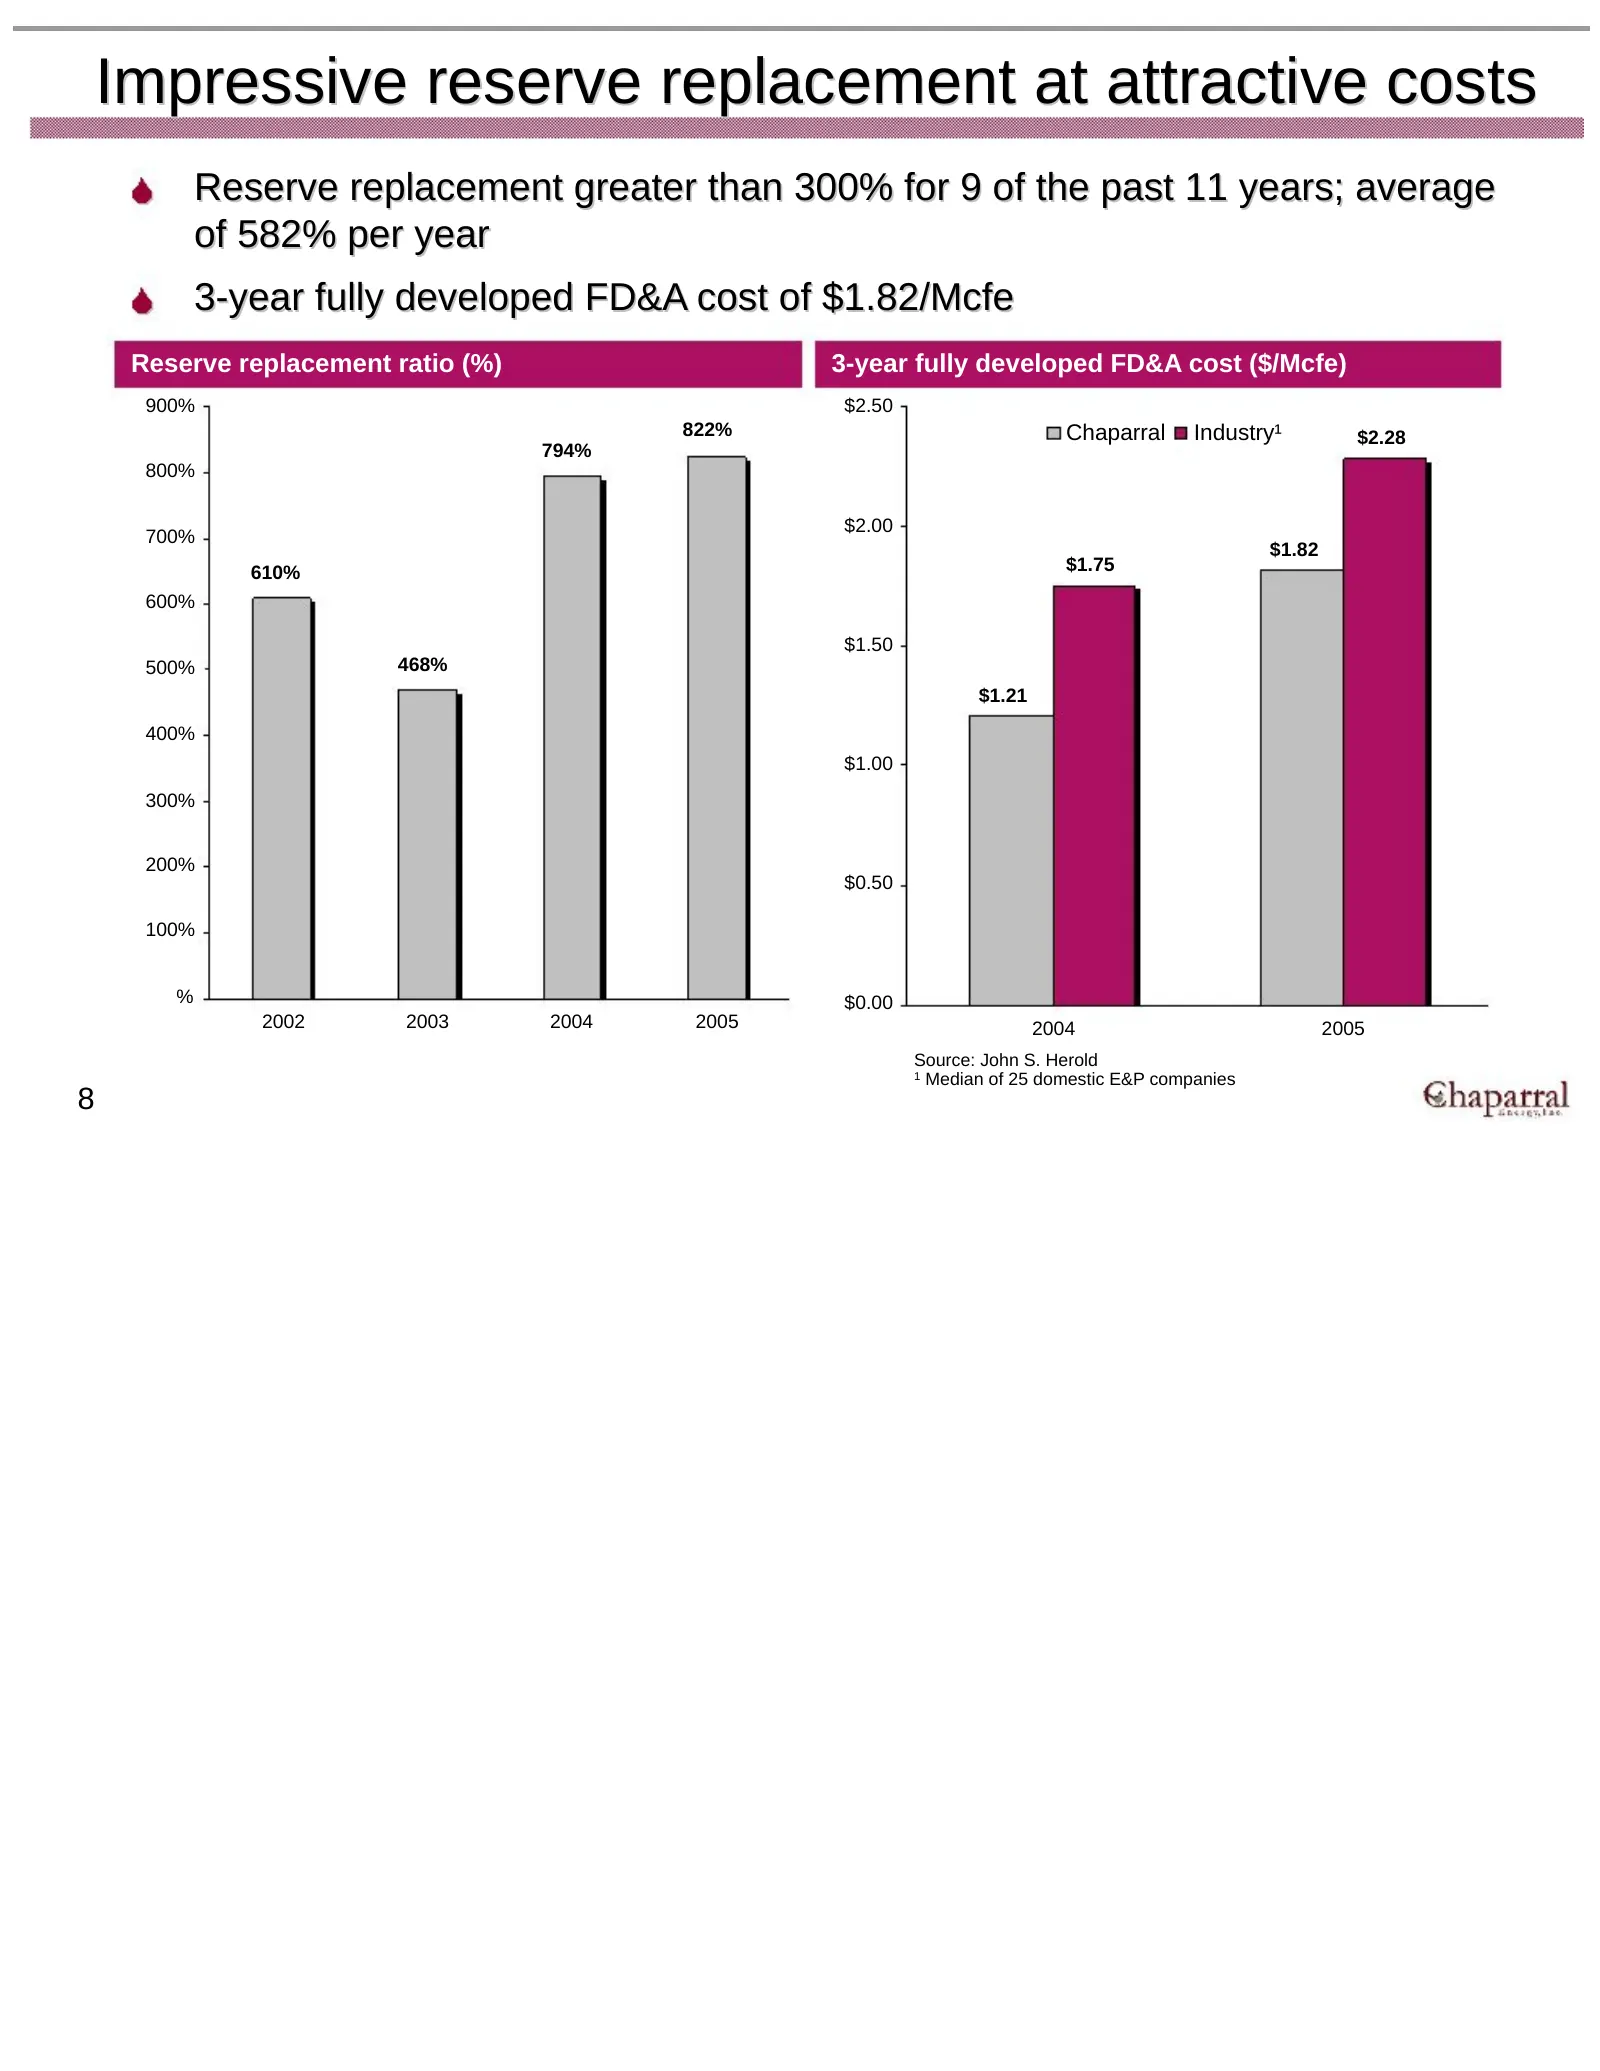
Impressive reserve replacement at attractive costs Reserve replacement greater than 300% for 9 of the past 11 years; average of 582% per year 3-year fully developed FD&A cost of $1.82/Mcfe Reserve replacement ratio (%) 3-year fully developed FD&A cost ($/Mcfe) 900% $2.50 822% Chaparral Industry¹ $2.
Slide 10: Agenda
Agenda Executive summary Strategy and project overview Financials 9
Slide 11: Chaparral's operating strategy
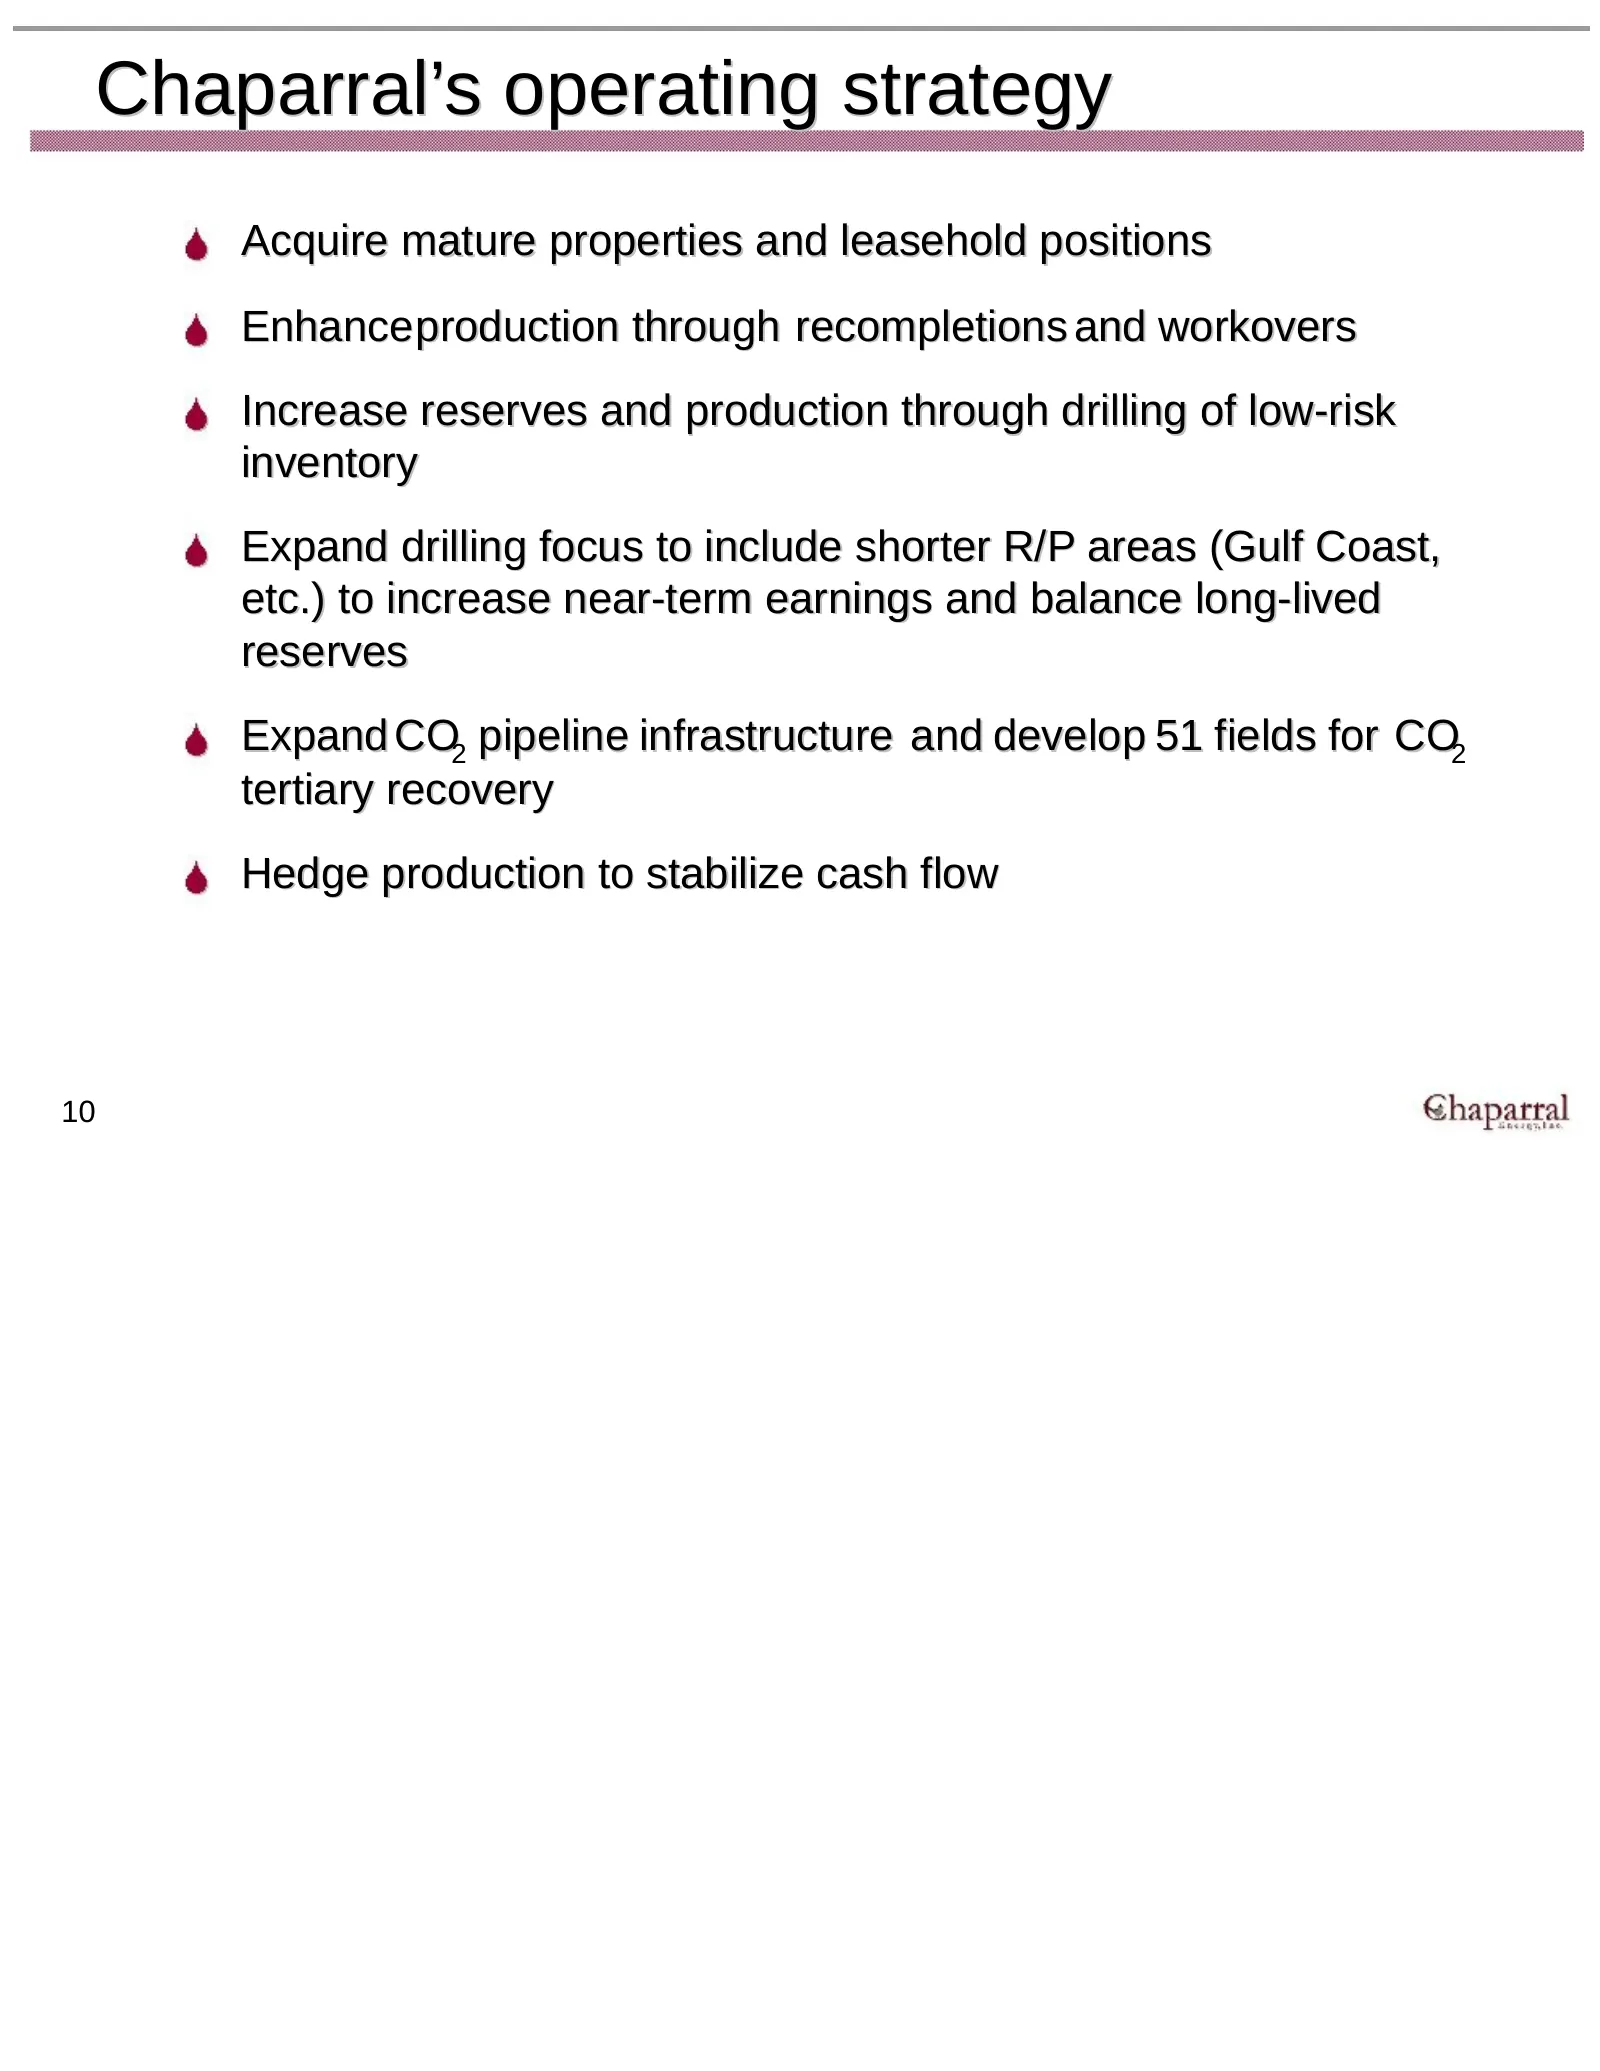
Chaparral’s operating strategy Acquire mature properties and leasehold positions Enhance production through recompletions and workovers Increase reserves and production through drilling of low-risk inventory Expand drilling focus to include shorter R/P areas (Gulf Coast, etc.) to increase near-term
Slide 12: Oil and gas capital expenditures
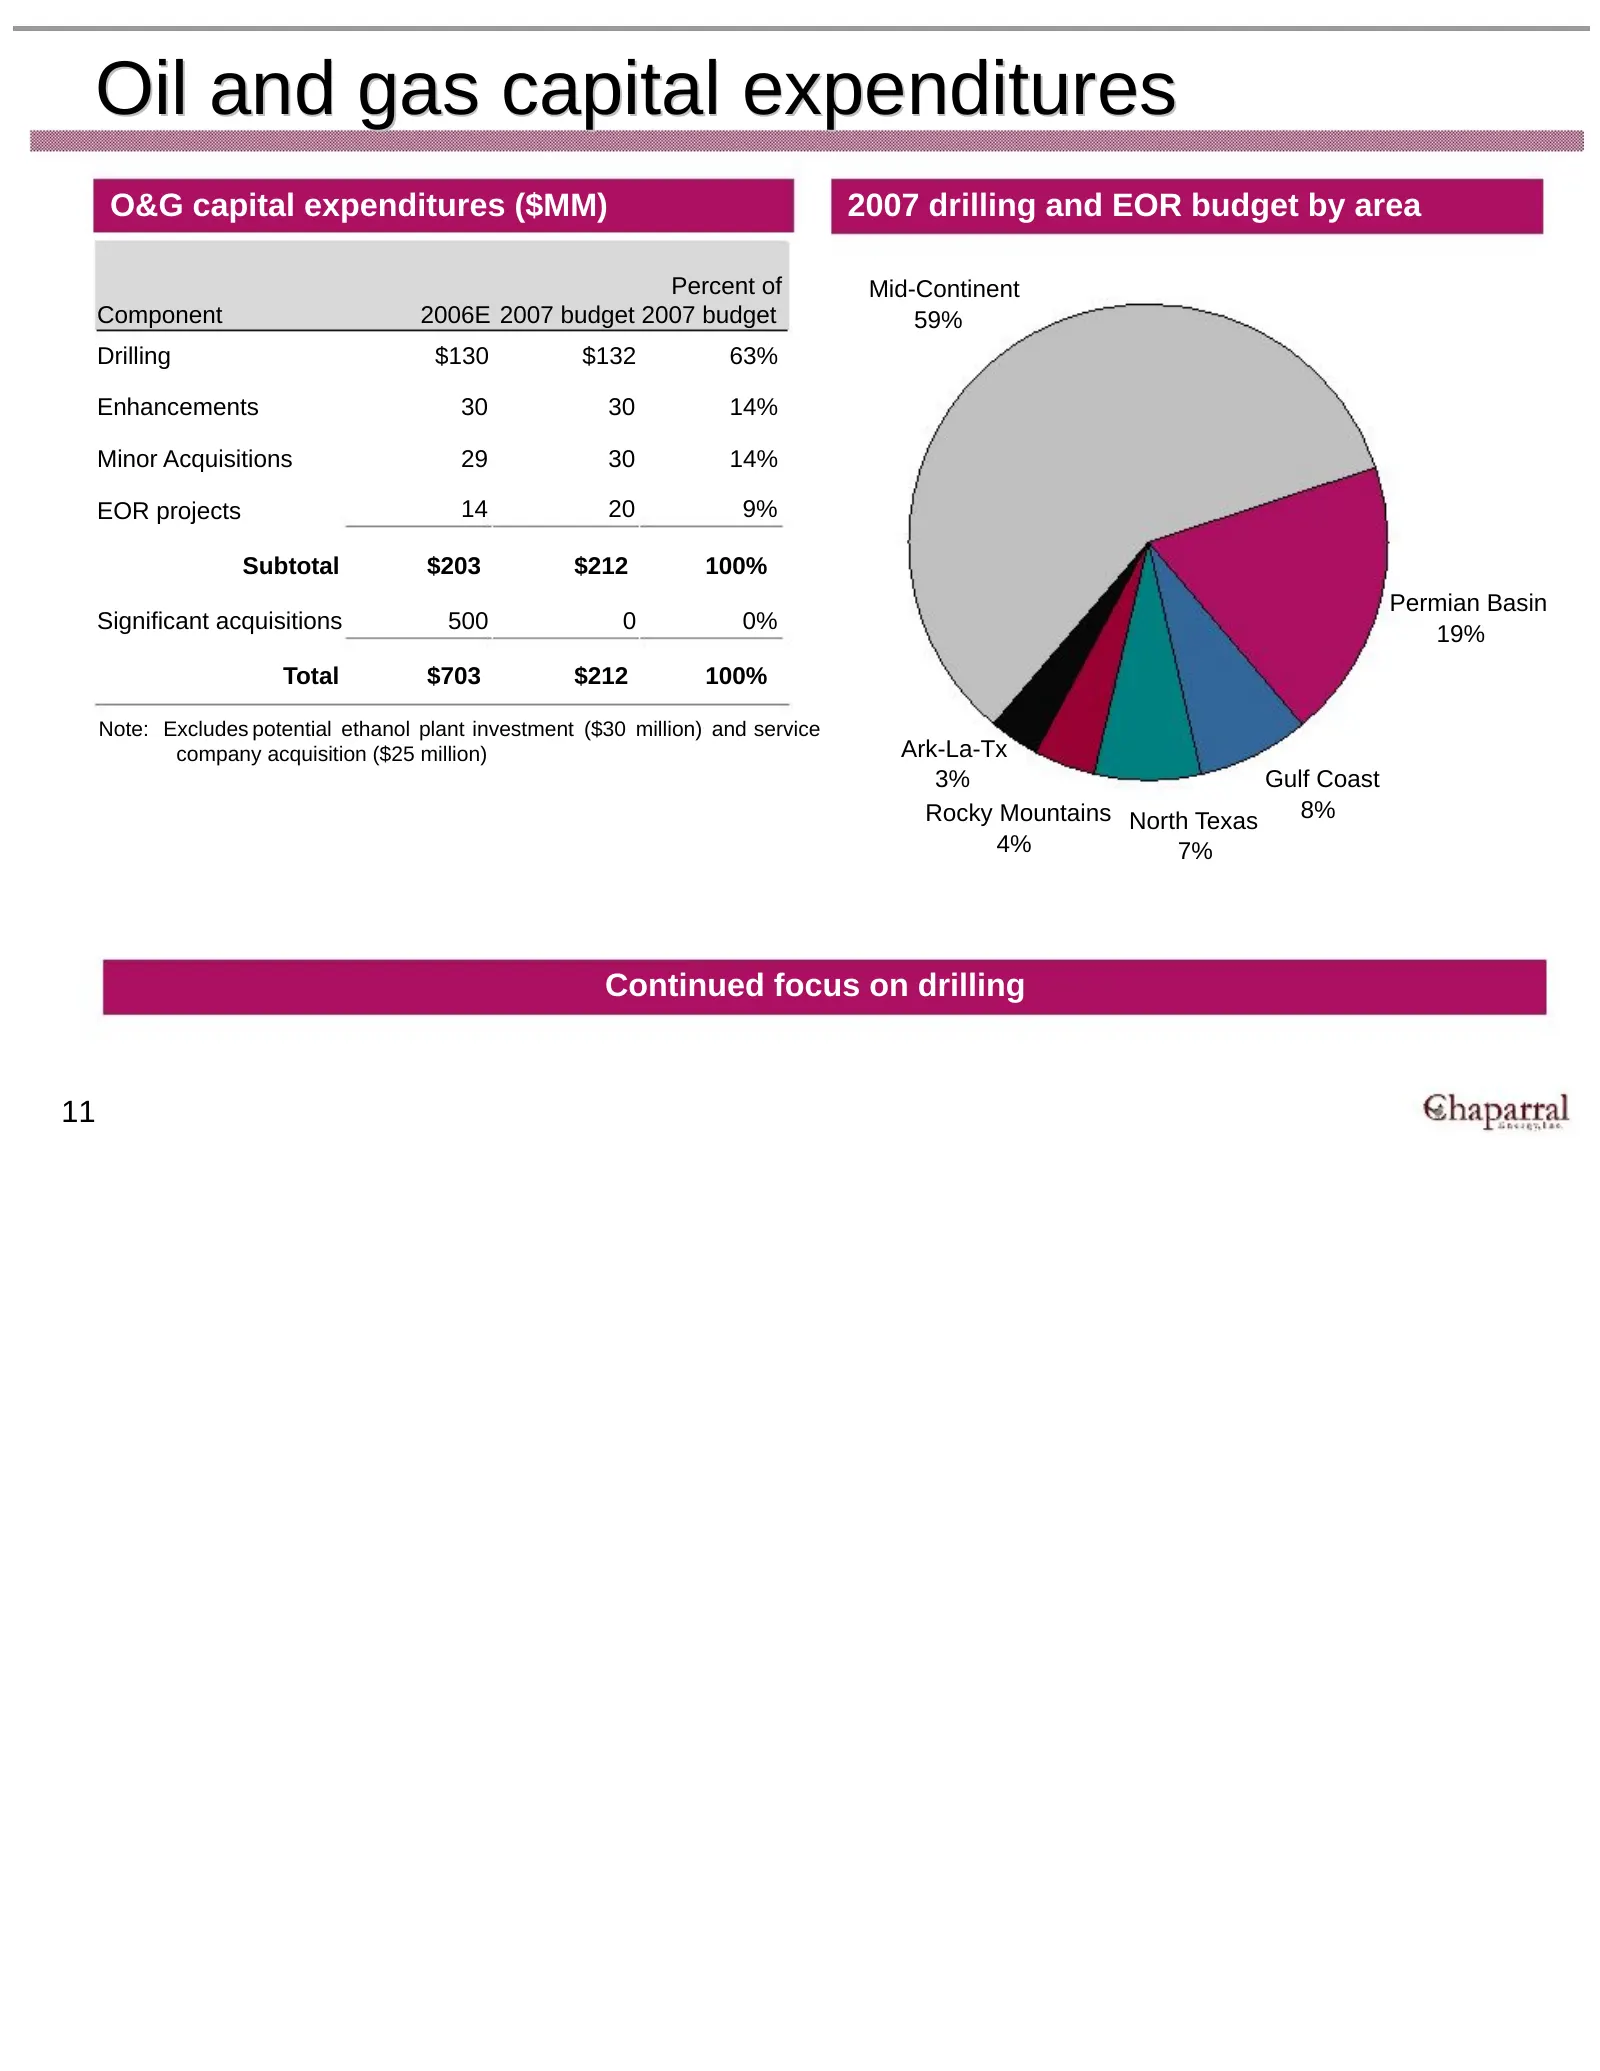
Oil and gas capital expenditures O&G capital expenditures ($MM) 2007 drilling and EOR budget by area Percent of Mid-Continent Component 2006E 2007 budget 2007 budget 59% Drilling $130 $132 63% Enhancements 30 30 14% Minor Acquisitions 29 30 14% EOR projects 14 20 9% Subtotal $203 $212 100% Permian B
Slide 13: Acquisition strategy
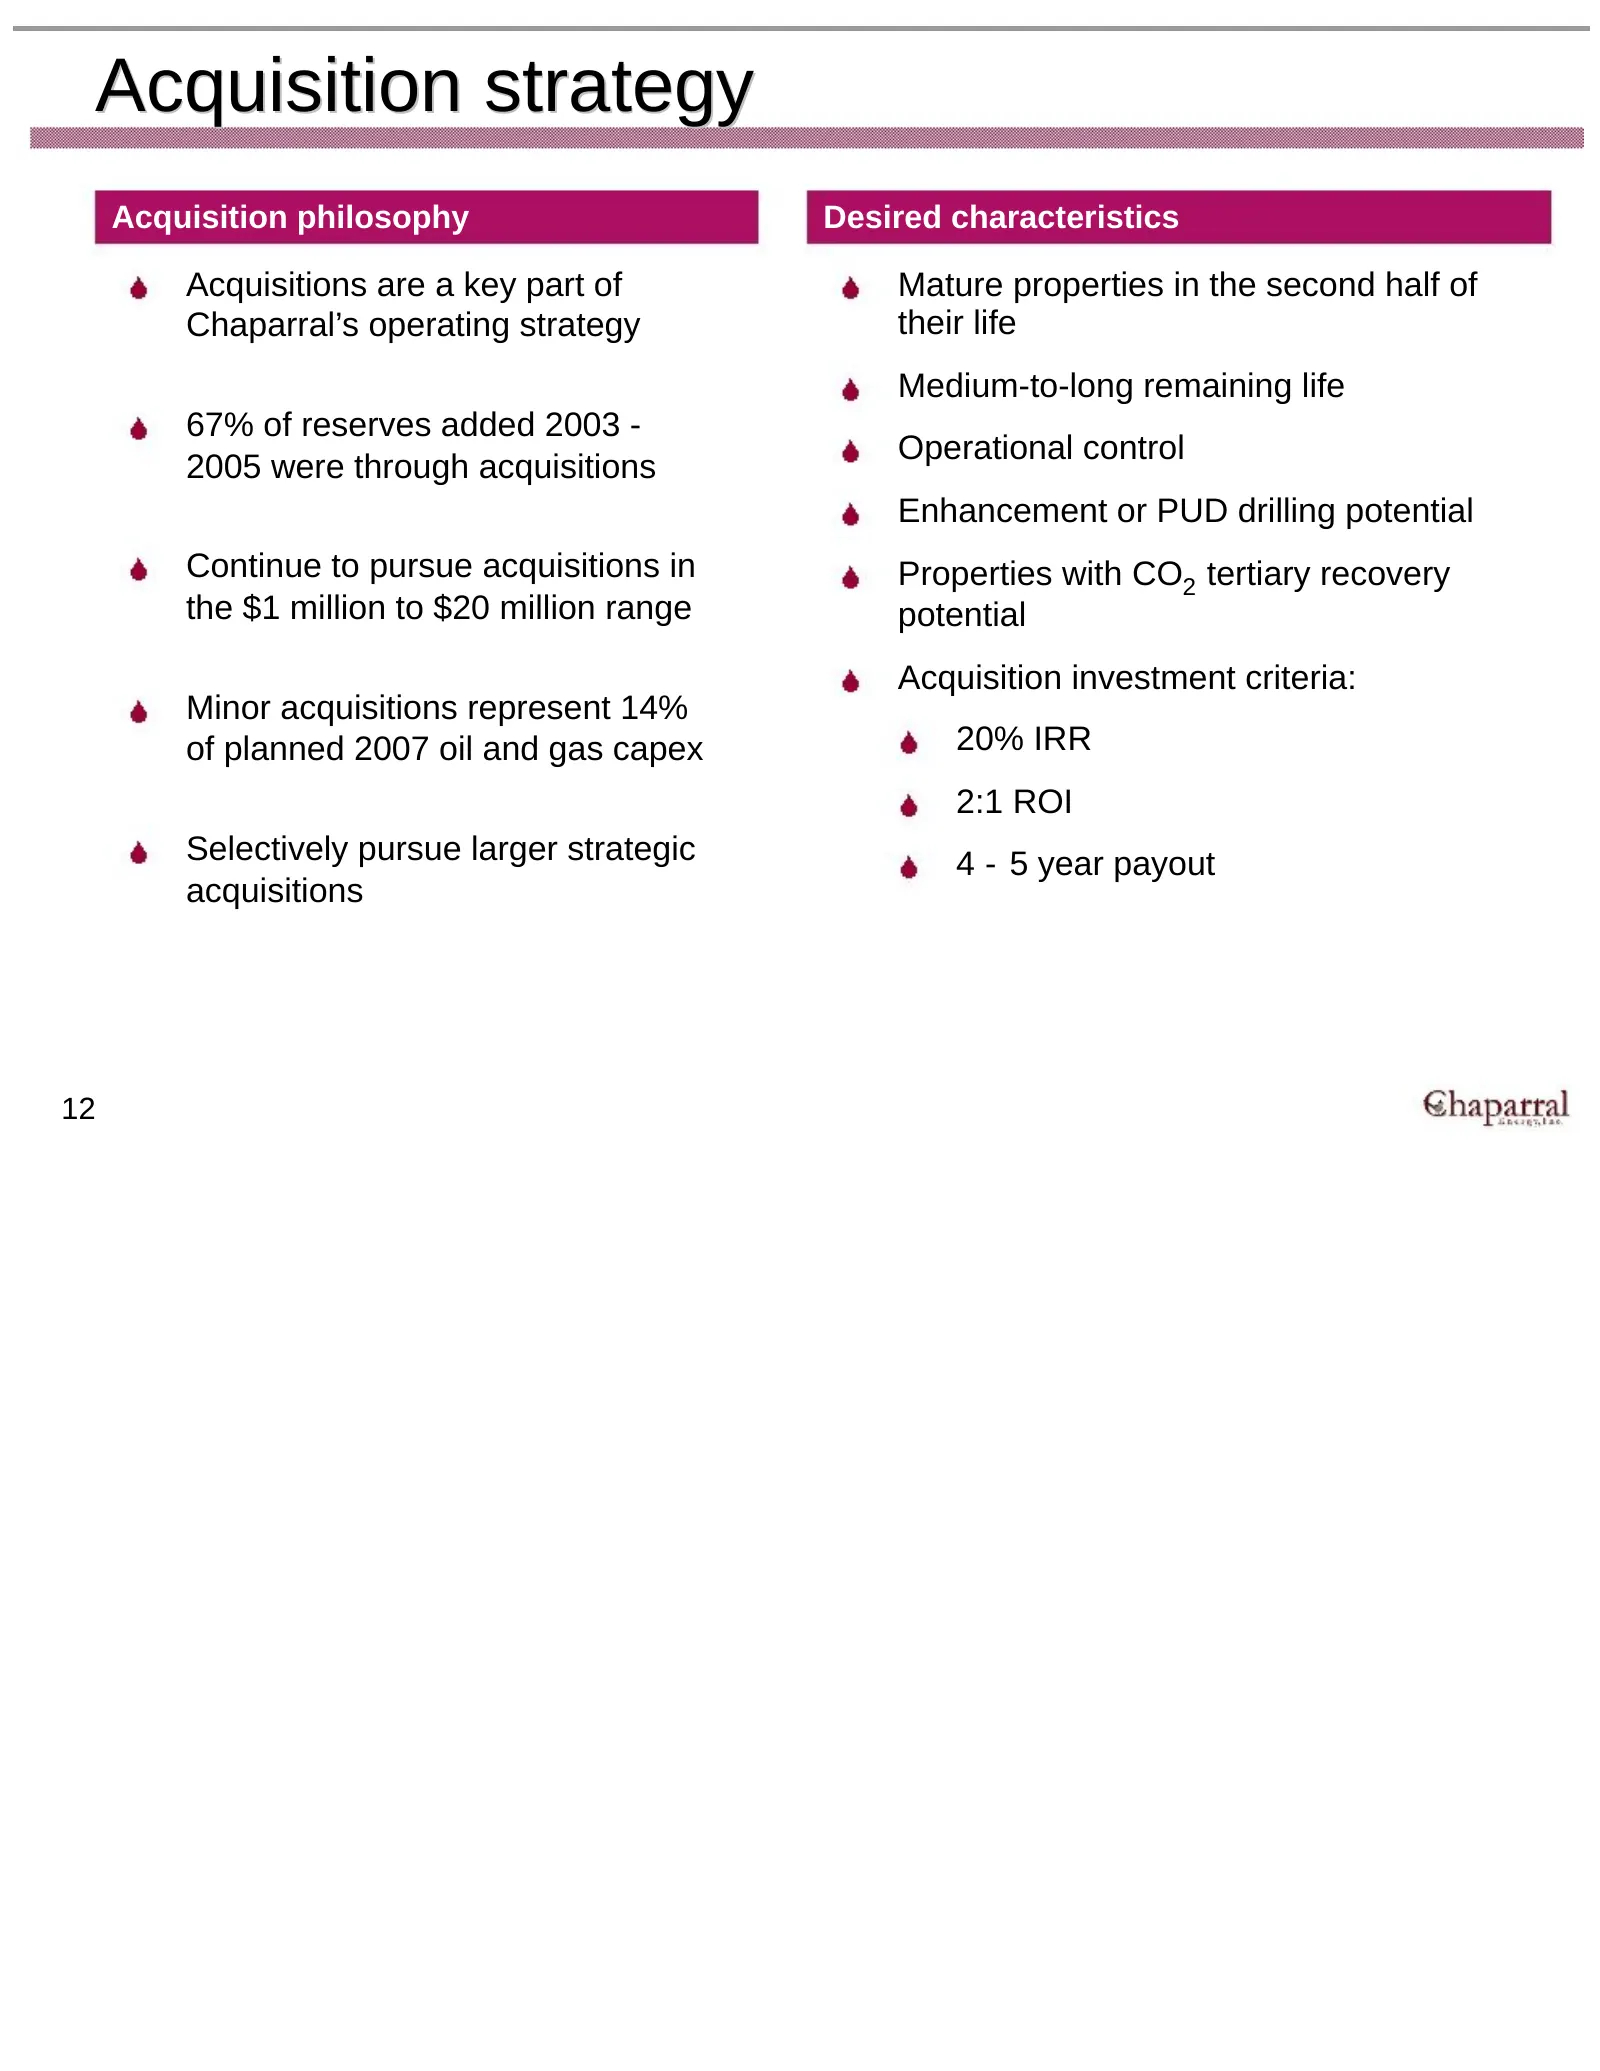
Acquisition strategy Acquisition philosophy Desired characteristics Acquisitions are a key part of Mature properties in the second half of Chaparral’s operating strategy their life Medium-to-long remaining life 67% of reserves added 2003 - Operational control 2005 were through acquisitions Enhanceme
Slide 14: Calumet acquisition overview
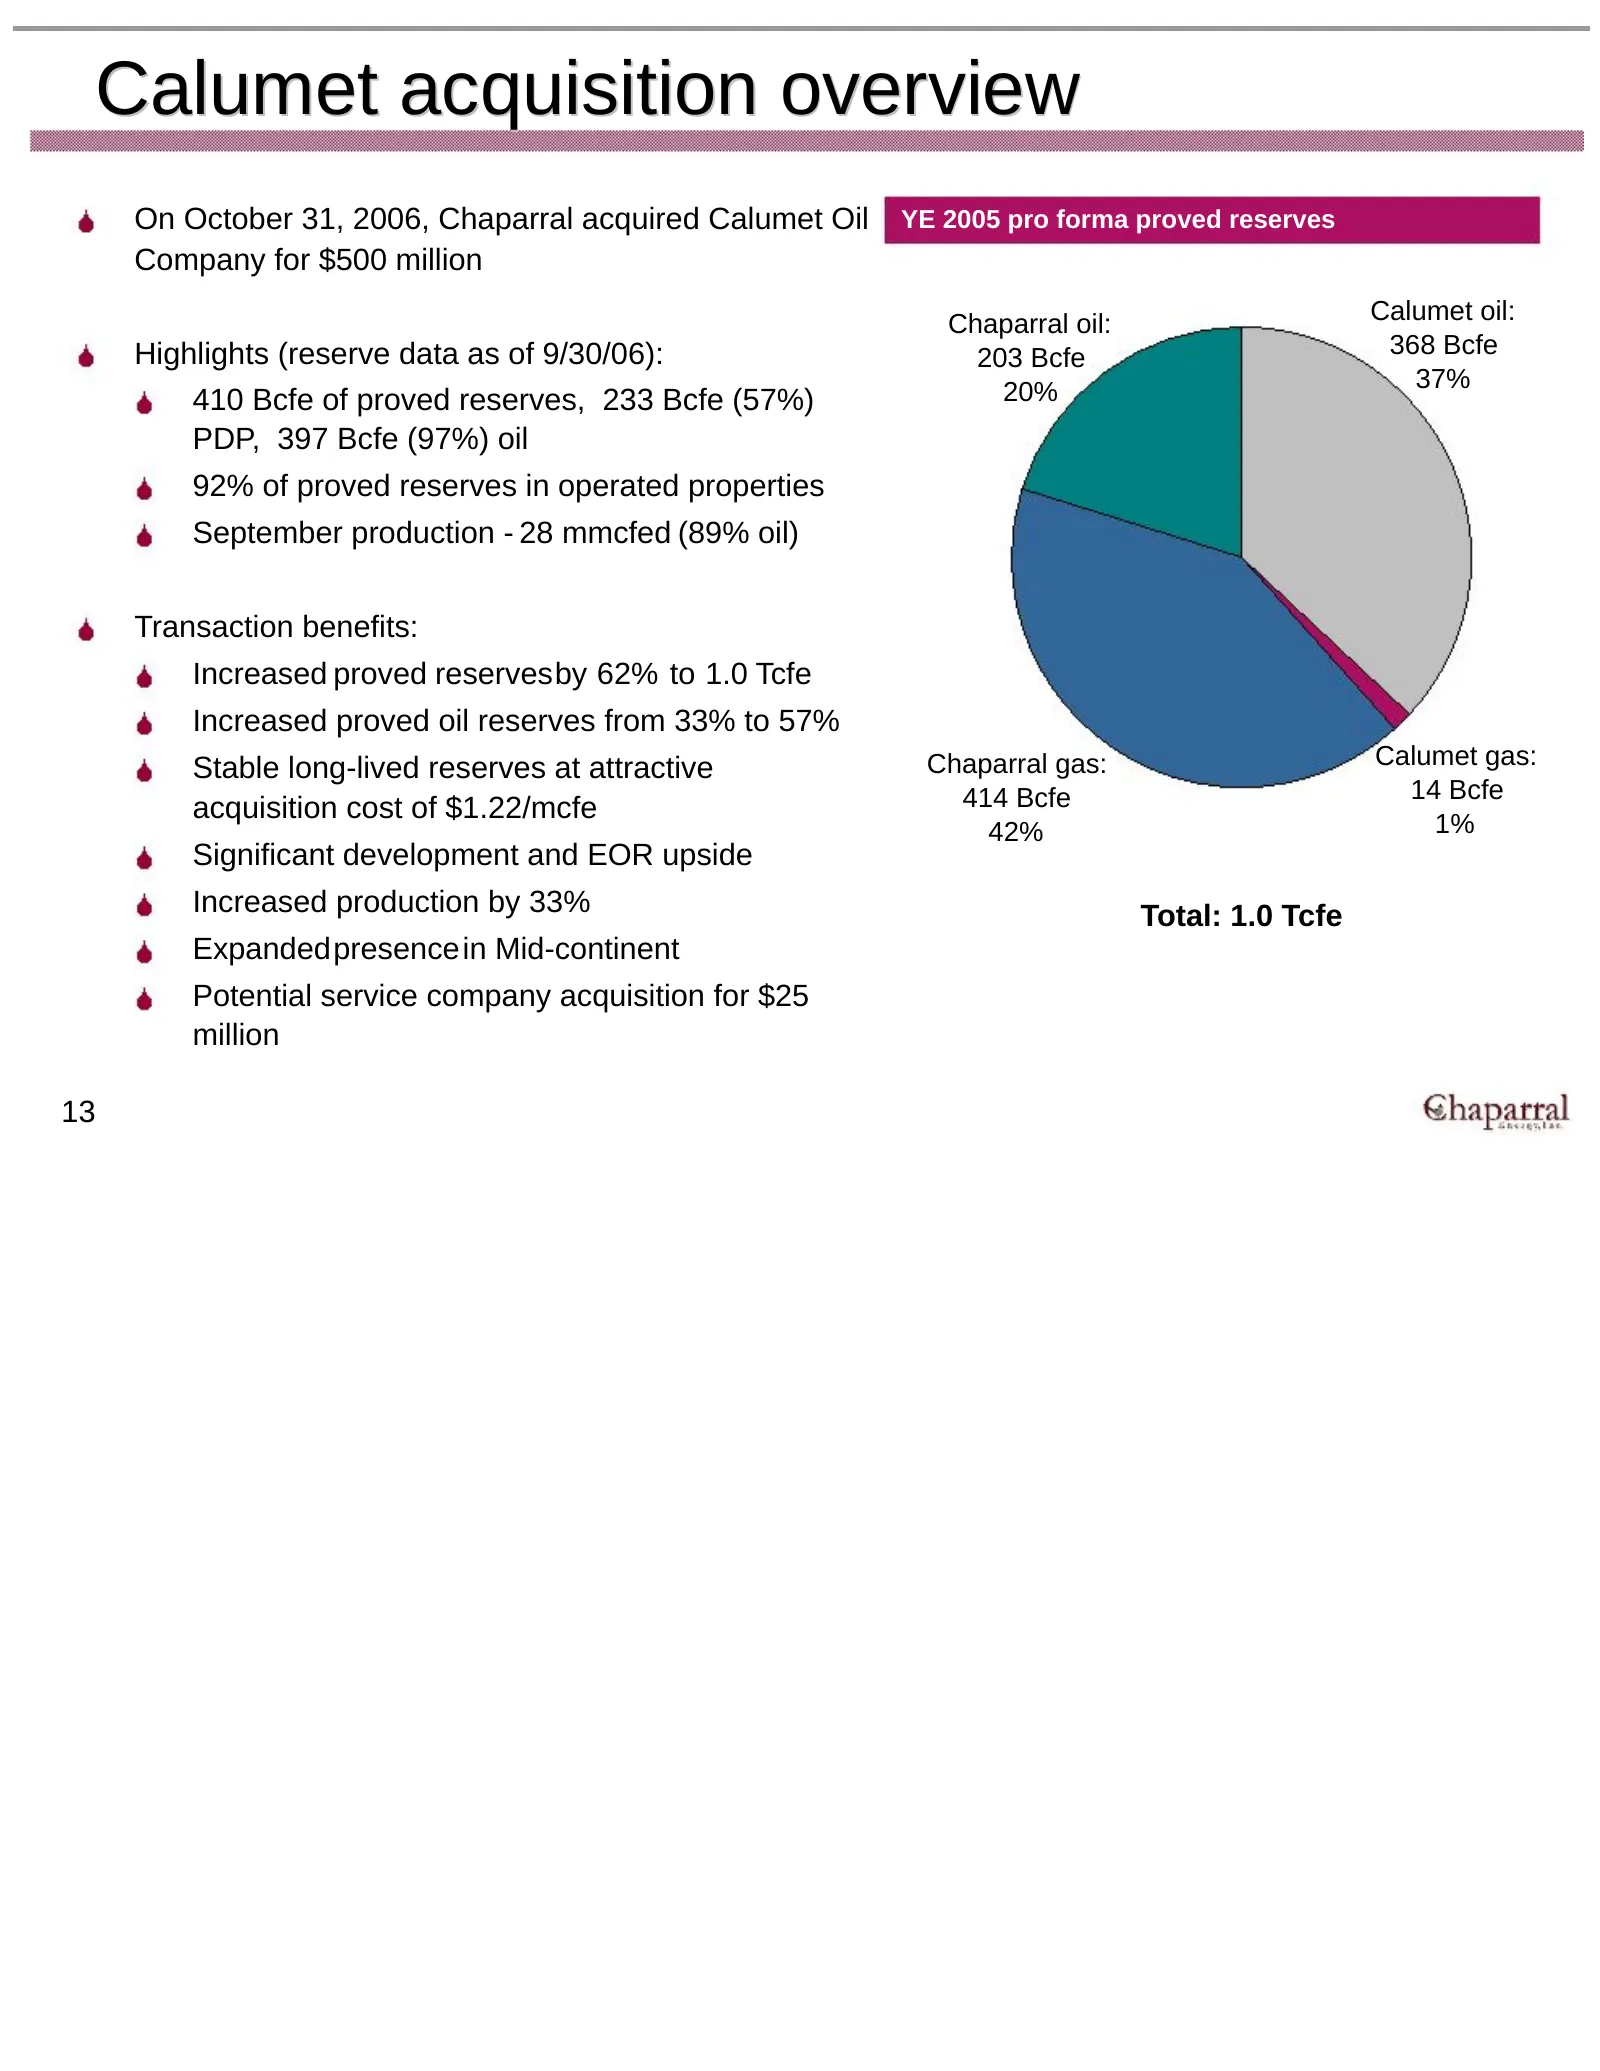
Calumet acquisition overview On October 31, 2006, Chaparral acquired Calumet Oil YE 2005 pro forma proved reserves Company for $500 million Chaparral oil: Calumet oil: Highlights (reserve data as of 9/30/06): 203 Bcfe 368 Bcfe 20% 37% 410 Bcfe of proved reserves, 233 Bcfe (57%) PDP, 397 Bcfe (97%) o
Slide 15: Enhancement projects
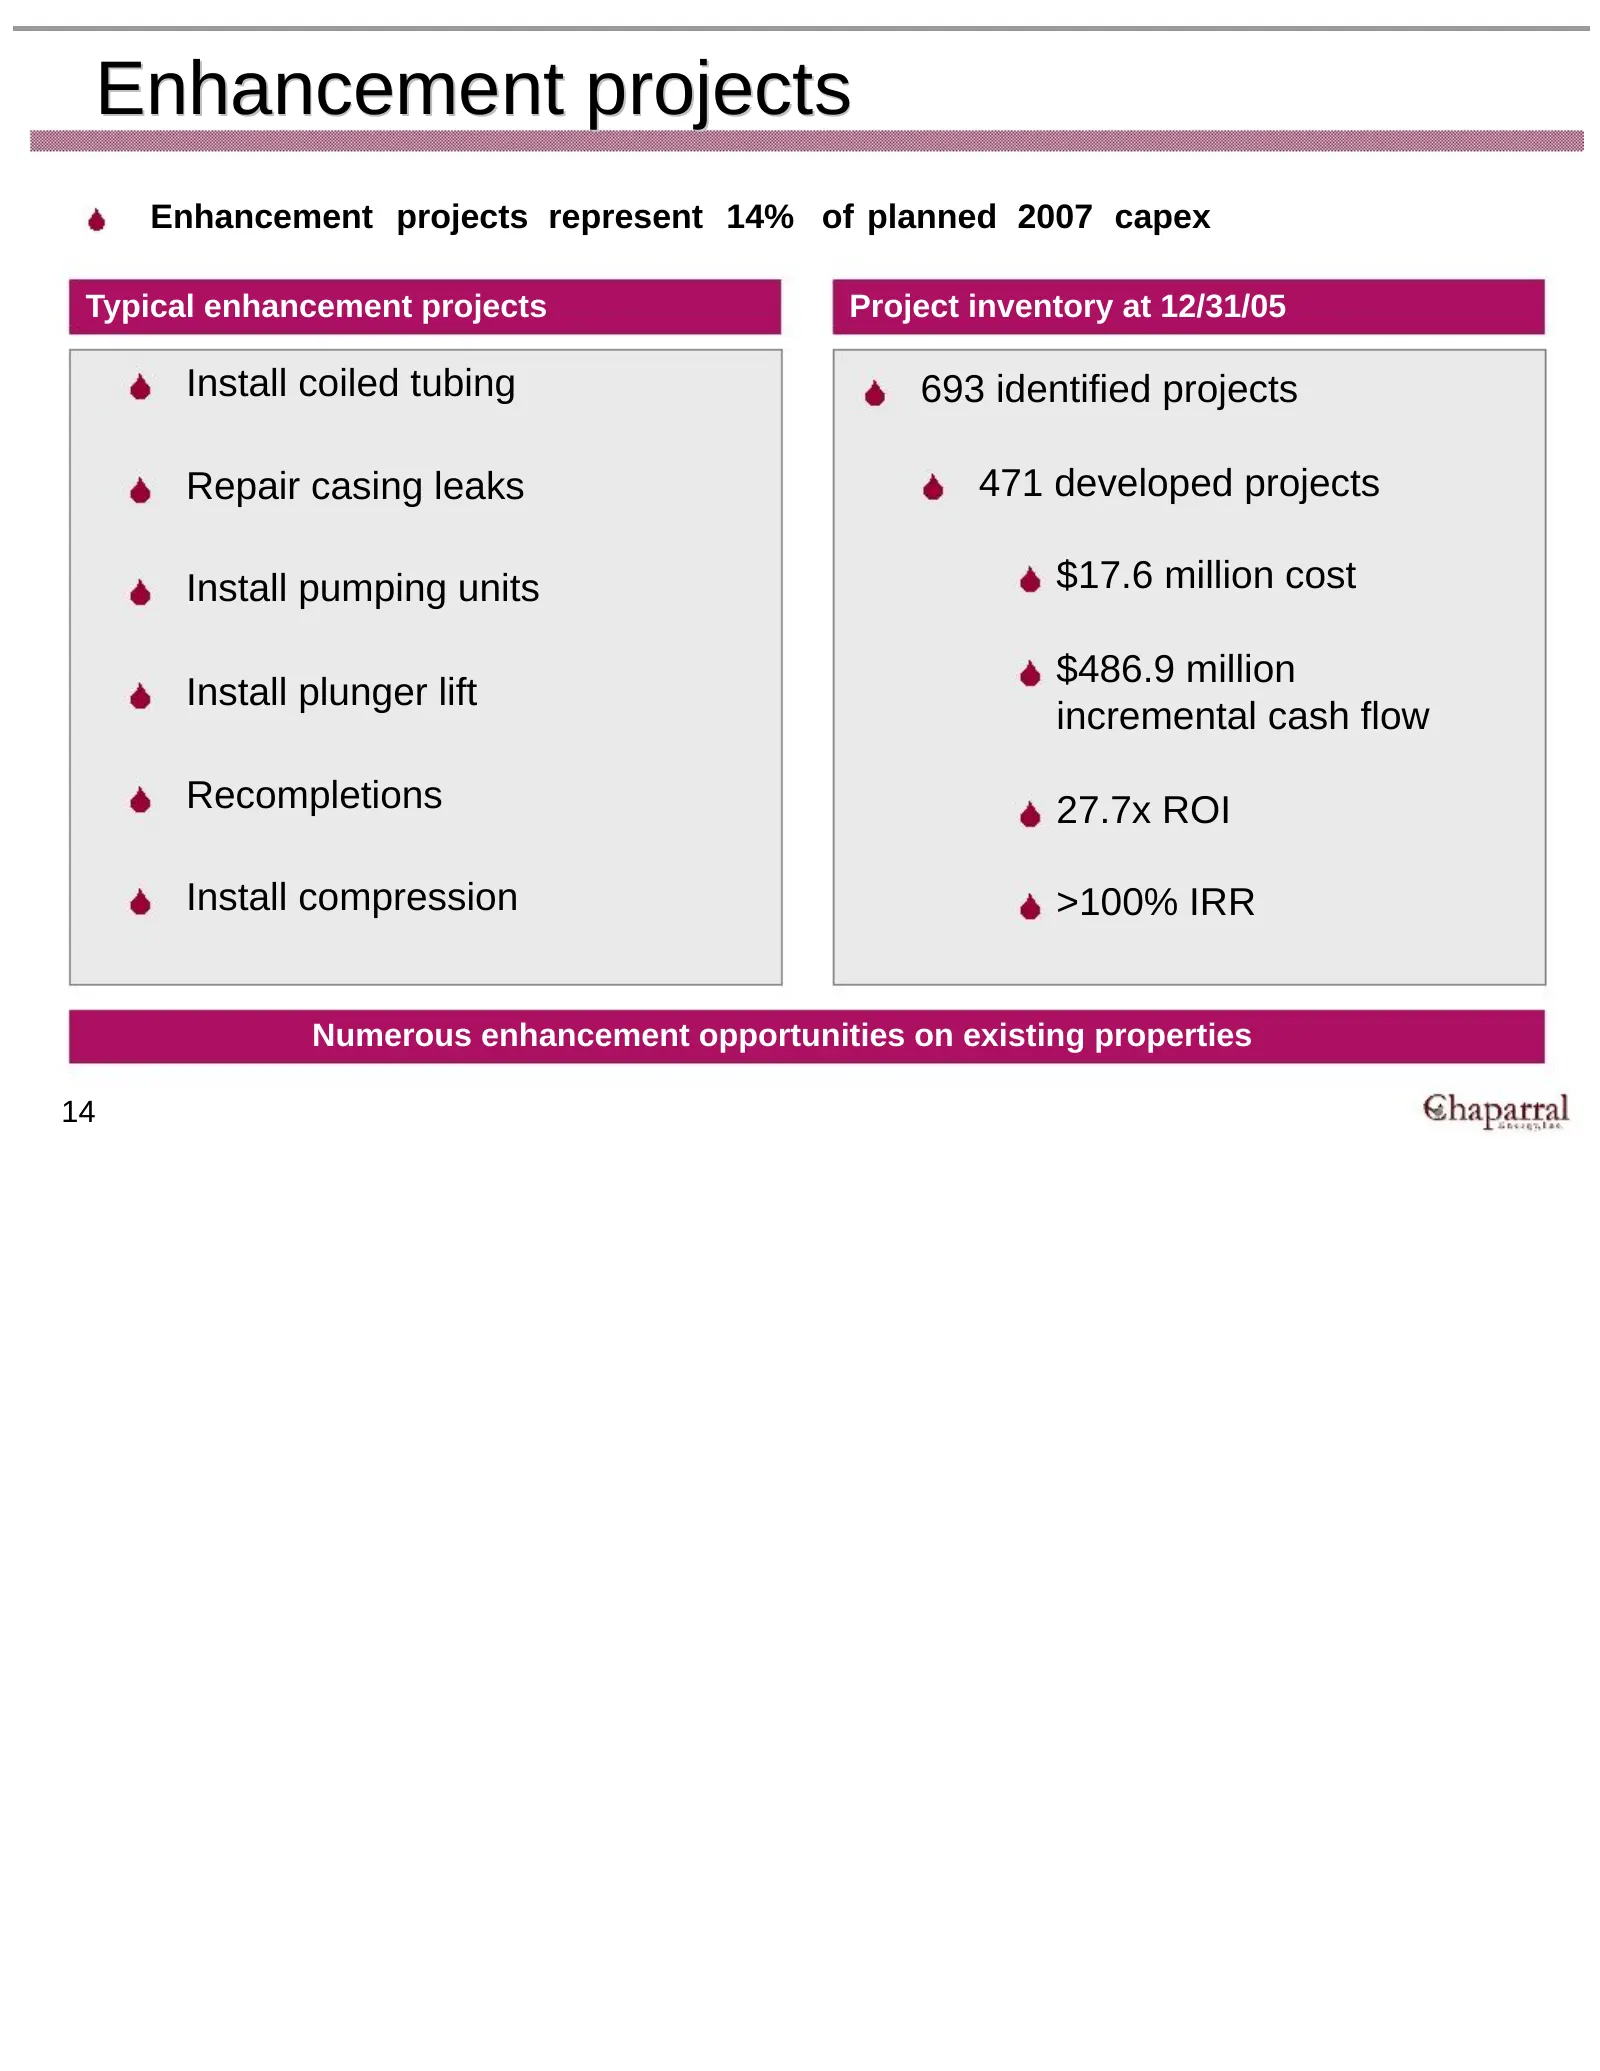
Enhancement projects Enhancement projects represent 14% of planned 2007 capex Typical enhancement projects Project inventory at 12/31/05 Install coiled tubing 693 identified projects Repair casing leaks 471 developed projects Install pumping units $17.6 million cost $486.9 million Install plunger li
Slide 16: Low-risk drilling inventory
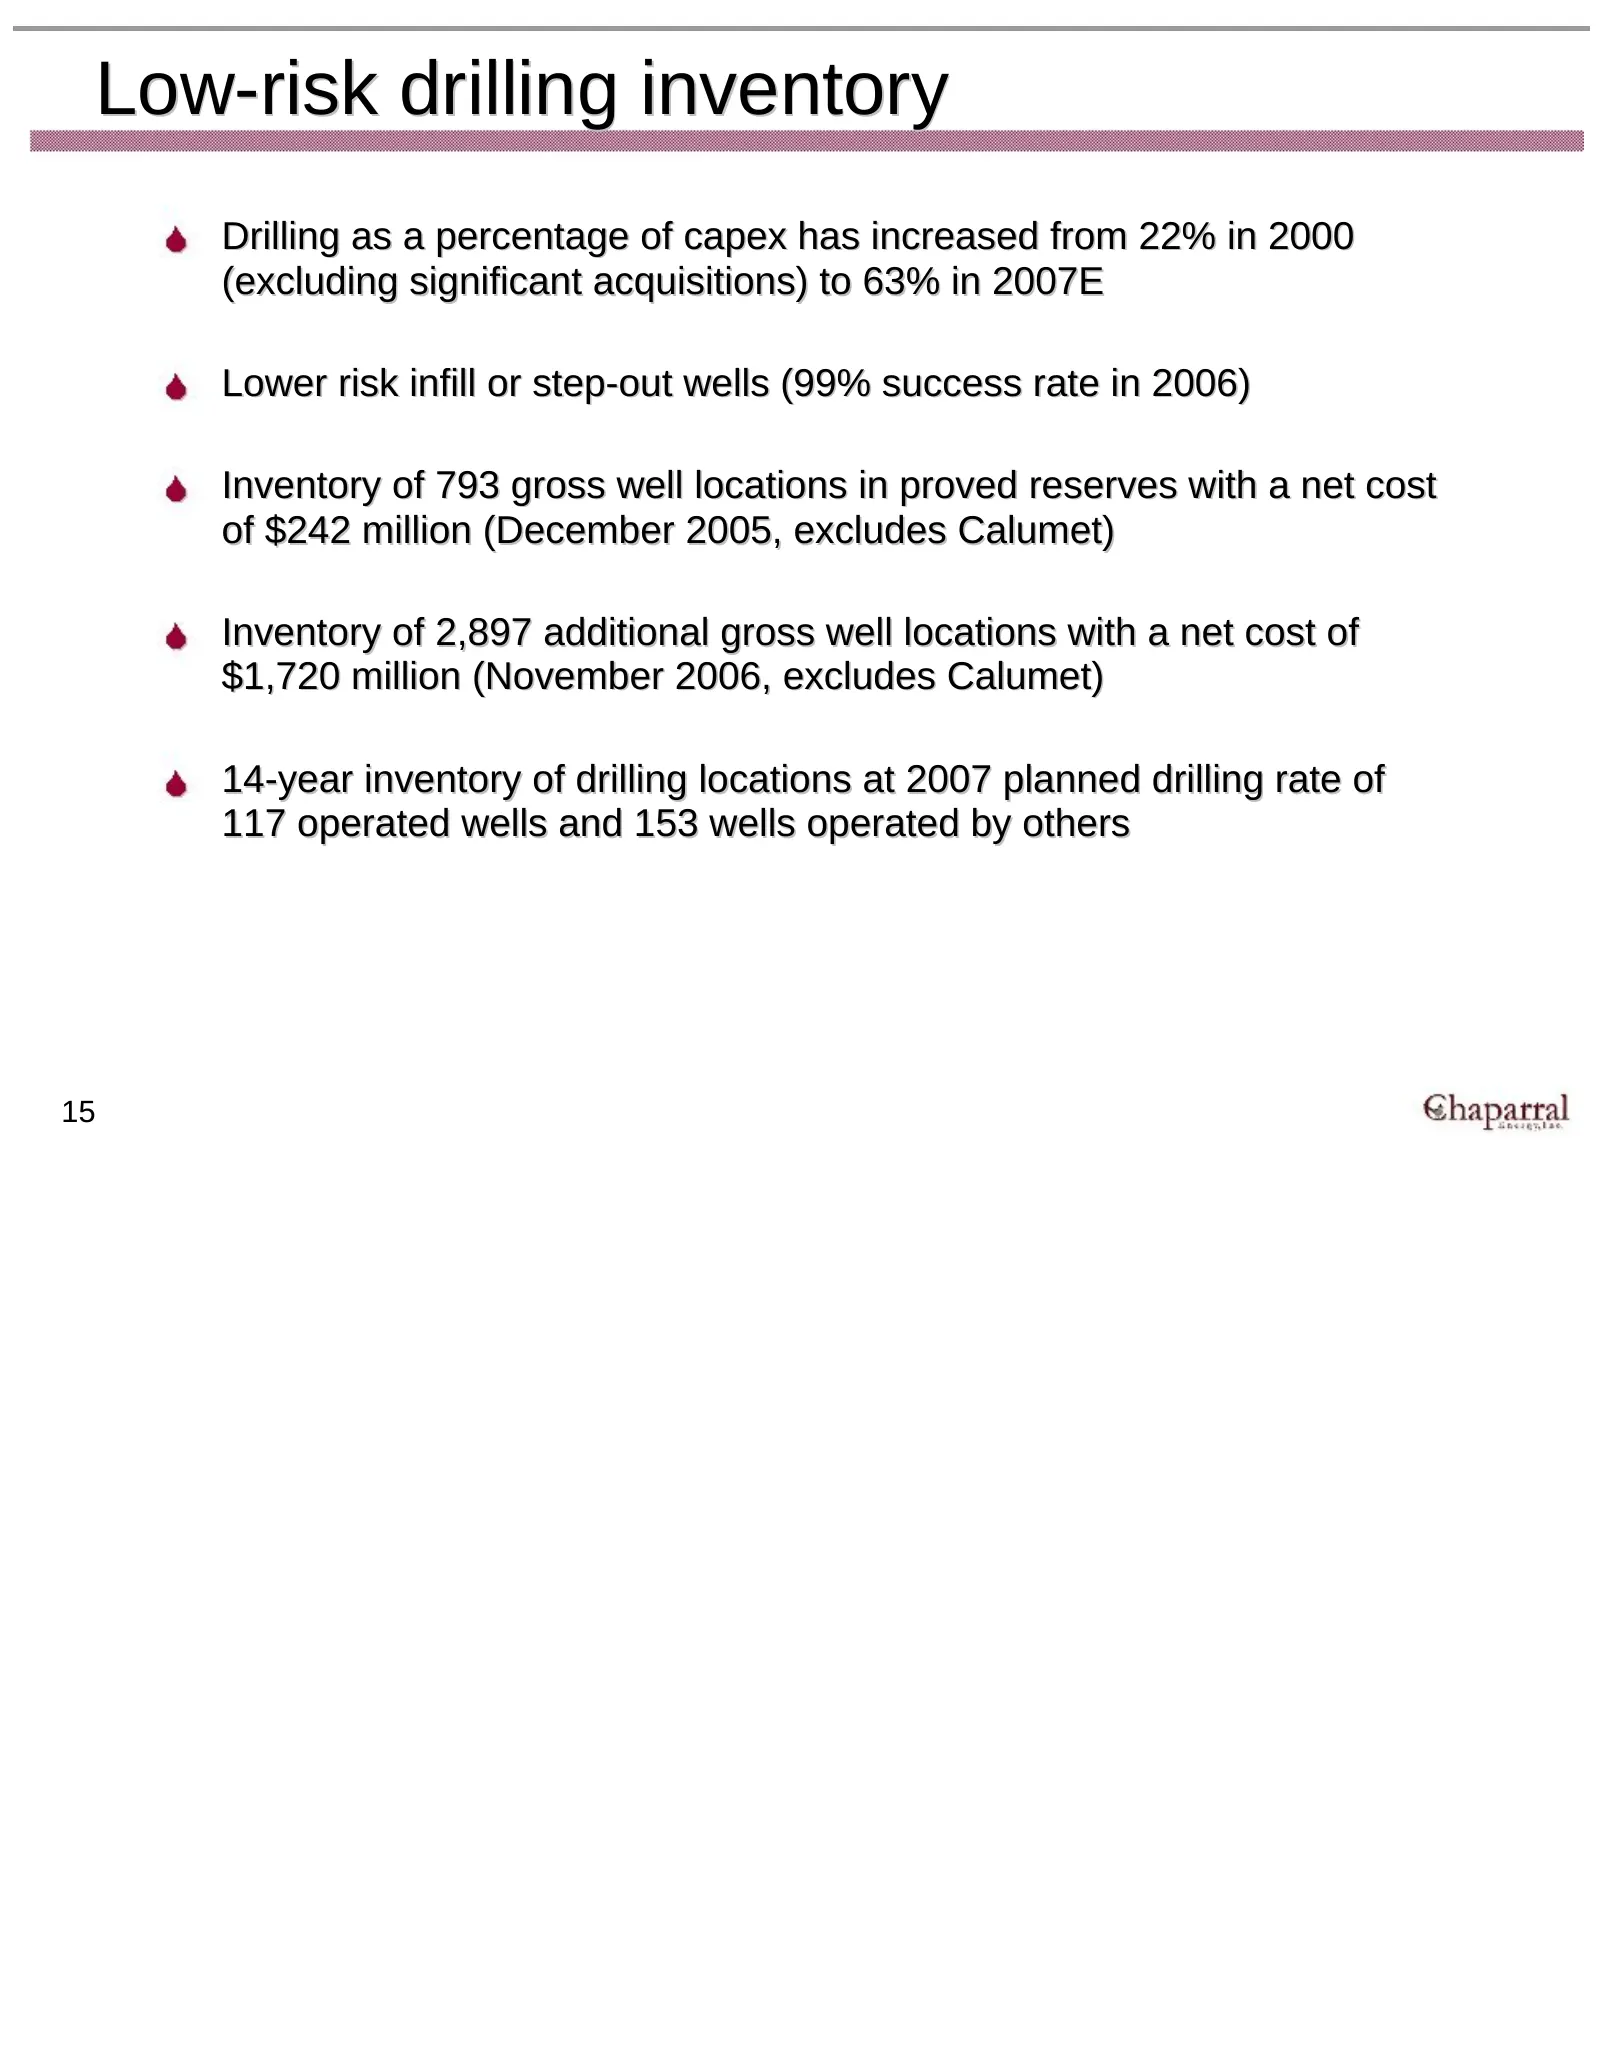
Low-risk drilling inventory Drilling as a percentage of capex has increased from 22% in 2000 (excluding significant acquisitions) to 63% in 2007E Lower risk infill or step-out wells (99% success rate in 2006) Inventory of 793 gross well locations in proved reserves with a net cost of $242 million (D
Slide 17: Significant low-risk drilling inventory
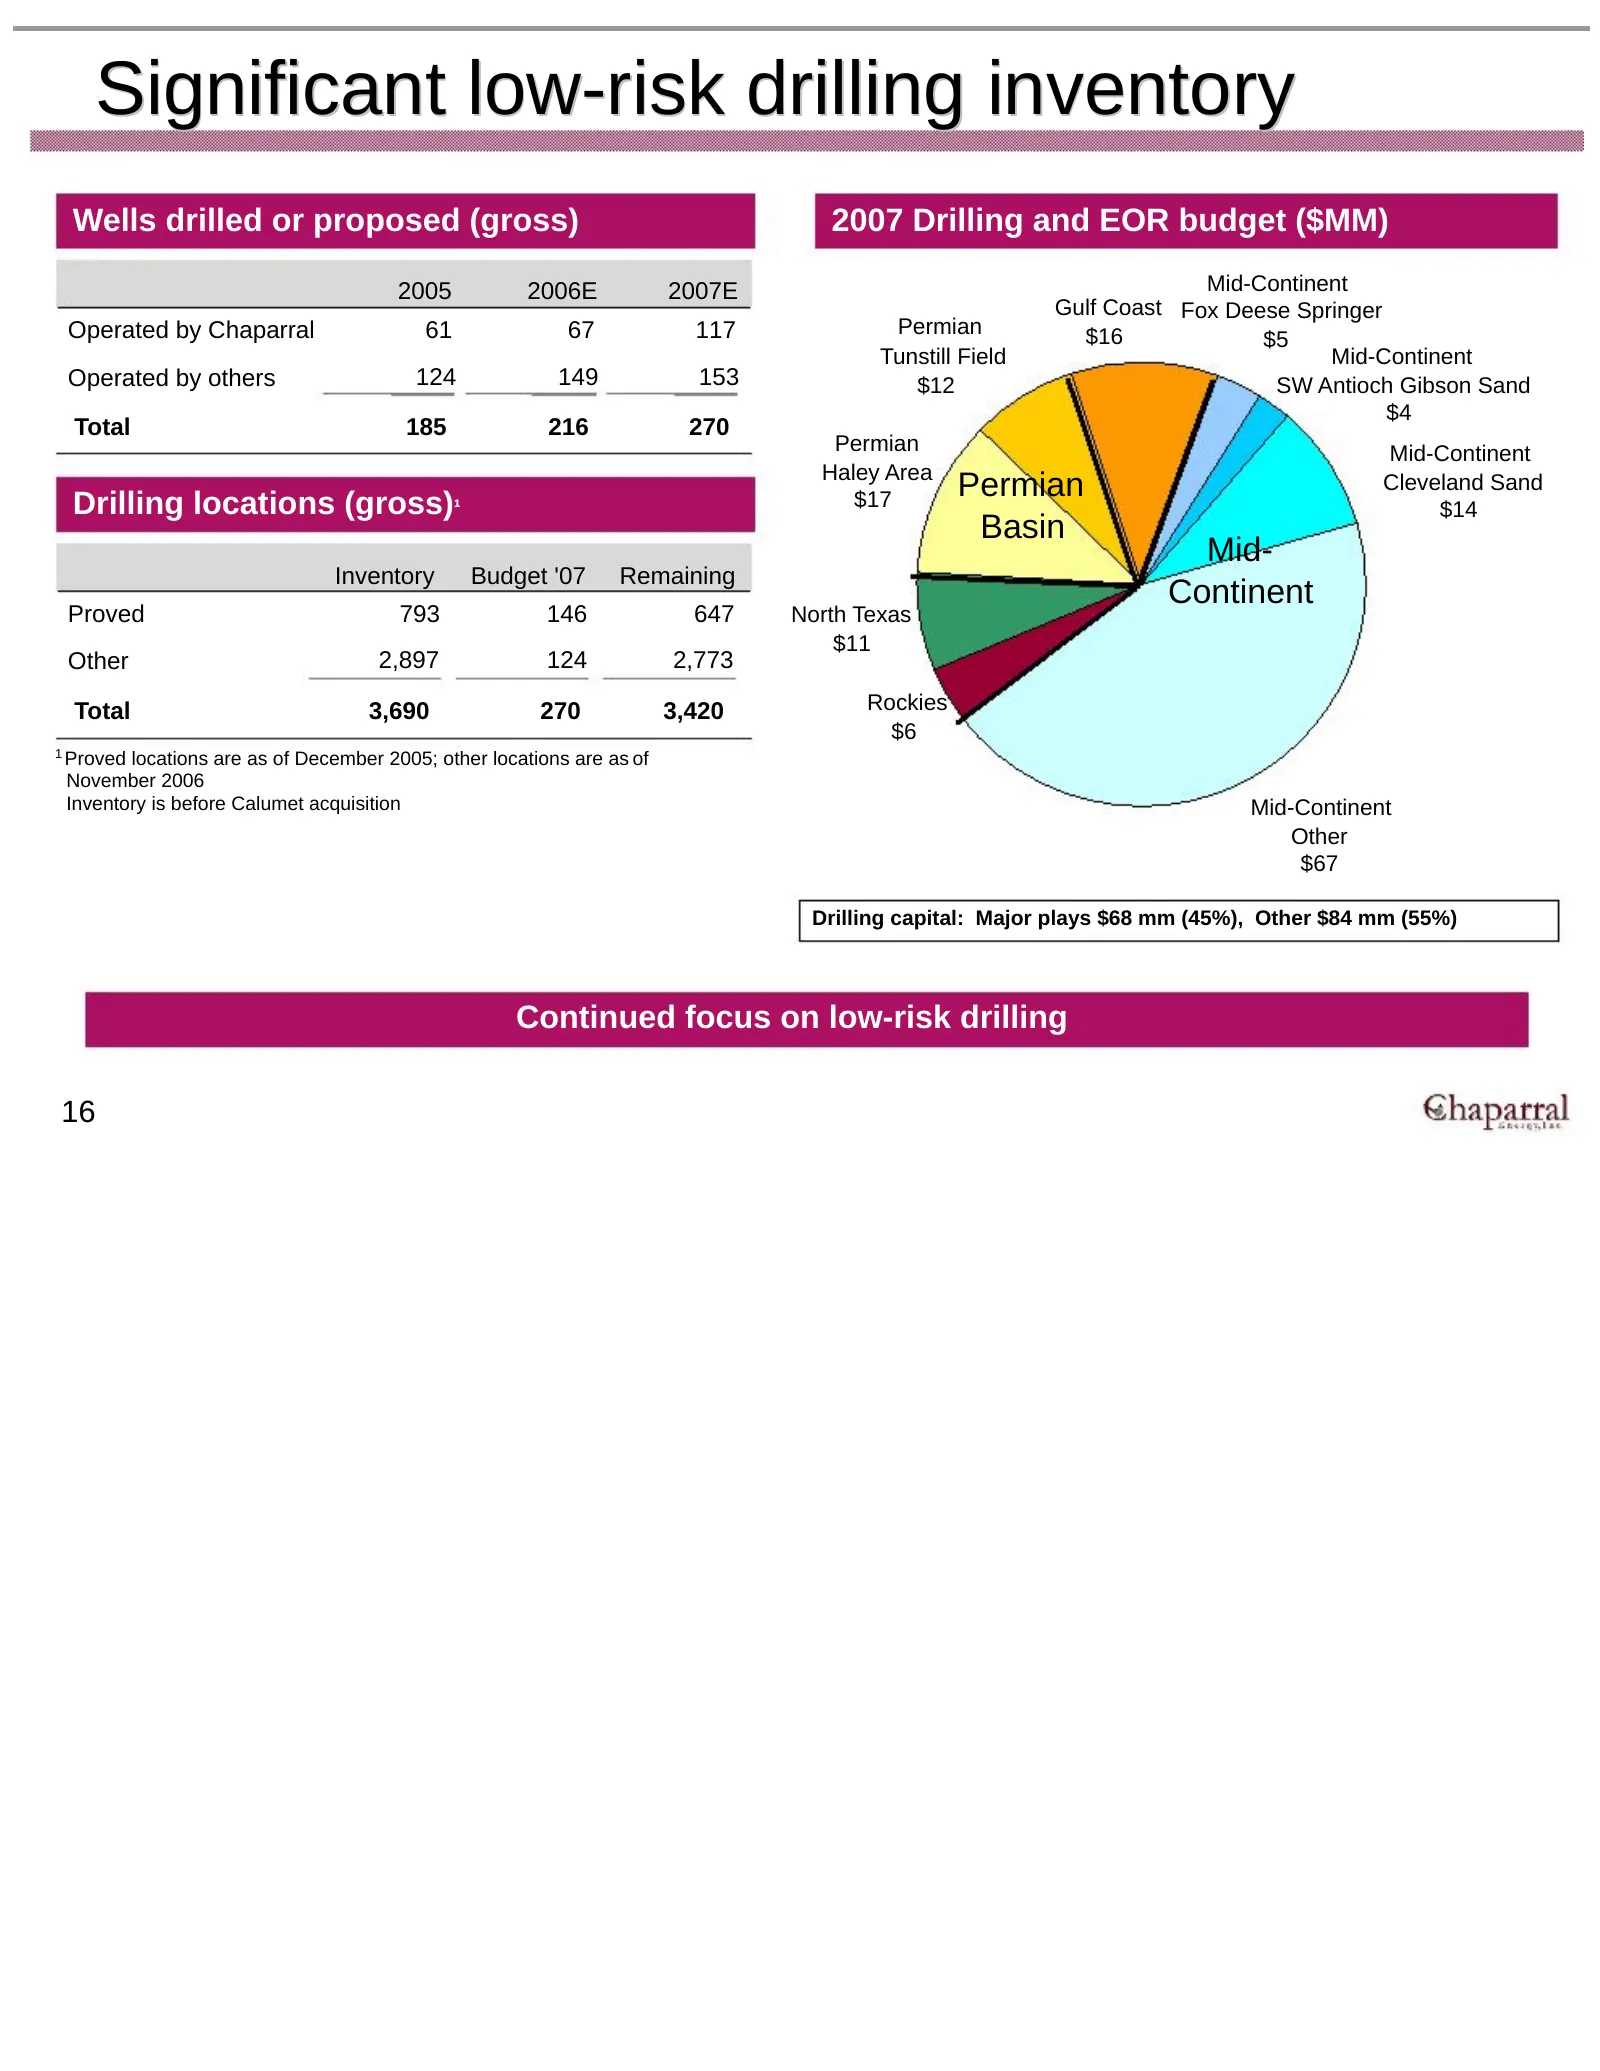
Significant low-risk drilling inventory Wells drilled or proposed (gross) 2007 Drilling and EOR budget ($MM) 2005 2006E 2007E Mid-Continent Gulf Coast Fox Deese Springer Operated by Chaparral 61 67 117 Permian $16 $5 Tunstill Field Mid-Continent Operated by others 124 149 153 $12 SW Antioch Gibson S
Slide 18: Southwest Antioch Gibson Sand Unit
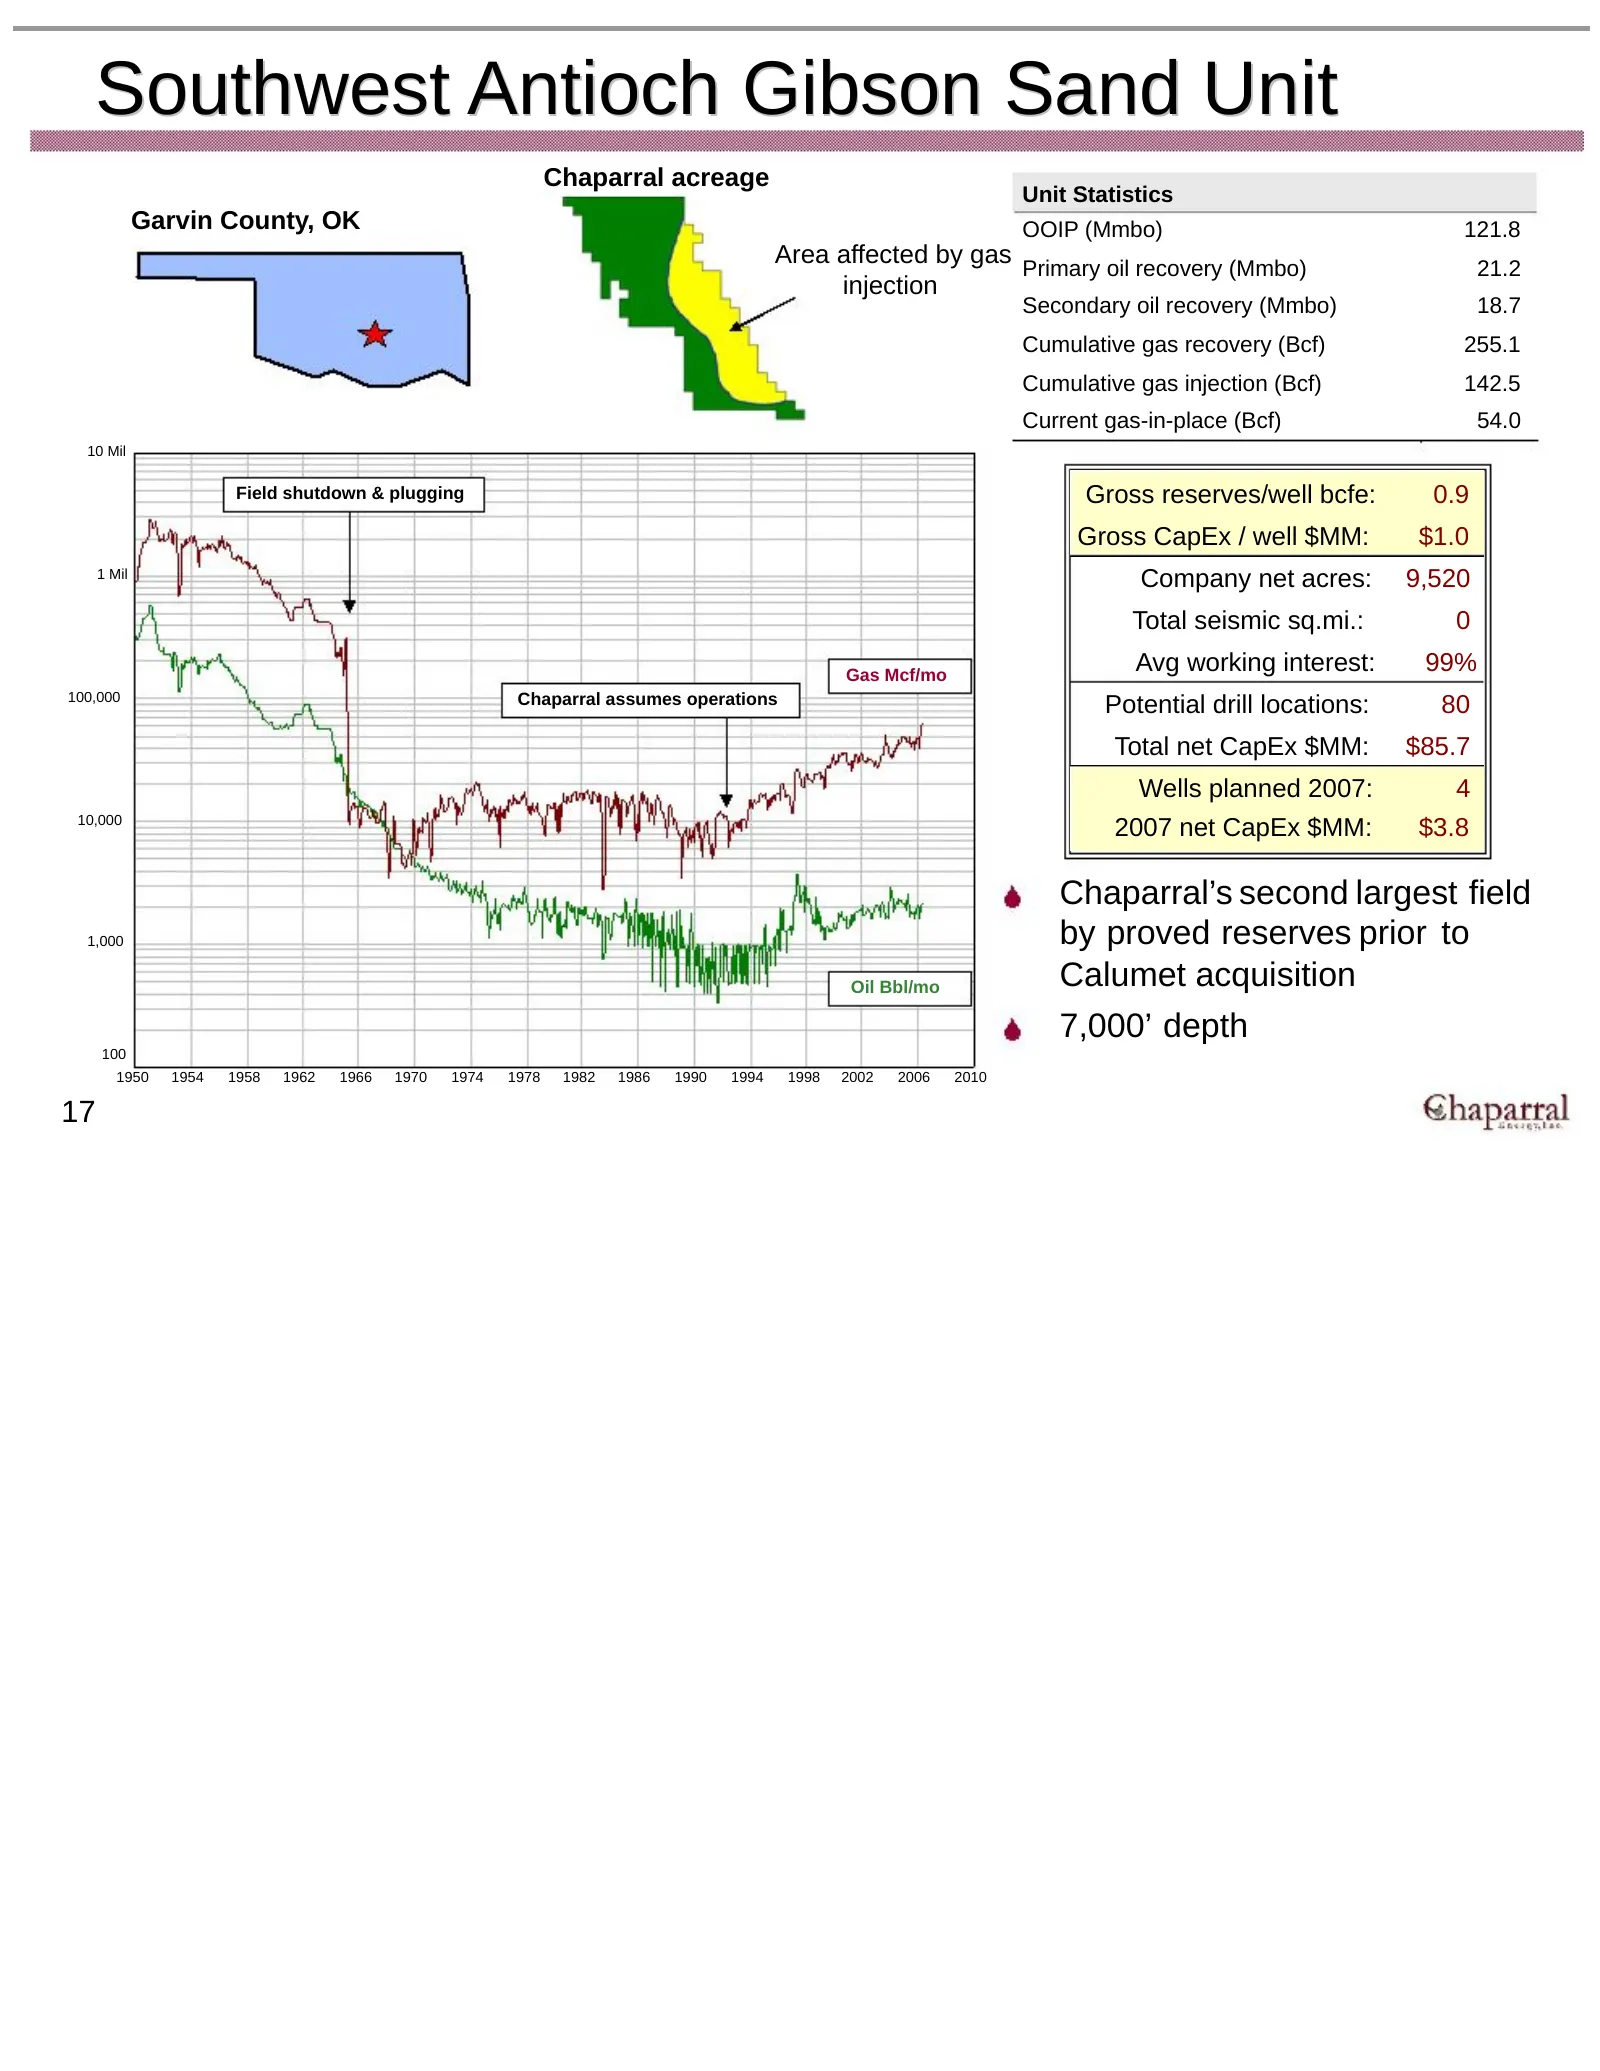
Southwest Antioch Gibson Sand Unit Chaparral acreage Unit Statistics Garvin County, OK OOIP (Mmbo) 121.8 Area affected by gas Primary oil recovery (Mmbo) 21.2 injection Secondary oil recovery (Mmbo) 18.7 Cumulative gas recovery (Bcf) 255.1 Cumulative gas injection (Bcf) 142.5 Current gas-in-place (B
Slide 19: Cleveland Sand Play
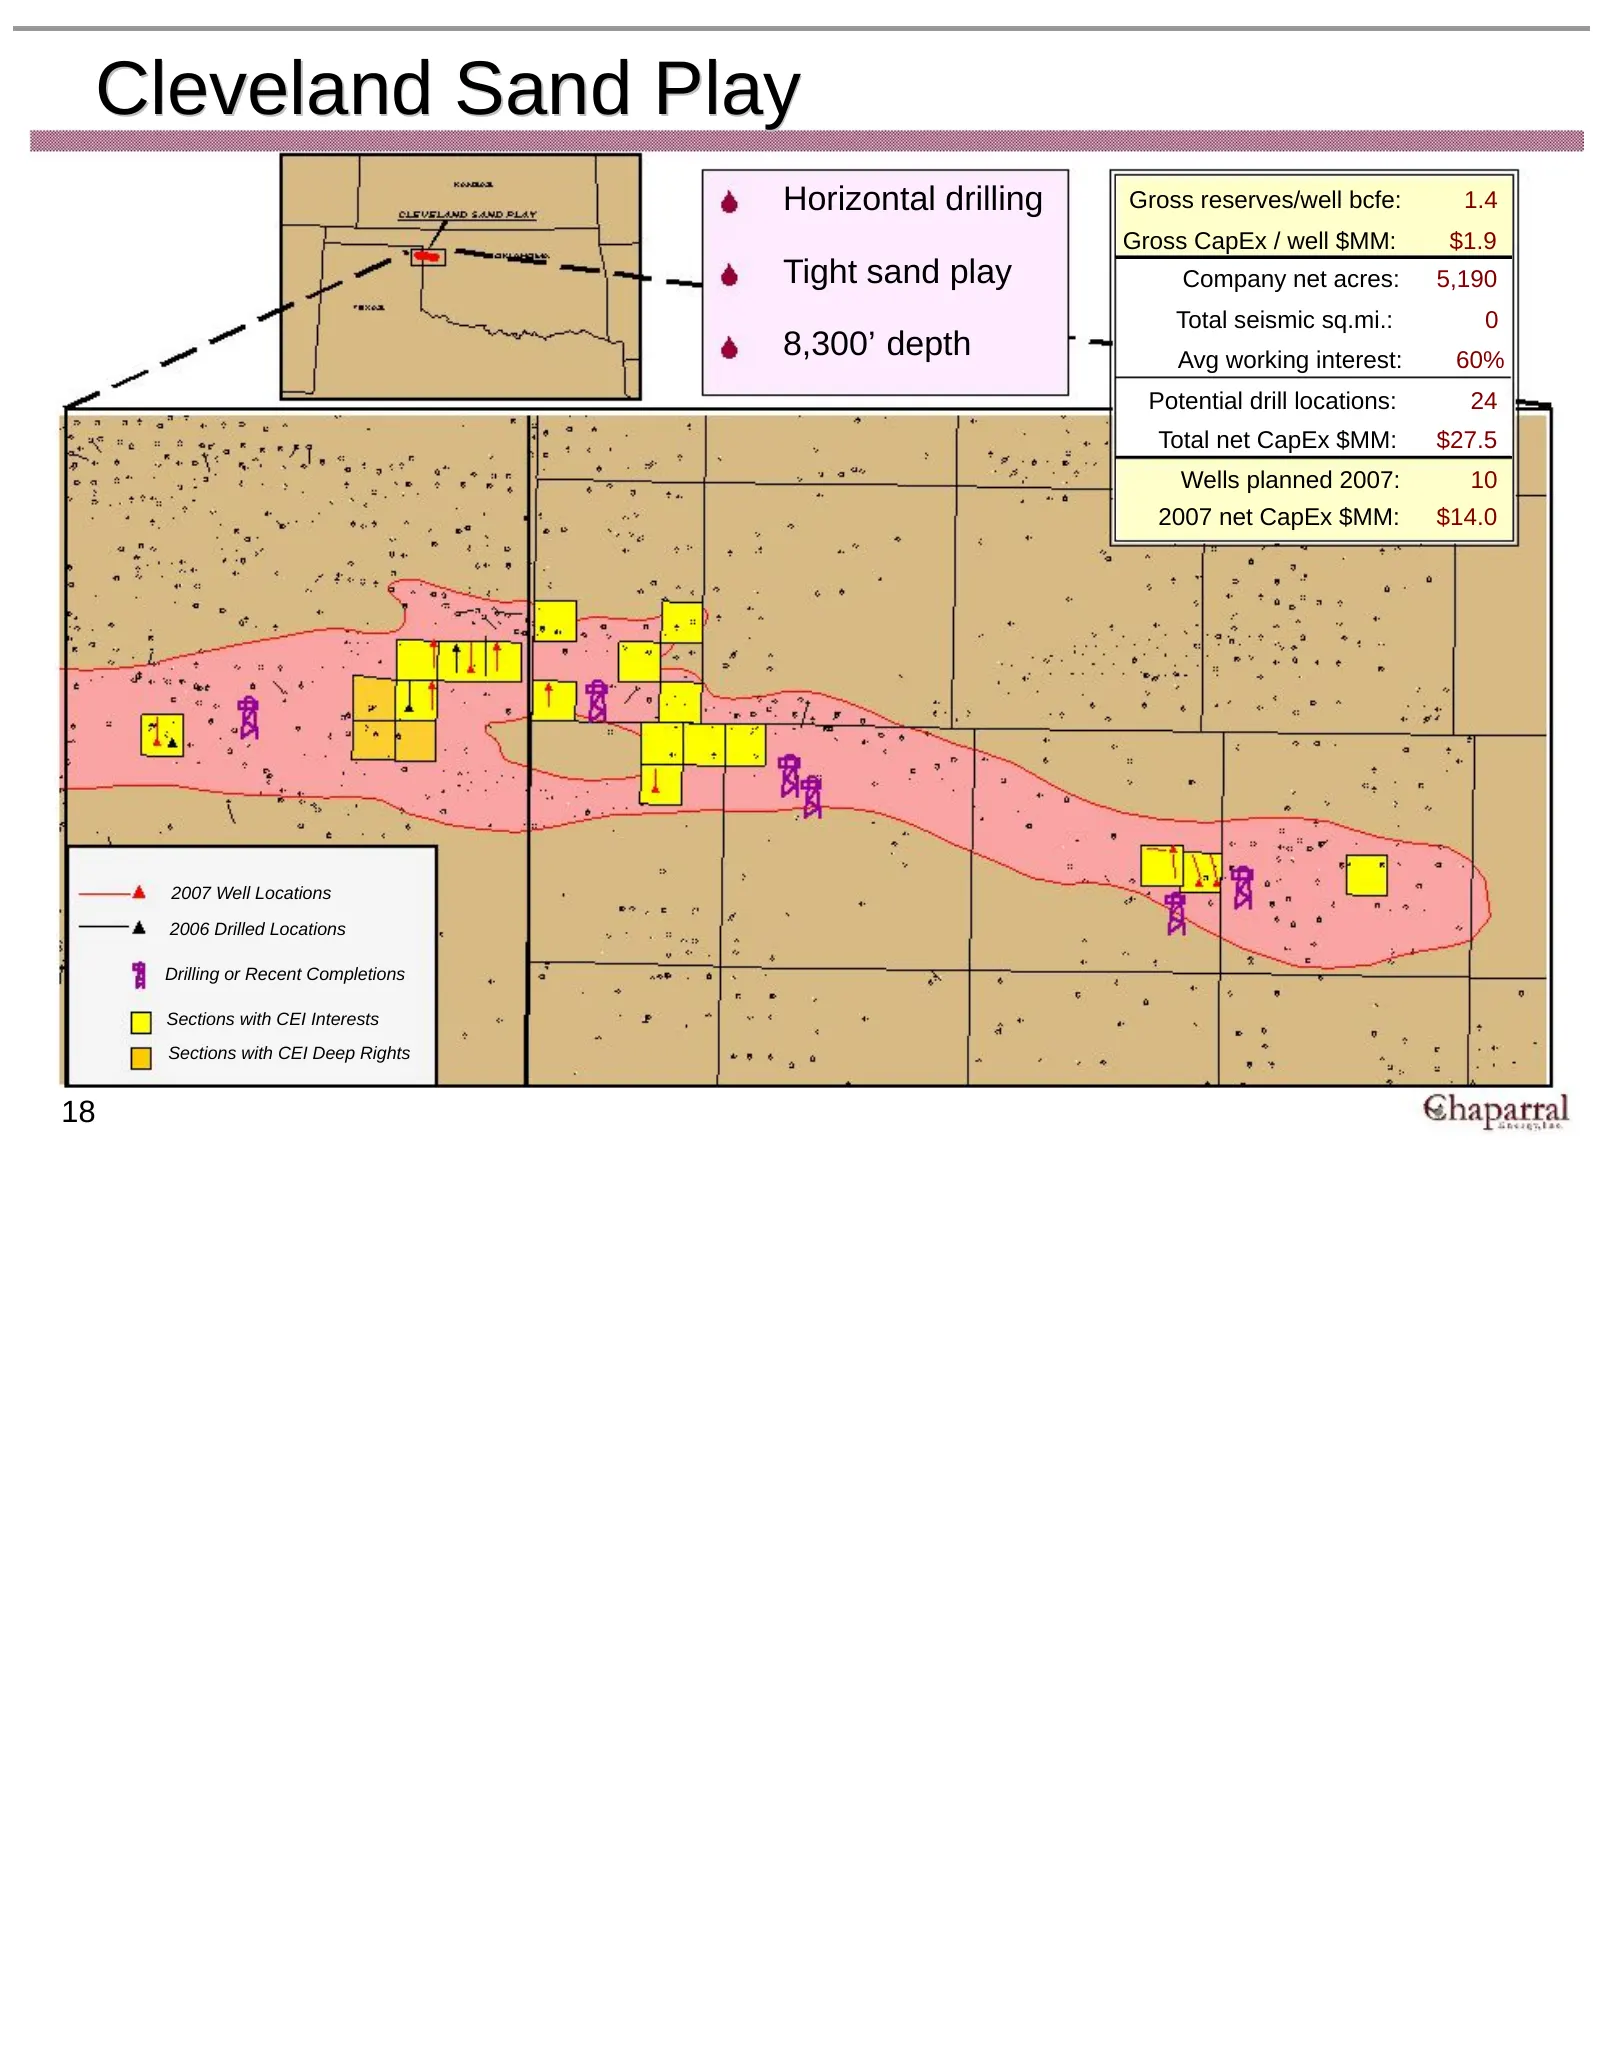
Cleveland Sand Play Horizontal drilling Gross reserves/well bcfe: 1.4 Gross CapEx / well $MM: $1.9 Tight sand play Company net acres: 5,190 Total seismic sq.mi.: 0 8,300’ depth Avg working interest: 60% Potential drill locations: 24 Total net CapEx $MM: $27.5 Wells planned 2007: 10 2007 net CapEx $M
Slide 20: Fox Deese Springer Unit
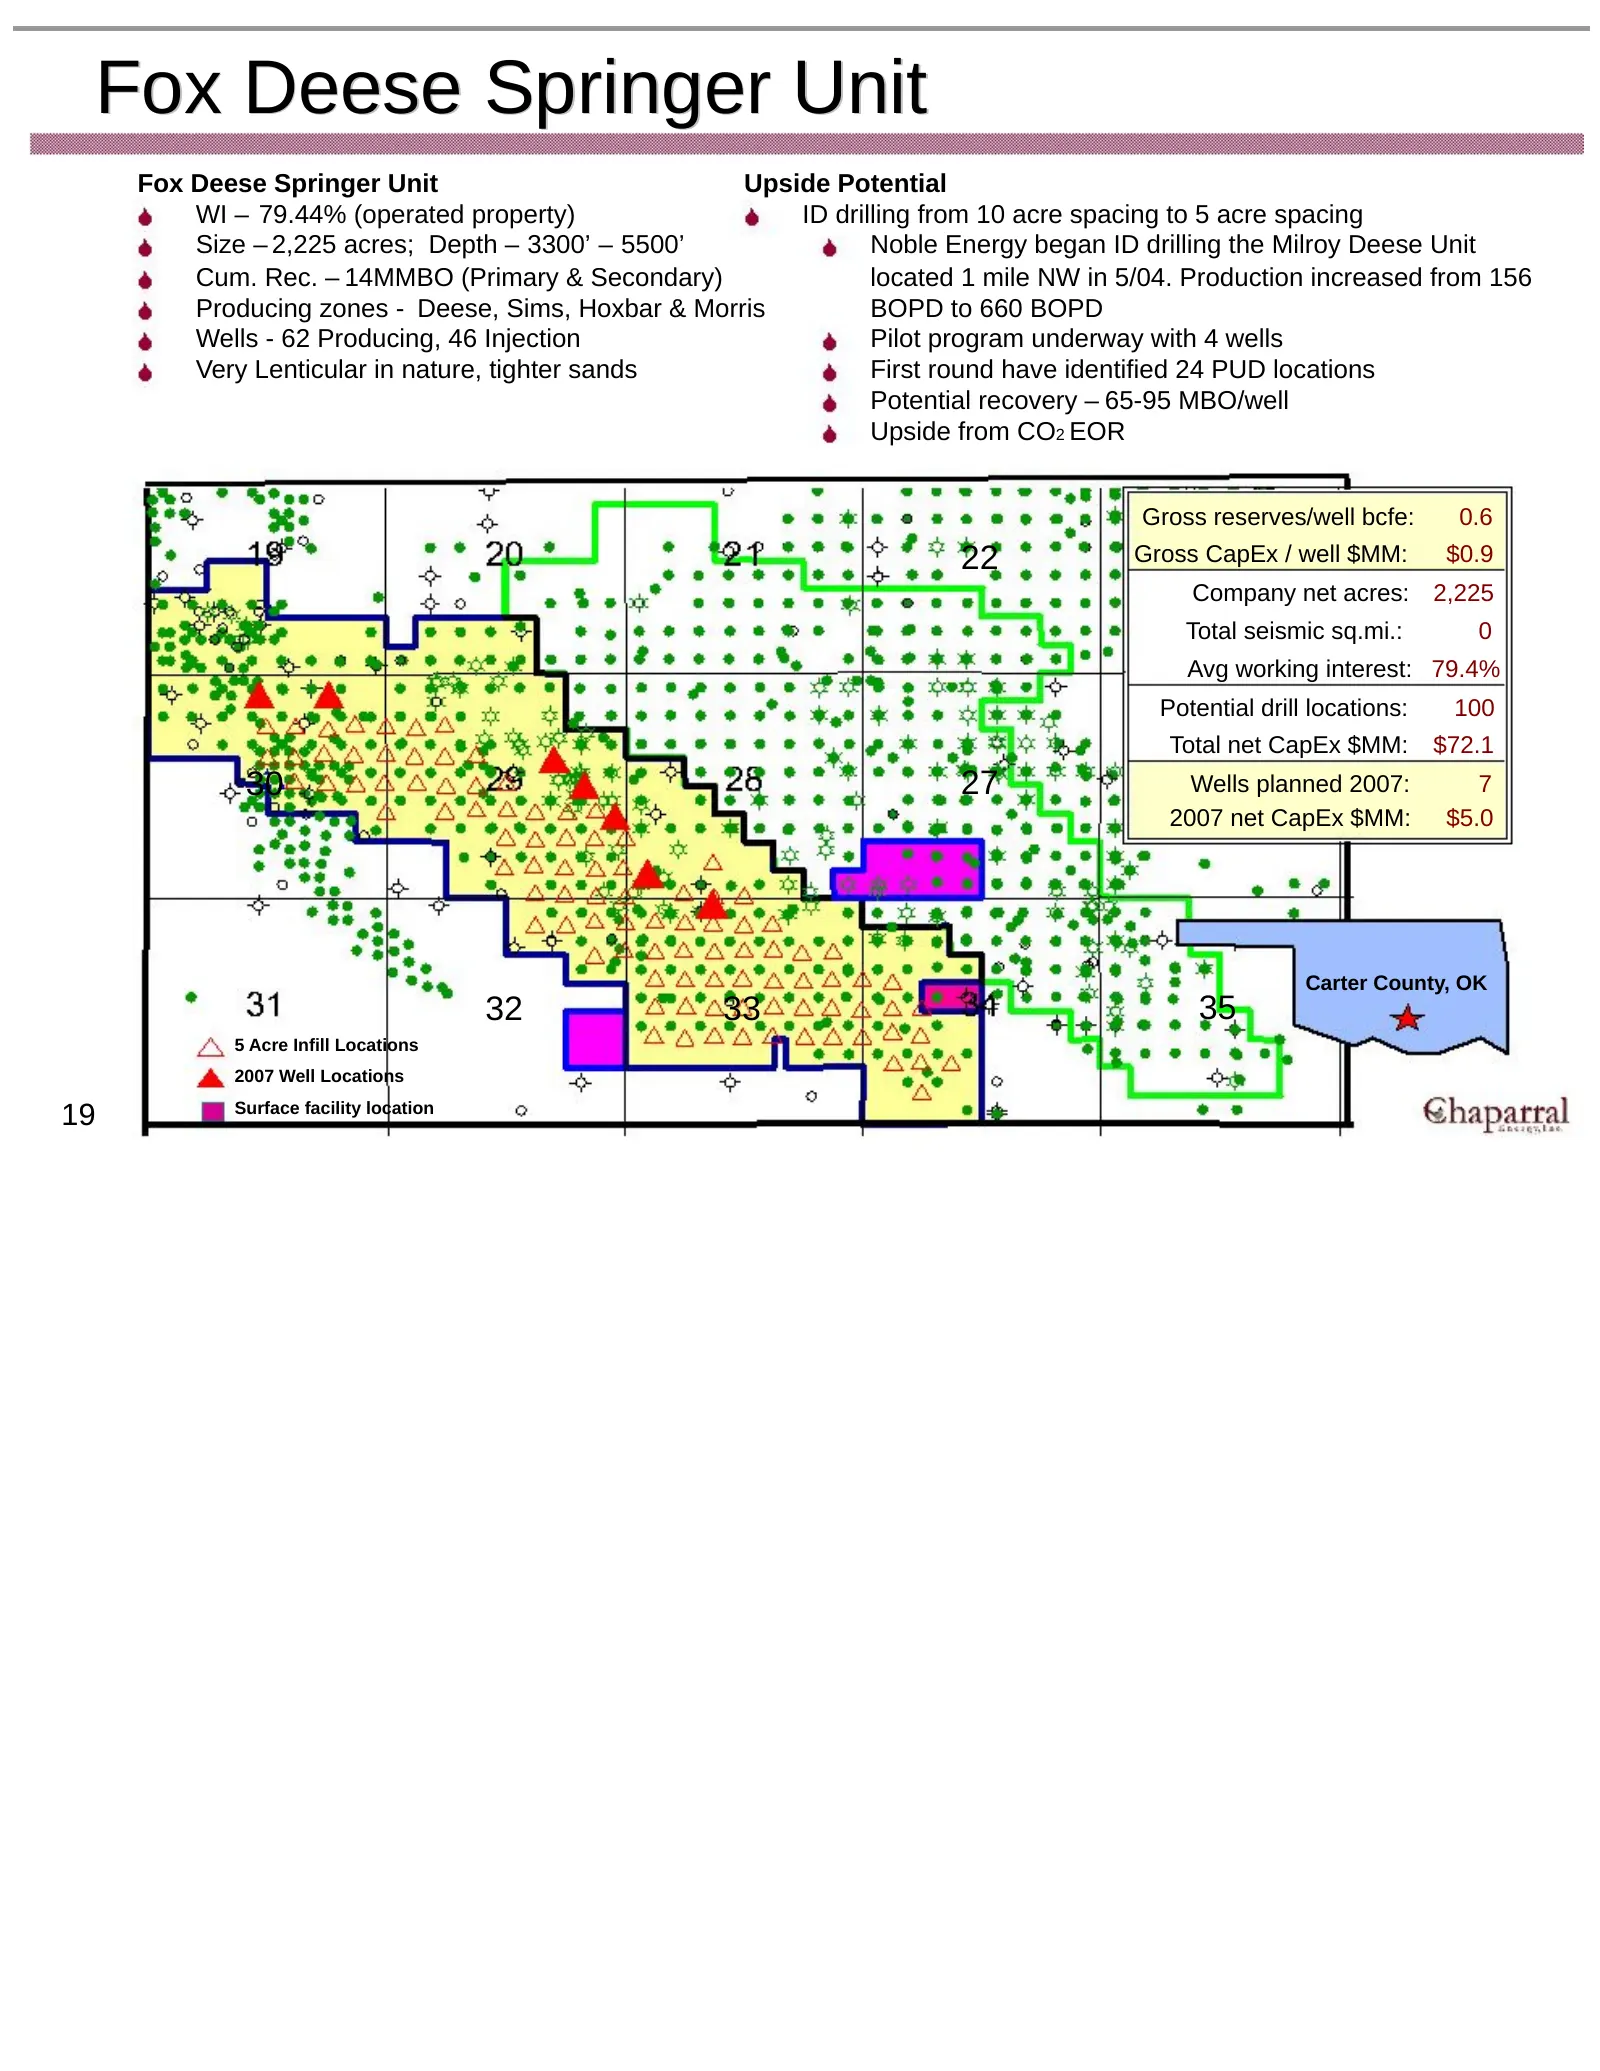
Fox Deese Springer Unit Fox Deese Springer Unit Upside Potential WI – 79.44% (operated property) ID drilling from 10 acre spacing to 5 acre spacing Size – 2,225 acres; Depth – 3300’ – 5500’ Noble Energy began ID drilling the Milroy Deese Unit Cum. Rec. – 14MMBO (Primary & Secondary) located 1 mile N
Slide 21: Tunstill Field Play
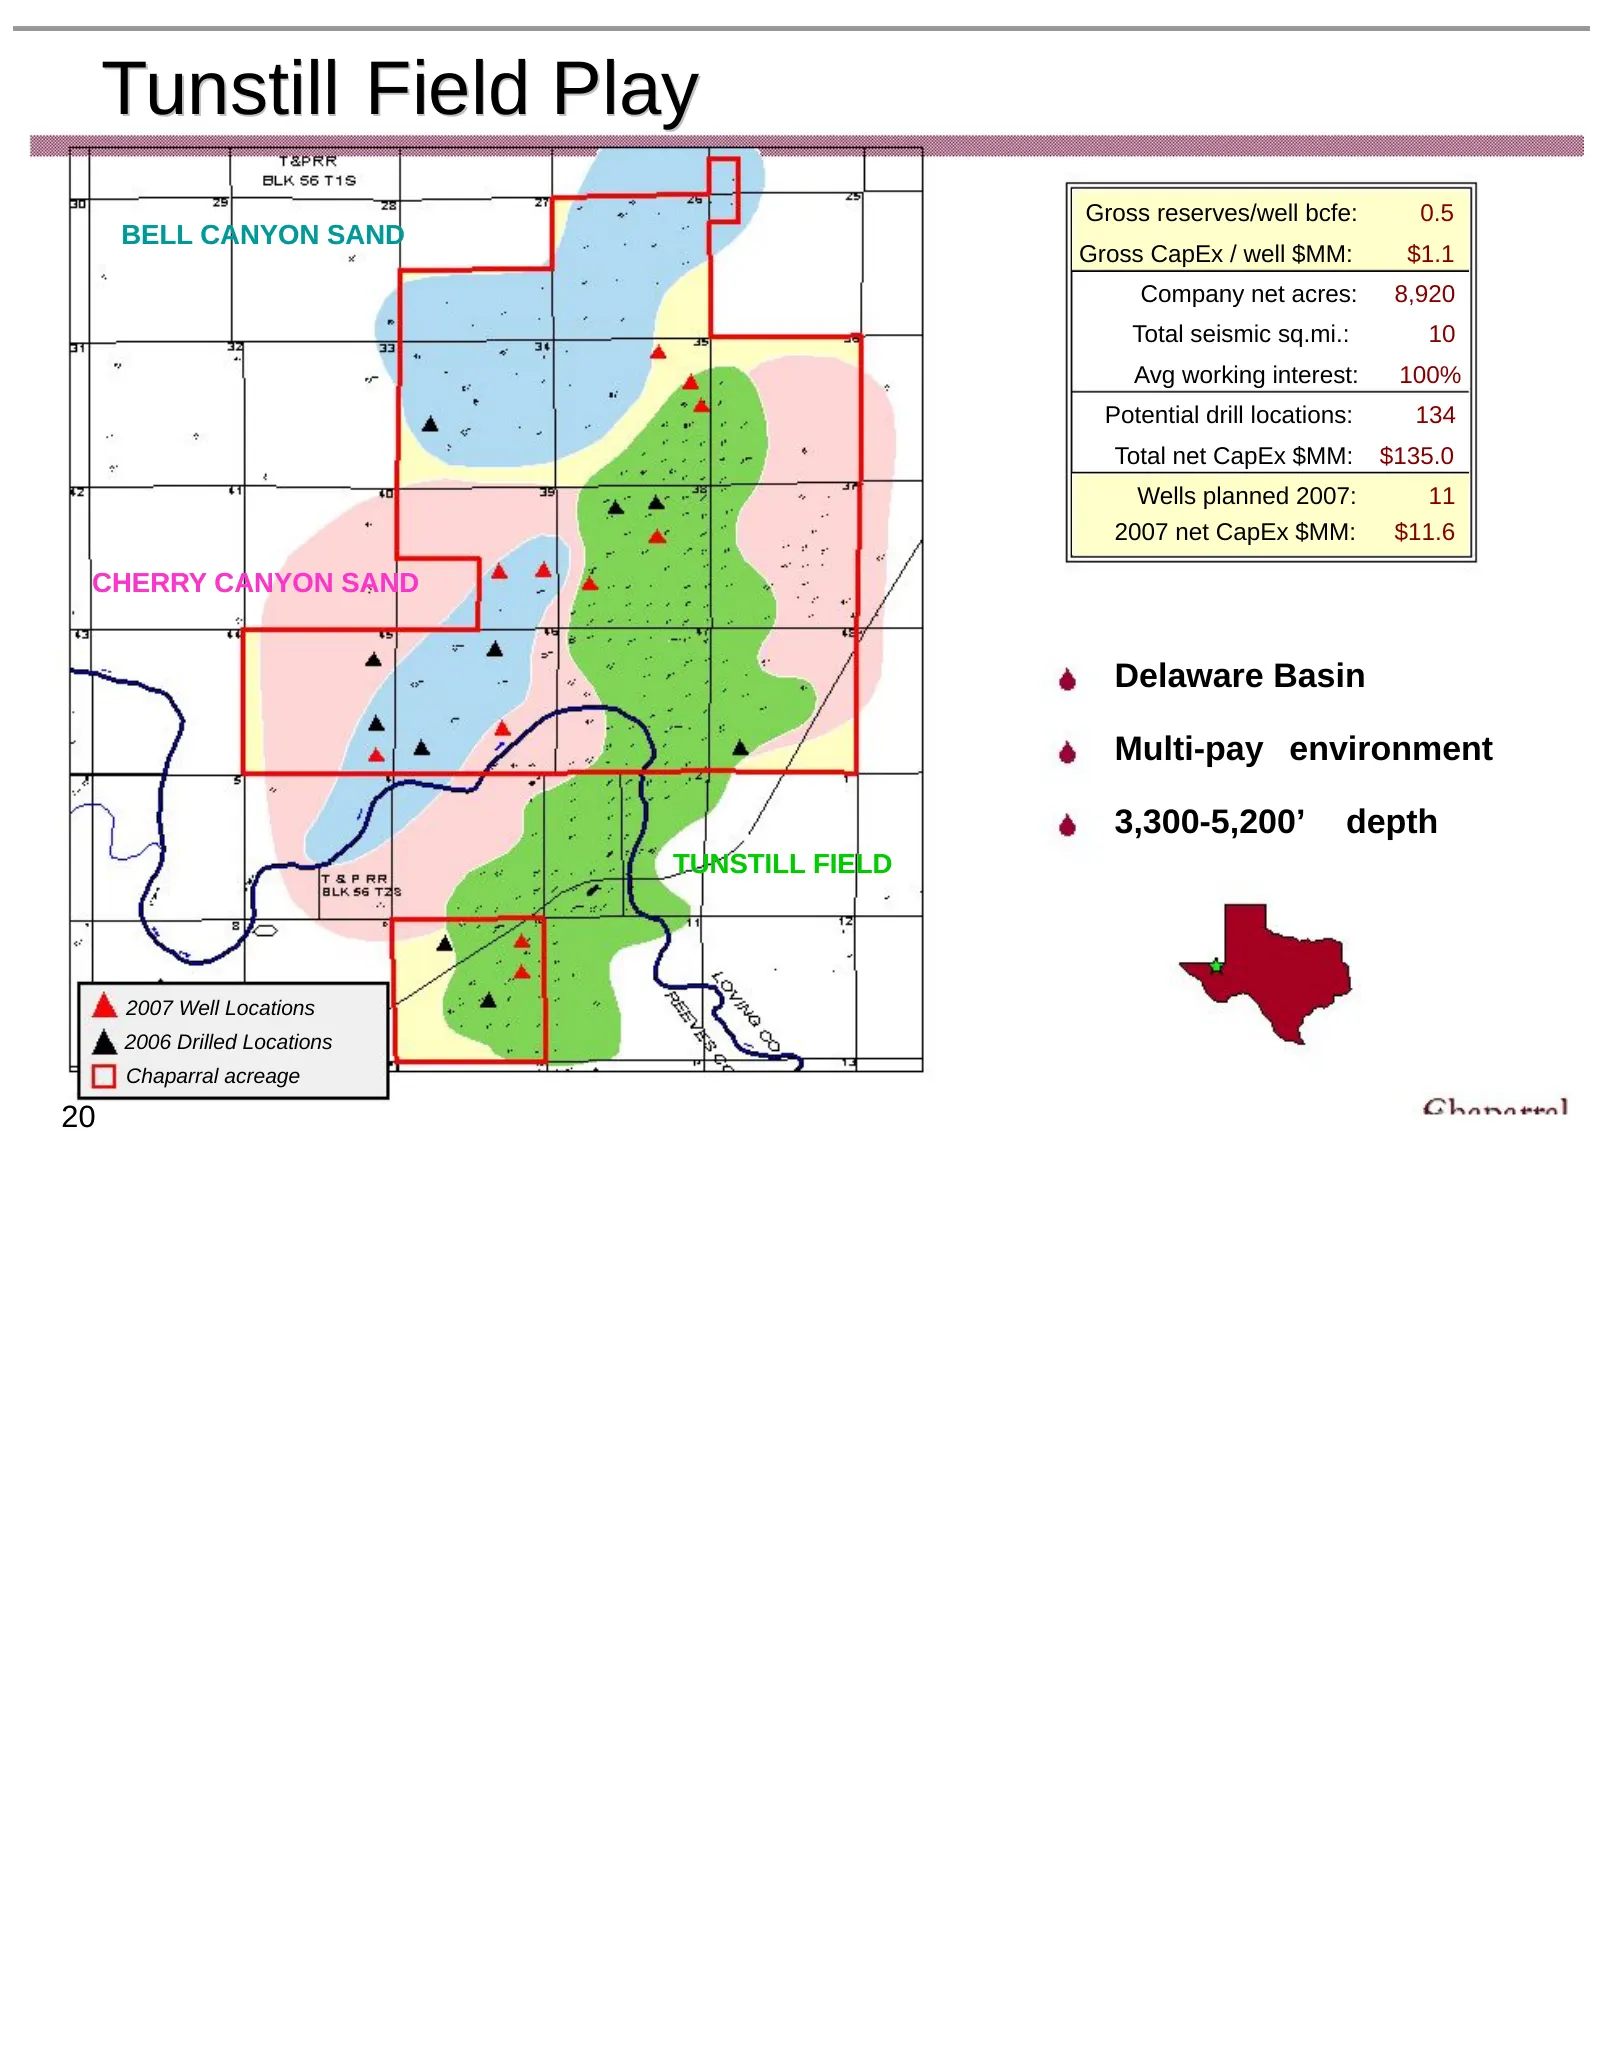
Tunstill Field Play Gross reserves/well bcfe: 0.5 BELL CANYON SAND Gross CapEx / well $MM: $1.1 Company net acres: 8,920 Total seismic sq.mi.: 10 Avg working interest: 100% Potential drill locations: 134 Total net CapEx $MM: $135.0 Wells planned 2007: 11 2007 net CapEx $MM: $11.6 CHERRY CANYON SAND
Slide 22: Haley Area Play
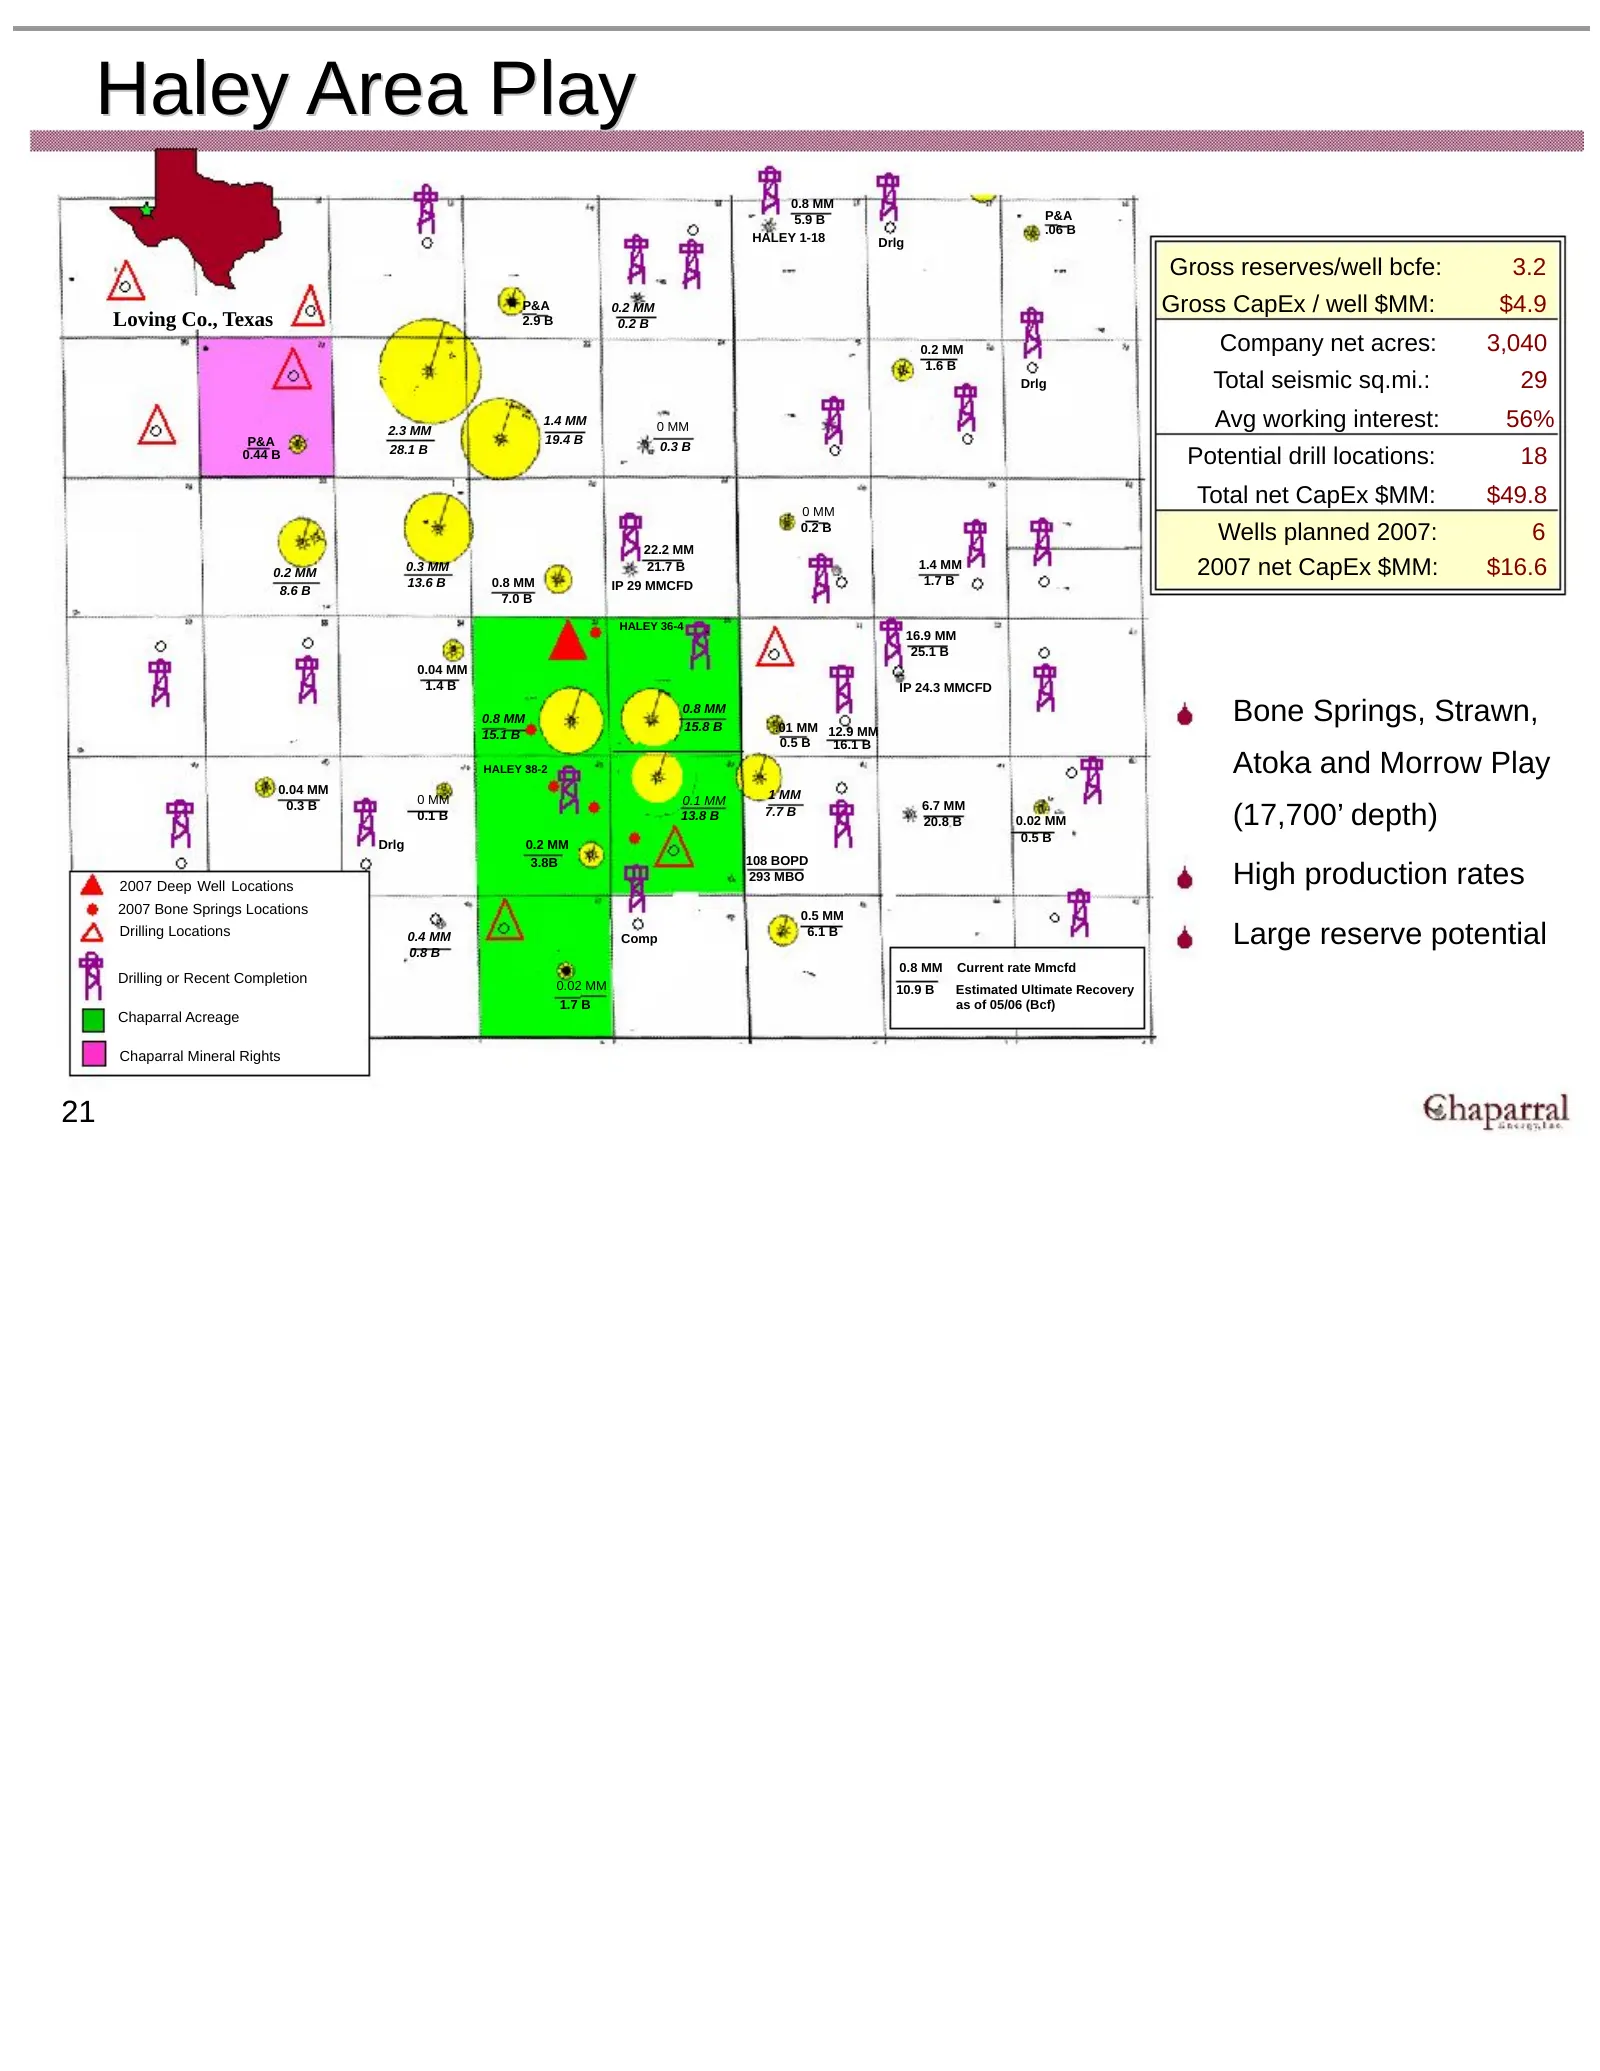
Haley Area Play 0.8 MM 5.9 B P&A .06 B HALEY 1-18 Drlg Gross reserves/well bcfe: 3.2 P&A 0.2 MM Gross CapEx / well $MM: $4.9 Loving Co., Texas 2.9 B 0.2 B 0.2 MM Company net acres: 3,040 1.6 B Drlg Total seismic sq.mi.: 29 2.3 MM 1.4 MM 0 MM Avg working interest: 56% P&A 19.4 B 0.3 B 0.44 B 28.1 B P
Slide 23: Gulf Coast Play
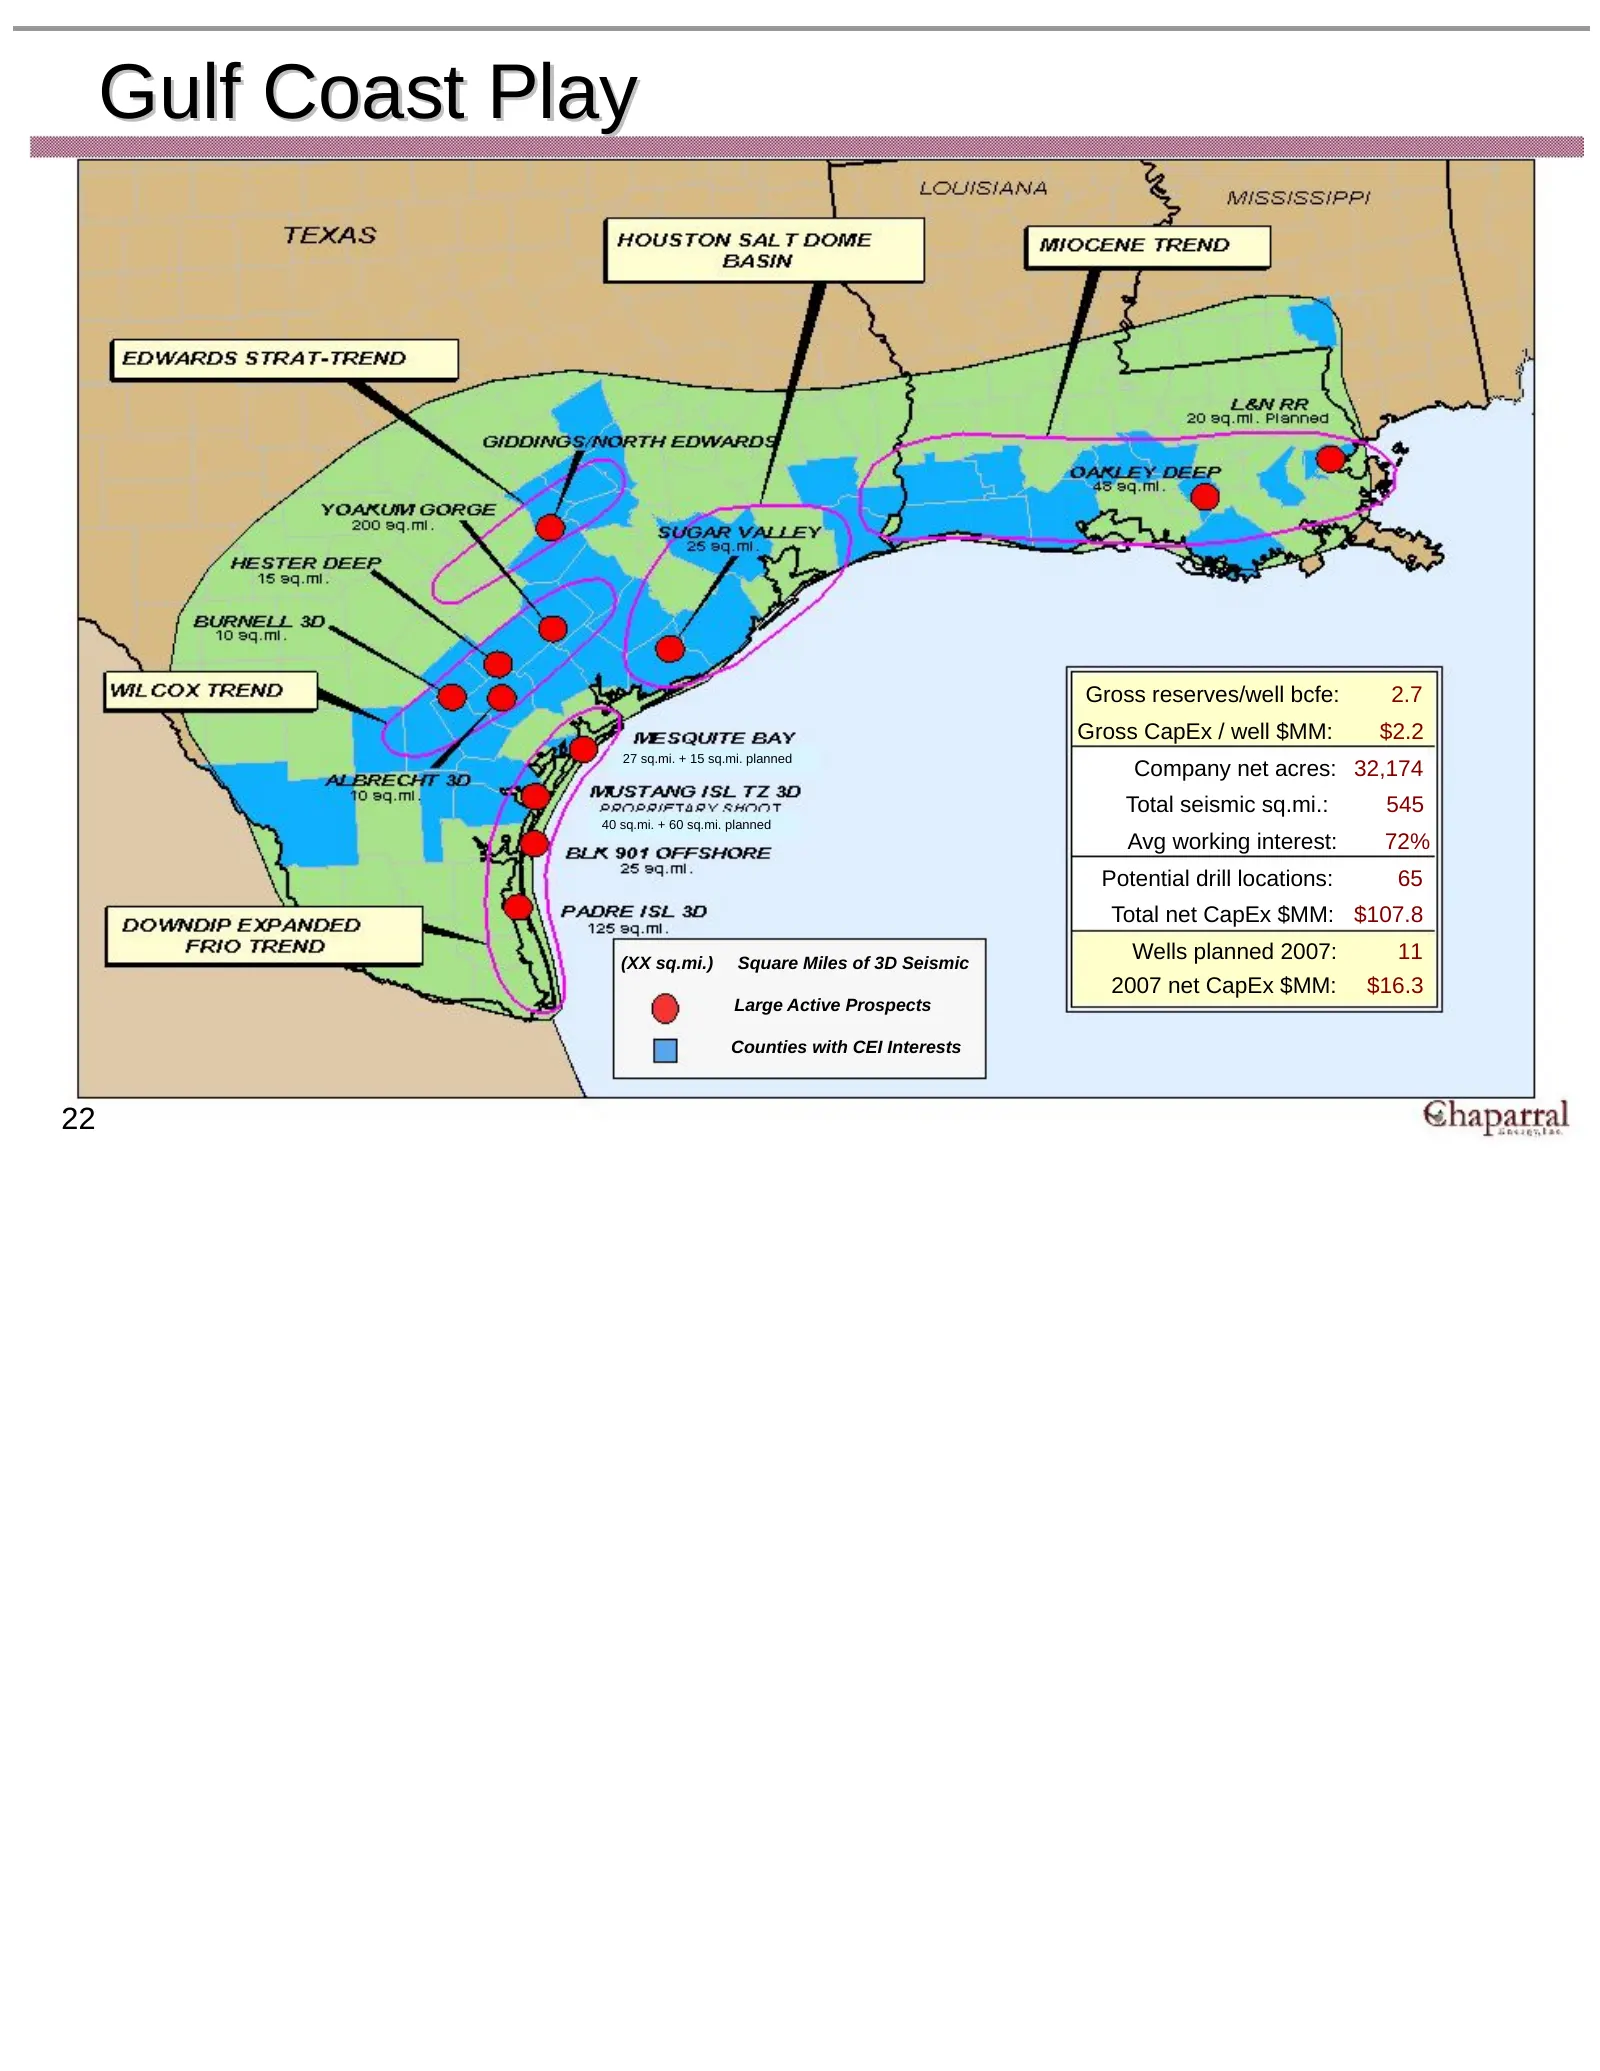
Gulf Coast Play Gross reserves/well bcfe: 2.7 Gross CapEx / well $MM: $2.2 27 sq.mi. + 15 sq.mi. planned Company net acres: 32,174 Total seismic sq.mi.: 545 40 sq.mi. + 60 sq.mi. planned Avg working interest: 72% Potential drill locations: 65 Total net CapEx $MM: $107.8 (XX sq.mi.) Square Miles of 3
Slide 24: North Burbank Unit
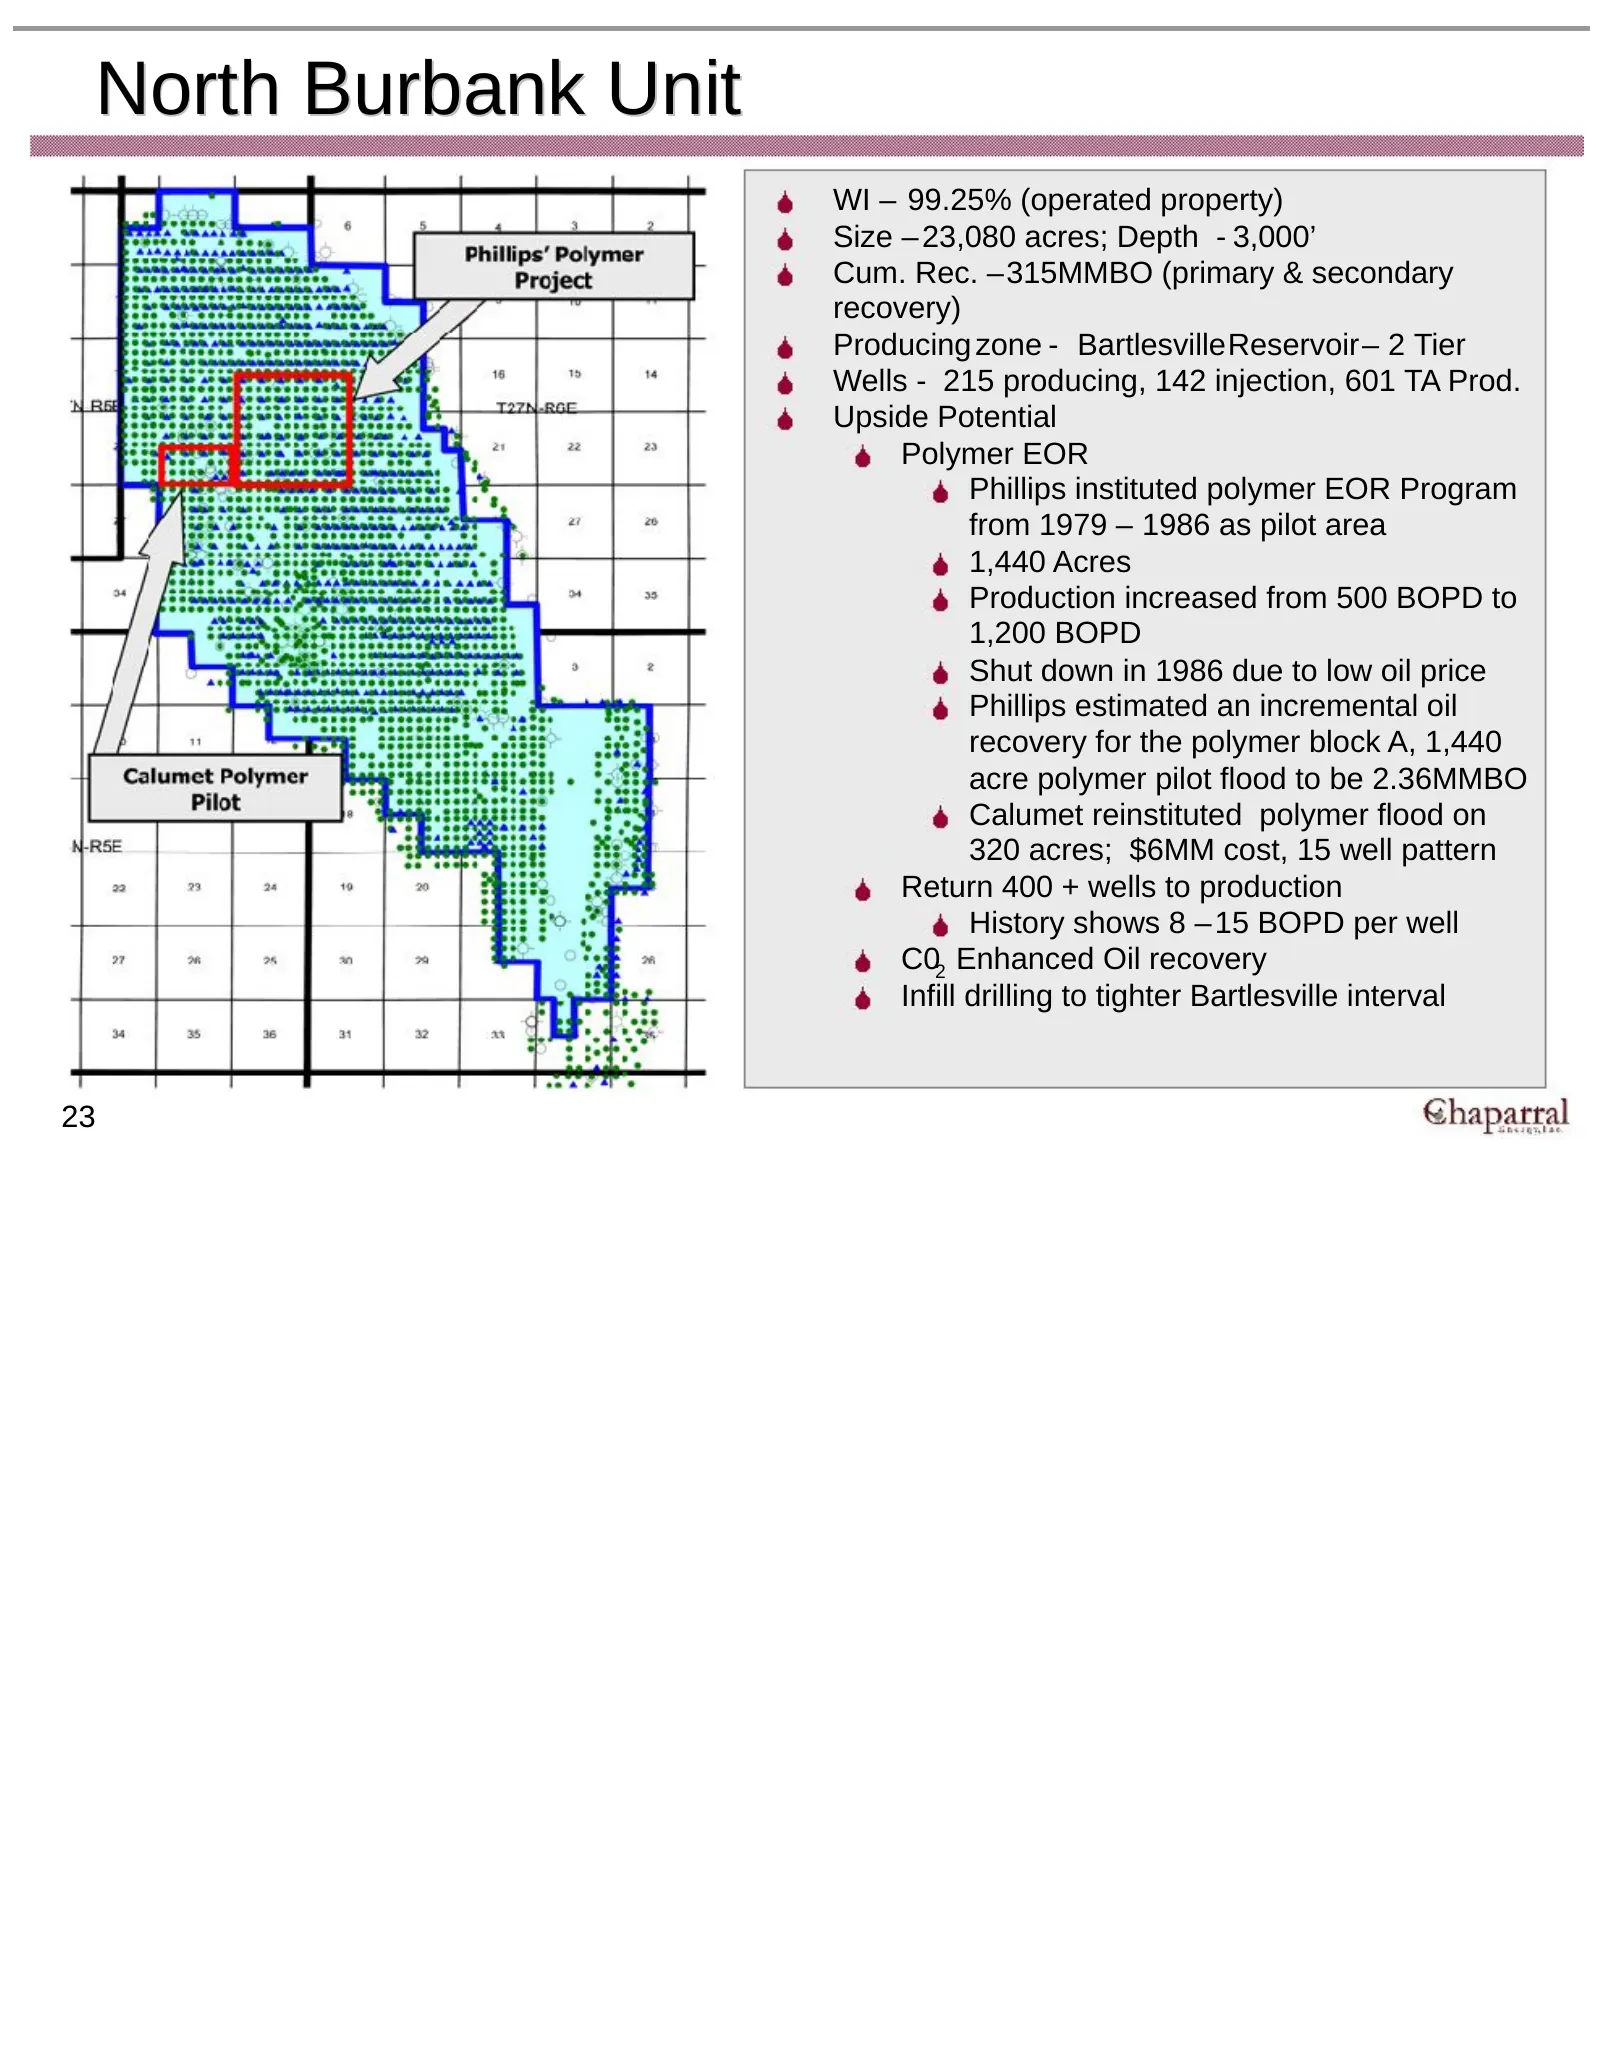
North Burbank Unit WI – 99.25% (operated property) Size – 23,080 acres; Depth - 3,000’ Cum. Rec. –315MMBO (primary & secondary recovery) Producing zone - BartlesvilleReservoir– 2 Tier Wells - 215 producing, 142 injection, 601 TA Prod. Upside Potential Polymer EOR Phillips instituted polymer EOR Prog
Slide 25: Substantial upside with CO2 tertiary recovery
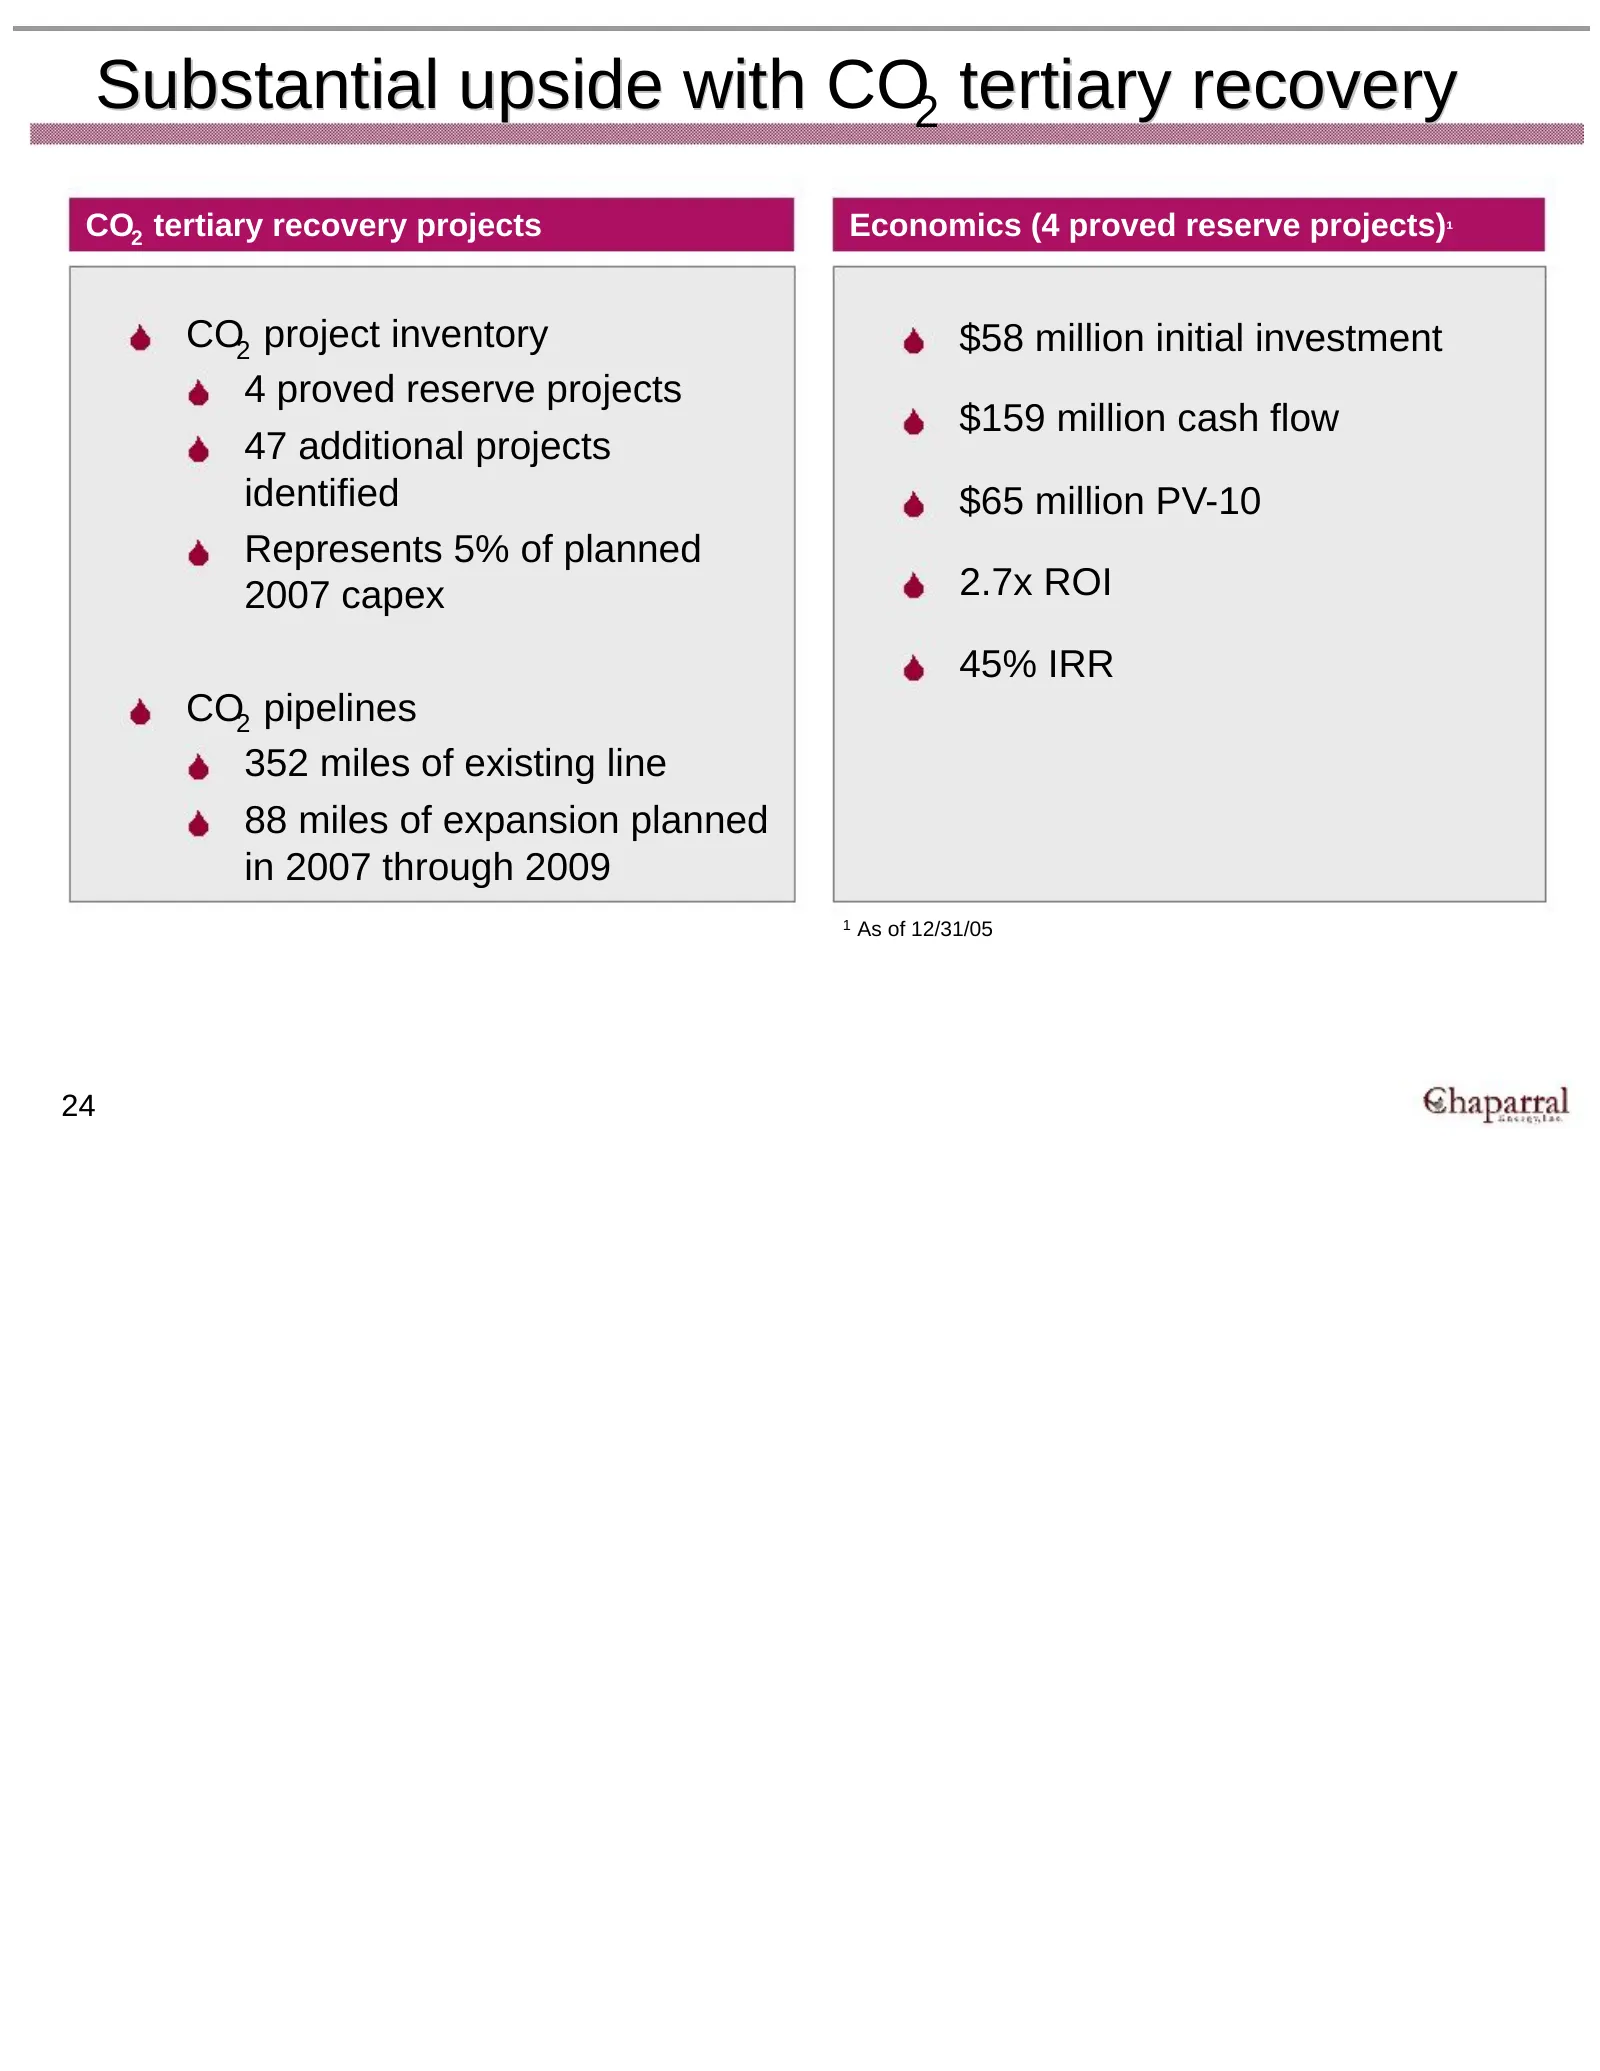
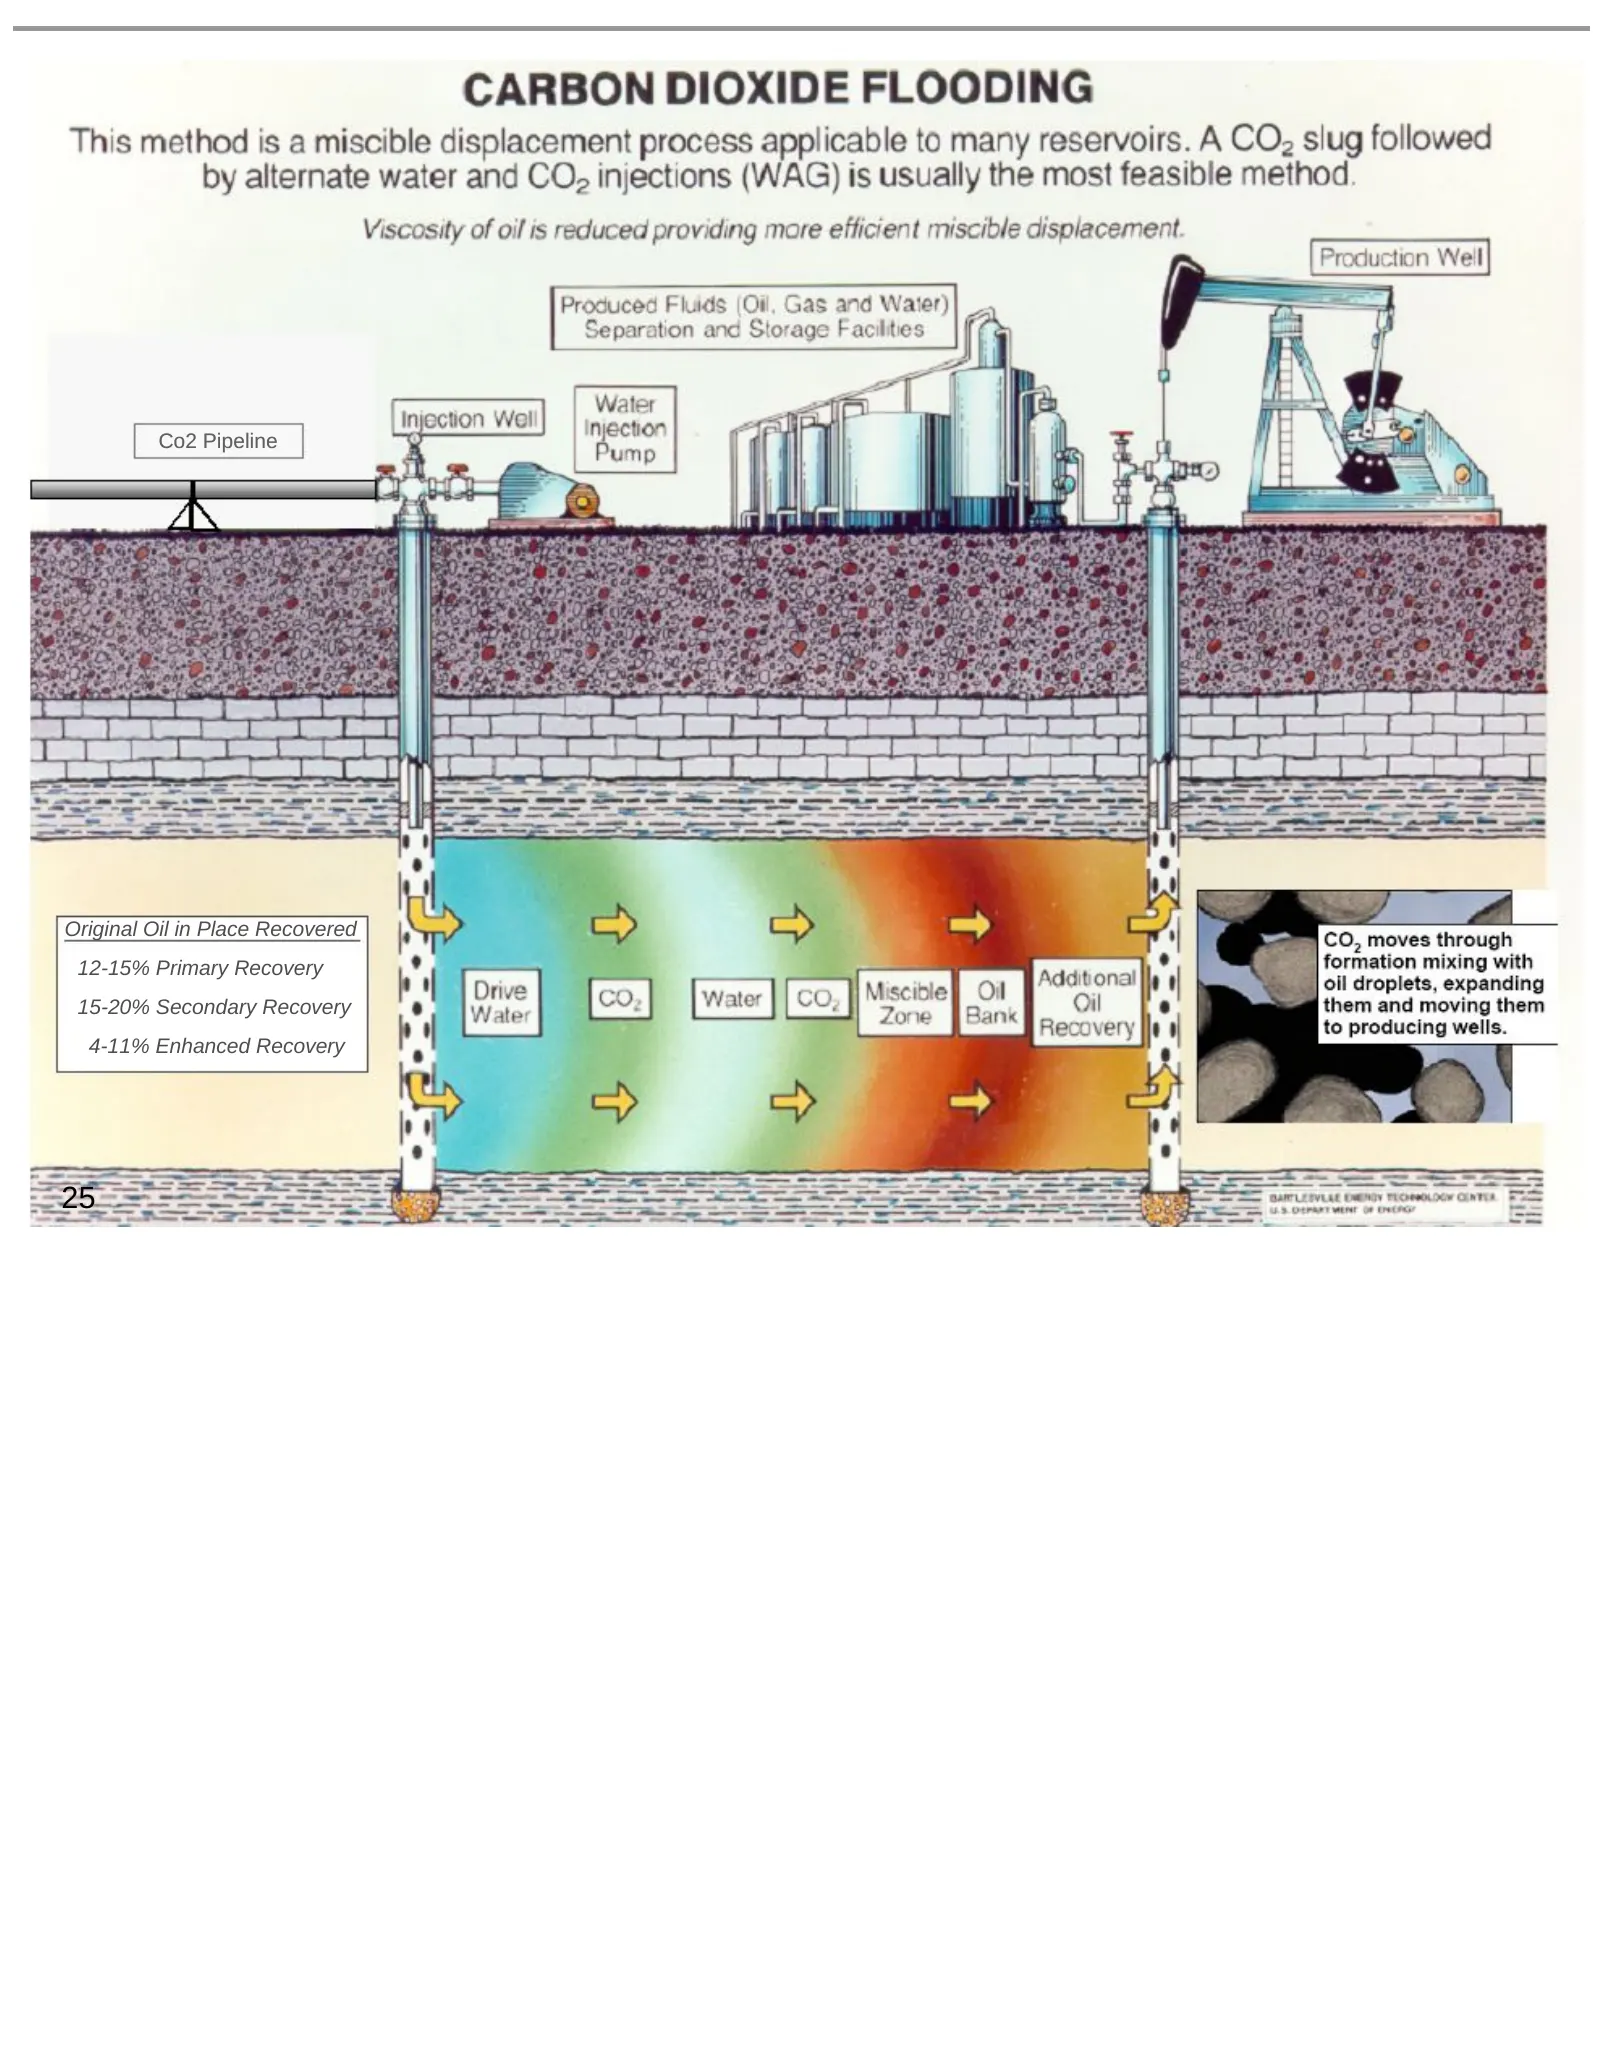
Substantial upside with CO2 tertiary recovery CO2 tertiary recovery projects Economics (4 proved reserve projects)¹ CO2 project inventory $58 million initial investment 4 proved reserve projects $159 million cash flow 47 additional projects identified $65 million PV-10 Represents 5% of planned 2007
Slide 26: CO2 Pipeline / Oil in Place Recovered
Co2 Pipeline Original Oil in Place Recovered 12-15% Primary Recovery 15-20% Secondary Recovery 4-11% Enhanced Recovery 25
Slide 27: Camrick area CO2 tertiary recovery
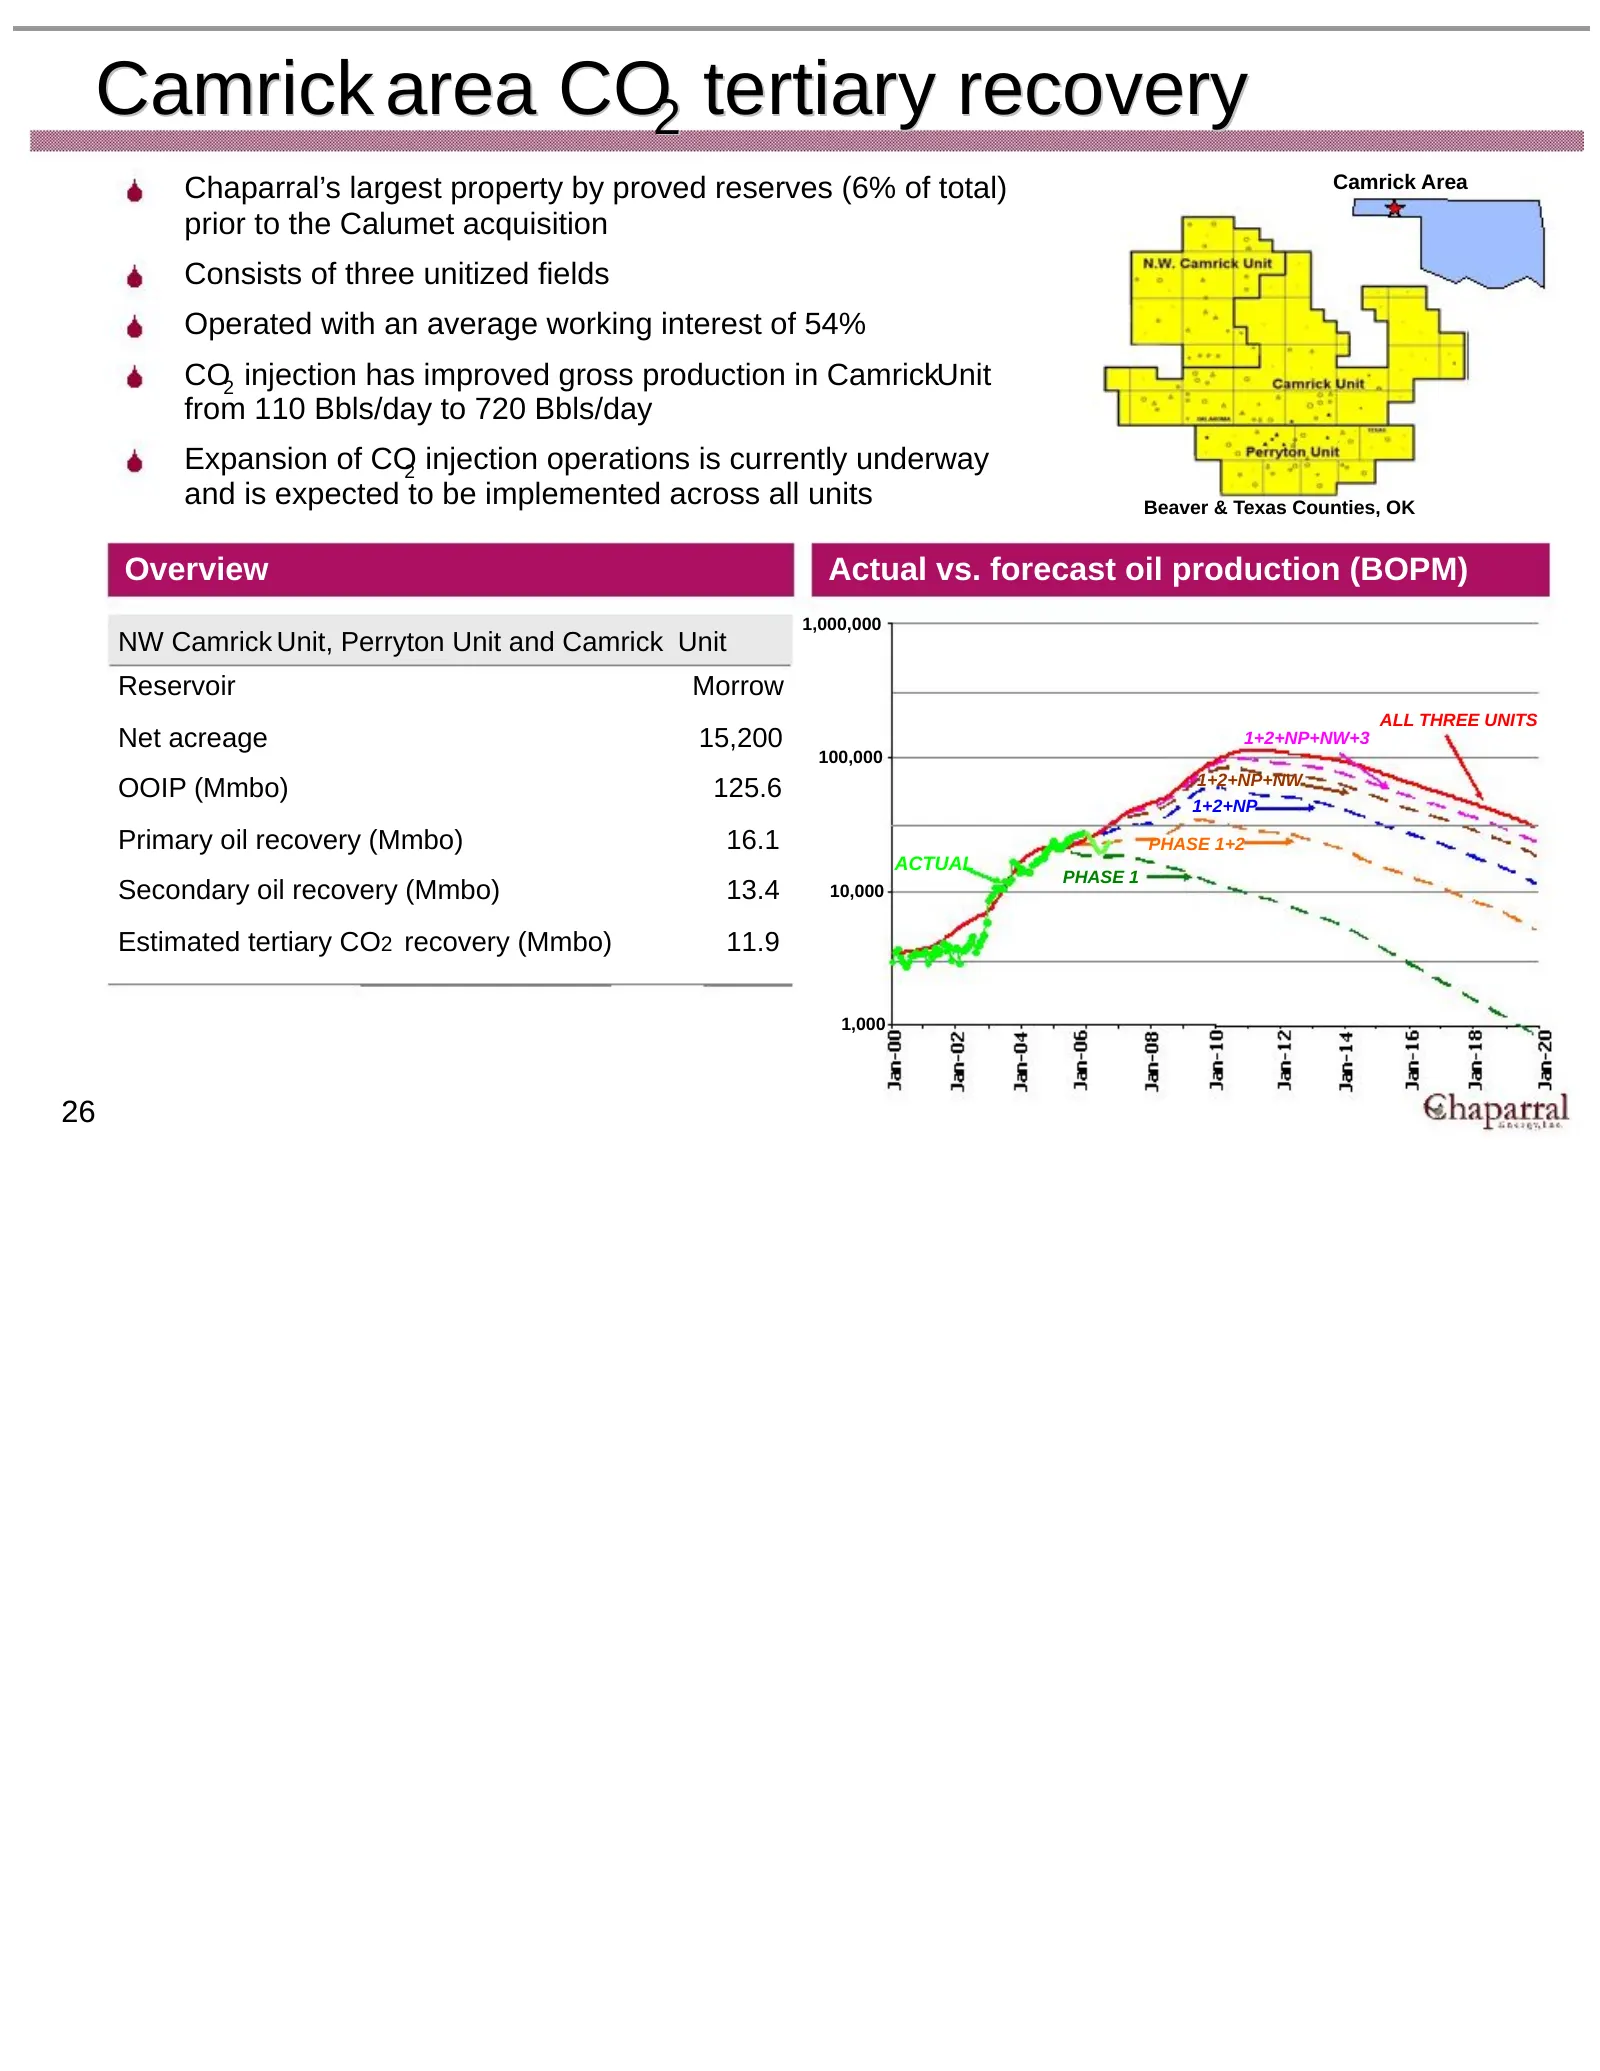
Camrick area CO2 tertiary recovery Chaparral’s largest property by proved reserves (6% of total) Camrick Area prior to the Calumet acquisition Consists of three unitized fields Operated with an average working interest of 54% CO2 injection has improved gross production in CamrickUnit from 110 Bbls/d
Slide 28: CO2 development potential
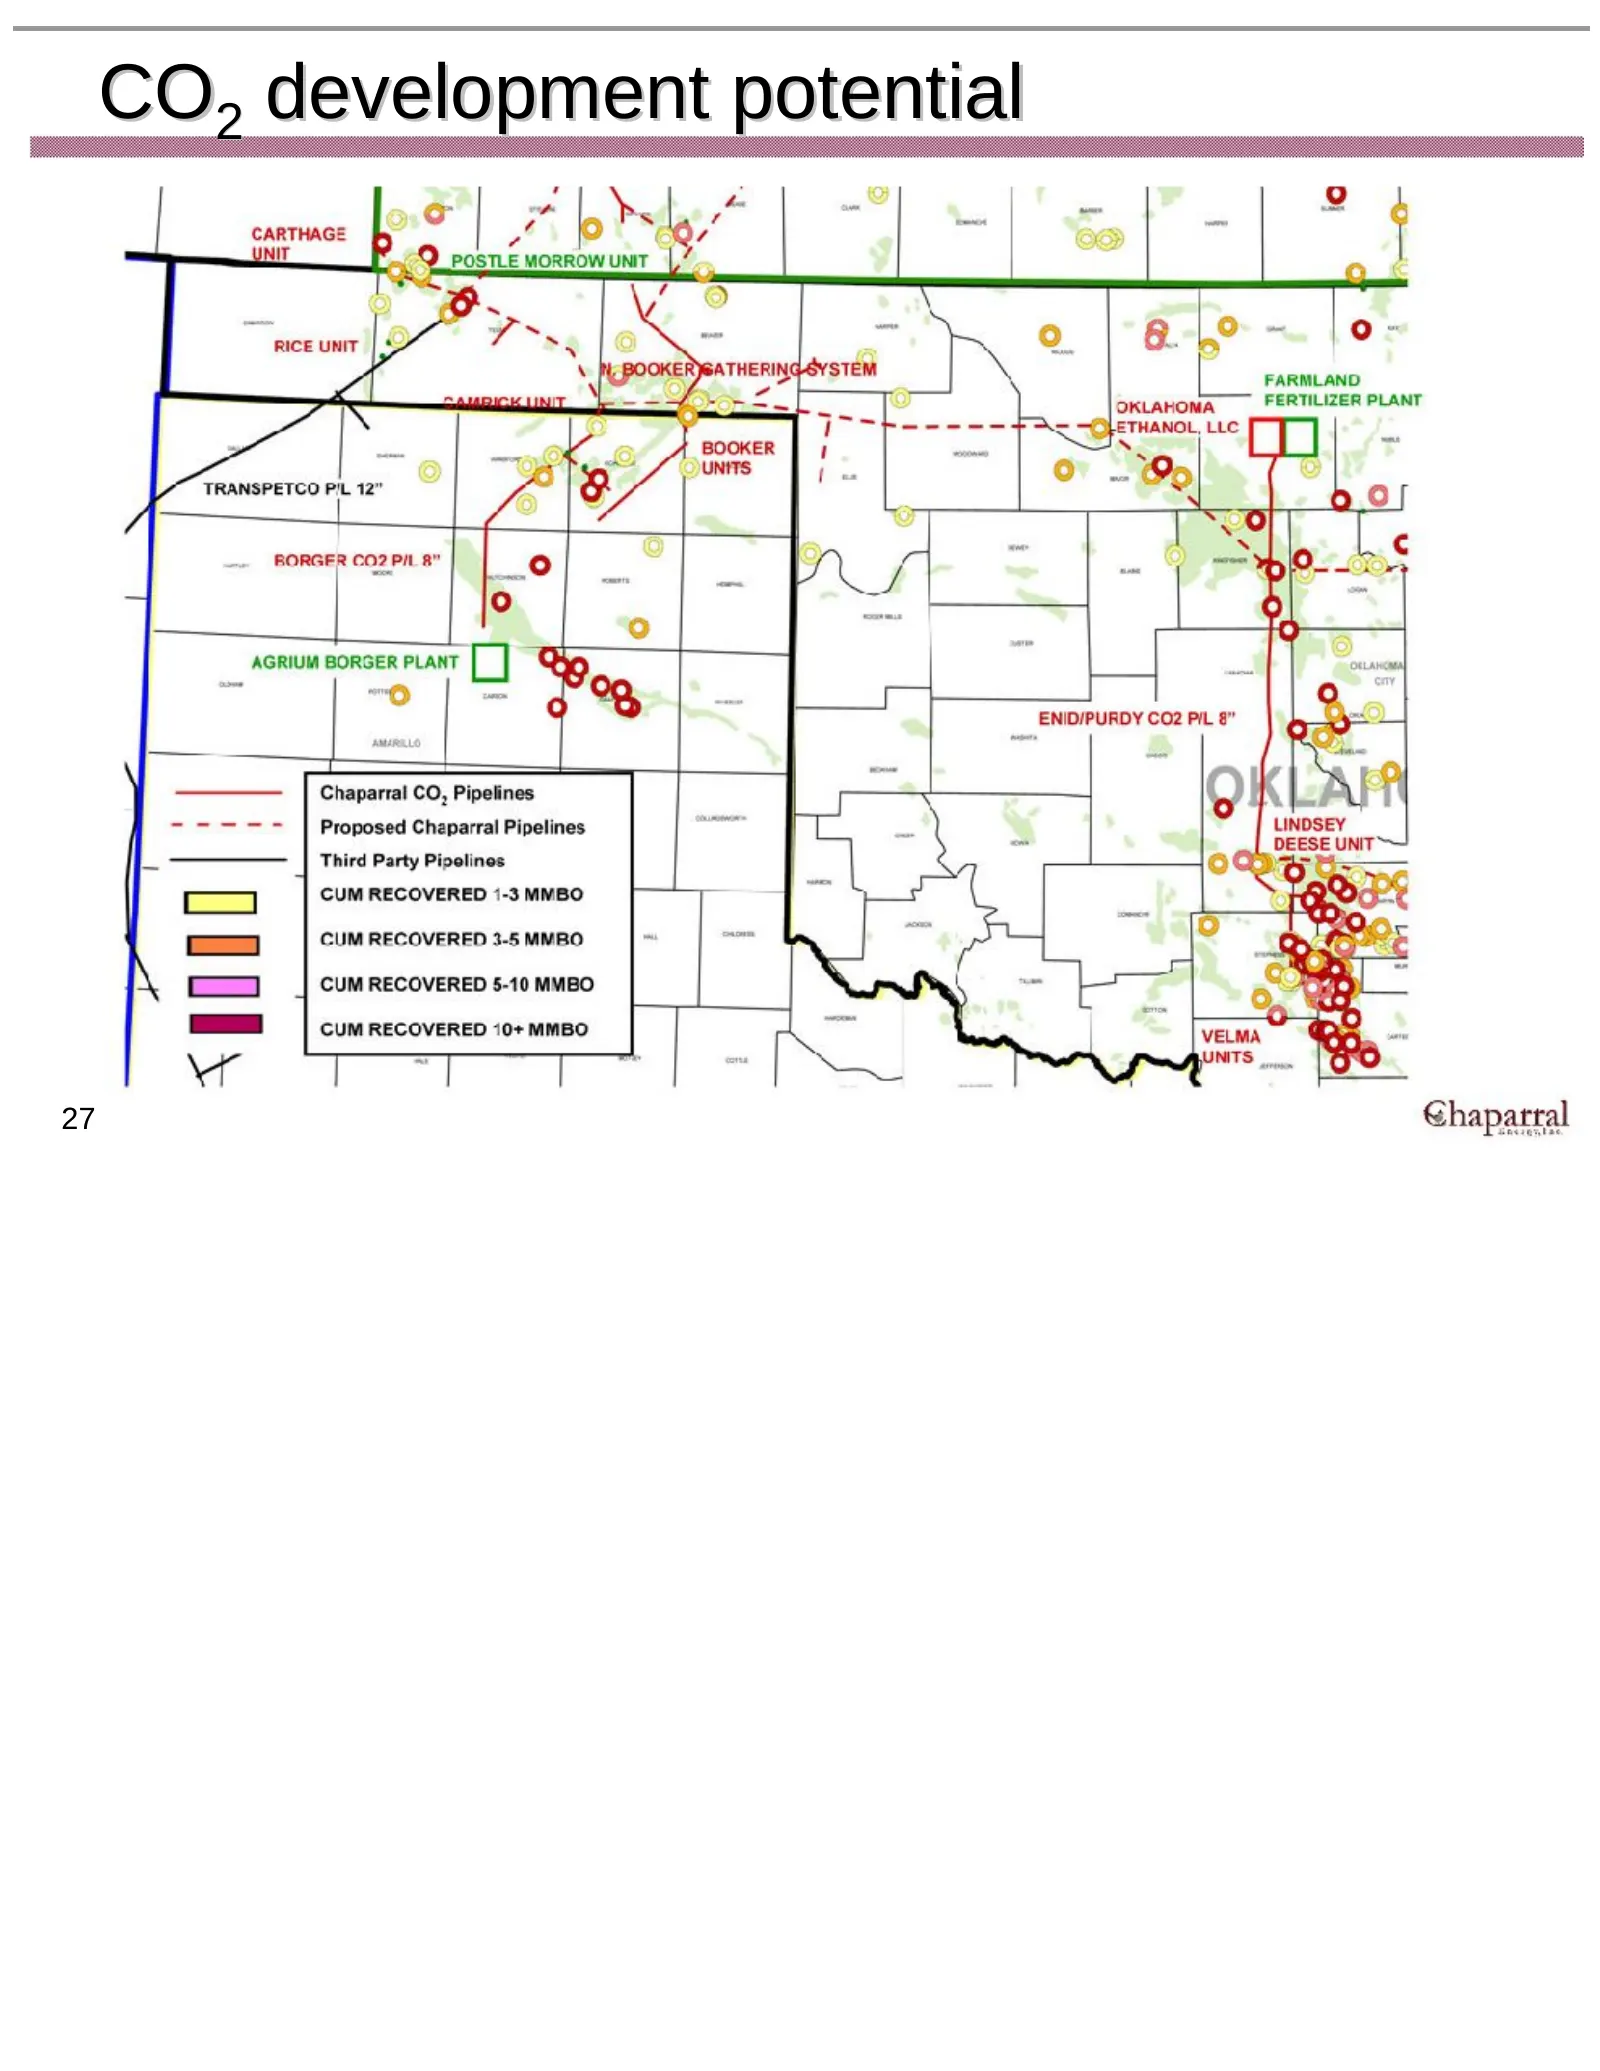
CO2 development potential 27
Slide 29: Agenda
Agenda Executive summary Strategy and project overview Financial overview 28
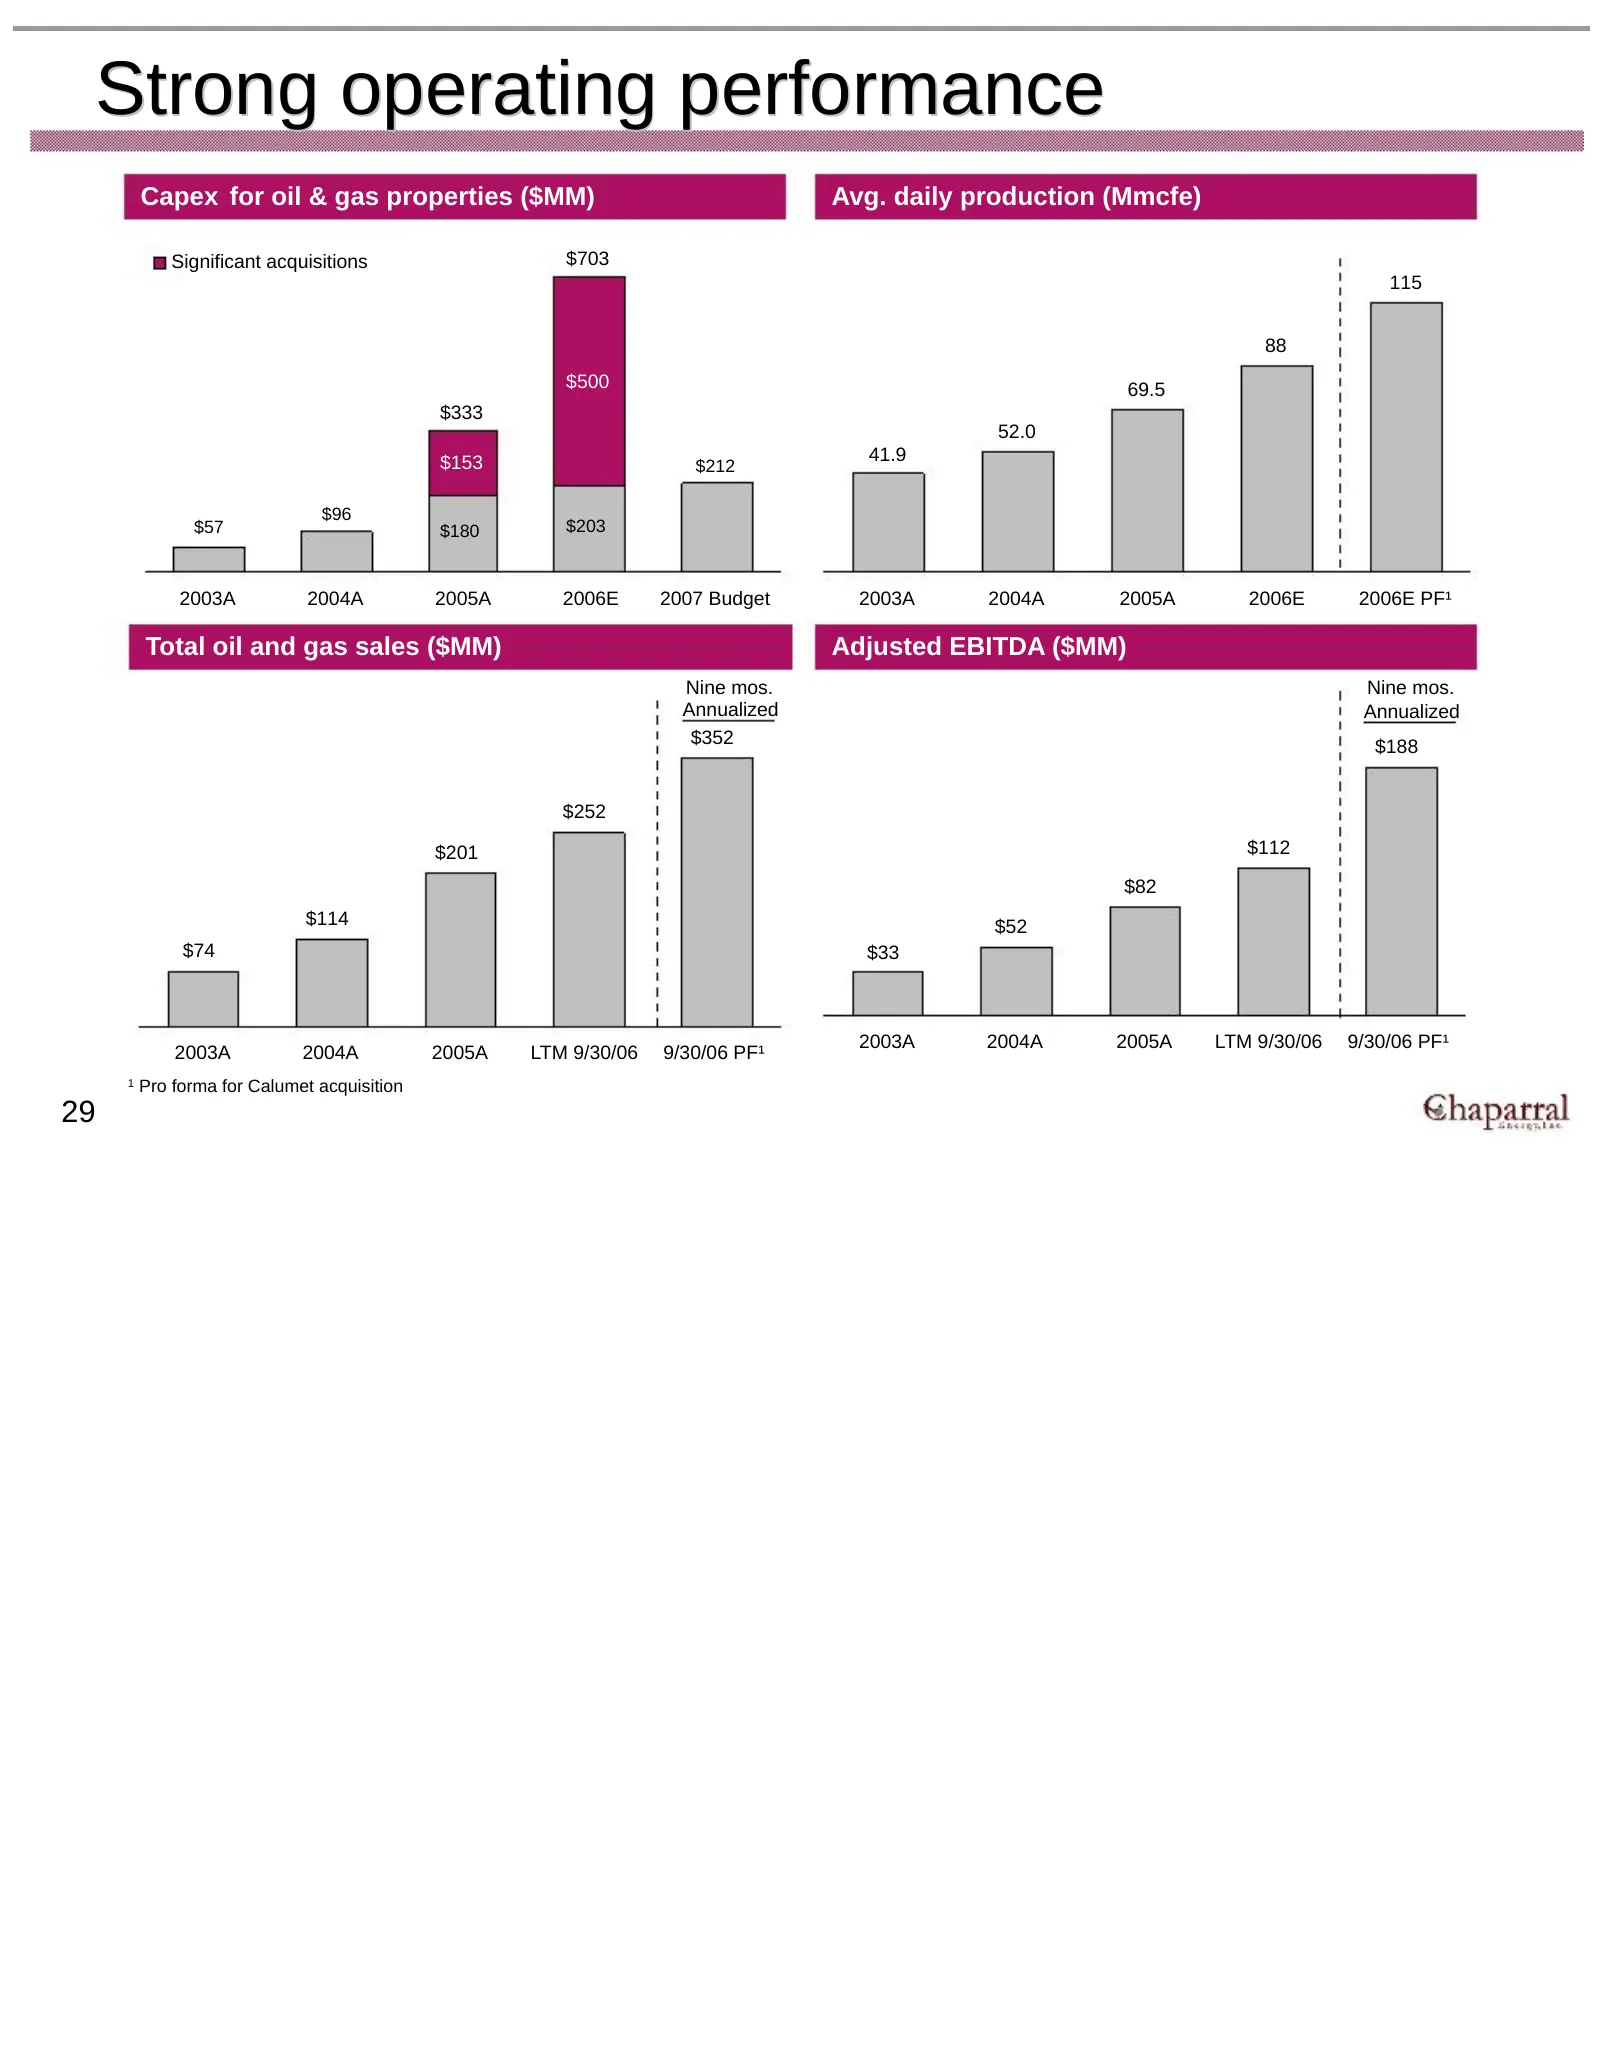
Slide 30: Strong operating performance
Strong operating performance Capex for oil & gas properties ($MM) Avg. daily production (Mmcfe) Significant acquisitions $703 115 88 $500 69.5 $333 52.0 $153 41.9 $212 $96 $57 $180 $203 2003A 2004A 2005A 2006E 2007 Budget 2003A 2004A 2005A 2006E 2006E PF¹ Total oil and gas sales ($MM) Adjusted EBITD
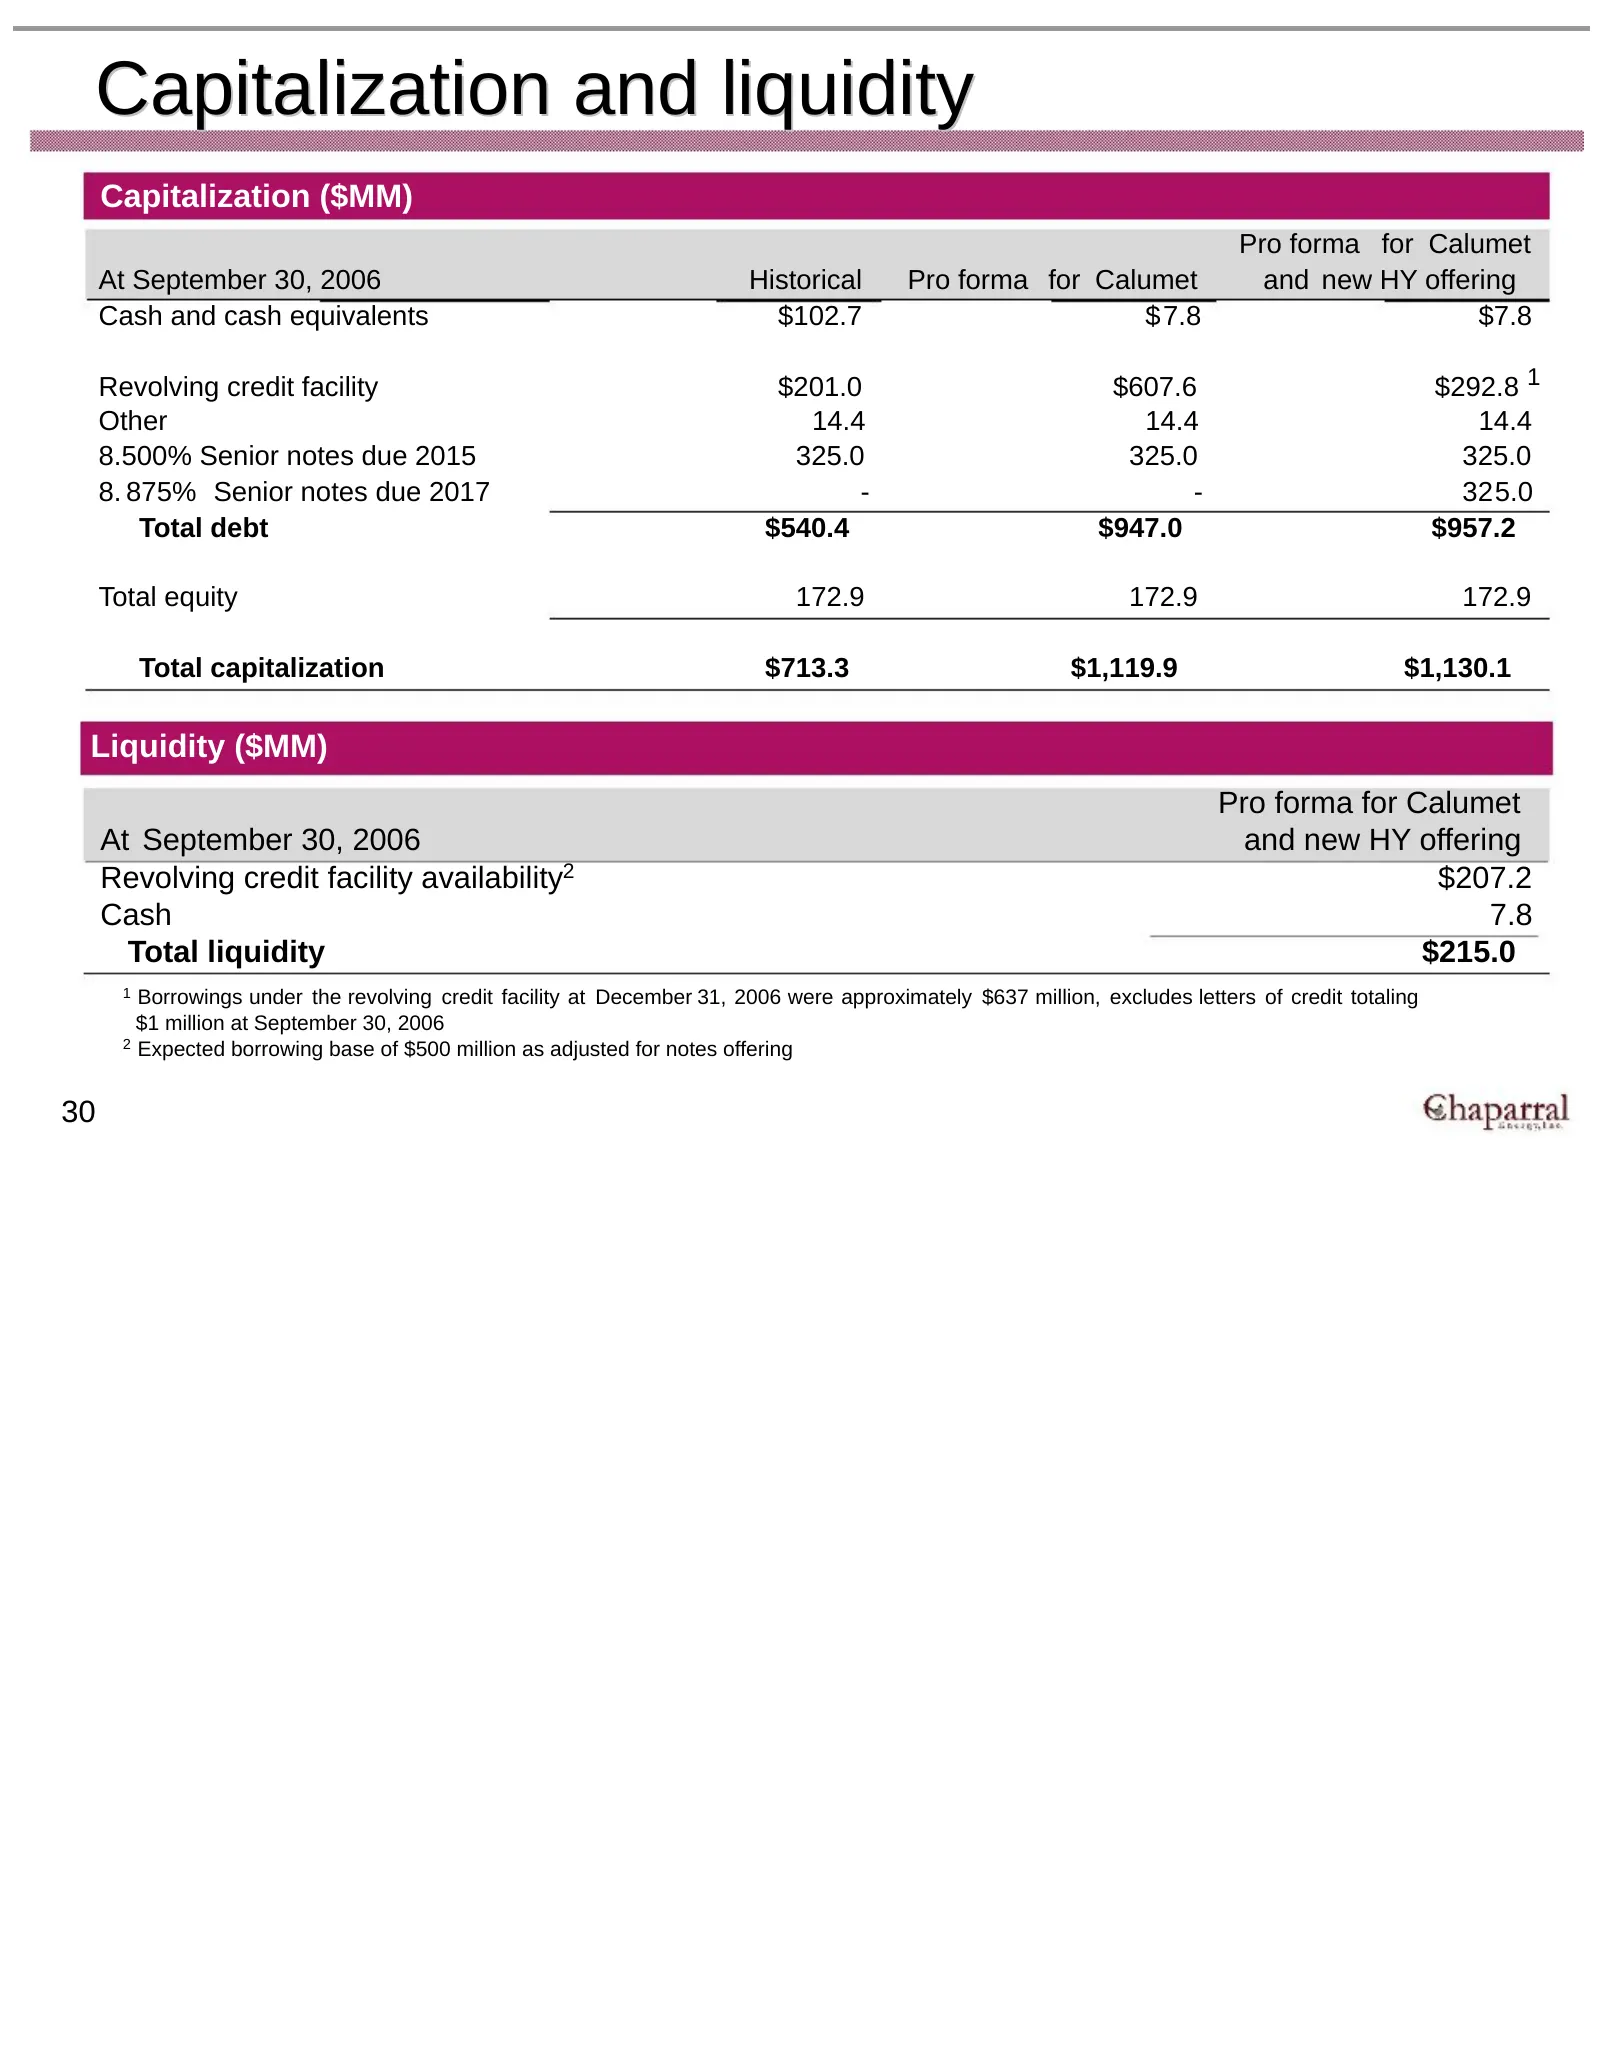
Slide 31: Capitalization and liquidity
Capitalization and liquidity Capitalization ($MM) Pro forma for Calumet At September 30, 2006 Historical Pro forma for Calumet and new HY offering Cash and cash equivalents $102.7 $7.8 $7.8 Revolving credit facility $201.0 $607.6 $292.8 1 Other 14.4 14.4 14.4 8.500% Senior notes due 2015 325.0 325.0
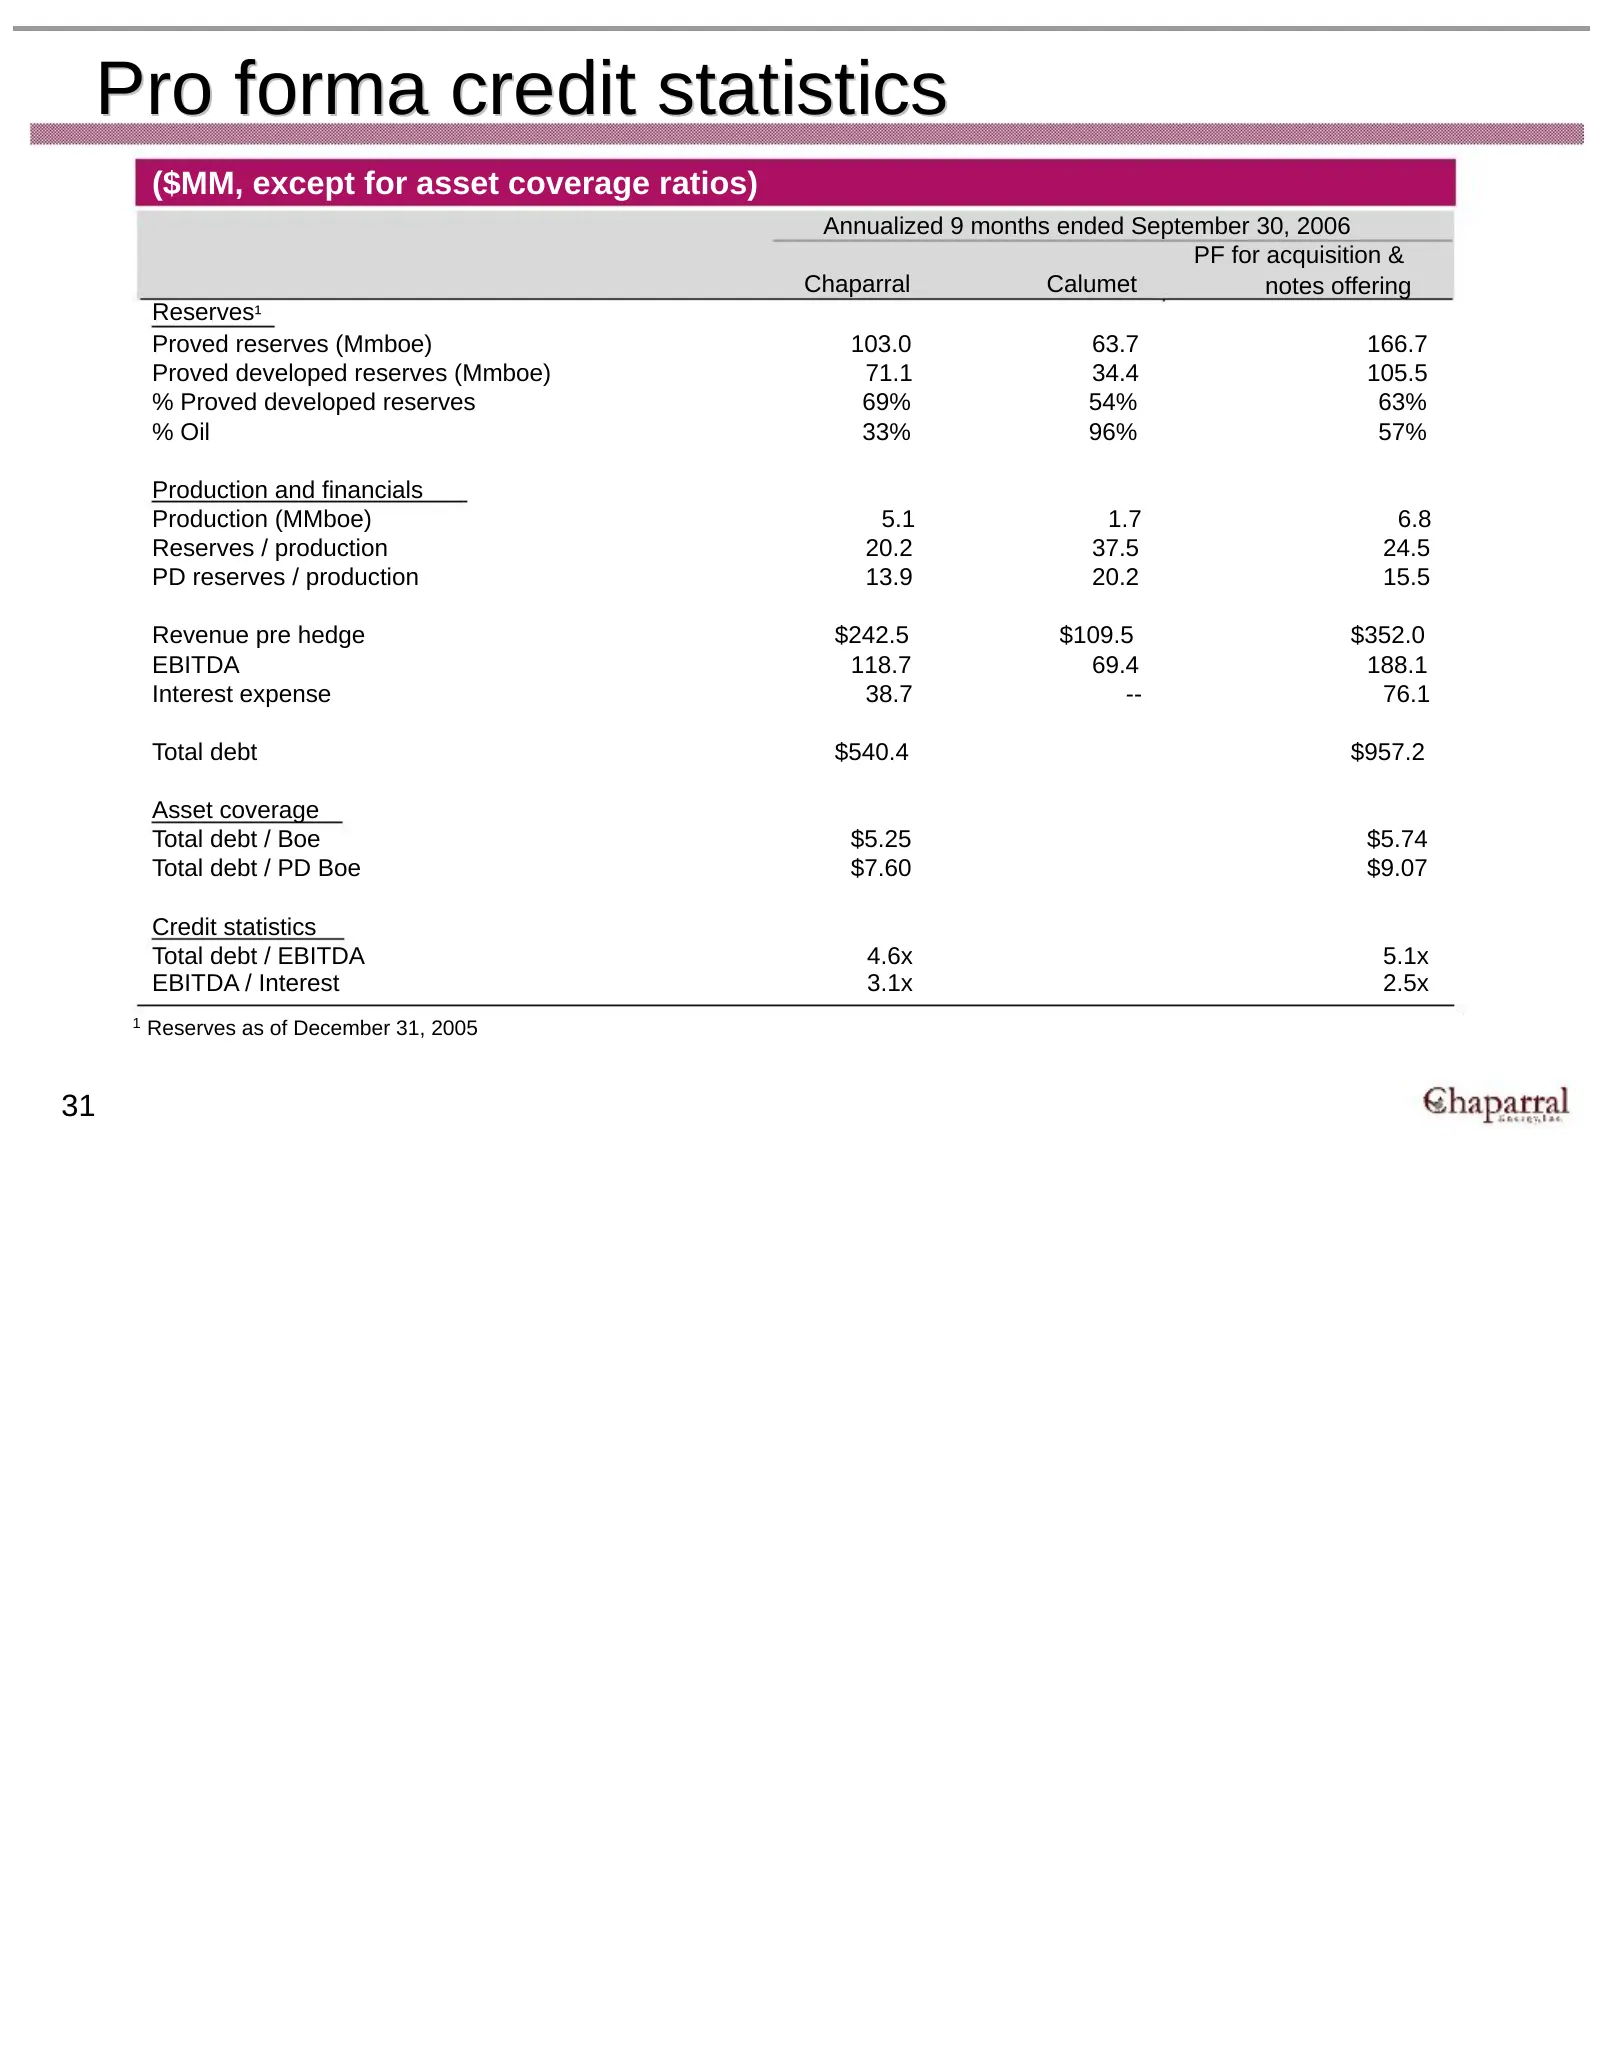
Slide 32: Pro forma credit statistics
Pro forma credit statistics ($MM, except for asset coverage ratios) Annualized 9 months ended September 30, 2006 PF for acquisition & Chaparral Calumet notes offering Reserves¹ Proved reserves (Mmboe) 103.0 63.7 166.7 Proved developed reserves (Mmboe) 71.1 34.4 105.5 % Proved developed reserves 69%
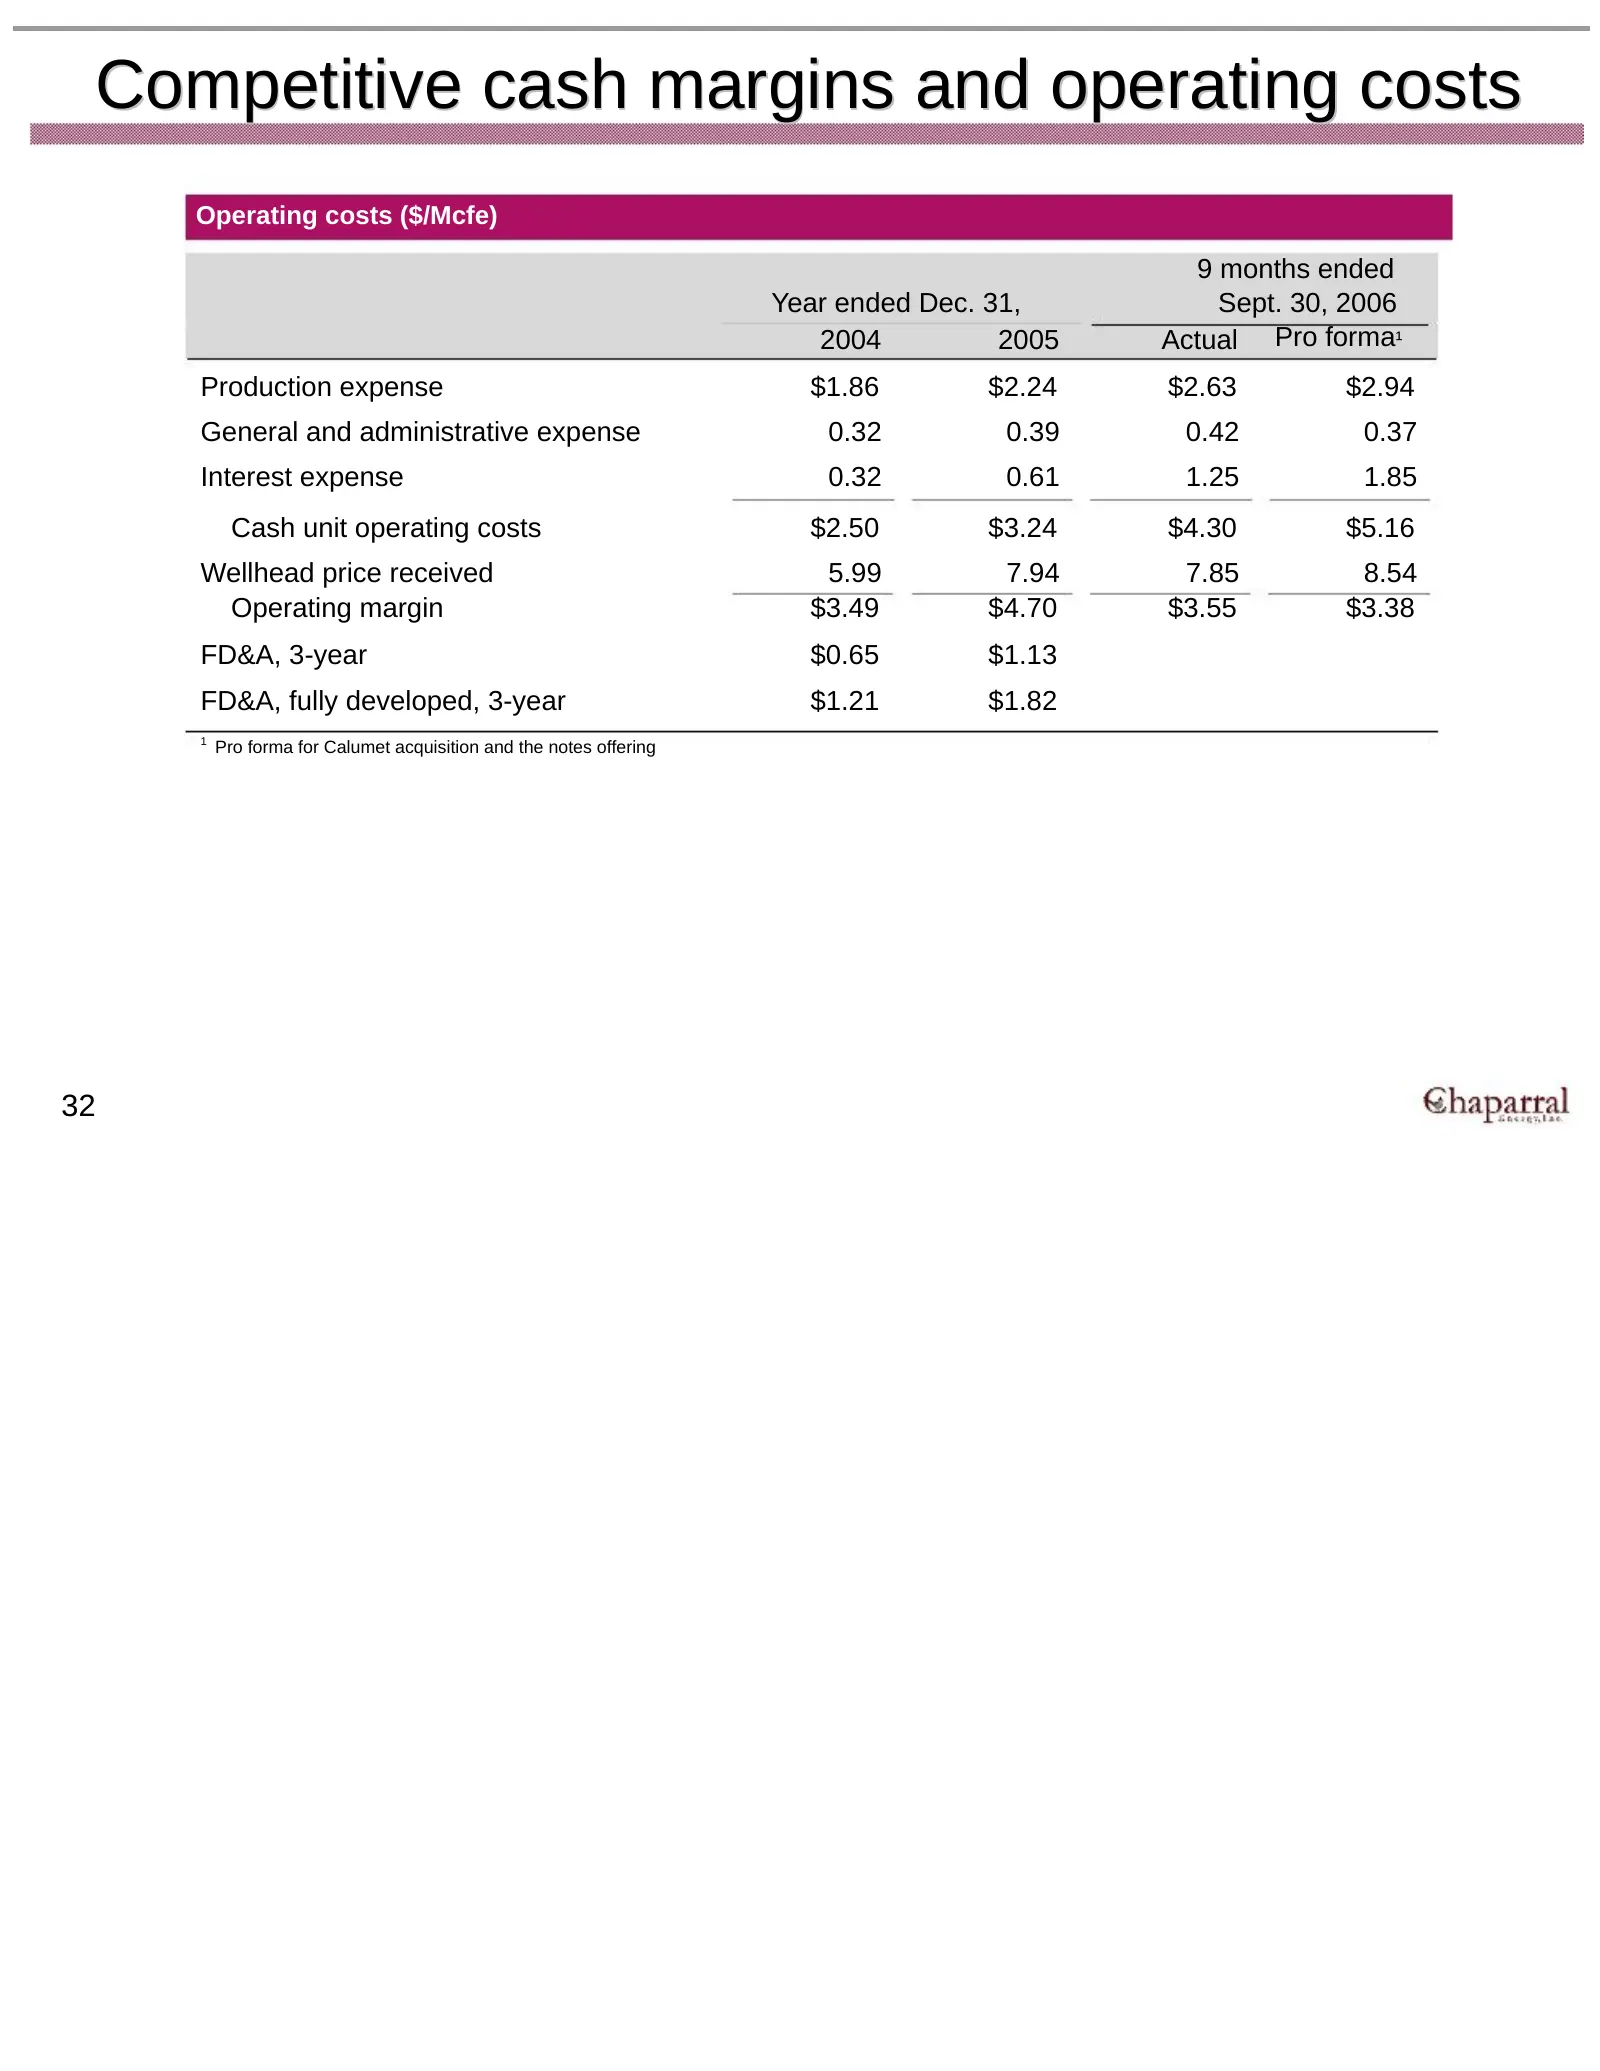
Slide 33: Competitive cash margins and operating costs
Competitive cash margins and operating costs Operating costs ($/Mcfe) 9 months ended Year ended Dec. 31, Sept. 30, 2006 2004 2005 Actual Pro forma¹ Production expense $1.86 $2.24 $2.63 $2.94 General and administrative expense 0.32 0.39 0.42 0.37 Interest expense 0.32 0.61 1.25 1.85 Cash unit operati
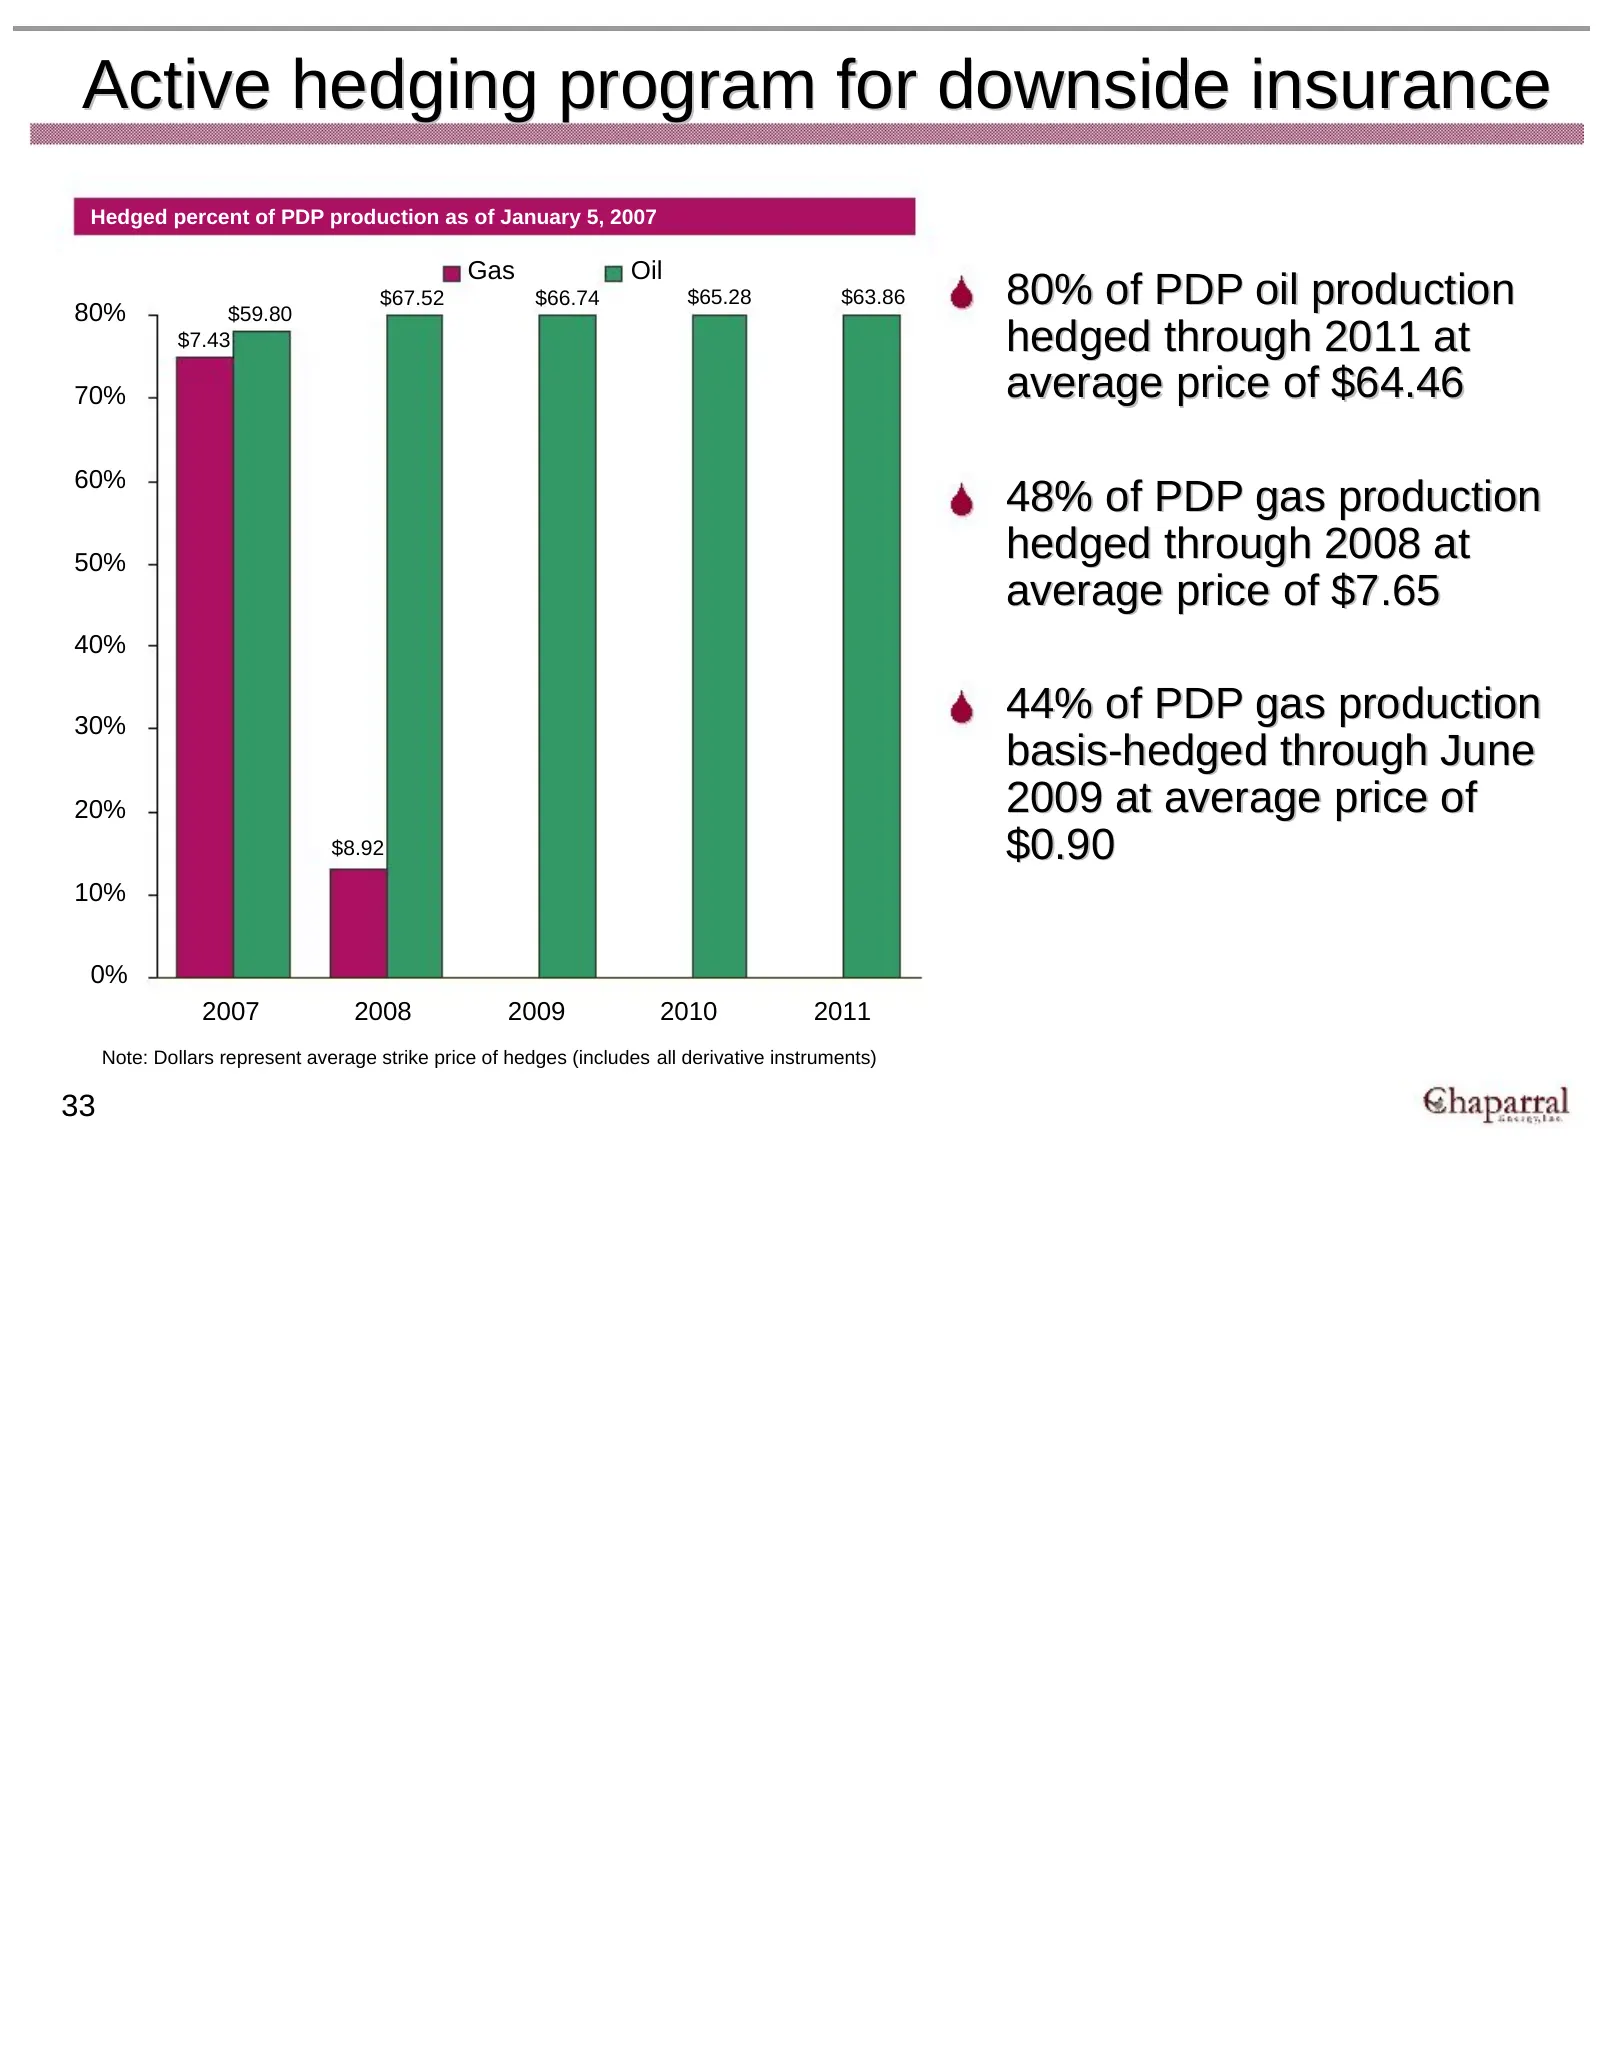
Slide 34: Active hedging program for downside insurance
Active hedging program for downside insurance Hedged percent of PDP production as of January 5, 2007 Gas Oil 80% $59.80 $67.52 $66.74 $65.28 $63.86 80% of PDP oil production $7.43 hedged through 2011 at 70% average price of $64.46 60% 48% of PDP gas production 50% hedged through 2008 at average pric
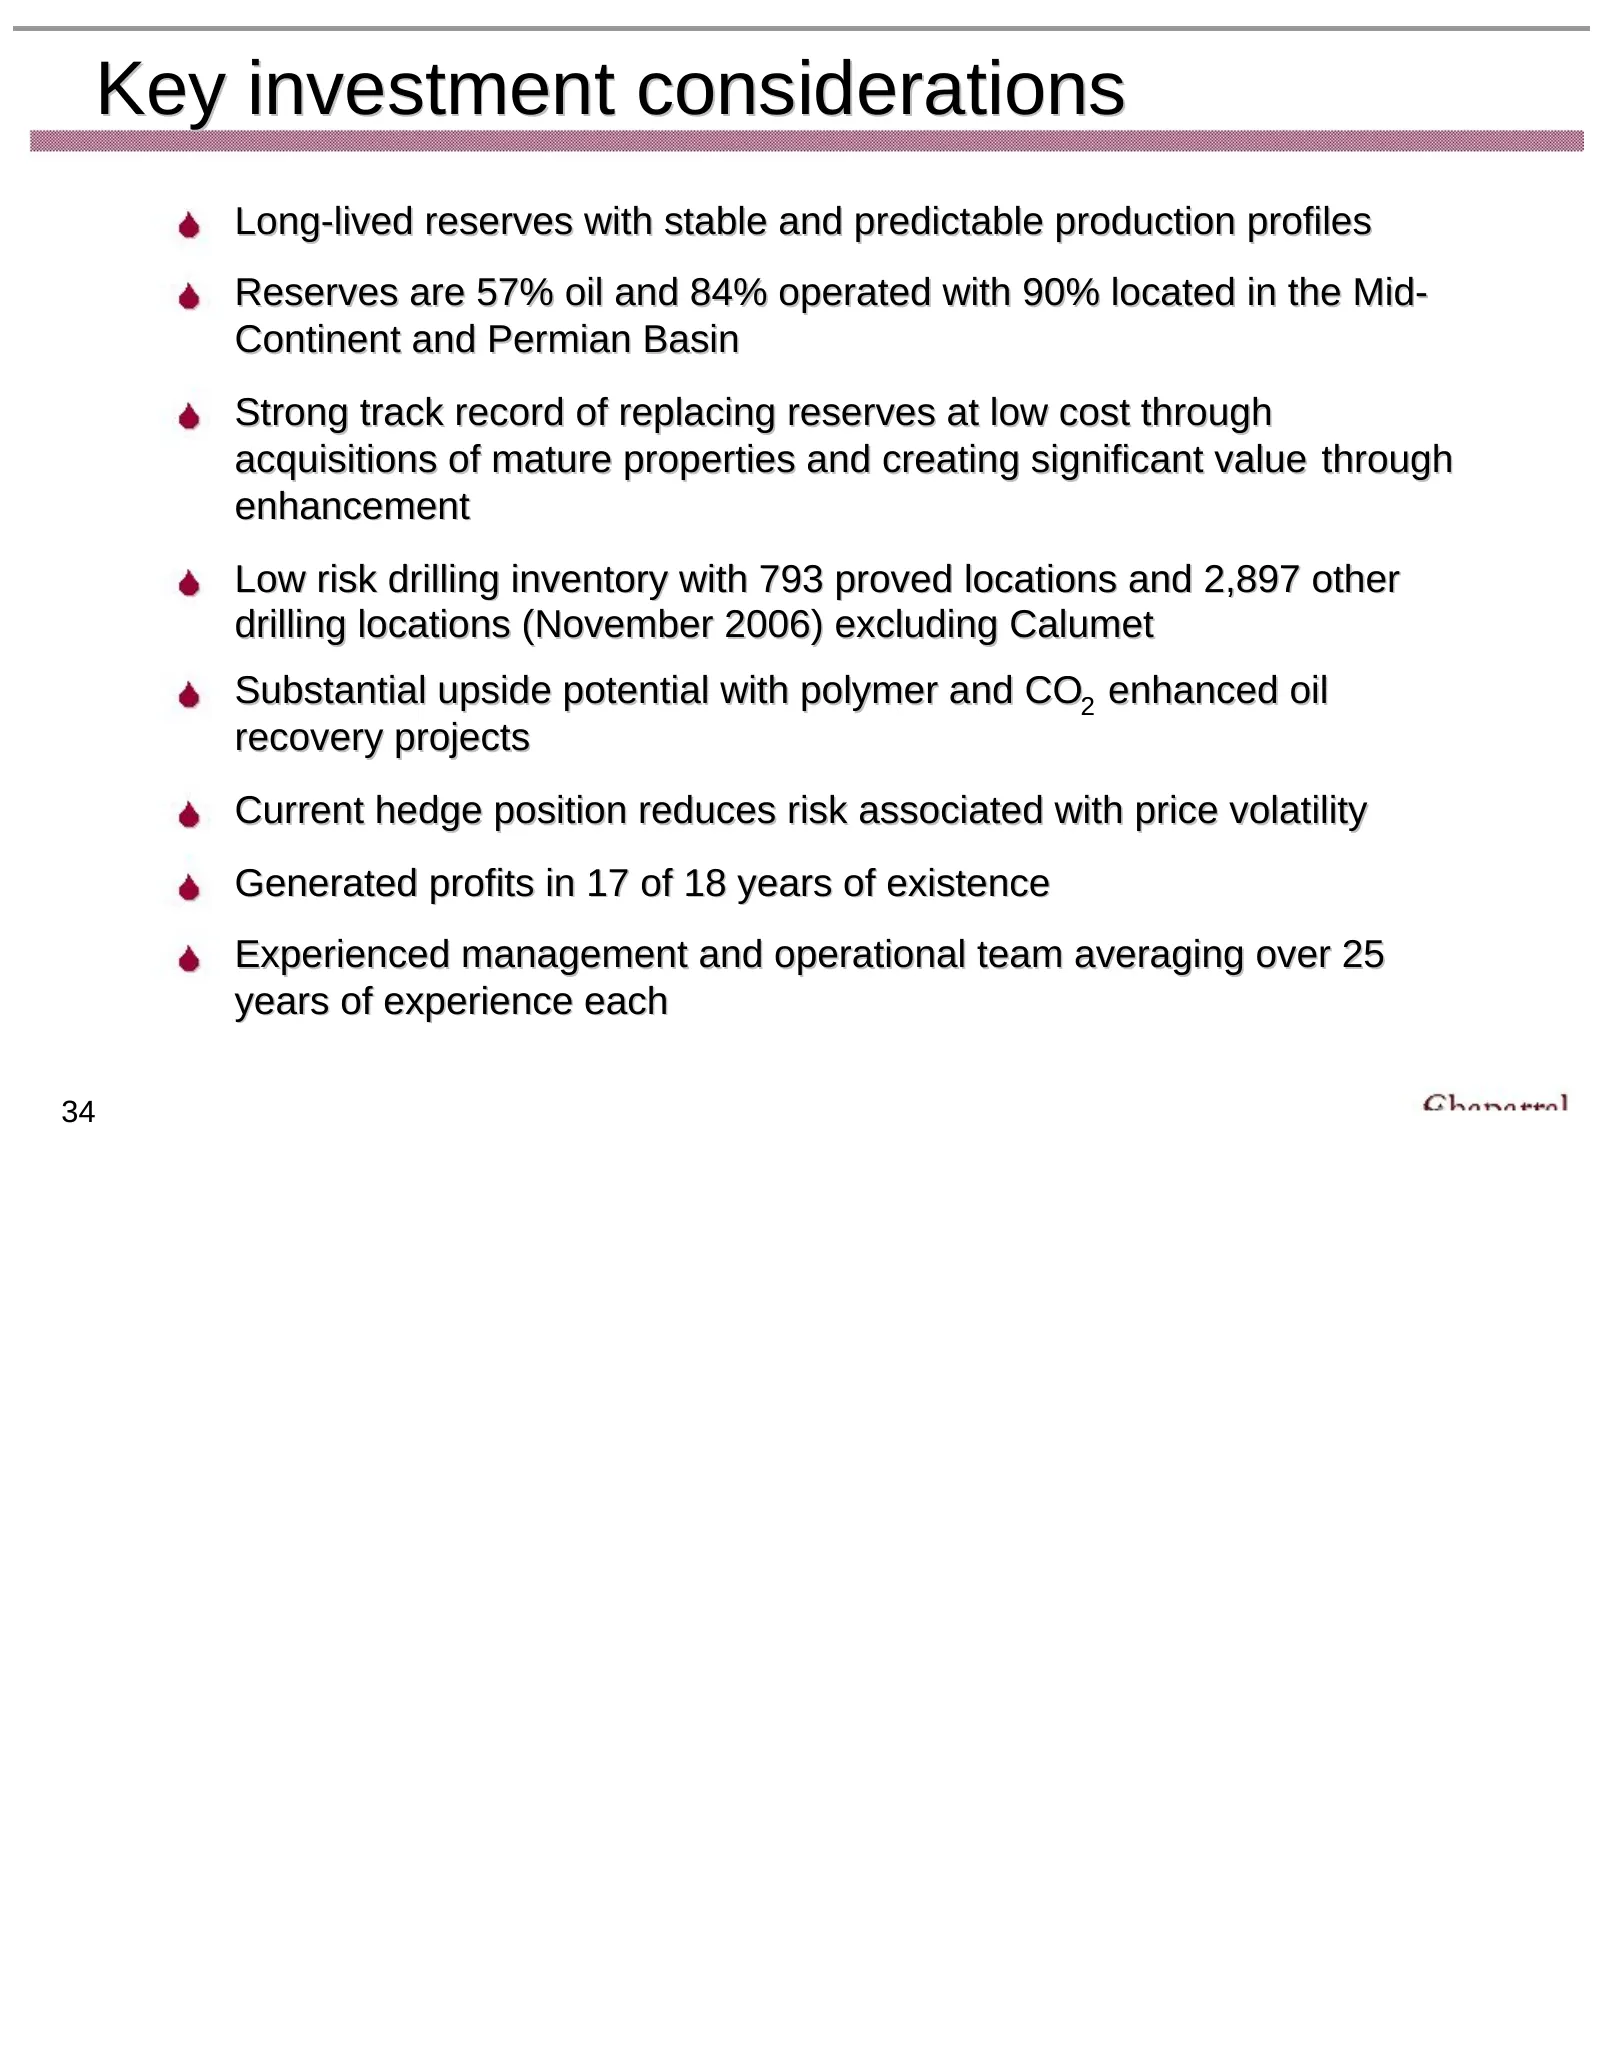
Slide 35: Key investment considerations
Key investment considerations Long-lived reserves with stable and predictable production profiles Reserves are 57% oil and 84% operated with 90% located in the Mid- Continent and Permian Basin Strong track record of replacing reserves at low cost through acquisitions of mature properties and creatin
Source: SEC EDGAR · 8-K filed Jan 19, 2007
More decks from Chaparral Energy Inc
 Debt Investor Presentation (August 2020)10 slides · Aug 17, 2020
 Q1 2020 Earnings Presentation26 slides · May 12, 2020
 Investor Presentation (March 2020)30 slides · Mar 12, 2020
 Q3 2019 Earnings Presentation31 slides · Nov 12, 2019
 Q2 2019 Earnings Presentation33 slides · Aug 8, 2019
 Investor Presentation (May 2019)41 slides · May 28, 2019