Corporate Capital Trust — Merger or Acquisition (July 2018)
14 slides from Corporate Capital Trust's merger presentation, Jul 23, 2018
Slide 1: Merger of FS Investment Corporation & Corporate Capital Trust Investor Presentation
Merger of Fs investment corporation & Corporate capital trust Investor presentation July 23, 2018 Exhibit 1
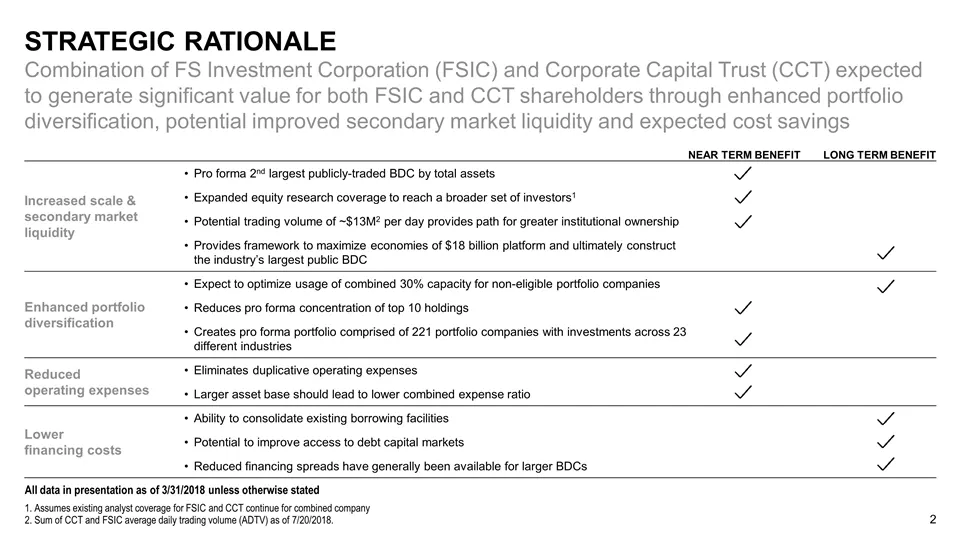
Slide 2: Strategic rationale
All data in presentation as of 3/31/2018 unless otherwise stated Assumes existing analyst coverage for FSIC and CCT continue for combined company Sum of CCT and FSIC average daily trading volume (ADTV) as of 7/20/2018. NEAR TERM BENEFIT LONG TERM BENEFIT Increased scale & secondary market liquidity
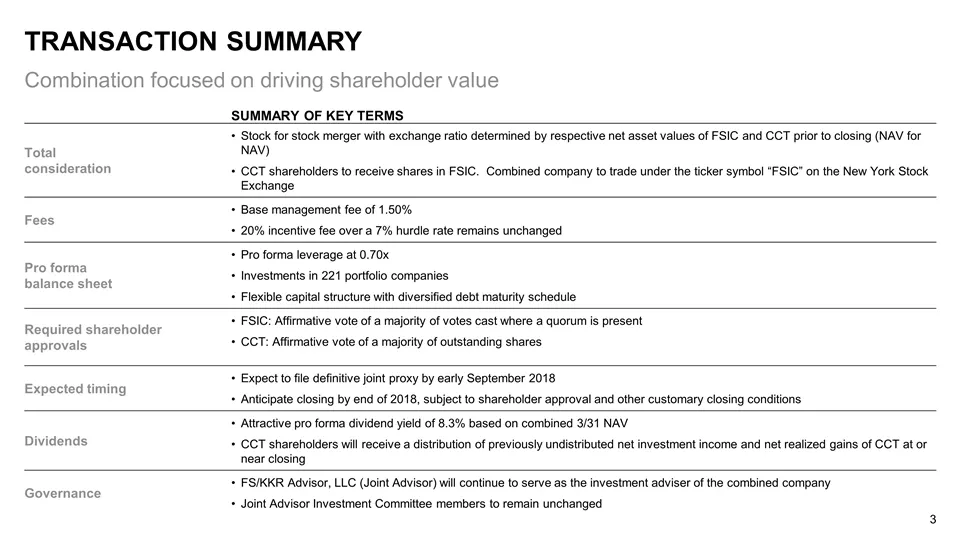
Slide 3: Summary of key terms
SUMMARY OF KEY TERMS Total consideration Stock for stock merger with exchange ratio determined by respective net asset values of FSIC and CCT prior to closing (NAV for NAV) CCT shareholders to receive shares in FSIC. Combined company to trade under the ticker symbol “FSIC” on the New York Stock Exch
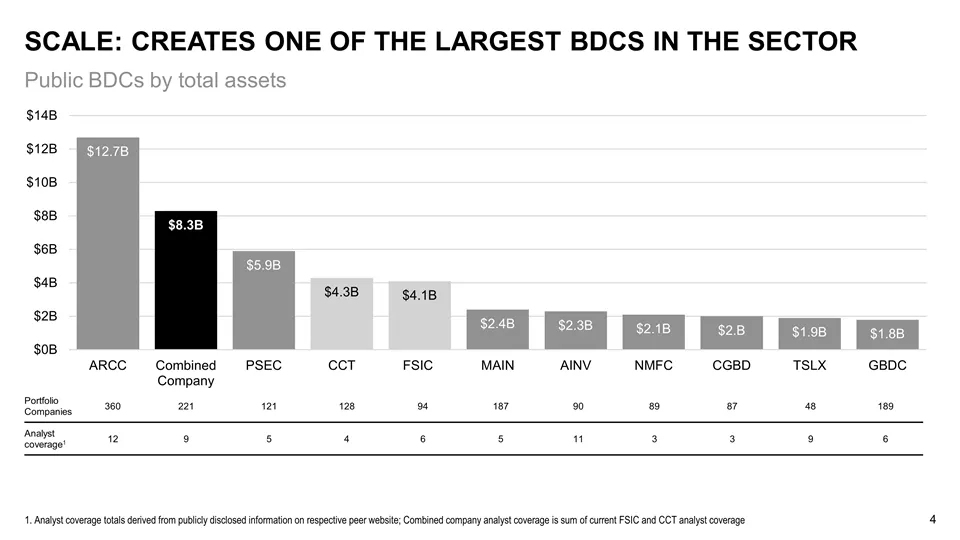
Slide 4: Scale: Creates one of the largest BDCs in the sector
Scale: Creates one of the largest bdcs in the sector Public BDCs by total assets Analyst coverage totals derived from publicly disclosed information on respective peer website; Combined company analyst coverage is sum of current FSIC and CCT analyst coverage Portfolio Companies 360 221 121 128 94 18
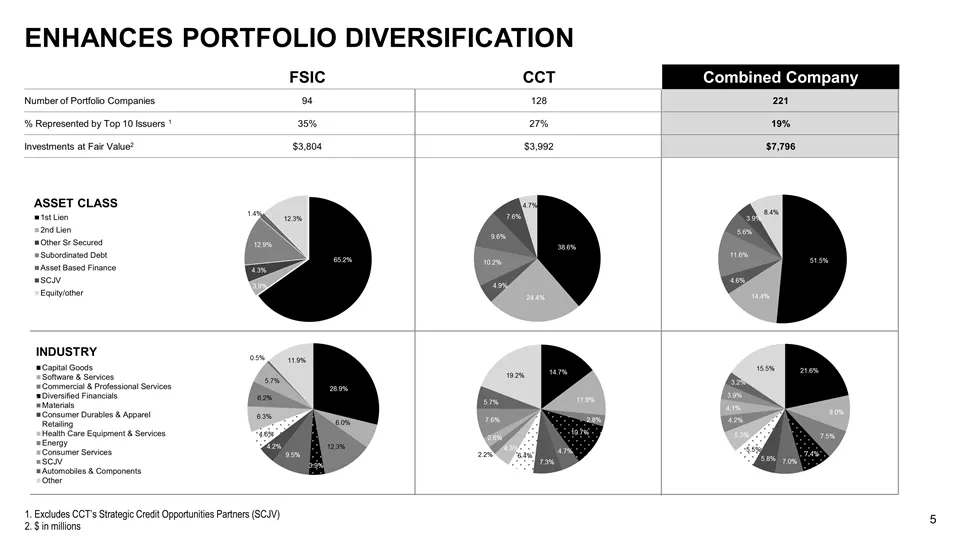
Slide 5: Enhances portfolio diversification
1 As of 3/31/2018. 2 Excludes SCJV FSIC CCT Combined Company Number of Portfolio Companies 94 128 221 % Represented by Top 10 Issuers 1 35% 27% 19% Investments at Fair Value2 $3,804 $3,992 $7,796 Enhances portfolio diversification ASSET CLASS INDUSTRY Excludes CCT’s Strategic Credit Opportunities Pa
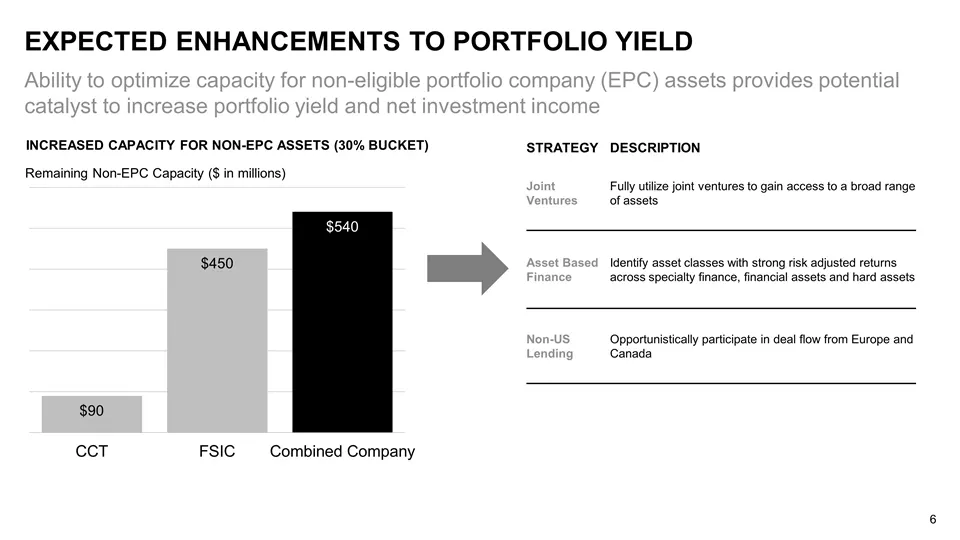
Slide 6: Ability to optimize capacity for non-eligible portfolio company assets
Ability to optimize capacity for non-eligible portfolio company (EPC) assets provides potential catalyst to increase portfolio yield and net investment income Expected Enhancements to portfolio yield STRATEGY DESCRIPTION Joint Ventures Fully utilize joint ventures to gain access to a broad range of
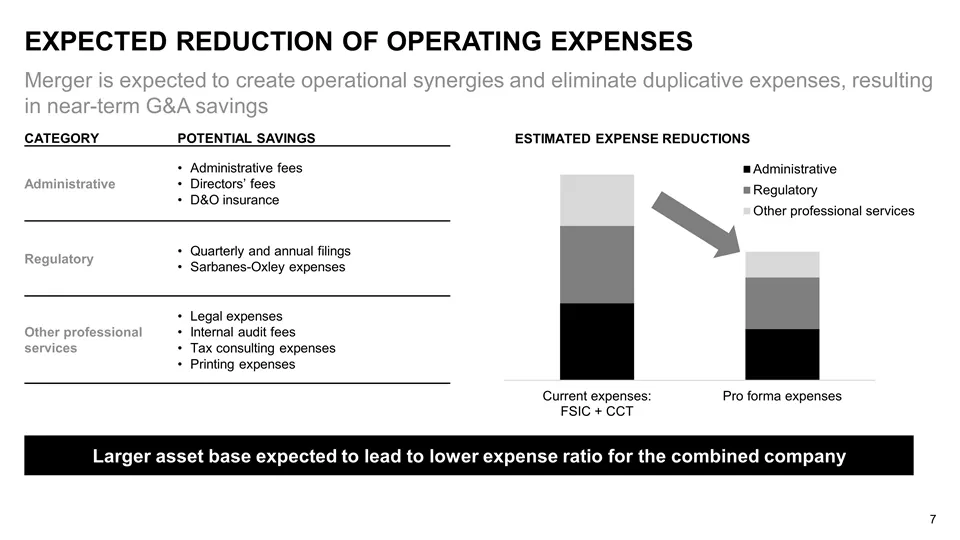
Slide 7: Merger expected to create operational synergies and eliminate duplicative expenses
Merger is expected to create operational synergies and eliminate duplicative expenses, resulting in near-term G&A savings Expected Reduction of Operating expenses CATEGORY POTENTIAL SAVINGS Administrative Administrative fees Directors’ fees D&O insurance Regulatory Quarterly and annual filings Sarba
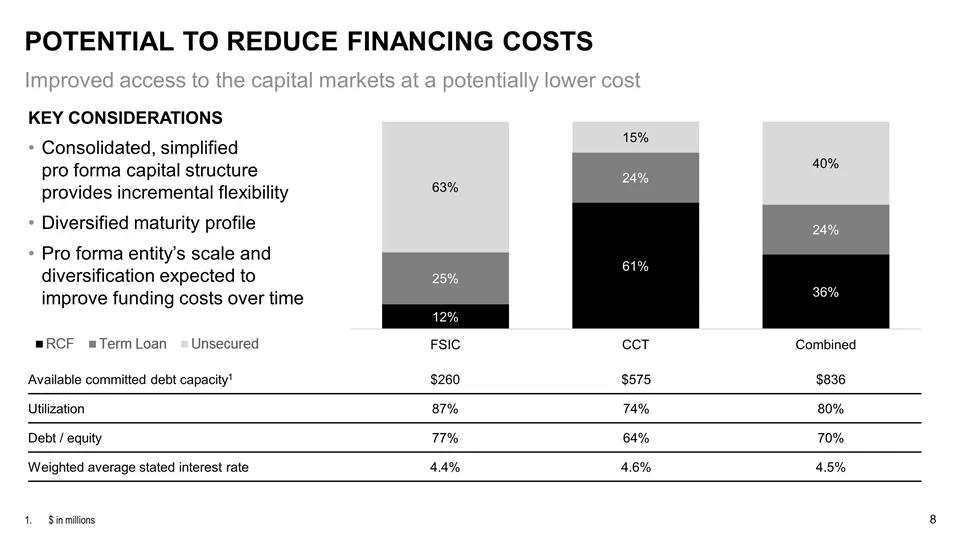
Slide 8: Key Considerations: Consolidated, simplified pro forma capital structure
Key Considerations Consolidated, simplified pro forma capital structure provides incremental flexibility Diversified maturity profile Pro forma entity’s scale and diversification expected to improve funding costs over time Potential to reduce financing costs $ in millions Improved access to the capi
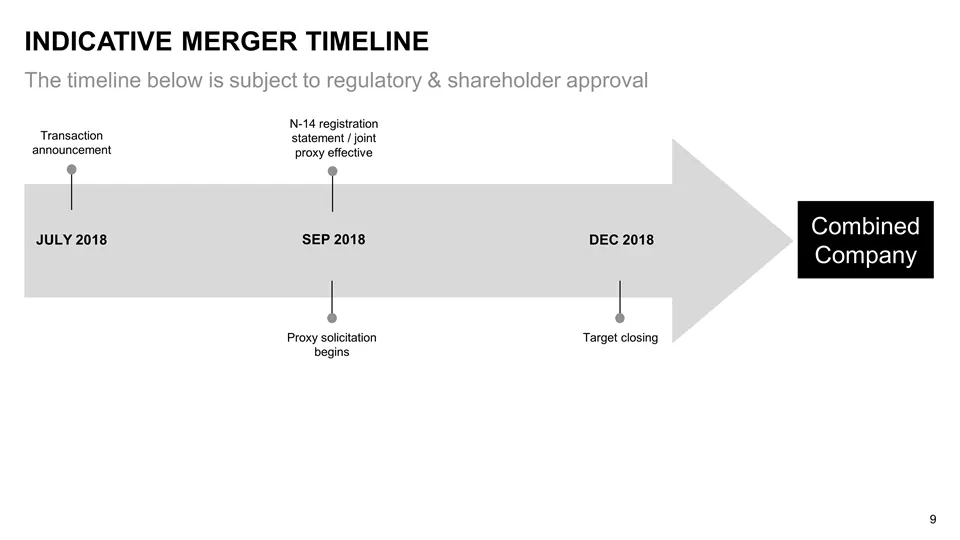
Slide 9: Indicative Merger timeline
The timeline below is subject to regulatory & shareholder approval Indicative Merger timeline JULY 2018 Transaction announcement Proxy solicitation begins SEP 2018 DEC 2018 Target closing Combined Company N-14 registration statement / joint proxy effective
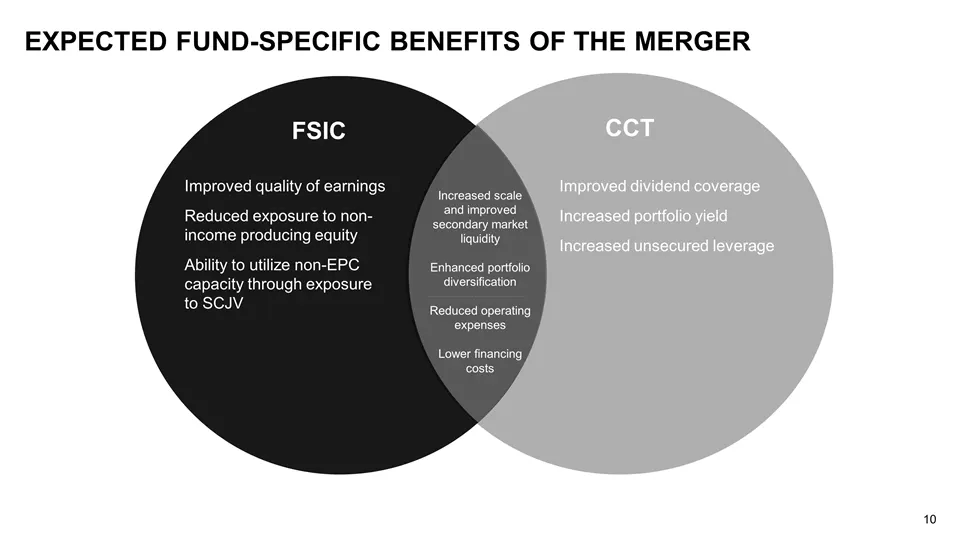
Slide 10: Expected fund-specific benefits of the merger
Improved dividend coverage Increased portfolio yield Increased unsecured leverage Improved quality of earnings Reduced exposure to non-income producing equity Ability to utilize non-EPC capacity through exposure to SCJV Expected Fund-Specific Benefits of the merger CCT FSIC Increased scale and impro

Slide 11: Appendix
Appendix
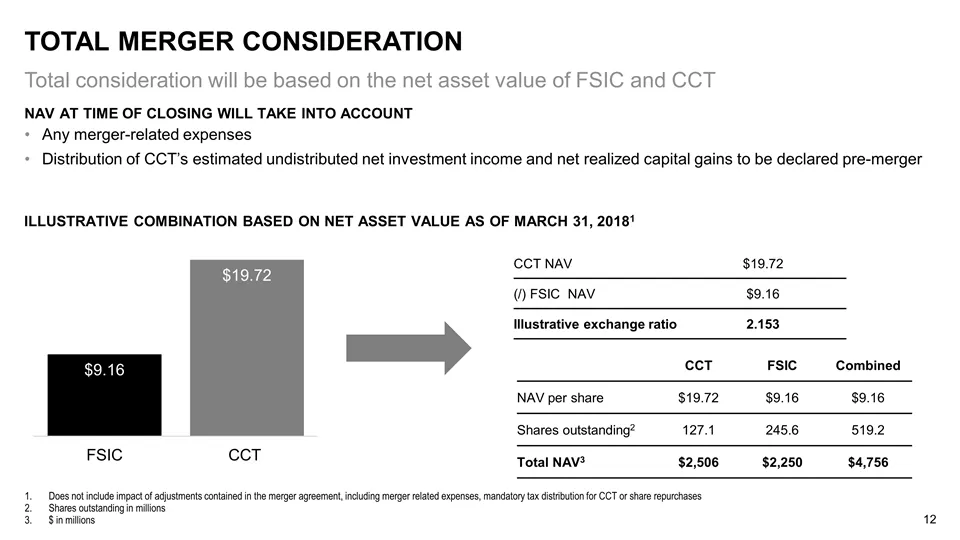
Slide 12: Illustrative combination based on net asset value
NAV at time of closing will take into account Any merger-related expenses Distribution of CCT’s estimated undistributed net investment income and net realized capital gains to be declared pre-merger Total merger consideration Total consideration will be based on the net asset value of FSIC and CCT D
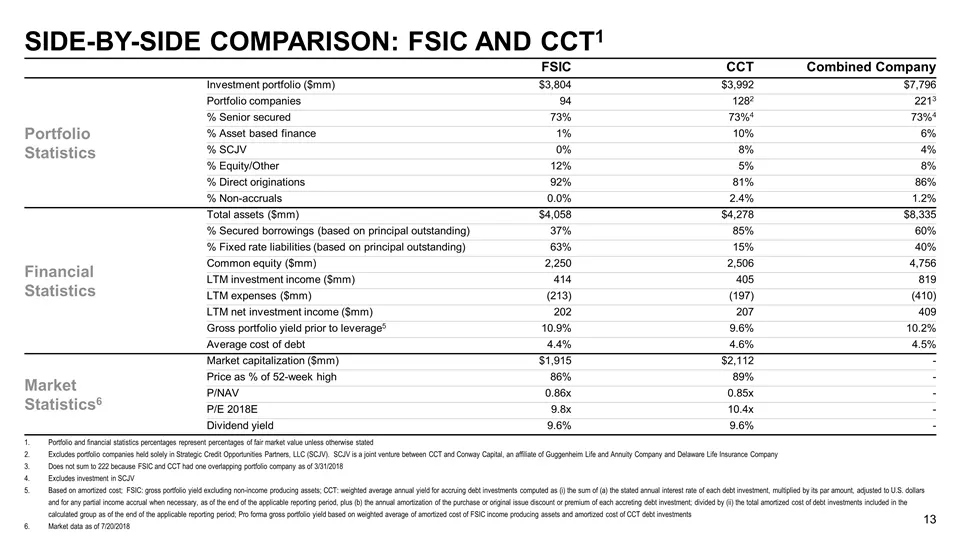
Slide 13: Portfolio, financial and market statistics
FSIC CCT Combined Company Portfolio Statistics Investment portfolio ($mm) $3,804 $3,992 $7,796 Portfolio companies 94 1282 2213 % Senior secured 73% 73%4 73%4 % Asset based finance 1% 10% 6% % SCJV 0% 8% 4% % Equity/Other 12% 5% 8% % Direct originations 92% 81% 86% % Non-accruals 0.0% 2.4% 1.2% Fina
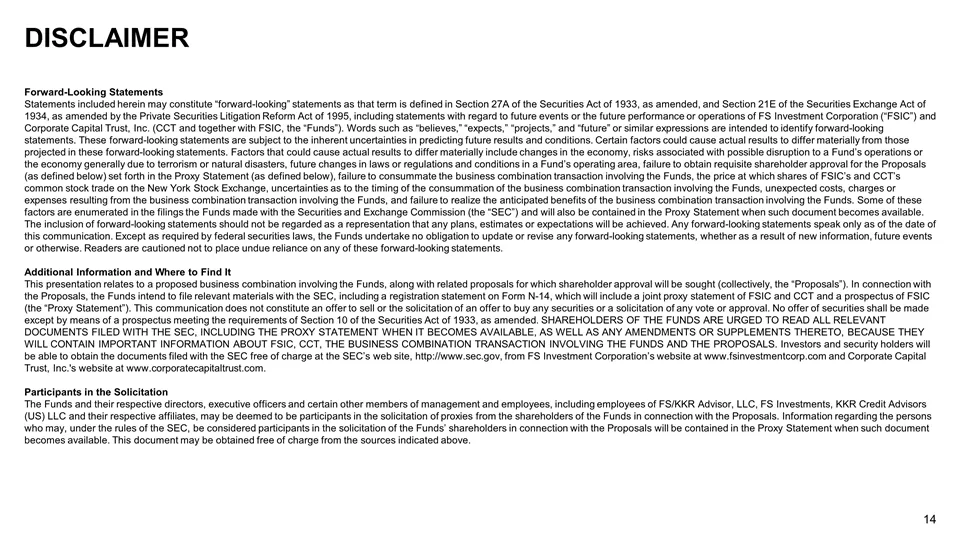
Slide 14: Disclaimer: Forward-Looking Statements
disclaimer Forward-Looking Statements Statements included herein may constitute “forward-looking” statements as that term is defined in Section 27A of the Securities Act of 1933, as amended, and Section 21E of the Securities Exchange Act of 1934, as amended by the Private Securities Litigation Refor
Source: SEC EDGAR · 425 filed Jul 23, 2018
More decks from Corporate Capital Trust Inc
 Merger or Acquisition (December 2017)12 slides · Dec 11, 2017
 Investor Presentation (November 2017)42 slides · Nov 6, 2017
 Q3 2017 Earnings Presentation26 slides · Nov 6, 2017
 Proxy Contest (September 2017)27 slides · Sep 13, 2017
 Investor Presentation (September 2017)38 slides · Sep 12, 2017
 Corporate Update (September 2017)23 slides · Sep 6, 2017