MidWestOne Financial Group Inc
MidWestOne Financial — Investor Presentation (February 2021)
48 slides from MidWestOne Financial's investor presentation, Feb 26, 2021

Slide 1: Investor Presentation December 31, 2020
Investor Presentation December 31, 2020
Slide 2: Forward-Looking Statements & Non-GAAP Measures
2 Forward-Looking Statements & Non-GAAP Measures Cautionary Note Regarding Forward-Looking Statements This investor presentation contains certain “forward-looking statements” within the meaning of such term in the Private Securities Litigation Reform Act of 1995. We and our representatives may, from
Slide 3: Presentation Index
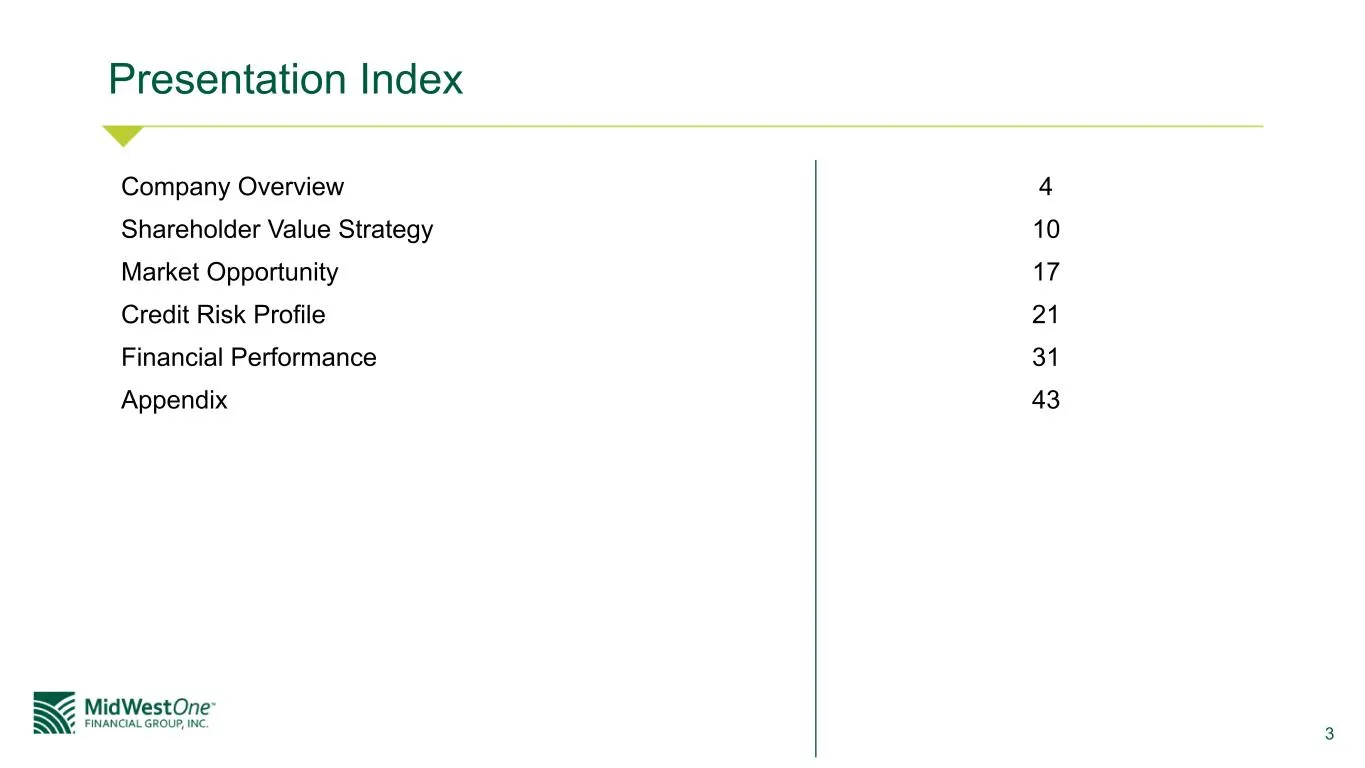
3 Company Overview 4 Shareholder Value Strategy 10 Market Opportunity 17 Credit Risk Profile 21 Financial Performance 31 Appendix 43 Presentation Index
Slide 4: Company Overview
4 Company Overview
Slide 5: Company Overview
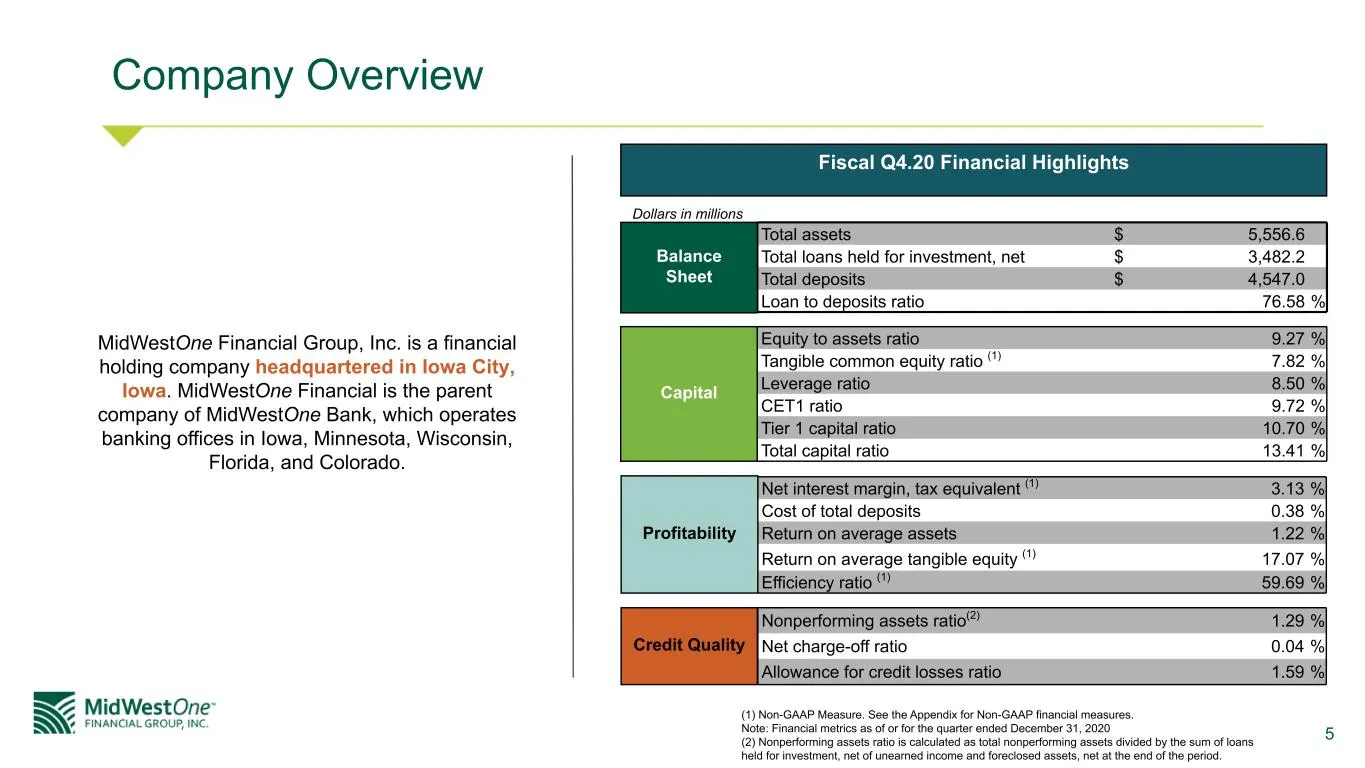
5 Company Overview MidWestOne Financial Group, Inc. is a financial holding company headquartered in Iowa City, Iowa. MidWestOne Financial is the parent company of MidWestOne Bank, which operates banking offices in Iowa, Minnesota, Wisconsin, Florida, and Colorado. Total assets $ 5,556.6 Total loans
Slide 6: Corporate History
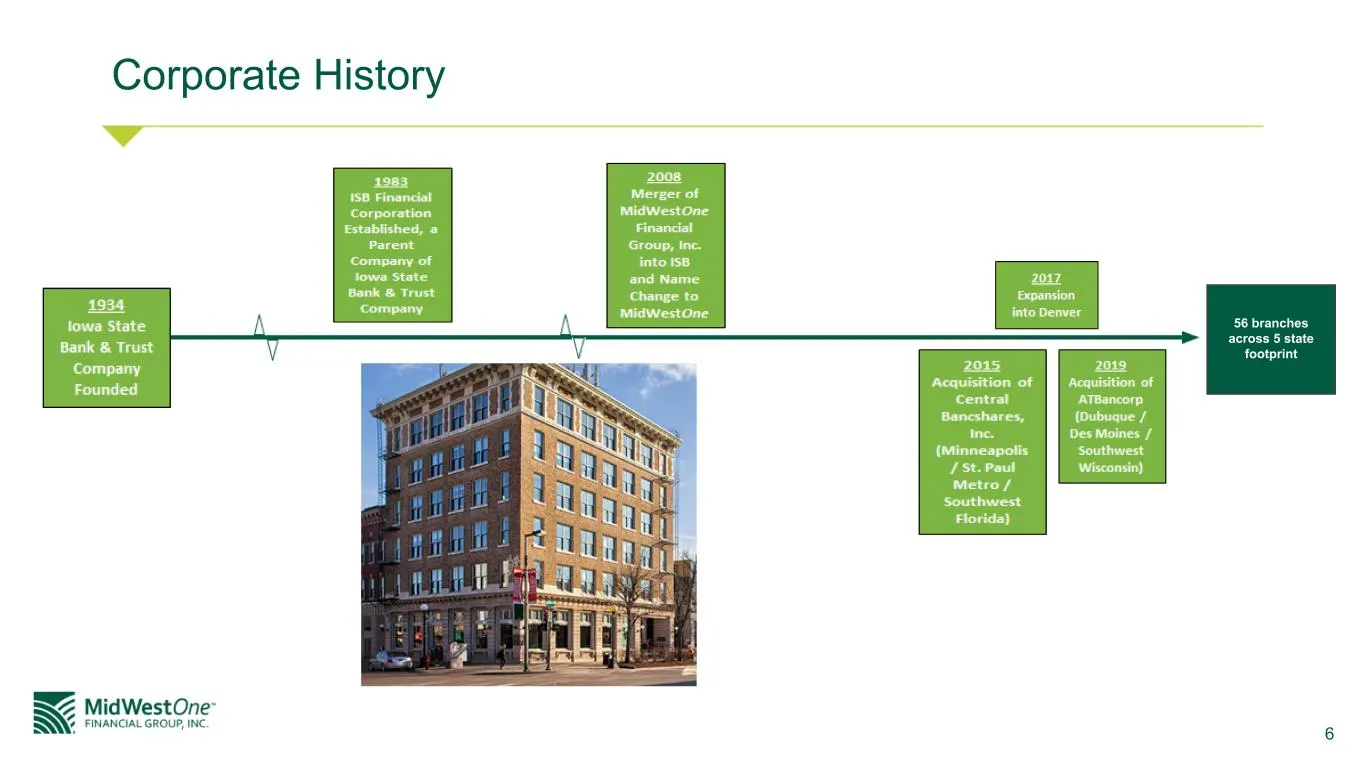
6 Corporate History 56 branches across 5 state footprint
Slide 7: Branch Franchise
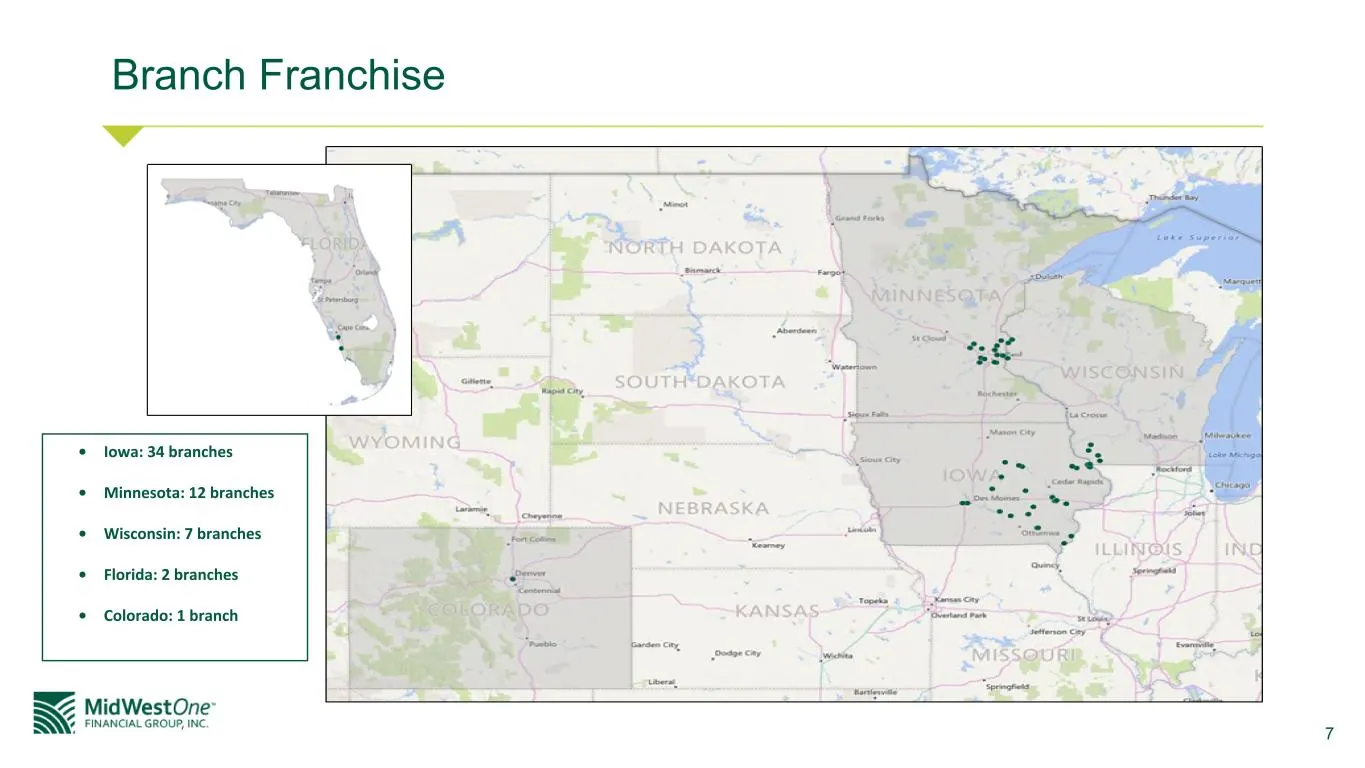
7 Branch Franchise • Iowa: 34 branches • Minnesota: 12 branches • Wisconsin: 7 branches • Florida: 2 branches • Colorado: 1 branch
Slide 8: Historical Growth - Organic and Acquisitive
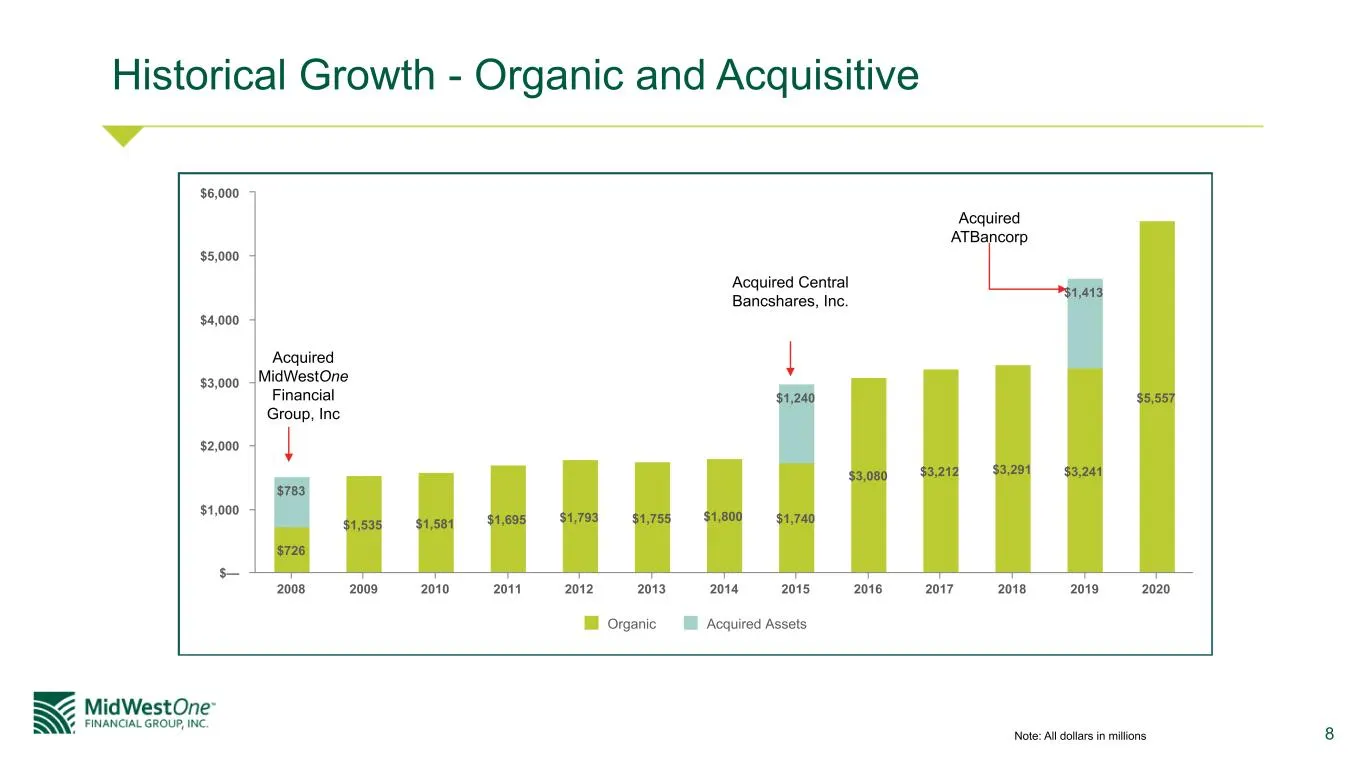
8 Historical Growth - Organic and Acquisitive $726 $1,535 $1,581 $1,695 $1,793 $1,755 $1,800 $1,740 $3,080 $3,212 $3,291 $3,241 $5,557 $783 $1,240 $1,413 Organic Acquired Assets 2008 2009 2010 2011 2012 2013 2014 2015 2016 2017 2018 2019 2020 $— $1,000 $2,000 $3,000 $4,000 $5,000 $6,000 Acquired ATB
Slide 9: Our Mission and Our Operating Principles
9 Our Mission and Our Operating Principles Take care of our customers … and those that should be. Since our company was founded during the Great Depression, it has been our belief that the communities we serve are not only the inspiration of our organization, but the purpose behind our existence. Ou
Slide 10: Shareholder Value Strategy
10 Shareholder Value Strategy
Slide 11: Shareholder Value Strategy
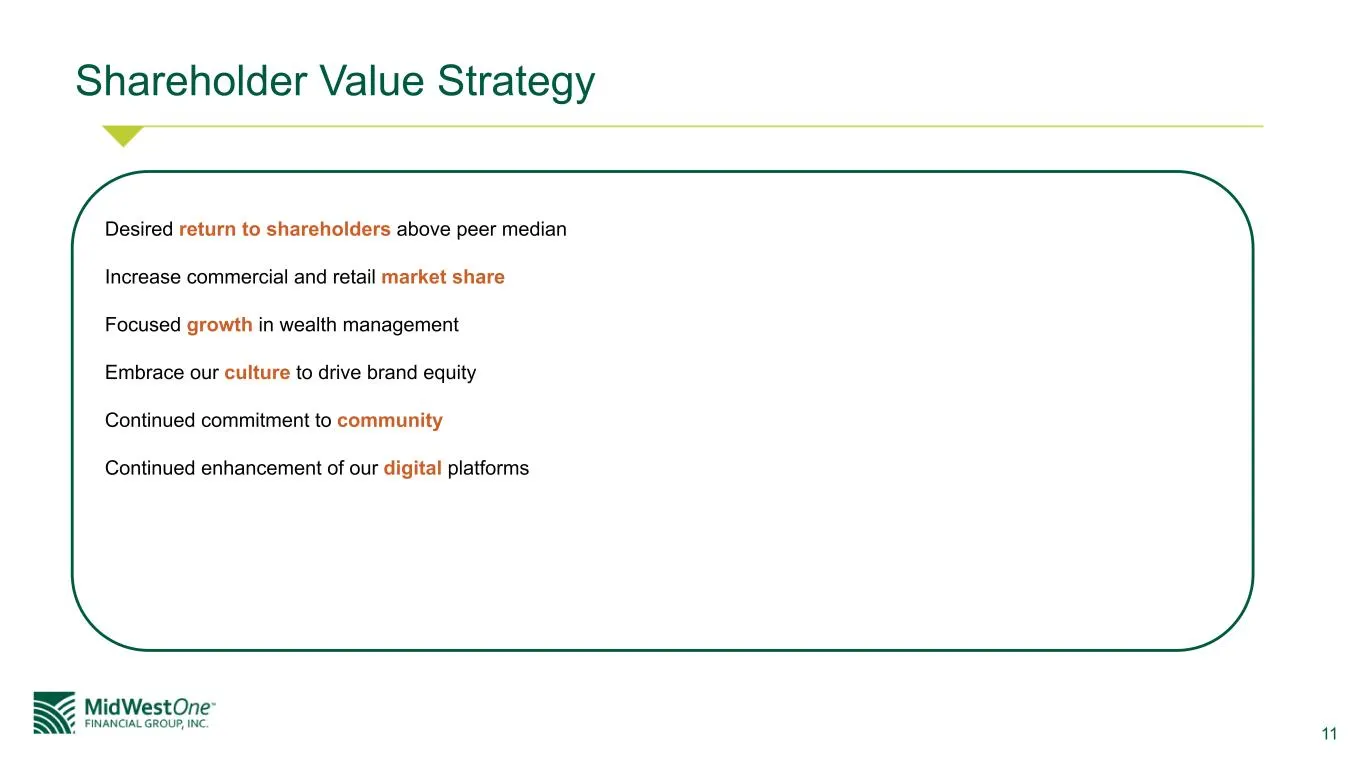
11 Shareholder Value Strategy Desired return to shareholders above peer median Increase commercial and retail market share Focused growth in wealth management Embrace our culture to drive brand equity Continued commitment to community Continued enhancement of our digital platforms
Slide 12: Commitment to Shareholders
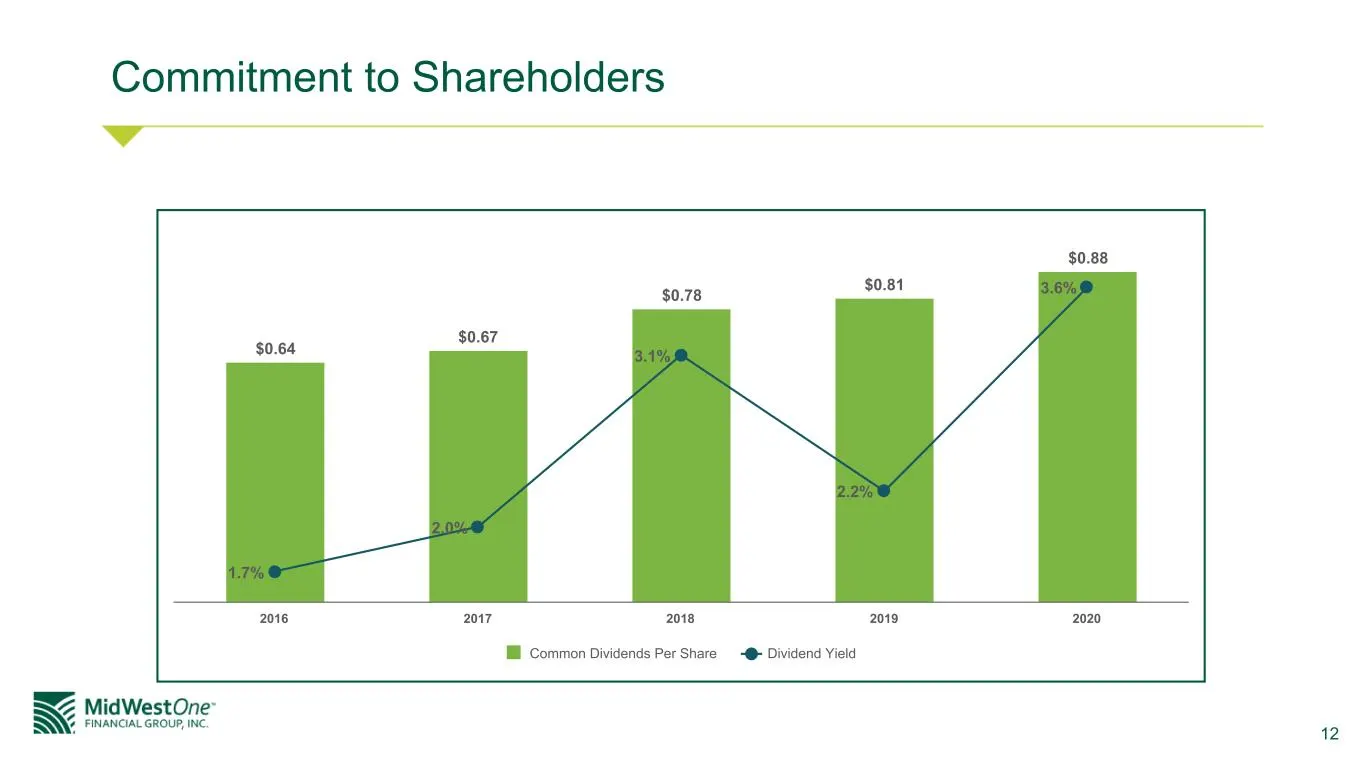
12 Commitment to Shareholders $0.64 $0.67 $0.78 $0.81 $0.88 1.7% 2.0% 3.1% 2.2% 3.6% Common Dividends Per Share Dividend Yield 2016 2017 2018 2019 2020
Slide 13: Focused Growth in Wealth Management
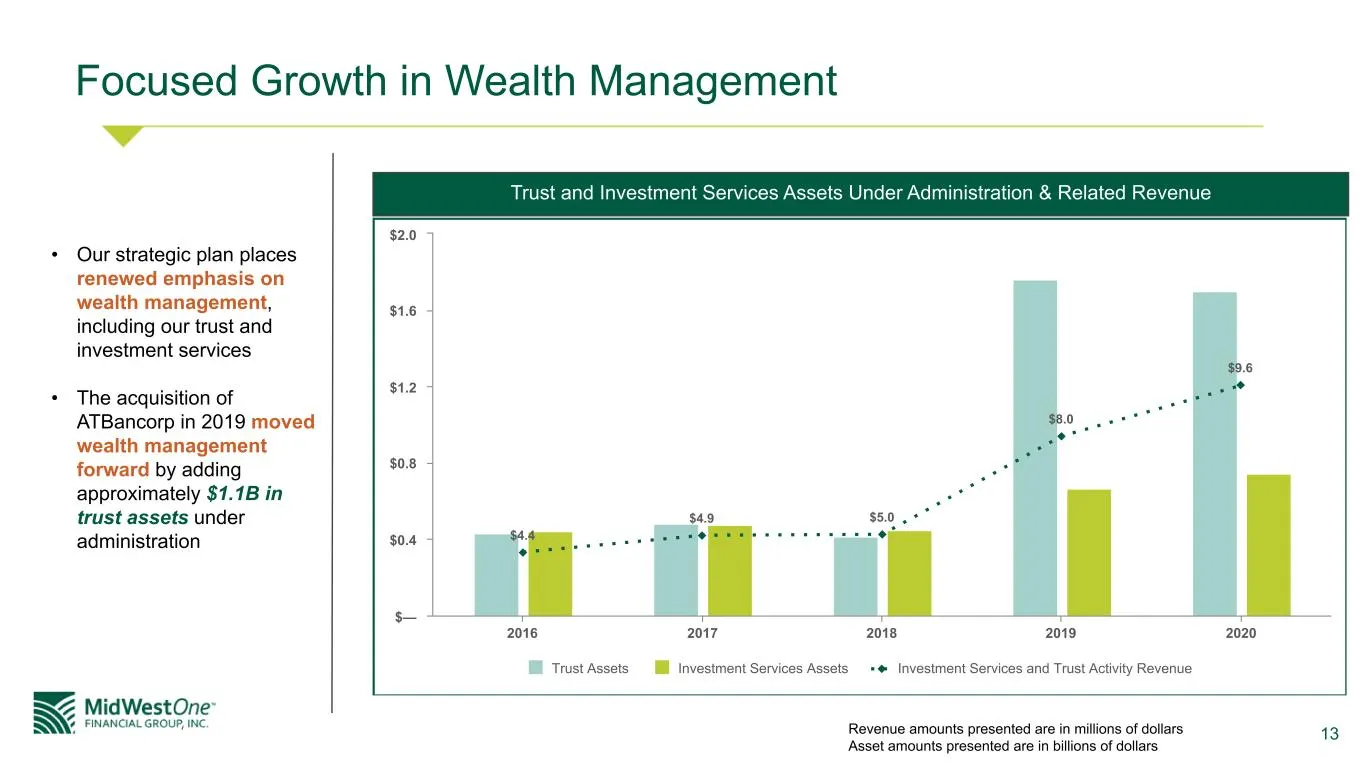
13 Focused Growth in Wealth Management $4.4 $4.9 $5.0 $8.0 $9.6 Trust Assets Investment Services Assets Investment Services and Trust Activity Revenue 2016 2017 2018 2019 2020 $— $0.4 $0.8 $1.2 $1.6 $2.0 • Our strategic plan places renewed emphasis on wealth management, including our trust and inves
Slide 14: Embrace Our Culture to Drive Brand Equity
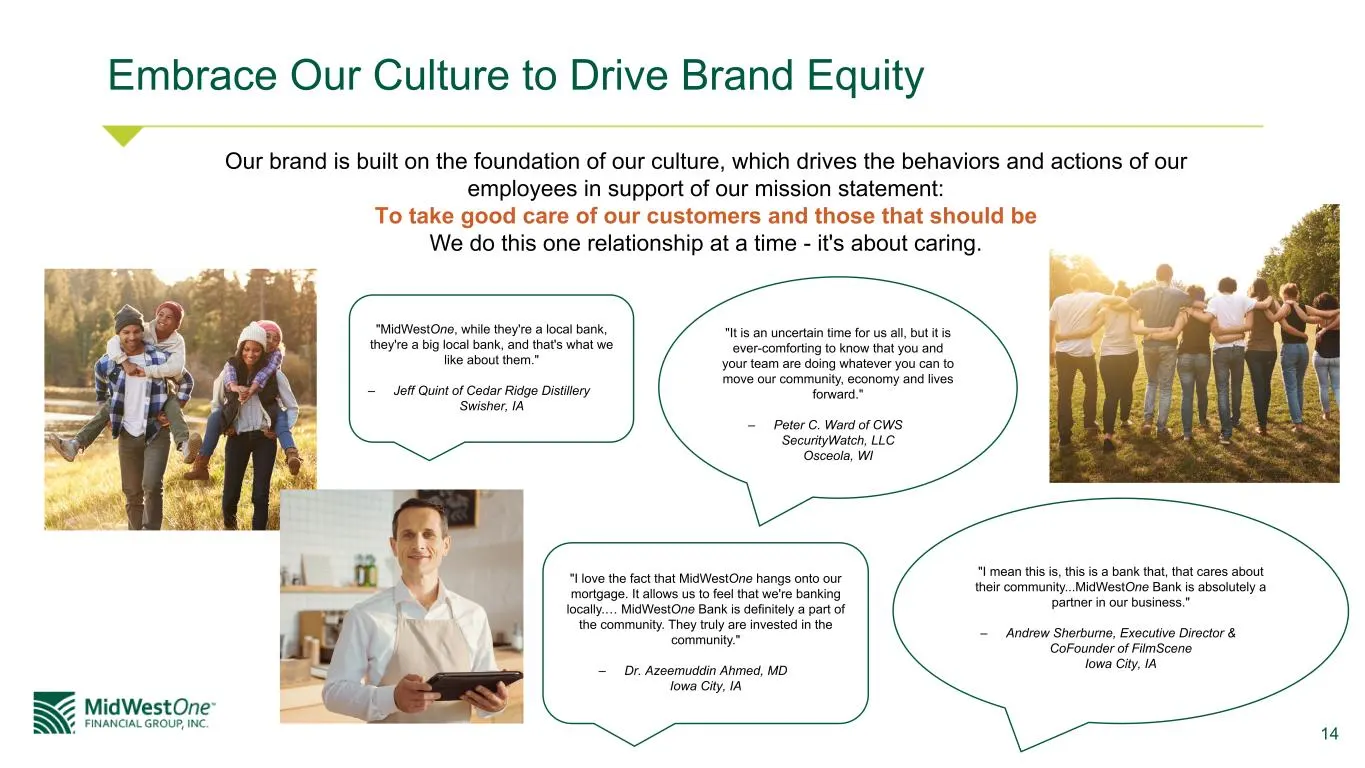
14 Embrace Our Culture to Drive Brand Equity Our brand is built on the foundation of our culture, which drives the behaviors and actions of our employees in support of our mission statement: To take good care of our customers and those that should be We do this one relationship at a time - it's abou
Slide 15: Enhancing our Digital Platforms
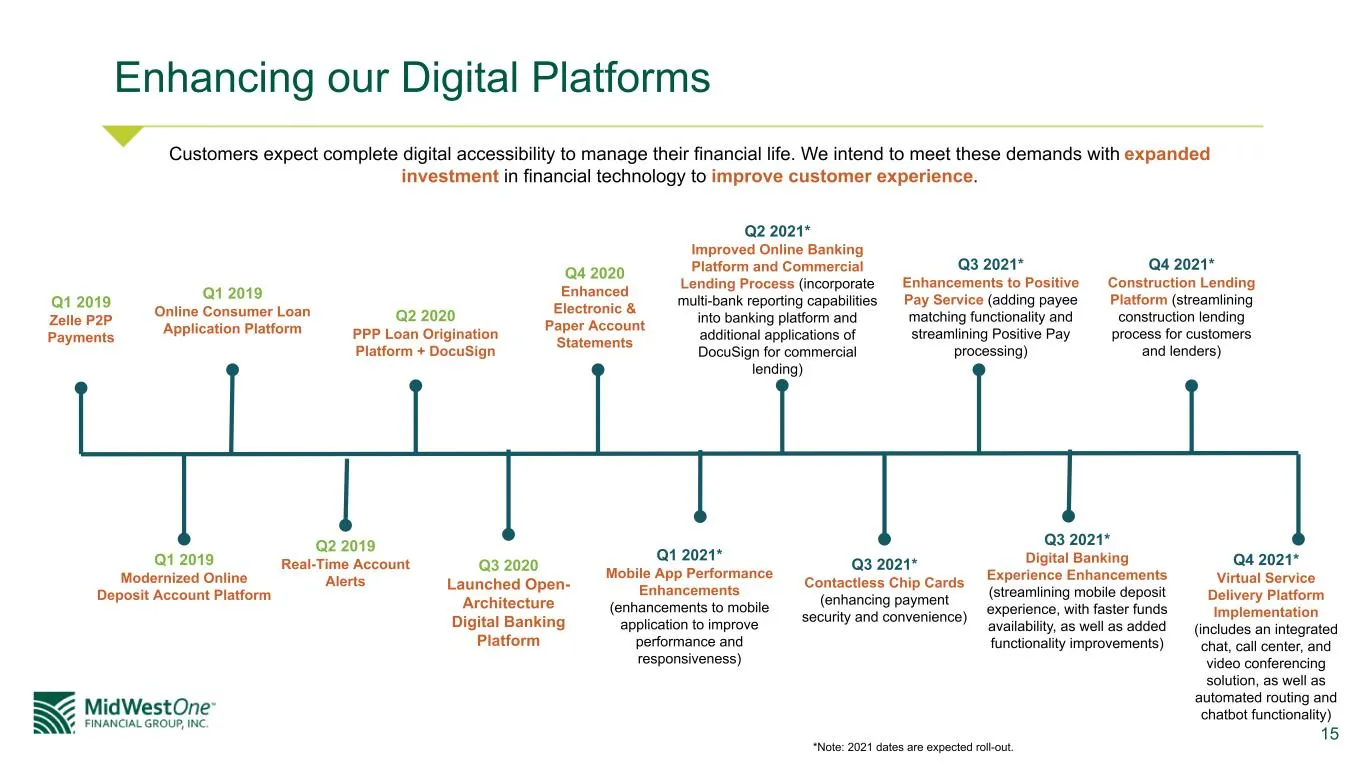
15 Enhancing our Digital Platforms Customers expect complete digital accessibility to manage their financial life. We intend to meet these demands with expanded investment in financial technology to improve customer experience. Q1 2019 Zelle P2P Payments Q1 2019 Online Consumer Loan Application Plat
Slide 16: Digital and Branch Banking Trends
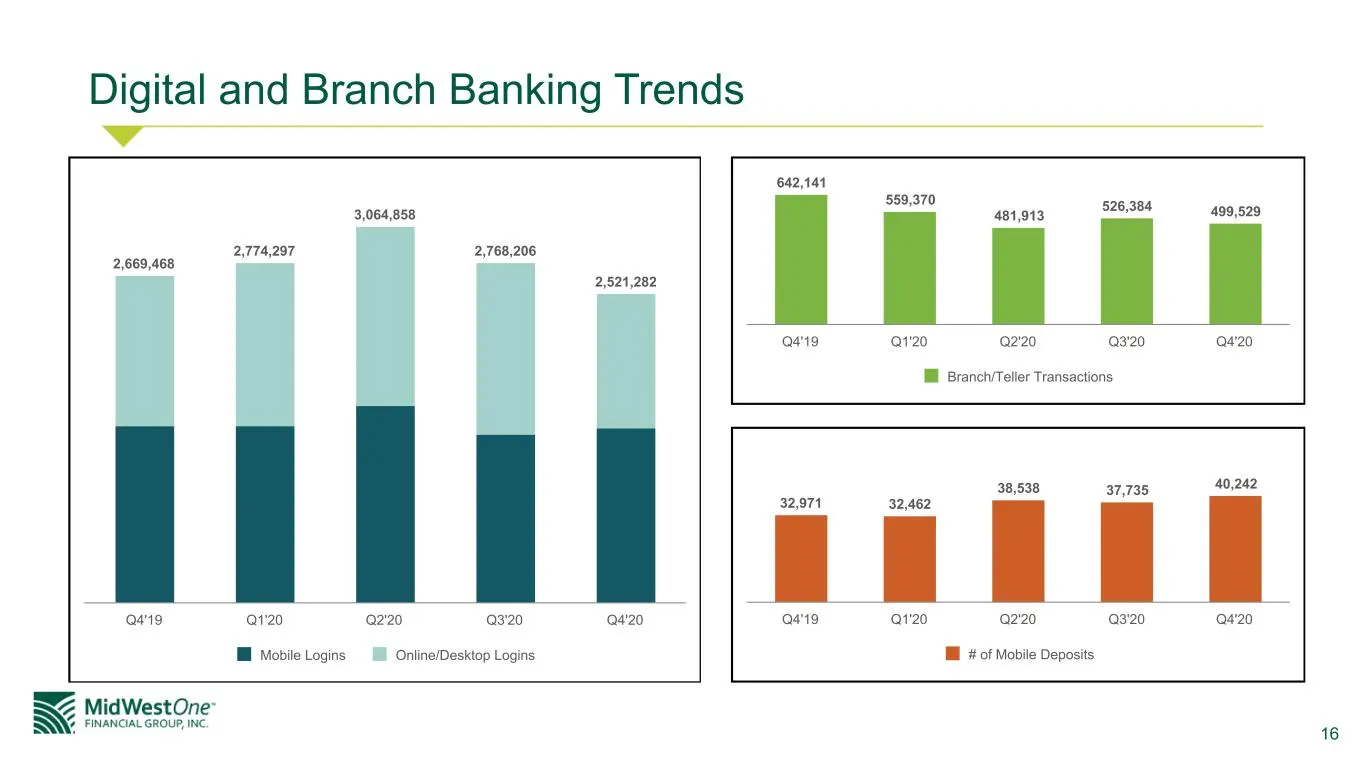
16 Digital and Branch Banking Trends 2,669,468 2,774,297 3,064,858 2,768,206 2,521,282 Mobile Logins Online/Desktop Logins Q4'19 Q1'20 Q2'20 Q3'20 Q4'20 642,141 559,370 481,913 526,384 499,529 Branch/Teller Transactions Q4'19 Q1'20 Q2'20 Q3'20 Q4'20 32,971 32,462 38,538 37,735 40,242 # of Mobile Dep
Slide 17: Market Opportunity
Market Opportunity Re MidWestOne- FINANCIAL GROUP, INC. 7
Slide 18: Why MidWestOne?
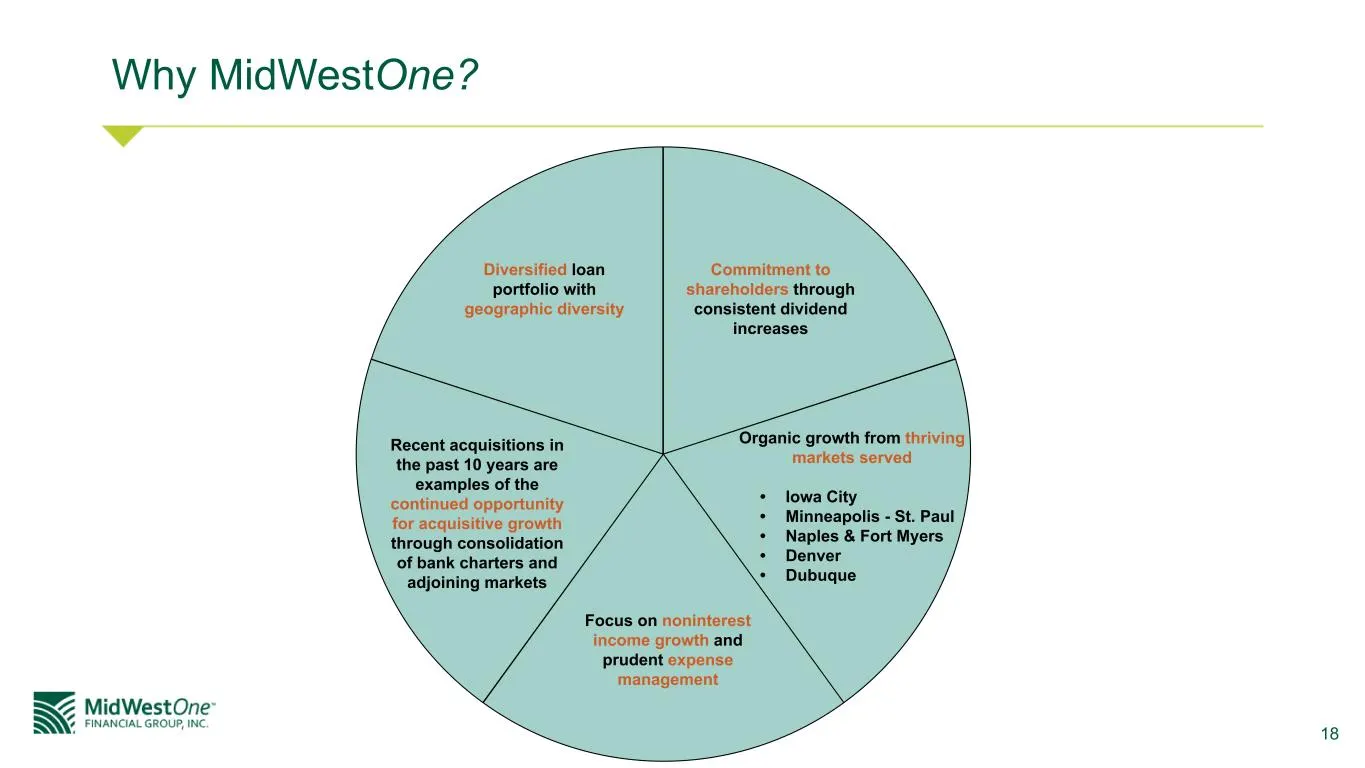
18 Why MidWestOne? Commitment to shareholders through consistent dividend increases Diversified loan portfolio with geographic diversity Focus on noninterest income growth and prudent expense management Recent acquisitions in the past 10 years are examples of the continued opportunity for acquisitiv
Slide 19: Compelling Metropolitan Markets
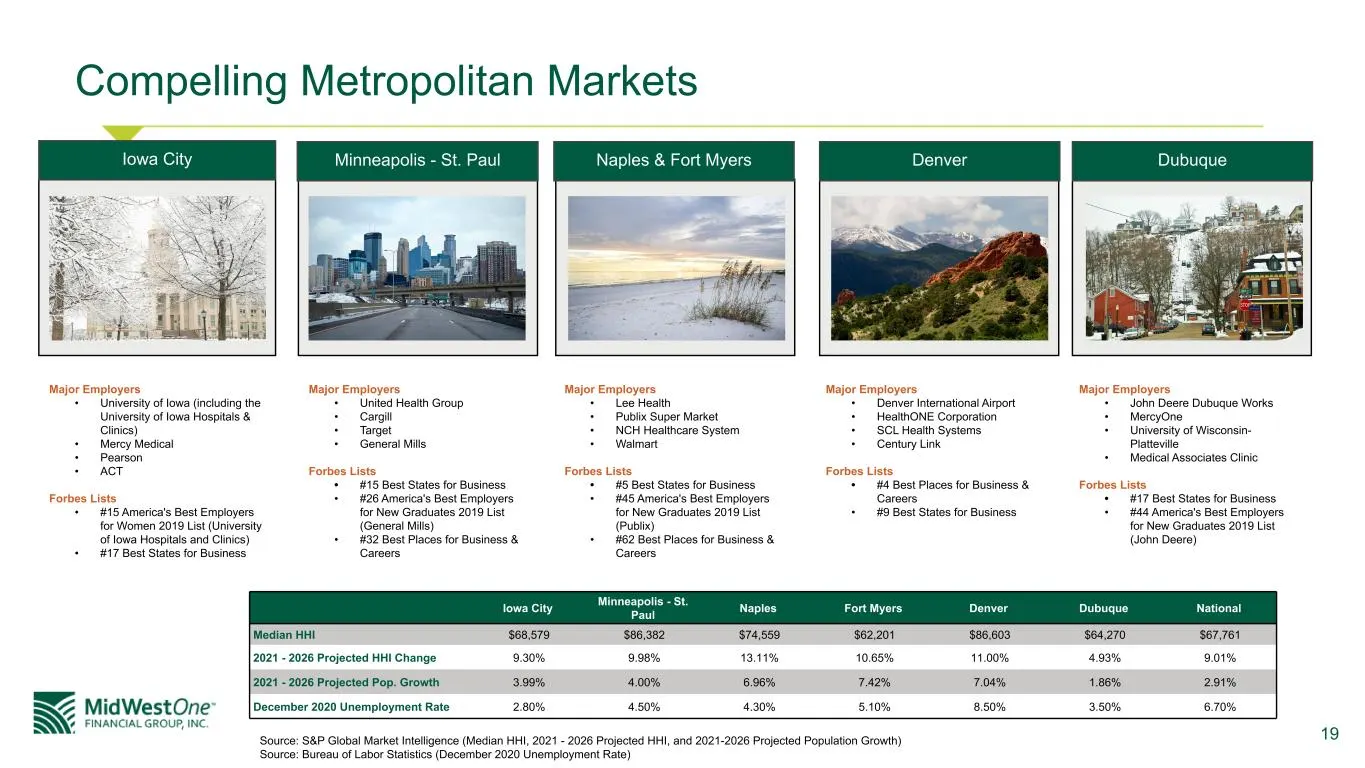
19 Compelling Metropolitan Markets Iowa City Minneapolis - St. Paul Naples Fort Myers Denver Dubuque National Median HHI $68,579 $86,382 $74,559 $62,201 $86,603 $64,270 $67,761 2021 - 2026 Projected HHI Change 9.30% 9.98% 13.11% 10.65% 11.00% 4.93% 9.01% 2021 - 2026 Projected Pop. Growth 3.99% 4.00%
Slide 20: Continued Market for Consolidation
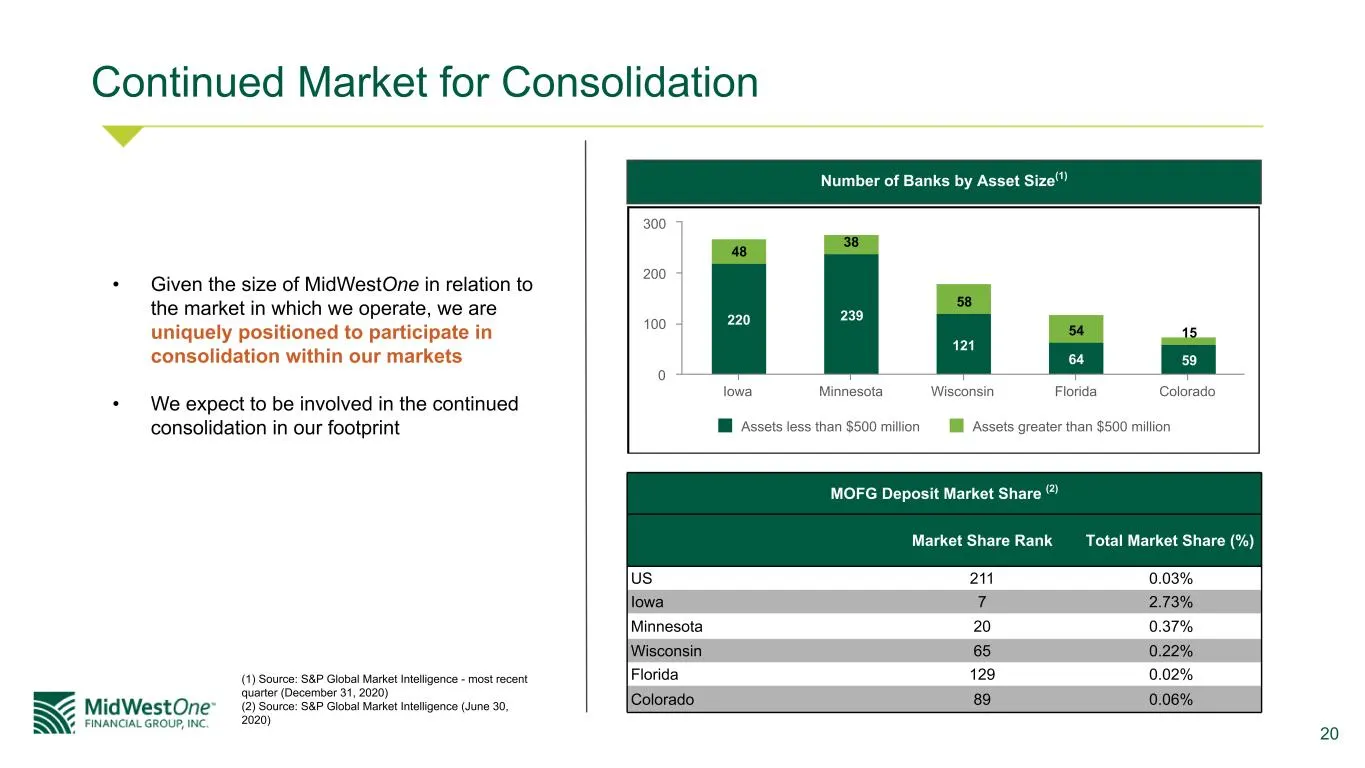
20 Continued Market for Consolidation (1) Source: S&P Global Market Intelligence - most recent quarter (December 31, 2020) (2) Source: S&P Global Market Intelligence (June 30, 2020) 220 239 121 64 59 48 38 58 54 15 Assets less than $500 million Assets greater than $500 million Iowa Minnesota Wiscons
Slide 21: Credit Risk Profile
FINANCIAL GROUP, INC. 24
Slide 22: Credit Quality
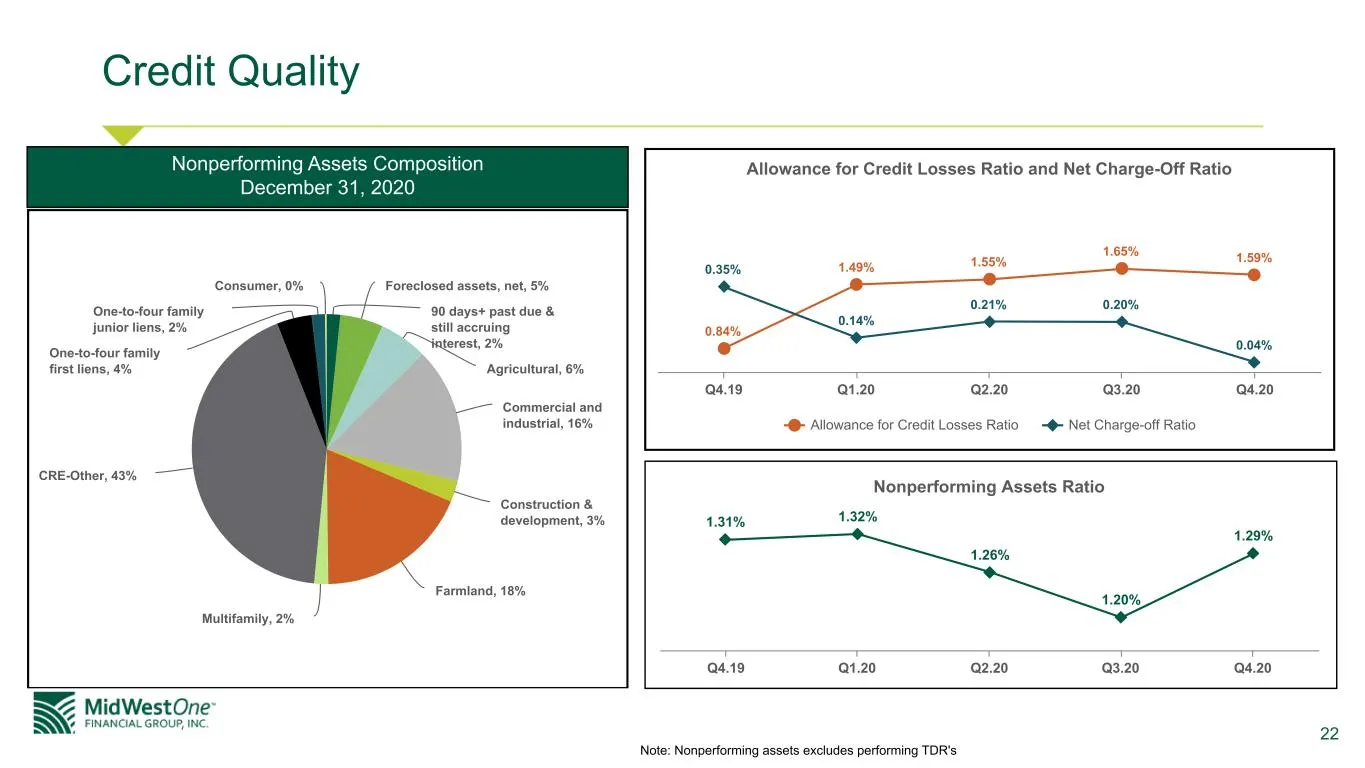
22 Credit Quality Note: Nonperforming assets excludes performing TDR's Allowance for Credit Losses Ratio and Net Charge-Off Ratio 0.84% 1.49% 1.55% 1.65% 1.59% 0.35% 0.14% 0.21% 0.20% 0.04% Allowance for Credit Losses Ratio Net Charge-off Ratio Q4.19 Q1.20 Q2.20 Q3.20 Q4.20 Nonperforming Assets Rati
Slide 23: Credit Monitoring
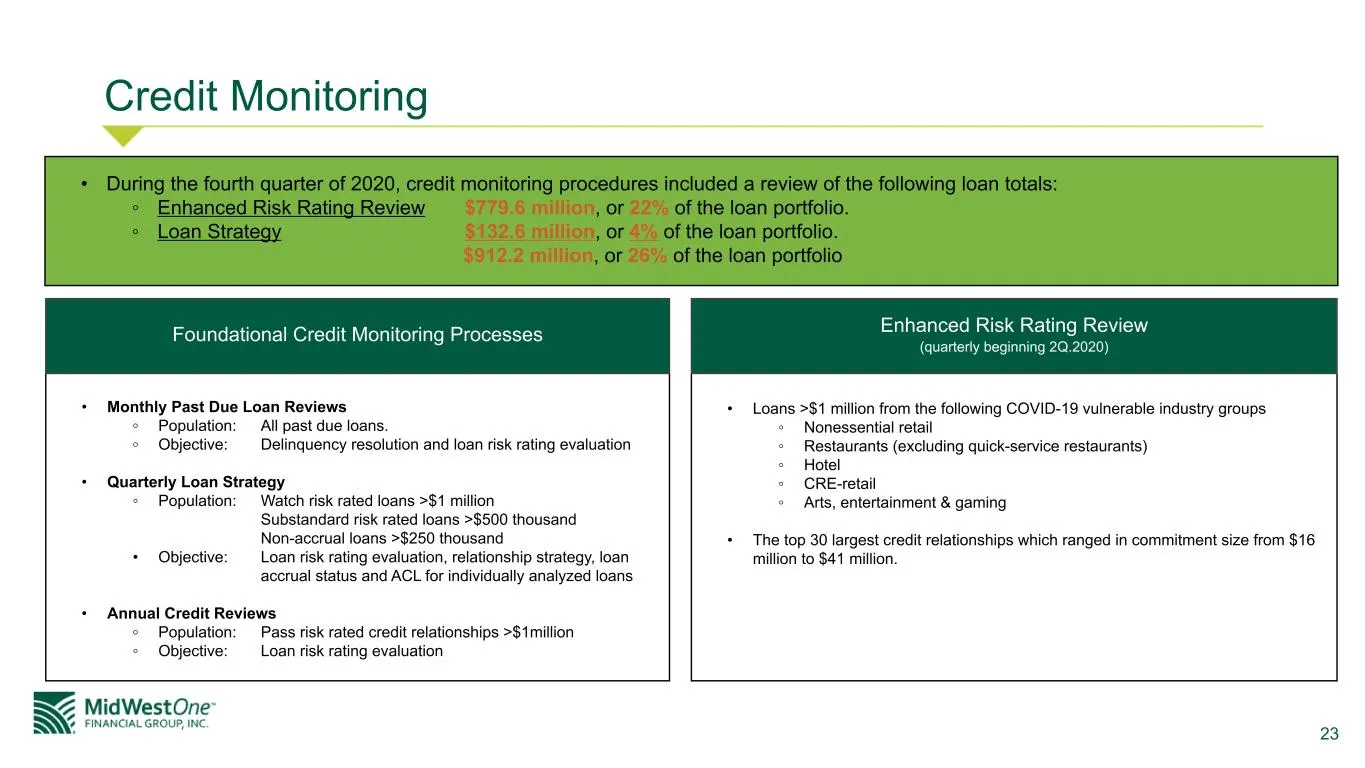
23 Credit Monitoring • Monthly Past Due Loan Reviews ◦ Population: All past due loans. ◦ Objective: Delinquency resolution and loan risk rating evaluation • Quarterly Loan Strategy ◦ Population: Watch risk rated loans >$1 million Substandard risk rated loans >$500 thousand Non-accrual loans >$250 th
Slide 24: Exposure in Vulnerable Industries
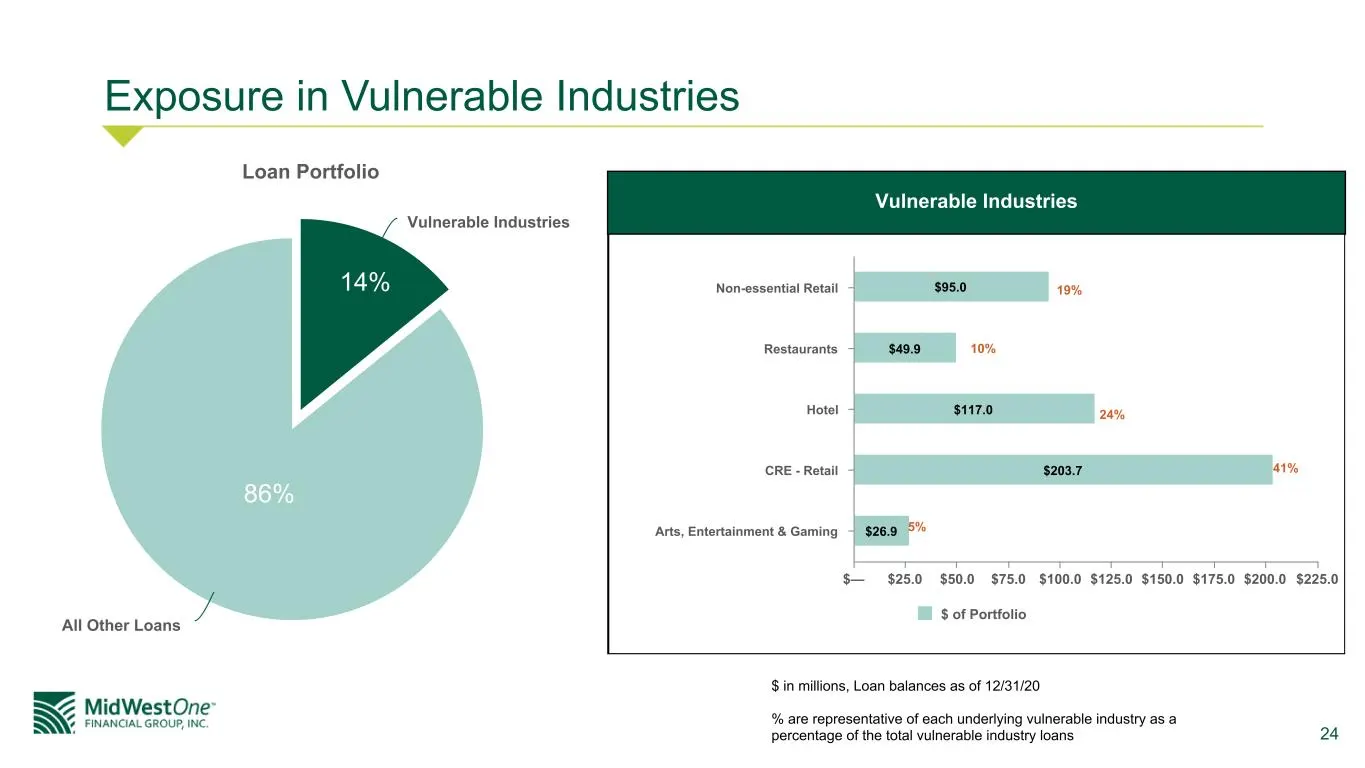
24 Exposure in Vulnerable Industries Loan Portfolio Vulnerable Industries All Other Loans $95.0 $49.9 $117.0 $203.7 $26.9 $ of Portfolio Non-essential Retail Restaurants Hotel CRE - Retail Arts, Entertainment & Gaming $— $25.0 $50.0 $75.0 $100.0 $125.0 $150.0 $175.0 $200.0 $225.0 19% 10% 24% 41% 5%
Slide 25: Exposure in Vulnerable Industries: Non-essential Retail
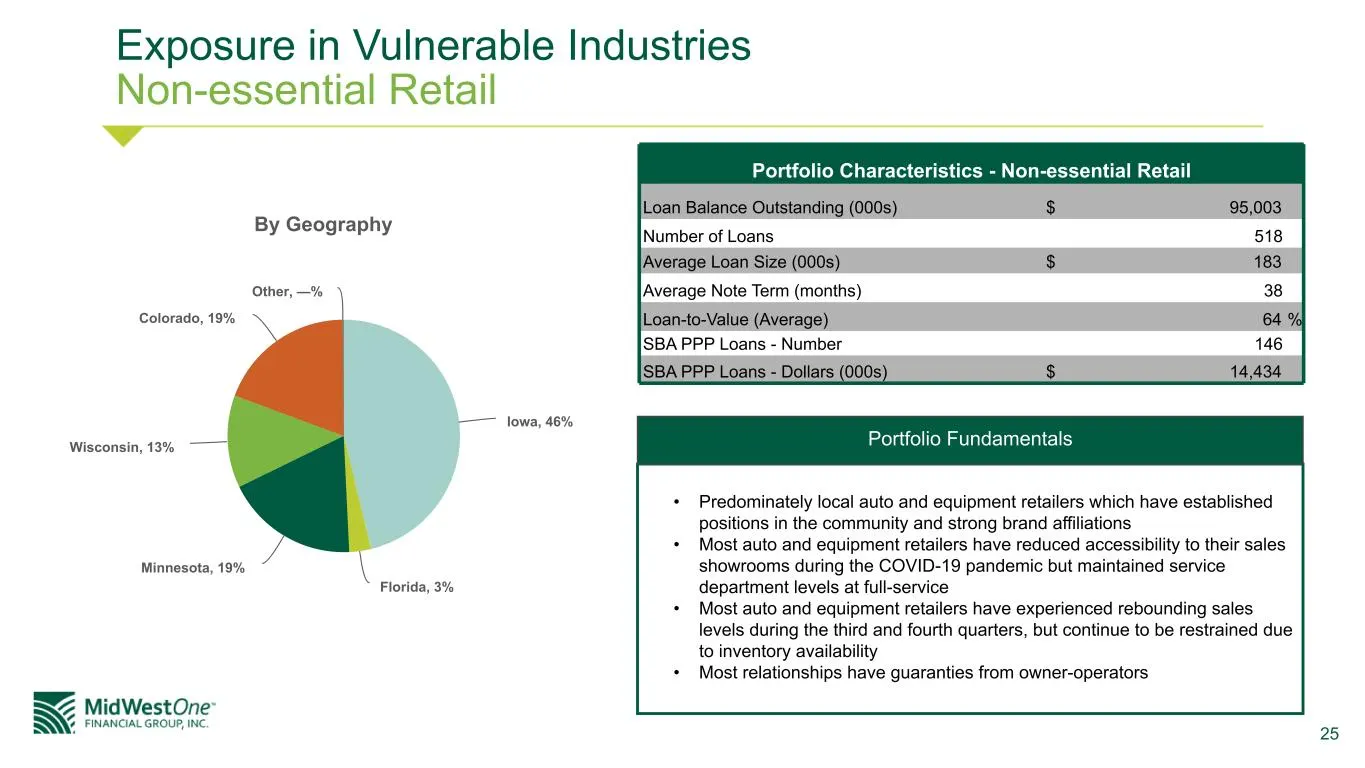
25 Exposure in Vulnerable Industries Non-essential Retail By Geography Iowa, 46% Florida, 3% Minnesota, 19% Wisconsin, 13% Colorado, 19% Other, —% Portfolio Characteristics - Non-essential Retail Loan Balance Outstanding (000s) $ 95,003 Number of Loans 518 Average Loan Size (000s) $ 183 Average Note
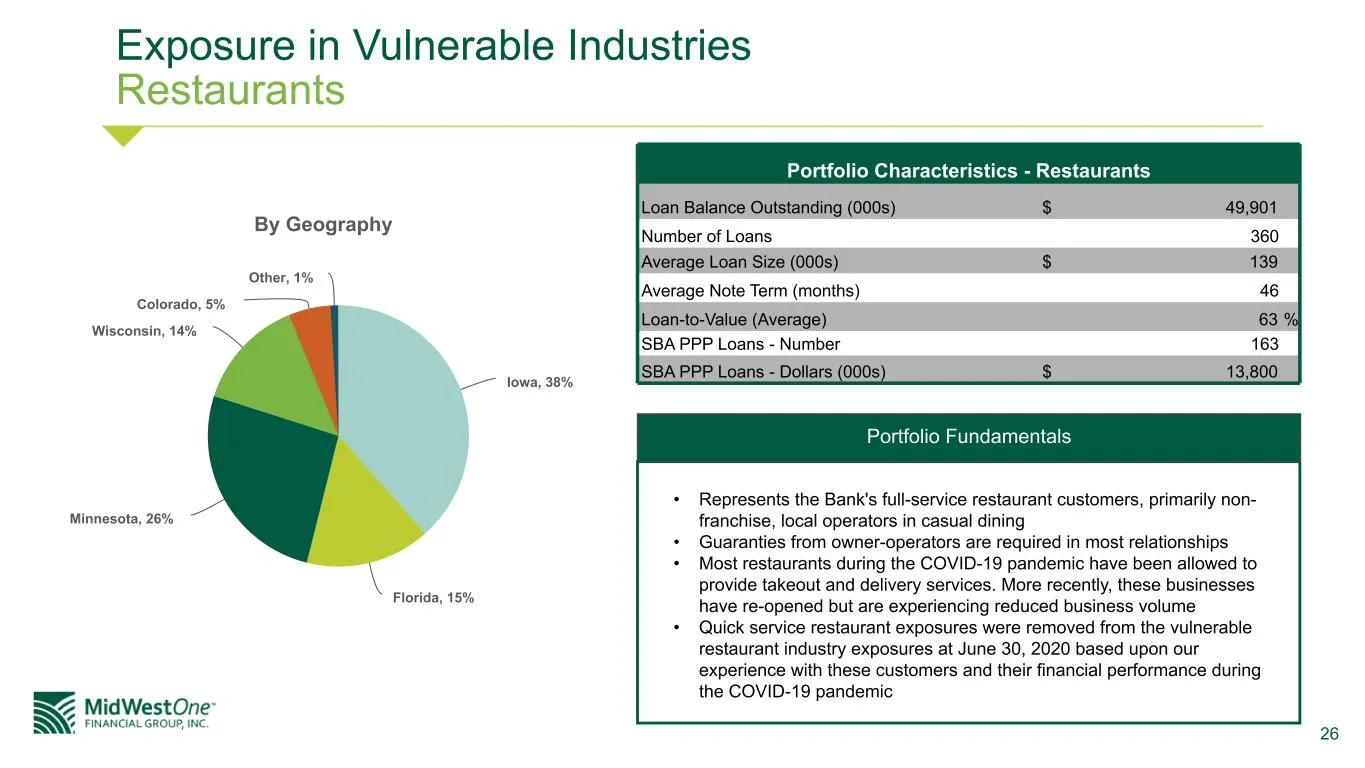
Slide 26: Exposure in Vulnerable Industries: Restaurants
26 Exposure in Vulnerable Industries Restaurants By Geography Iowa, 38% Florida, 15% Minnesota, 26% Wisconsin, 14% Colorado, 5% Other, 1% Portfolio Characteristics - Restaurants Loan Balance Outstanding (000s) $ 49,901 Number of Loans 360 Average Loan Size (000s) $ 139 Average Note Term (months) 46
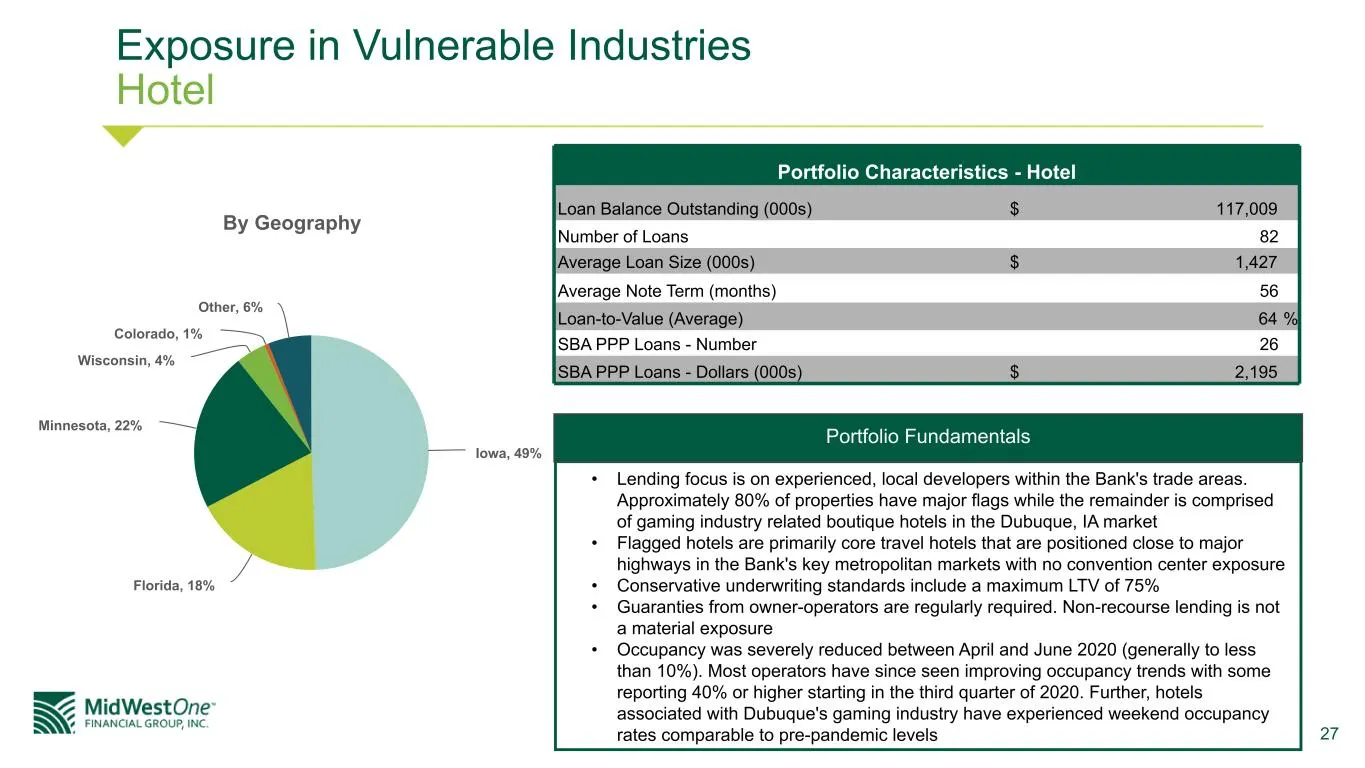
Slide 27: Exposure in Vulnerable Industries: Hotel
27 Exposure in Vulnerable Industries Hotel By Geography Iowa, 49% Florida, 18% Minnesota, 22% Wisconsin, 4% Colorado, 1% Other, 6% Portfolio Characteristics - Hotel Loan Balance Outstanding (000s) $ 117,009 Number of Loans 82 Average Loan Size (000s) $ 1,427 Average Note Term (months) 56 Loan-to-Val
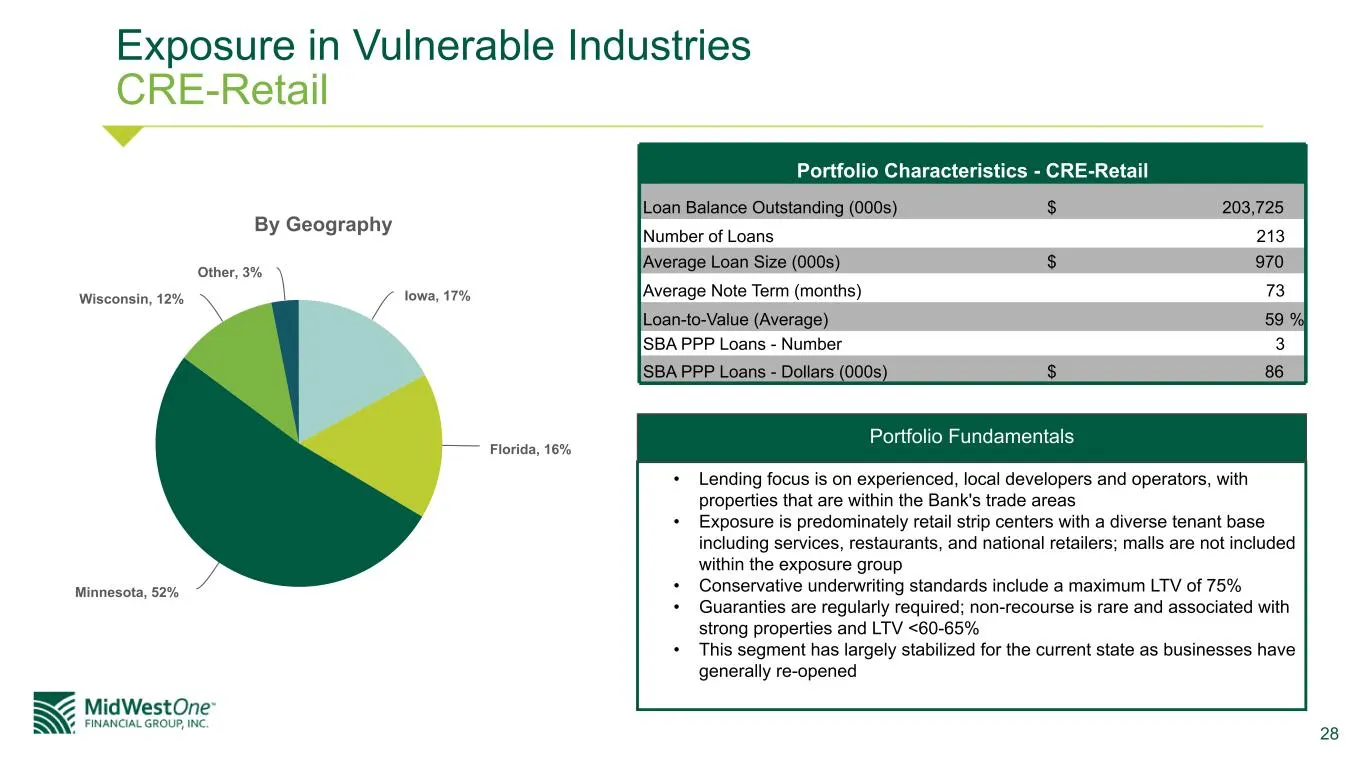
Slide 28: Exposure in Vulnerable Industries: CRE-Retail
28 Exposure in Vulnerable Industries CRE-Retail By Geography Iowa, 17% Florida, 16% Minnesota, 52% Wisconsin, 12% Other, 3% Portfolio Characteristics - CRE-Retail Loan Balance Outstanding (000s) $ 203,725 Number of Loans 213 Average Loan Size (000s) $ 970 Average Note Term (months) 73 Loan-to-Value
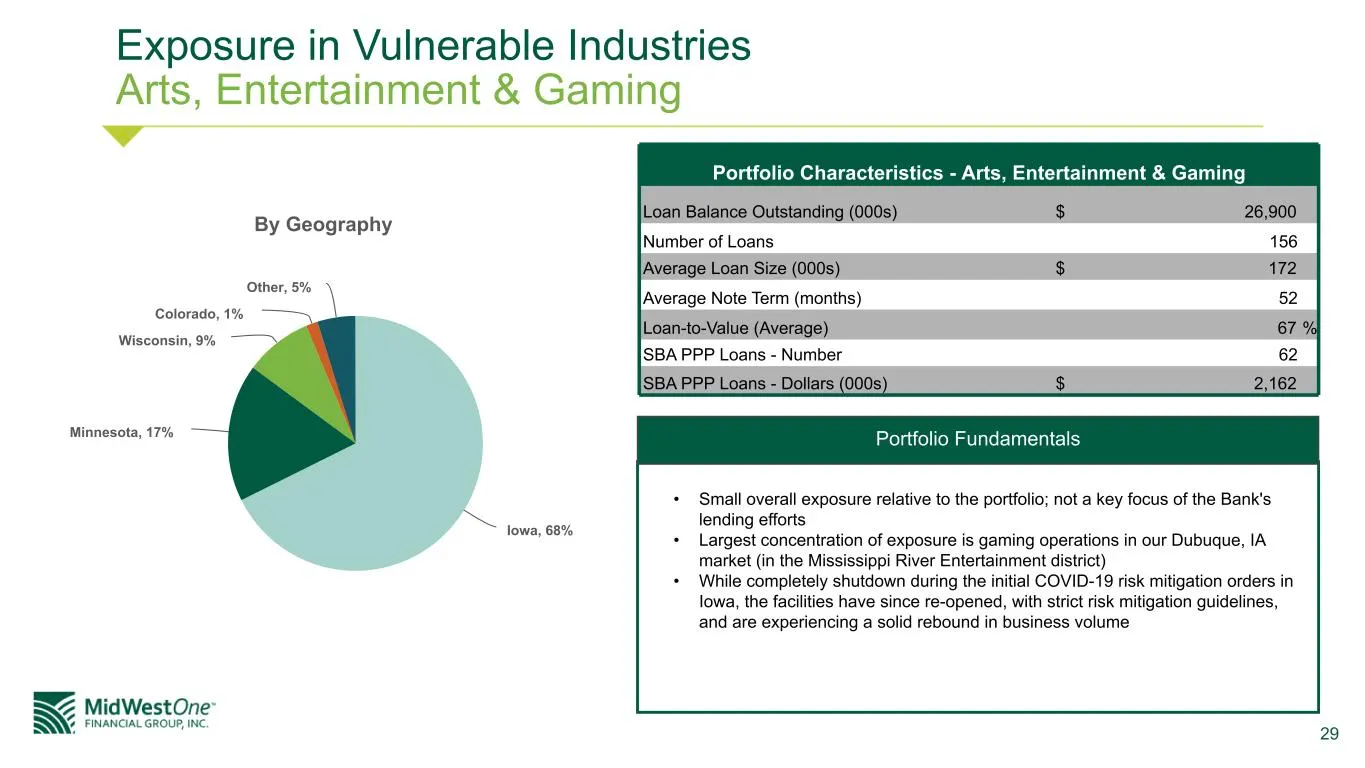
Slide 29: Exposure in Vulnerable Industries: Arts, Entertainment & Gaming
29 Exposure in Vulnerable Industries Arts, Entertainment & Gaming By Geography Iowa, 68% Minnesota, 17% Wisconsin, 9% Colorado, 1% Other, 5% Portfolio Characteristics - Arts, Entertainment & Gaming Loan Balance Outstanding (000s) $ 26,900 Number of Loans 156 Average Loan Size (000s) $ 172 Average No
Slide 30: COVID-19 Loan Modification Status
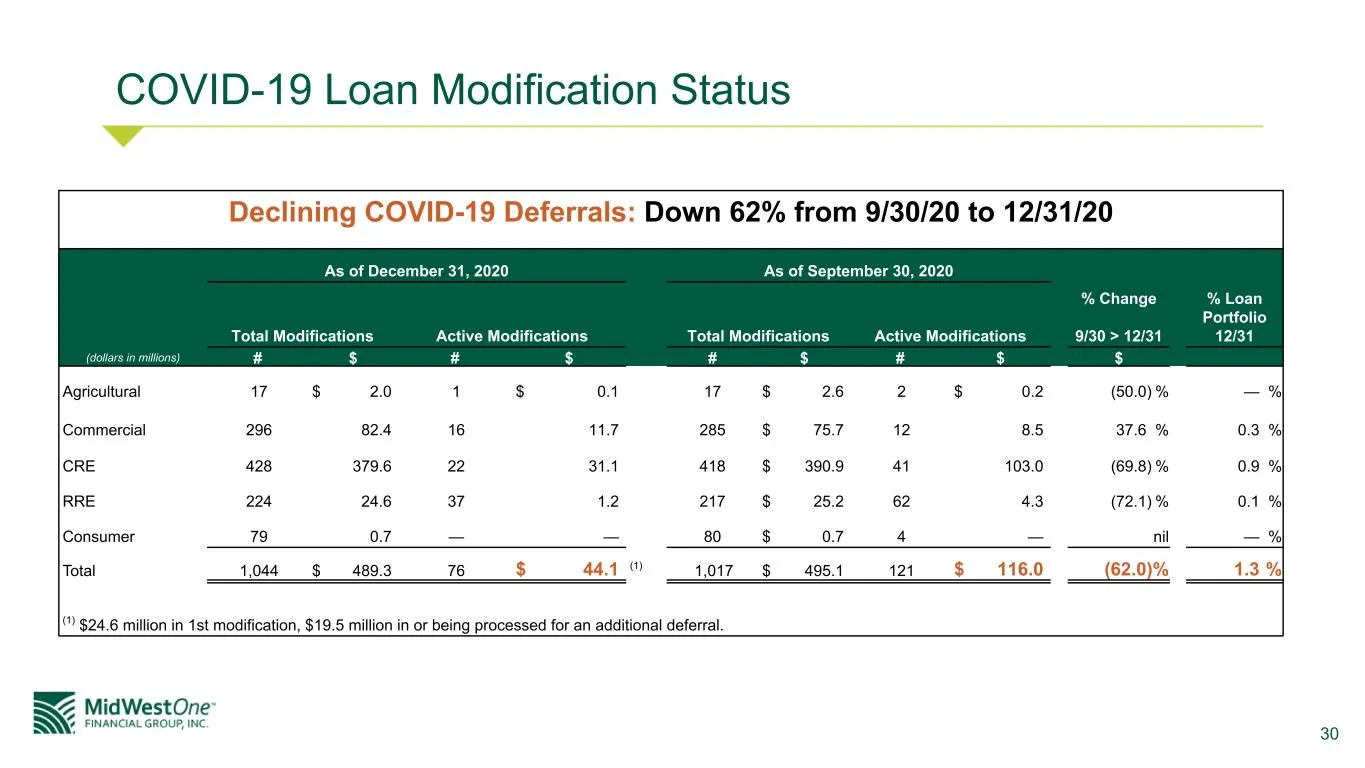
30 COVID-19 Loan Modification Status (dollars in millions) As of December 31, 2020 As of September 30, 2020 % Change 9/30 > 12/31 % Loan Portfolio 12/31Total Modifications Active Modifications Total Modifications Active Modifications # $ # $ # $ # $ $ Agricultural 17 $ 2.0 1 $ 0.1 17 $ 2.6 2 $ 0.2 (
Slide 31: Financial Performance
MidWestOne- FINANCIAL GROUP, INC. 31
Slide 32: Fourth Quarter and Full Year 2020 Summary
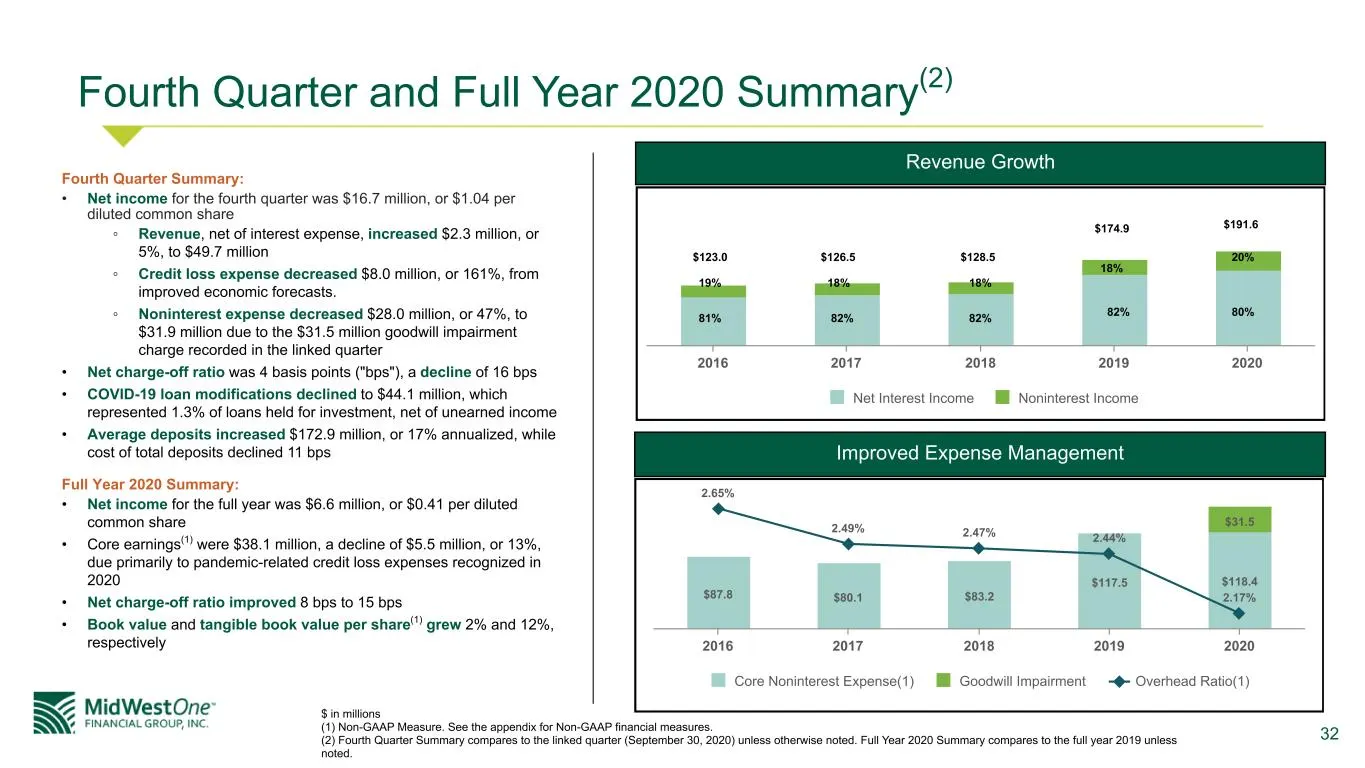
32 Fourth Quarter and Full Year 2020 Summary(2) Fourth Quarter Summary: • Net income for the fourth quarter was $16.7 million, or $1.04 per diluted common share ◦ Revenue, net of interest expense, increased $2.3 million, or 5%, to $49.7 million ◦ Credit loss expense decreased $8.0 million, or 161%,
Slide 33: Profitability Trends
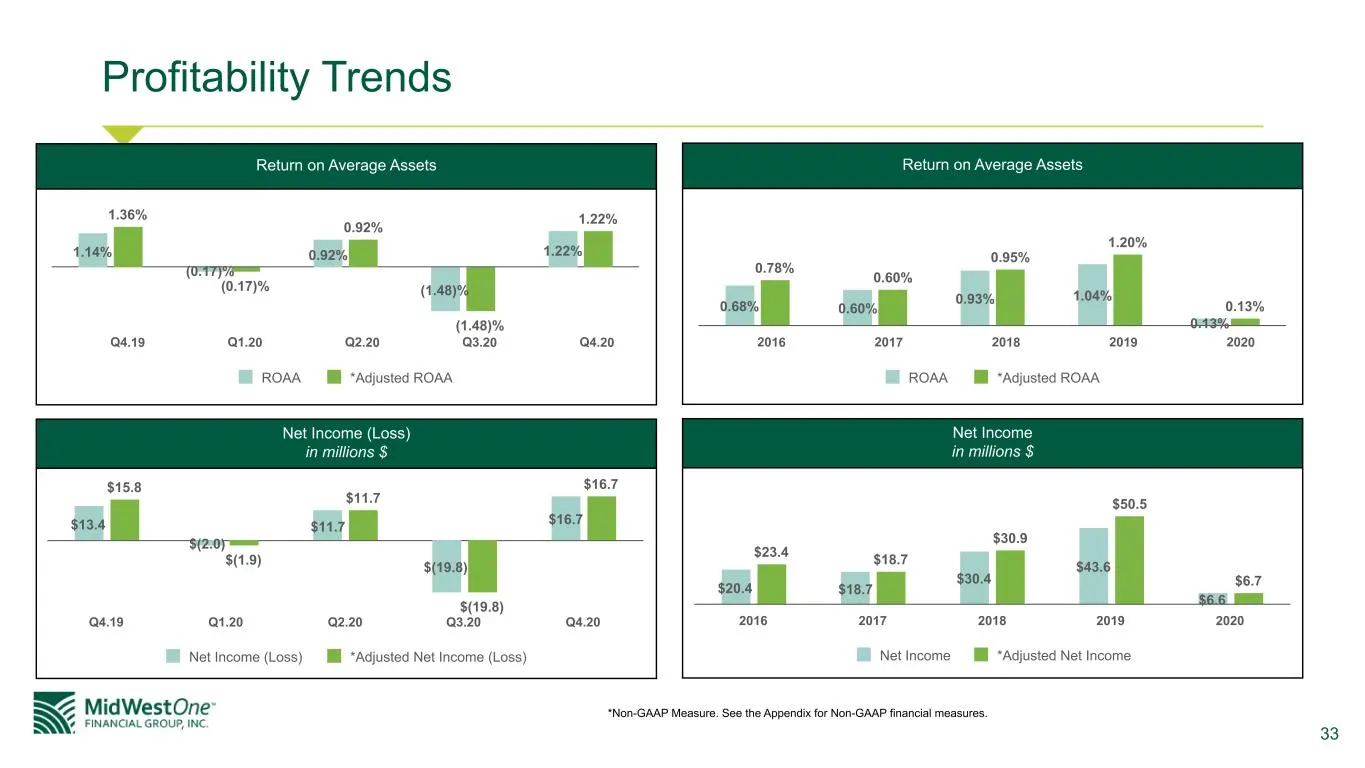
33 Profitability Trends *Non-GAAP Measure. See the Appendix for Non-GAAP financial measures. 1.14% (0.17)% 0.92% (1.48)% 1.22% 1.36% (0.17)% 0.92% (1.48)% 1.22% ROAA *Adjusted ROAA Q4.19 Q1.20 Q2.20 Q3.20 Q4.20 $13.4 $(2.0) $11.7 $(19.8) $16.7 $15.8 $(1.9) $11.7 $(19.8) $16.7 Net Income (Loss) *Adju
Slide 34: Profitability Trends
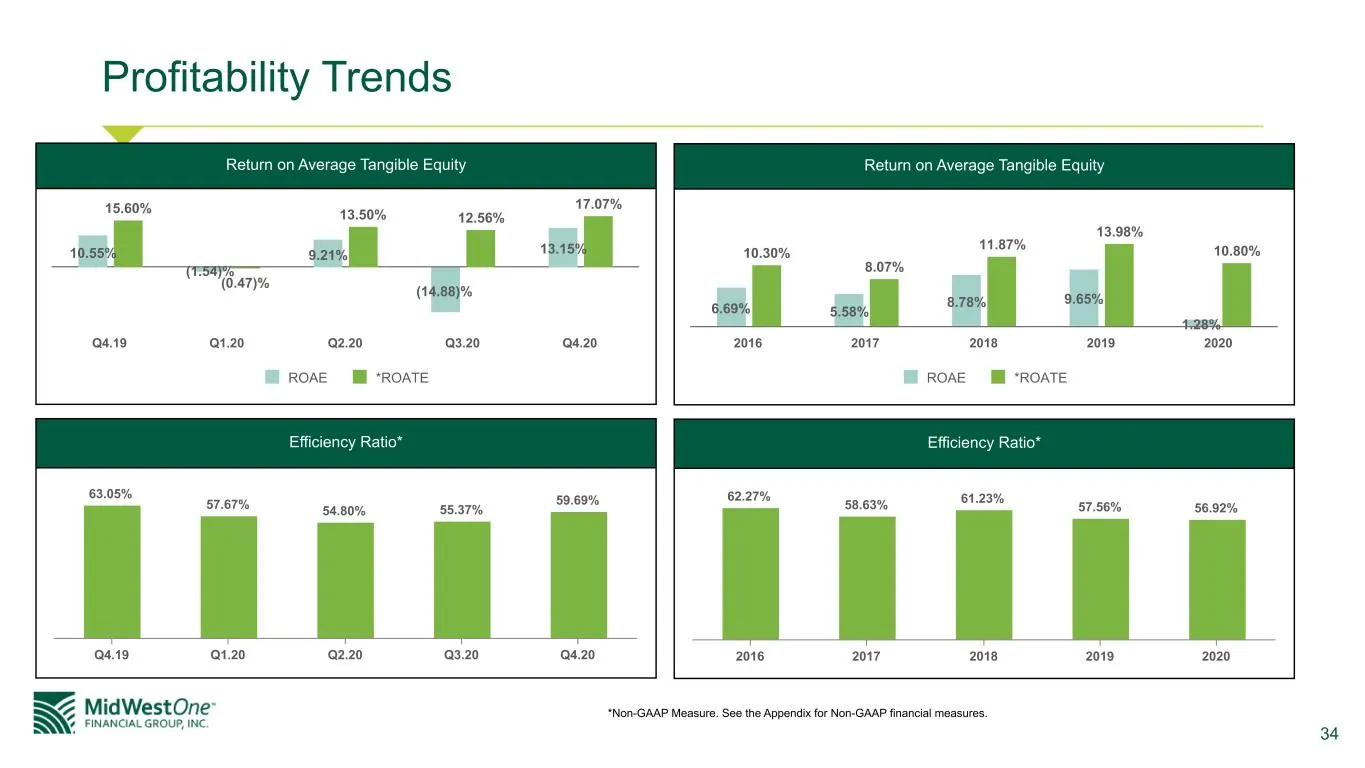
34 Profitability Trends *Non-GAAP Measure. See the Appendix for Non-GAAP financial measures. 62.27% 58.63% 61.23% 57.56% 56.92% 2016 2017 2018 2019 2020 6.69% 5.58% 8.78% 9.65% 1.28% 10.30% 8.07% 11.87% 13.98% 10.80% ROAE *ROATE 2016 2017 2018 2019 2020 Return on Average Tangible Equity Efficiency R
Slide 35: Net Interest Income
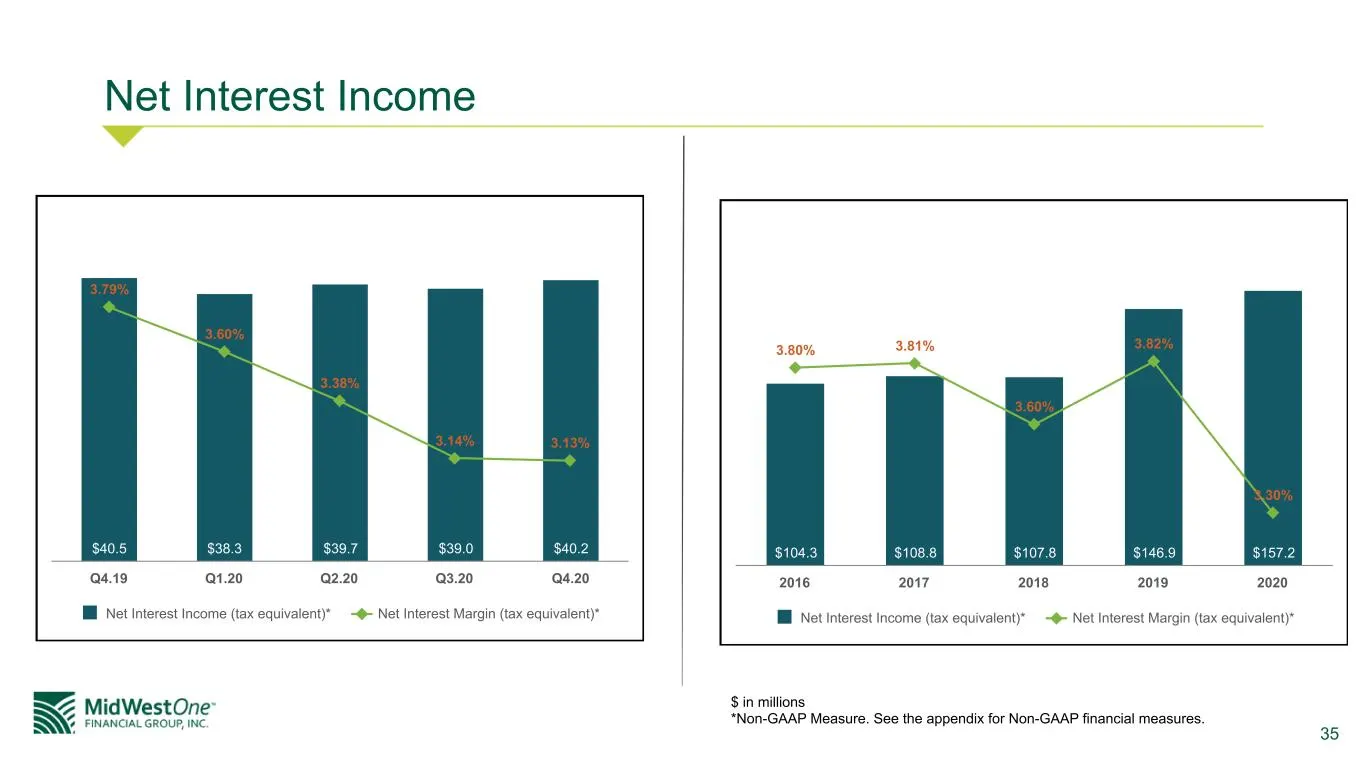
35 Net Interest Income $40.5 $38.3 $39.7 $39.0 $40.2 3.79% 3.60% 3.38% 3.14% 3.13% Net Interest Income (tax equivalent)* Net Interest Margin (tax equivalent)* Q4.19 Q1.20 Q2.20 Q3.20 Q4.20 $ in millions *Non-GAAP Measure. See the appendix for Non-GAAP financial measures. $104.3 $108.8 $107.8 $146.9
Slide 36: Noninterest Income
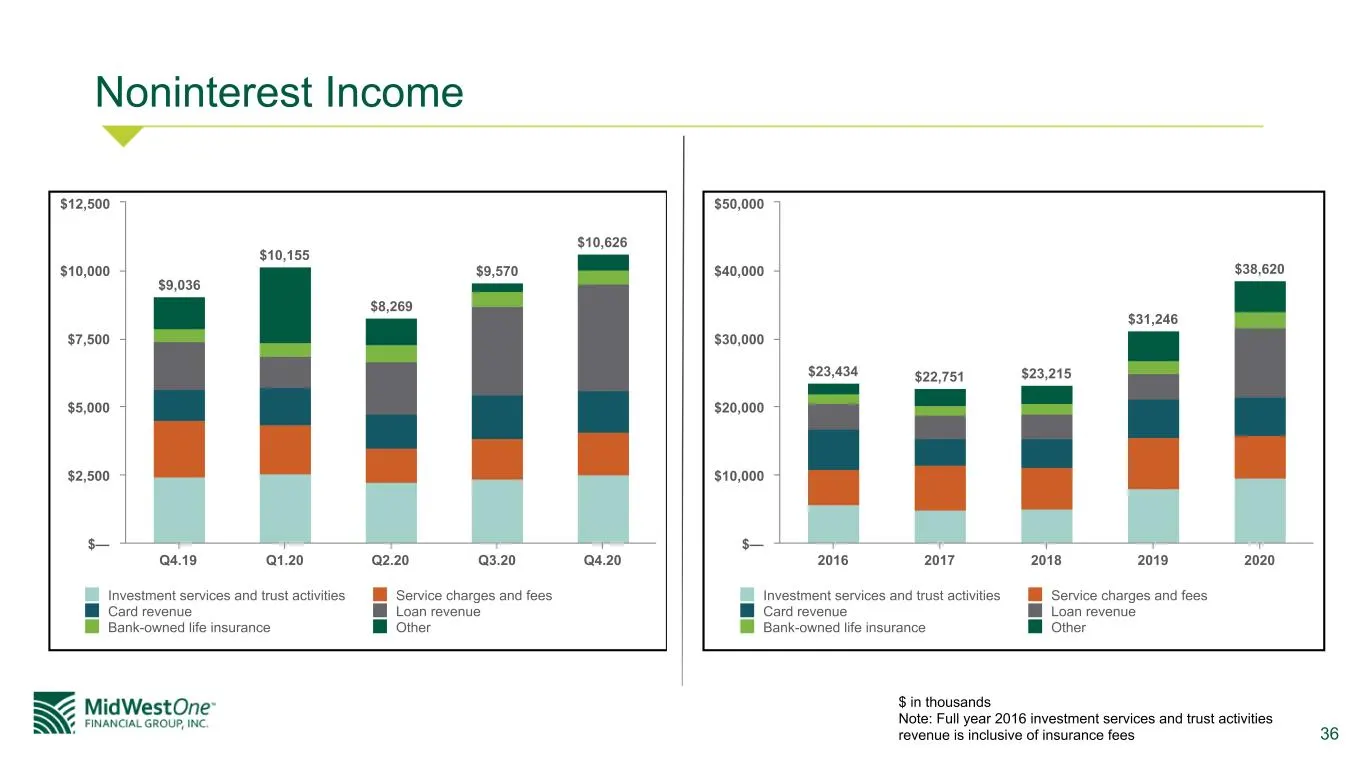
36 Noninterest Income $9,036 $10,155 $8,269 $9,570 $10,626 Investment services and trust activities Service charges and fees Card revenue Loan revenue Bank-owned life insurance Other Q4.19 Q1.20 Q2.20 Q3.20 Q4.20 $— $2,500 $5,000 $7,500 $10,000 $12,500 $ in thousands Note: Full year 2016 investment
Slide 37: Noninterest Expense
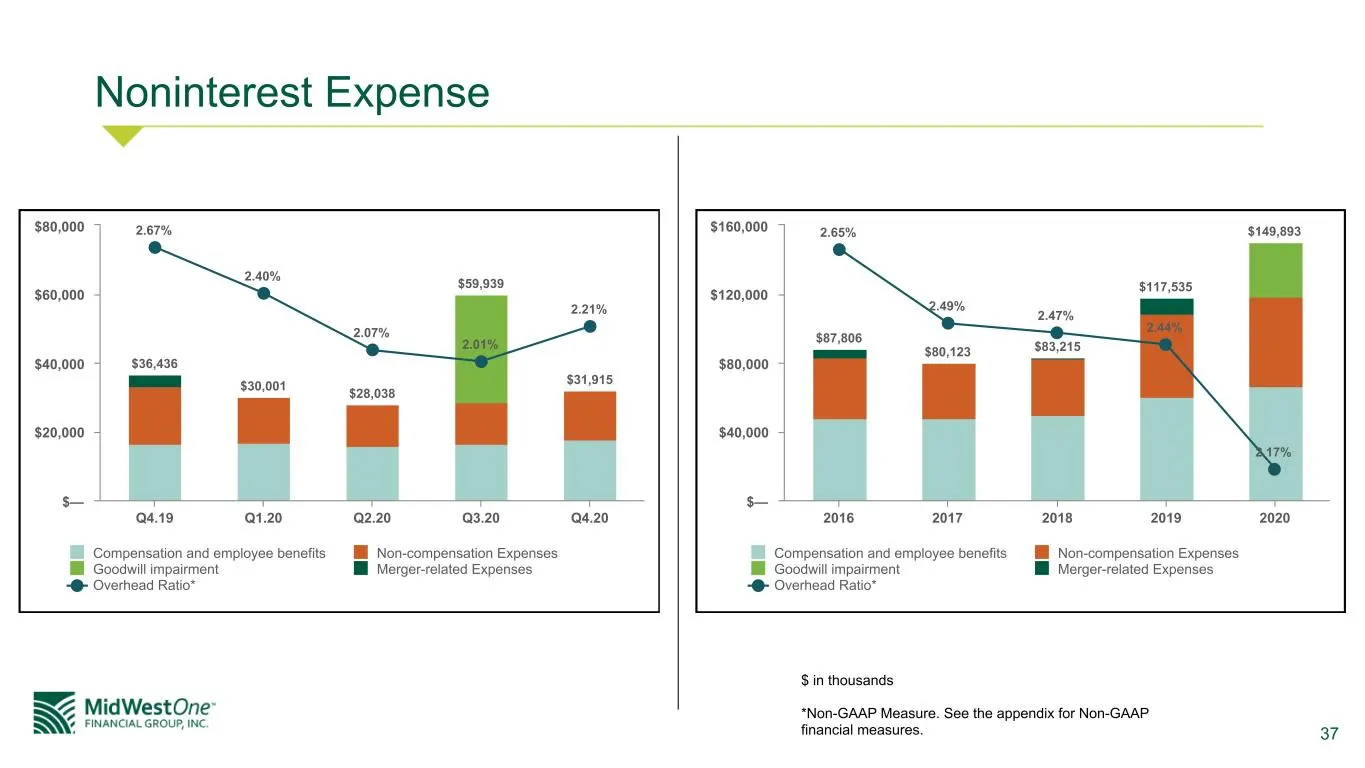
37 Noninterest Expense $ in thousands *Non-GAAP Measure. See the appendix for Non-GAAP financial measures. $36,436 $30,001 $28,038 $59,939 $31,915 2.67% 2.40% 2.07% 2.01% 2.21% Compensation and employee benefits Non-compensation Expenses Goodwill impairment Merger-related Expenses Overhead Ratio* Q4
Slide 38: Diversified Loan Portfolio
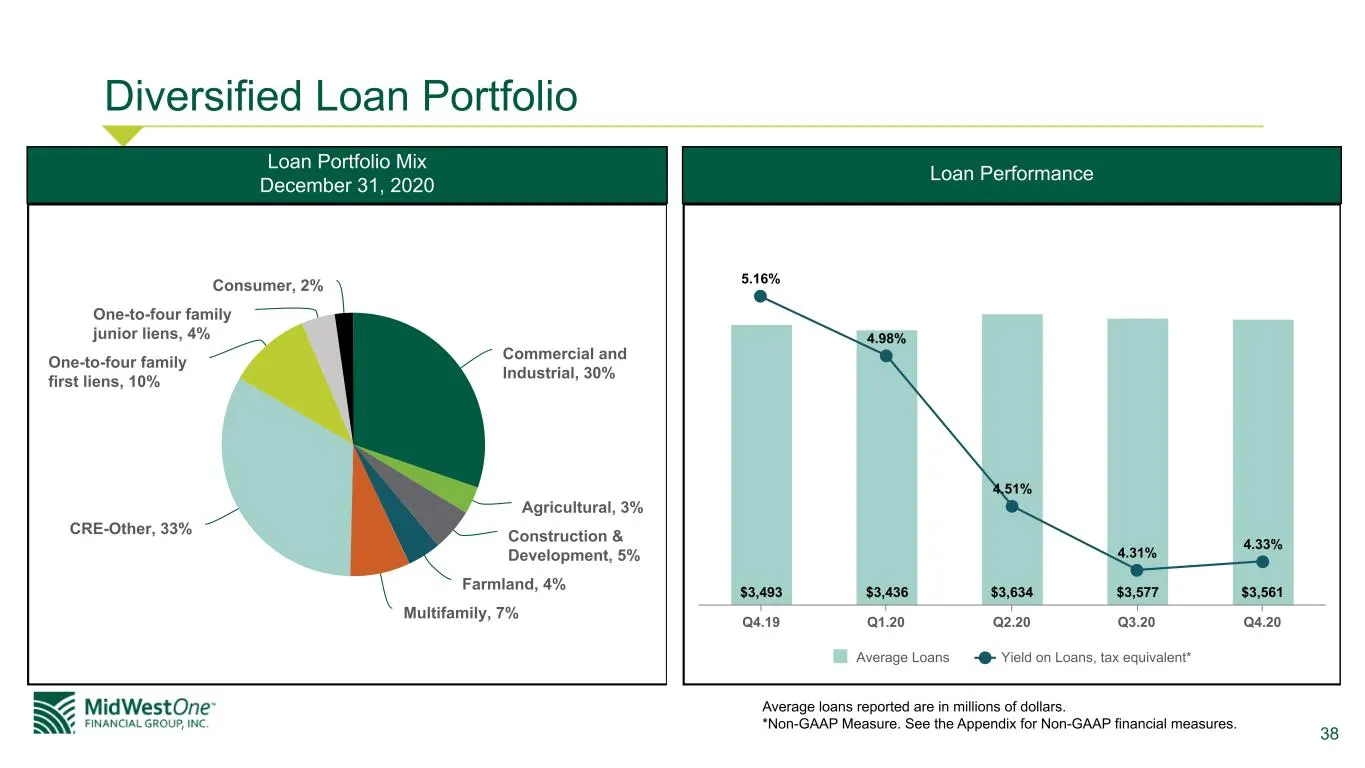
38 Diversified Loan Portfolio Commercial and Industrial, 30% Agricultural, 3% Construction & Development, 5% Farmland, 4% Multifamily, 7% CRE-Other, 33% One-to-four family first liens, 10% One-to-four family junior liens, 4% Consumer, 2% $3,493 $3,436 $3,634 $3,577 $3,561 5.16% 4.98% 4.51% 4.31% 4.3
Slide 39: Change in ACL
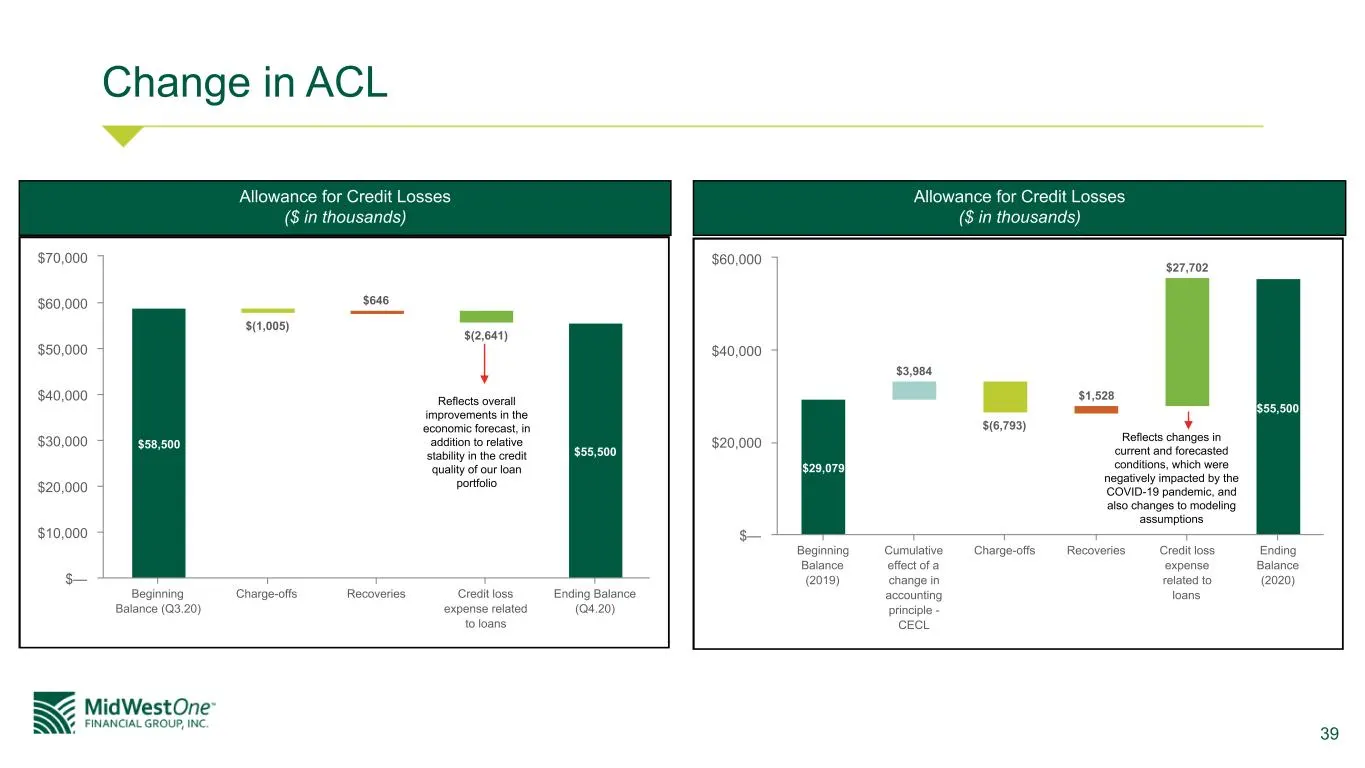
39 Change in ACL $58,500 $(1,005) $646 $(2,641) $55,500 Beginning Balance (Q3.20) Charge-offs Recoveries Credit loss expense related to loans Ending Balance (Q4.20) $— $10,000 $20,000 $30,000 $40,000 $50,000 $60,000 $70,000 Allowance for Credit Losses ($ in thousands) Reflects overall improvements i
Slide 40: Stable Deposit Base
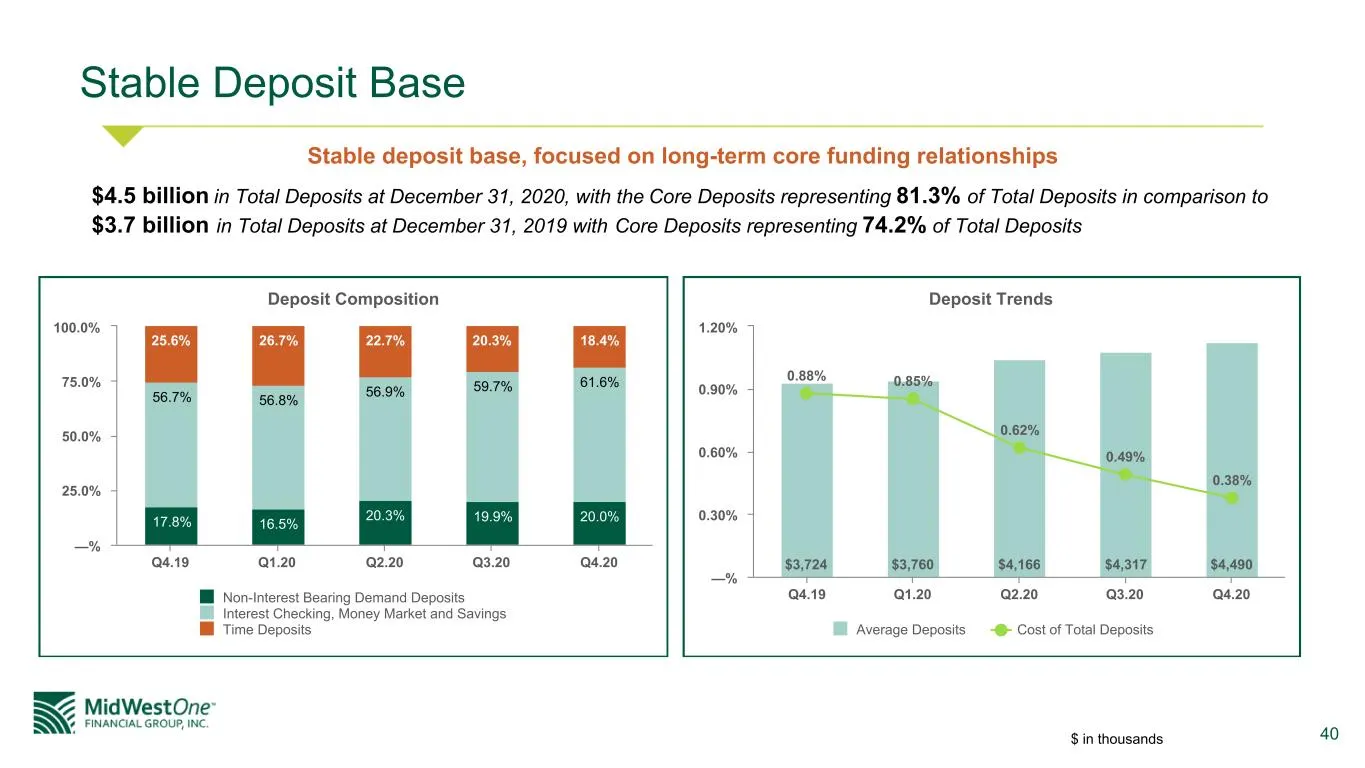
40 Stable Deposit Base $4.5 billion in Total Deposits at December 31, 2020, with the Core Deposits representing 81.3% of Total Deposits in comparison to $3.7 billion in Total Deposits at December 31, 2019 with Core Deposits representing 74.2% of Total Deposits Stable deposit base, focused on long-te
Slide 41: Strong Liquidity Position
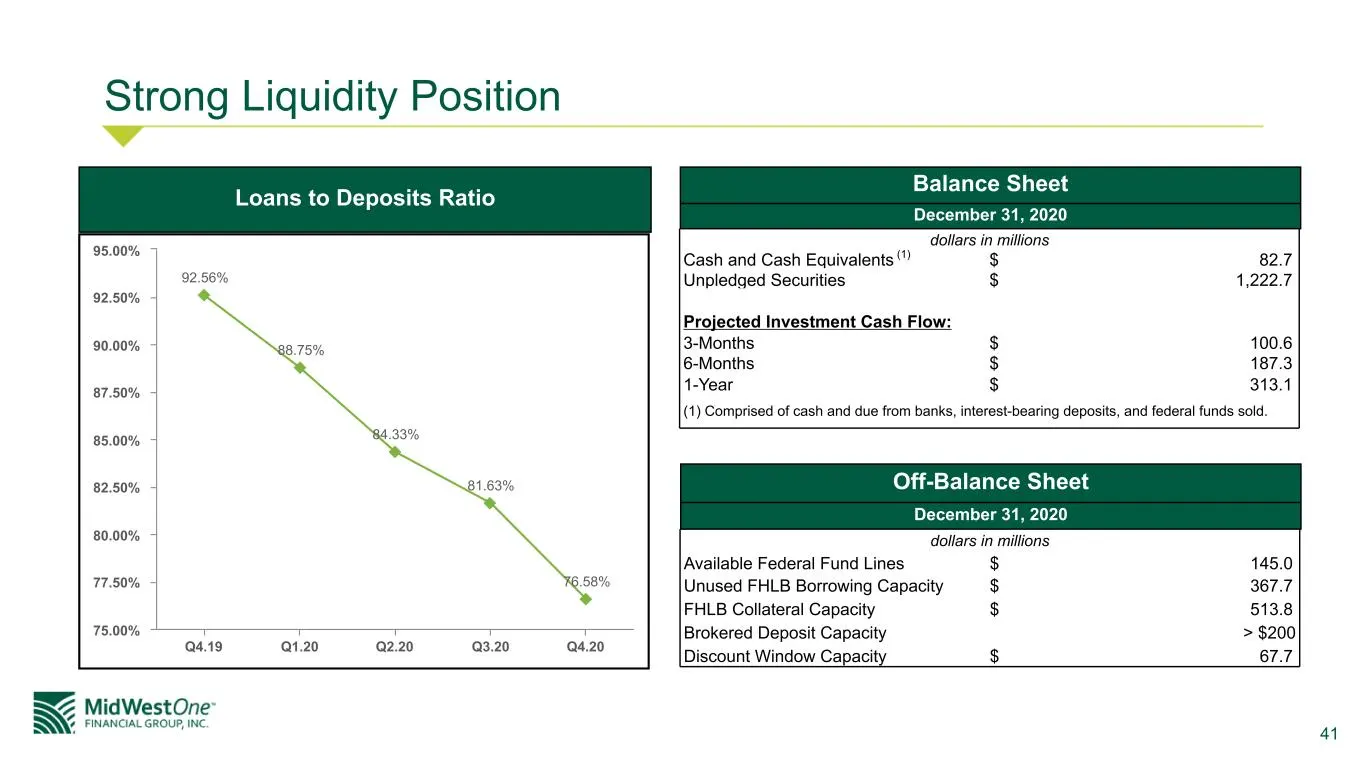
41 Strong Liquidity Position 92.56% 88.75% 84.33% 81.63% 76.58% Q4.19 Q1.20 Q2.20 Q3.20 Q4.20 75.00% 77.50% 80.00% 82.50% 85.00% 87.50% 90.00% 92.50% 95.00% Loans to Deposits Ratio Balance Sheet dollars in millions Cash and Cash Equivalents (1) $ 82.7 Unpledged Securities $ 1,222.7 Projected Investm
Slide 42: Capital Ratios
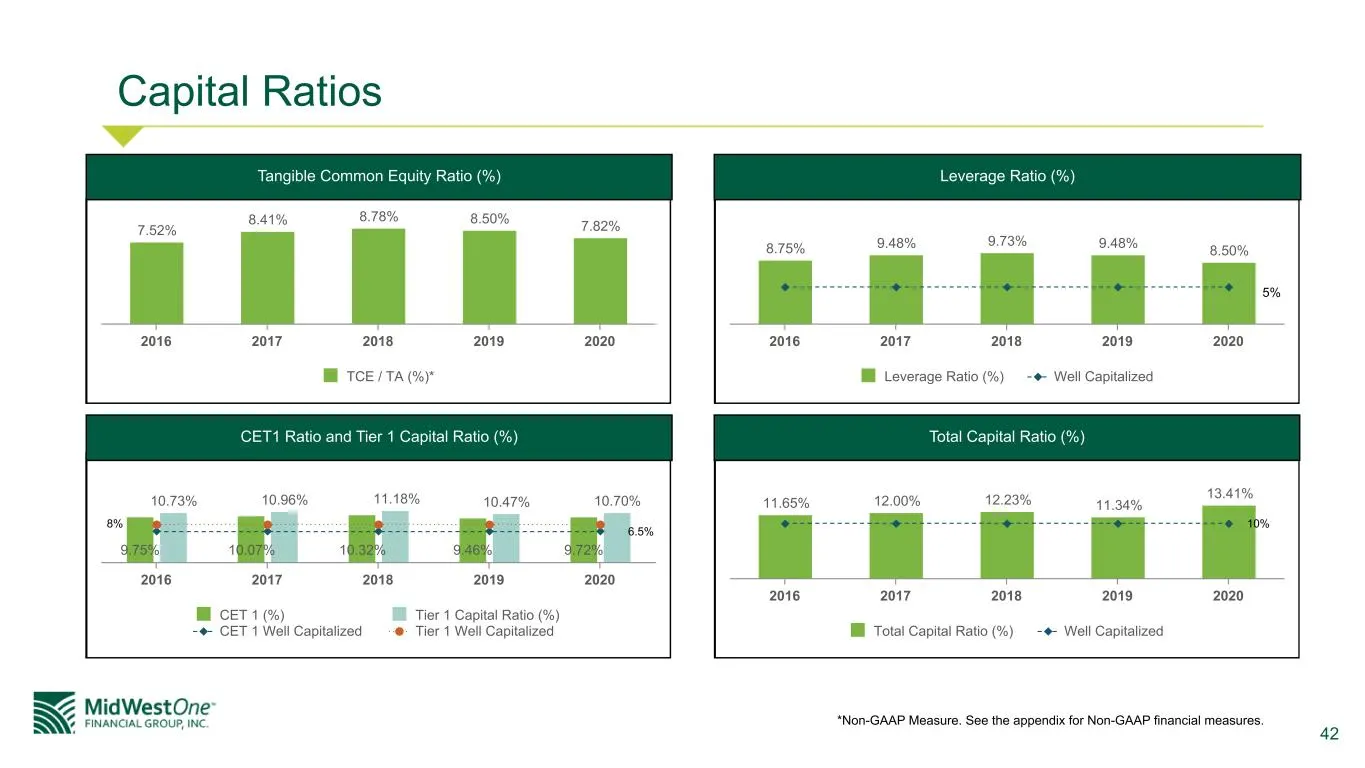
42 Capital Ratios 7.52% 8.41% 8.78% 8.50% 7.82% TCE / TA (%)* 2016 2017 2018 2019 2020 8.75% 9.48% 9.73% 9.48% 8.50% Leverage Ratio (%) Well Capitalized 2016 2017 2018 2019 2020 11.65% 12.00% 12.23% 11.34% 13.41% Total Capital Ratio (%) Well Capitalized 2016 2017 2018 2019 2020 9.75% 10.07% 10.32% 9
Slide 43: Appendix
MidWestOne FINANCIAL GROUP, INC. 43
Slide 44: Non-GAAP Financial Measures: Tangible Common Equity
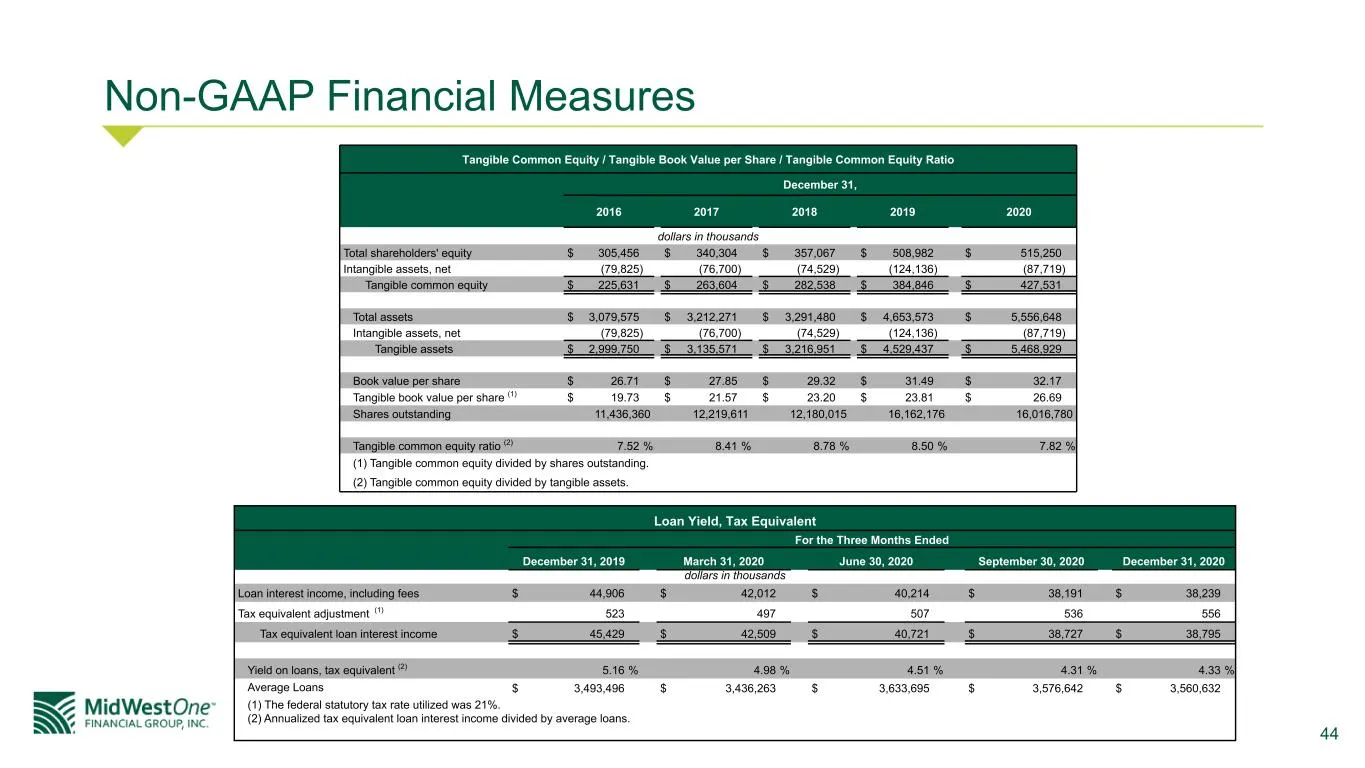
44 Non-GAAP Financial Measures Tangible Common Equity / Tangible Book Value per Share / Tangible Common Equity Ratio December 31, 2016 2017 2018 2019 2020 dollars in thousands Total shareholders' equity $ 305,456 $ 340,304 $ 357,067 $ 508,982 $ 515,250 Intangible assets, net (79,825) (76,700) (74,52
Slide 45: Non-GAAP Financial Measures: ROAA and ROATE
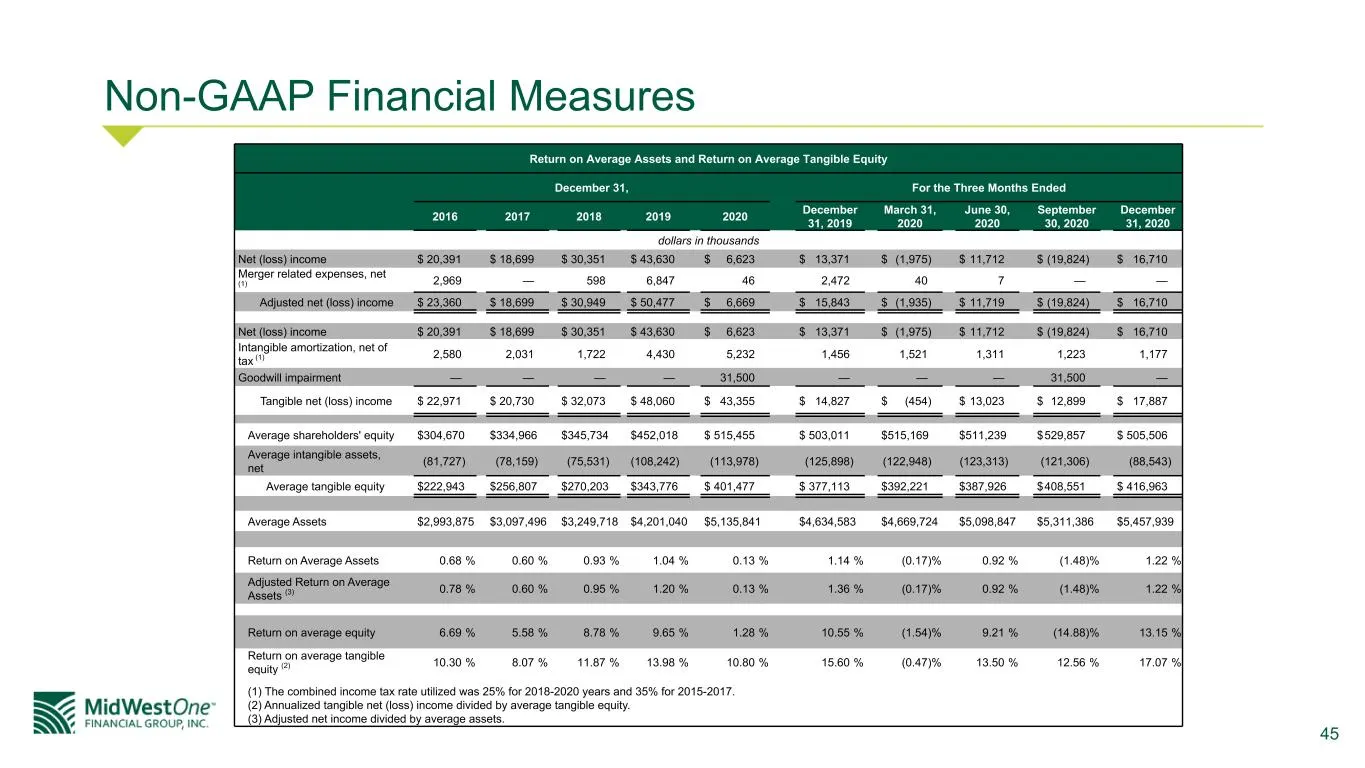
45 Non-GAAP Financial Measures Return on Average Assets and Return on Average Tangible Equity December 31, For the Three Months Ended 2016 2017 2018 2019 2020 December 31, 2019 March 31, 2020 June 30, 2020 September 30, 2020 December 31, 2020 dollars in thousands Net (loss) income $ 20,391 $ 18,699
Slide 46: Non-GAAP Financial Measures: Net Interest Income and Margin
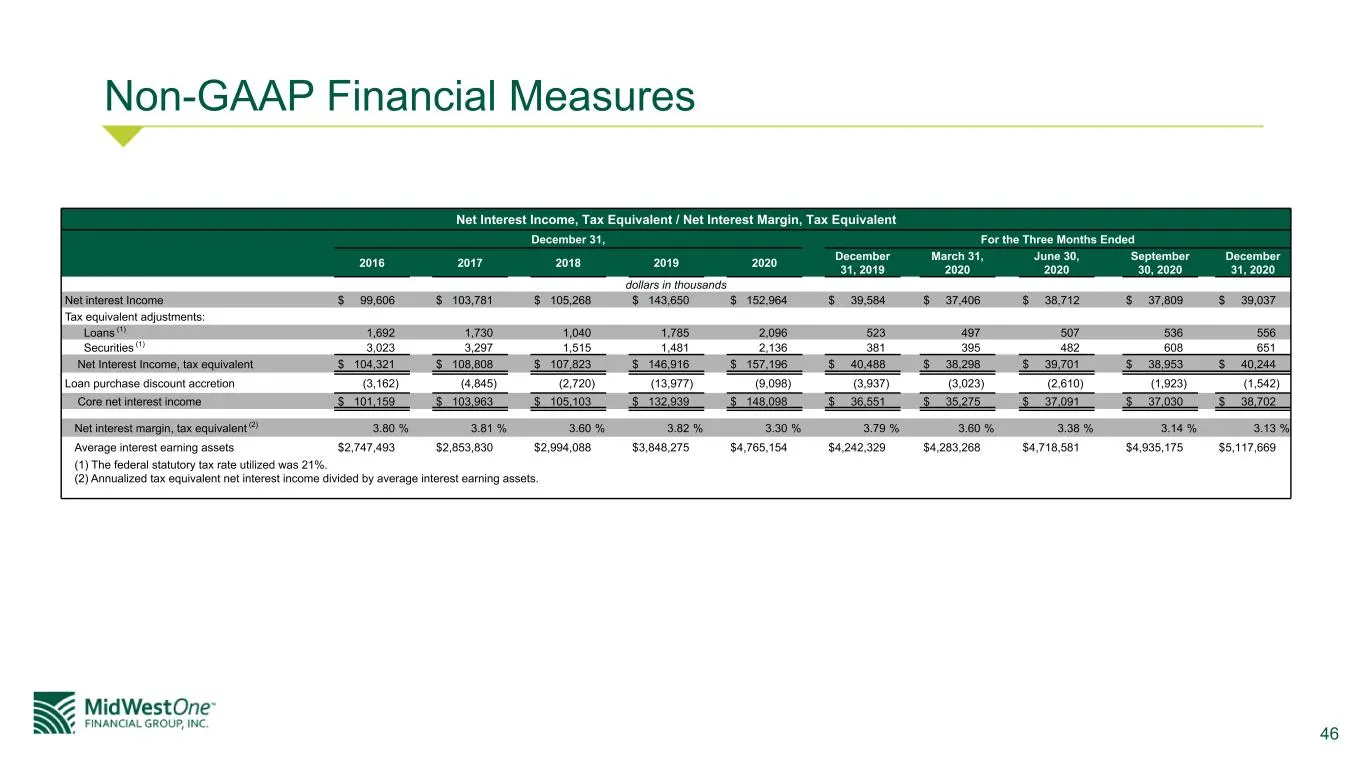
46 Non-GAAP Financial Measures Net Interest Income, Tax Equivalent / Net Interest Margin, Tax Equivalent December 31, For the Three Months Ended 2016 2017 2018 2019 2020 December 31, 2019 March 31, 2020 June 30, 2020 September 30, 2020 December 31, 2020 dollars in thousands Net interest Income $ 99,
Slide 47: Non-GAAP Financial Measures: Efficiency Ratio
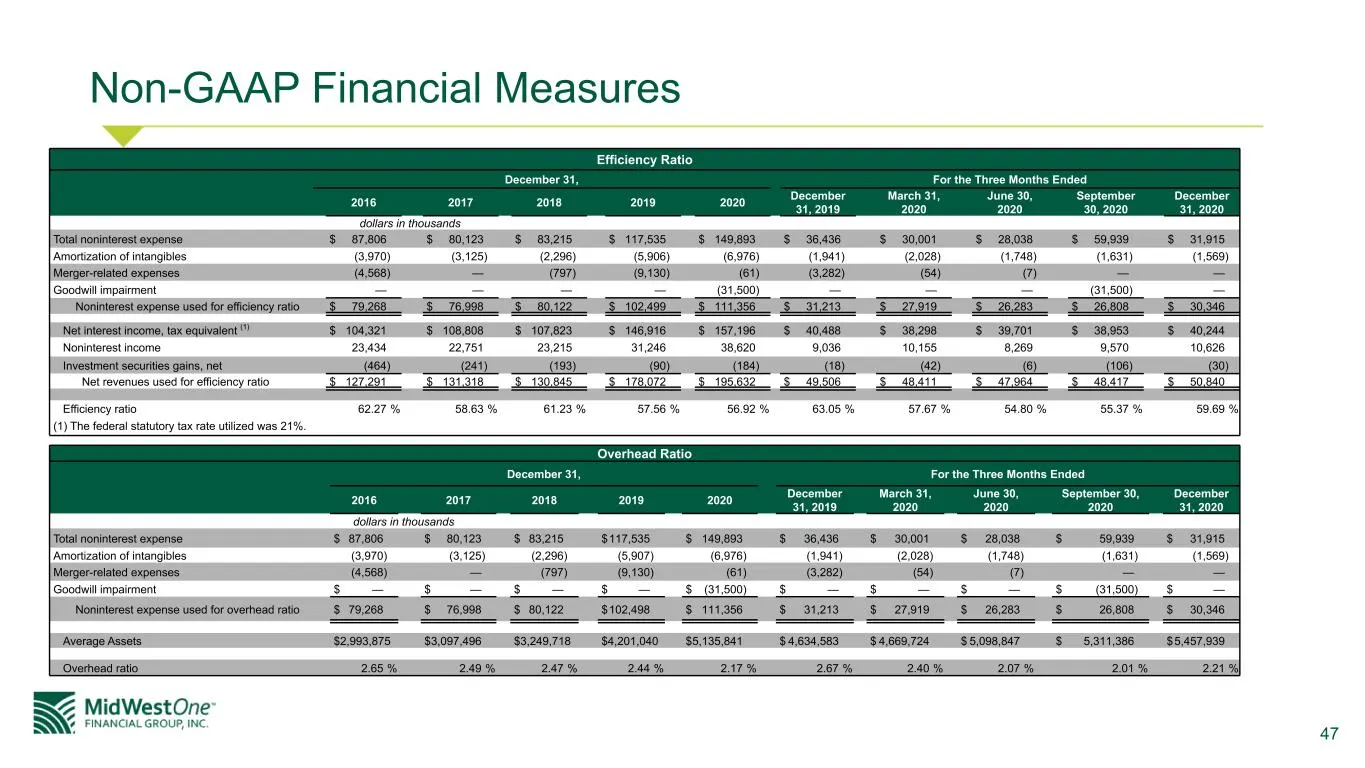
47 Non-GAAP Financial Measures Efficiency Ratio December 31, For the Three Months Ended 2016 2017 2018 2019 2020 December 31, 2019 March 31, 2020 June 30, 2020 September 30, 2020 December 31, 2020 dollars in thousands Total noninterest expense $ 87,806 $ 80,123 $ 83,215 $ 117,535 $ 149,893 $ 36,436
Slide 48: Non-GAAP Financial Measures: Core Earnings
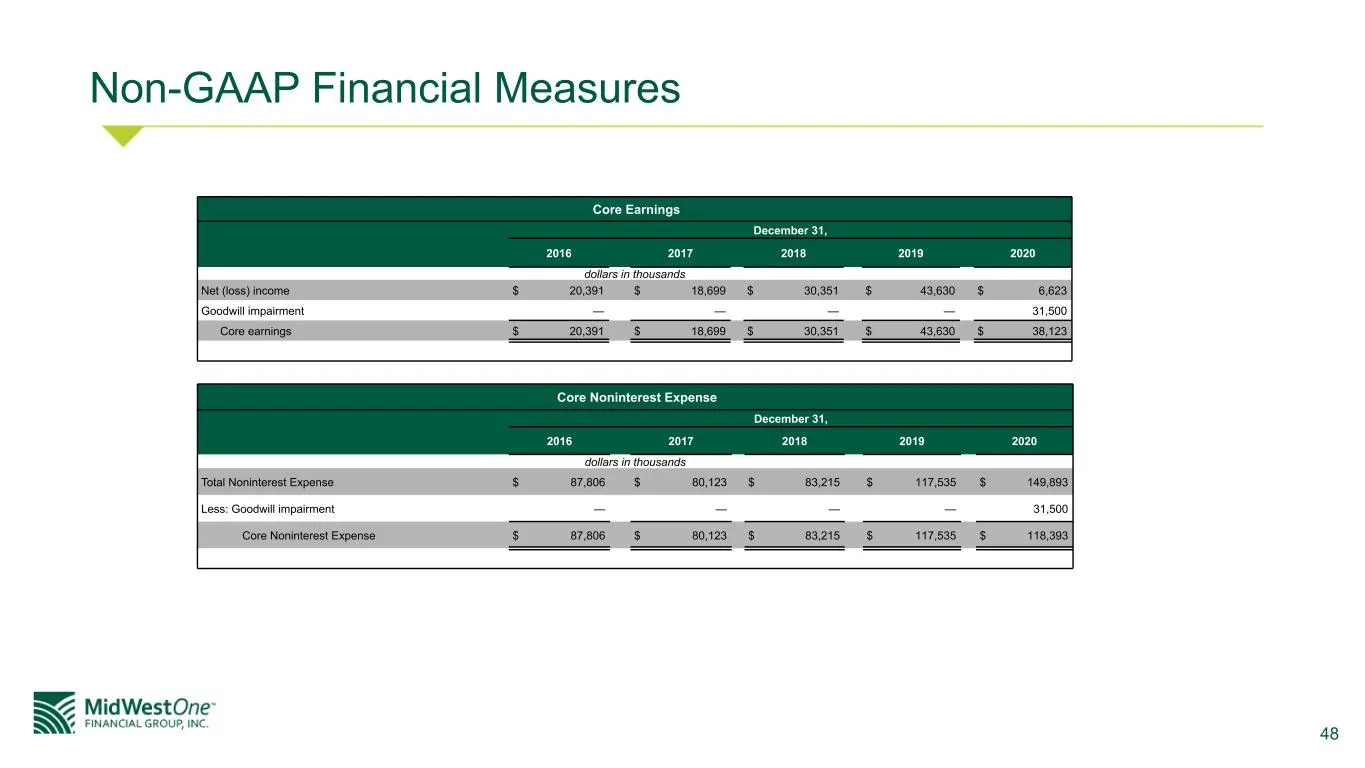
48 Non-GAAP Financial Measures Core Earnings December 31, 2016 2017 2018 2019 2020 dollars in thousands Net (loss) income $ 20,391 $ 18,699 $ 30,351 $ 43,630 $ 6,623 Goodwill impairment — — — — 31,500 Core earnings $ 20,391 $ 18,699 $ 30,351 $ 43,630 $ 38,123 Core Noninterest Expense December 31, 20
Source: SEC EDGAR · 8-K filed Feb 26, 2021
More decks from MidWestOne Financial Group Inc
 Q3 2025 Earnings Presentation18 slides · Oct 23, 2025
 Merger or Acquisition (October 2025)20 slides · Oct 23, 2025
 Q2 2025 Earnings Presentation32 slides · Jul 25, 2025
 Q2 2025 Earnings Presentation18 slides · Jul 25, 2025
 Investor Presentation (April 2025)31 slides · Apr 28, 2025
 Q1 2025 Earnings Presentation17 slides · Apr 25, 2025