First Financial Northwest — Investor Presentation (November 2020)
34 slides from First Financial Northwest's investor presentation, Nov 2, 2020
Slide 1: First Financial Northwest, Inc.
a ‘ First Financial Northwest, Inc. November 2020 Joseph W. Kiley III, President & CEO Richard P. Jacobson, EVP, CFO & COO NASDAQ:FFNW
Slide 2: Forward Looking Statement
Forward Looking Statement This presentation includes forward-looking statements within the meaning of the Private Securities Litigation Reform Act of 1995. Forward-looking statements are not historical facts but instead represent management's current expectations and forecasts regarding future event
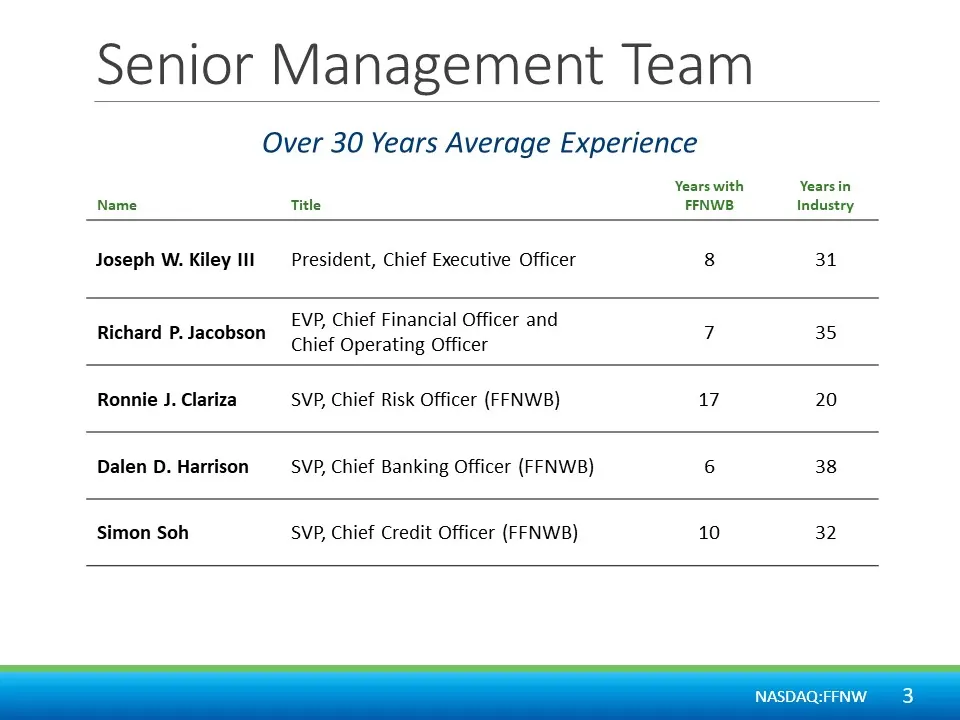
Slide 3: Senior Management Team
Senior Management Team Over 30 Years Average Experience Years with Years in Name Title FFNWB Industry Joseph W. Kiley III President, Chief Executive Officer 8 31 Richard P. Jacobson on fopeatae omer and 7 35 Ronnie J. Clariza SVP, Chief Risk Officer (FFNWB) 17 20 Dalen D. Harrison SVP, Chief Banking
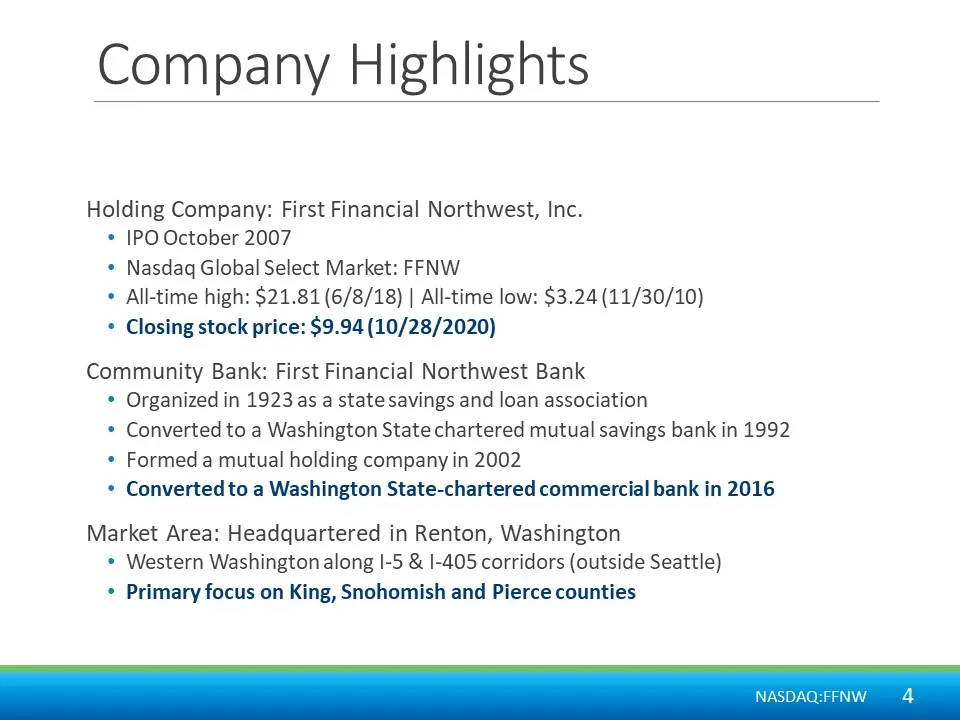
Slide 4: Company Highlights
Company Highlights Holding Company: First Financial Northwest, Inc. * IPO October 2007 * Nasdaq Global Select Market: FFNW * All-time high: $21.81 (6/8/18) | All-time low: $3.24 (11/30/10) * Closing stock price: $9.94 (10/28/2020) Community Bank: First Financial Northwest Bank * Organized in 1923 as
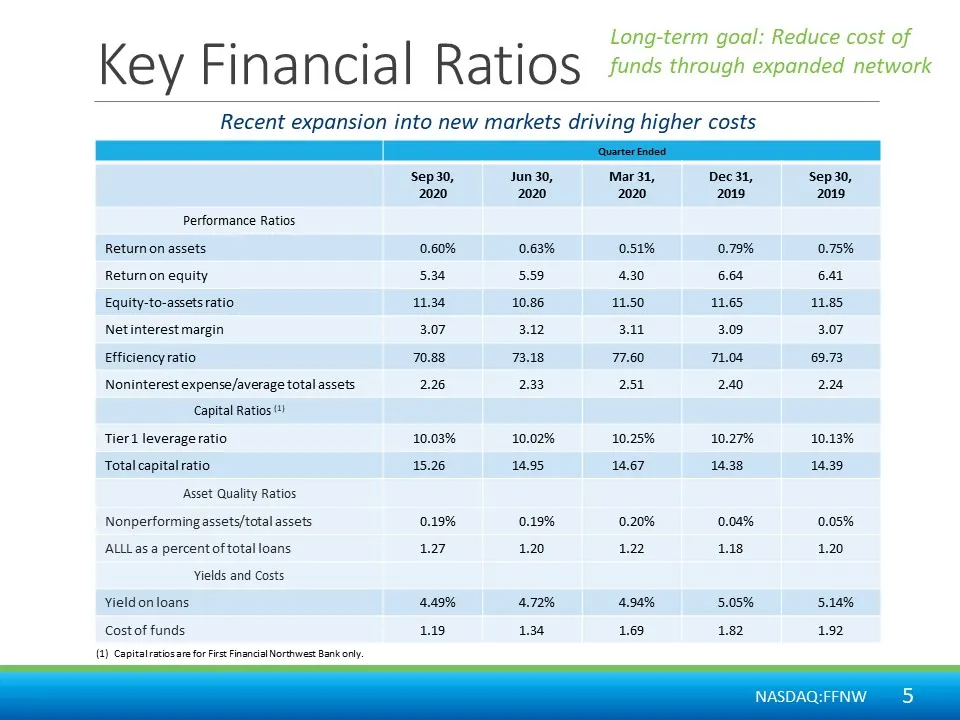
Slide 5: Key Financial Ratios
Long-term goal: Reduce cost of Key Fj Nn a ia) cla | Ratios funds through expanded network Recent expansion into new markets driving higher costs Sep 30, Jun 30, Mar 31, Dec31, Sep 30, 2020 2020 2020 2019 2019 Performance Ratios Return on assets 0.60% 0.63% 0.51% 0.79% 0.75% Return on equity 5.34 5.
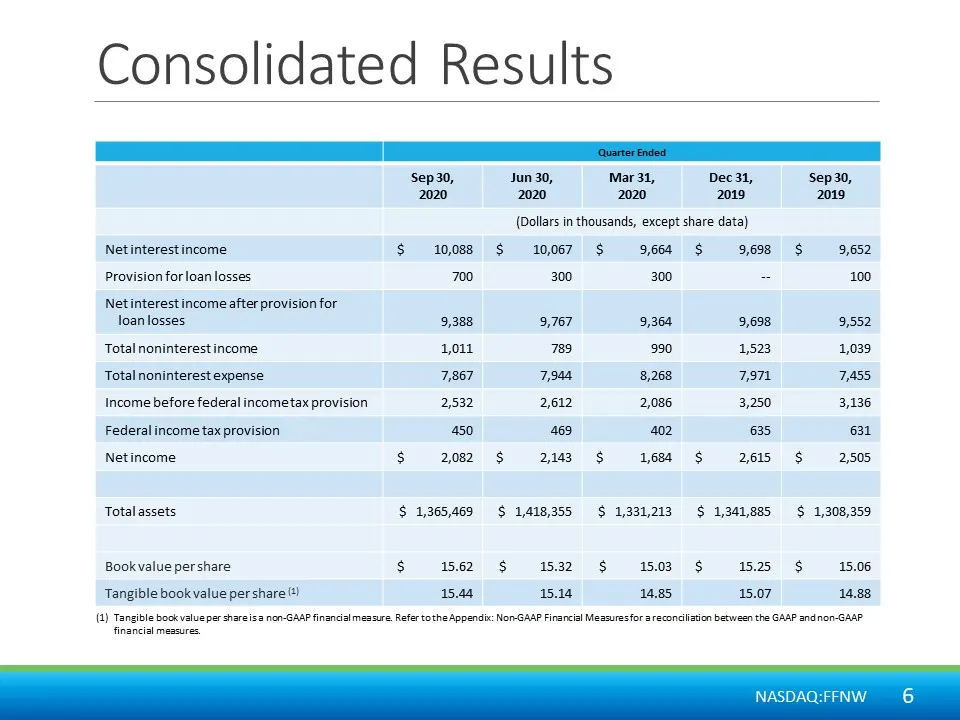
Slide 6: Consolidated Results
Consolidated Results Jun 30, Mar 31, Dec31, Sep30, 2020 2020 2019 2019 (Dollars in thousands, except share data), Netinterest income $ 10,088 $ 10,067 $ 9,604 $ 9,698 $ 9,652 Provision forloan losses 700 300 300 = 100 Netinterest income after provision for loan losses 9,388 9,787 9,364 9,698 9,552 T
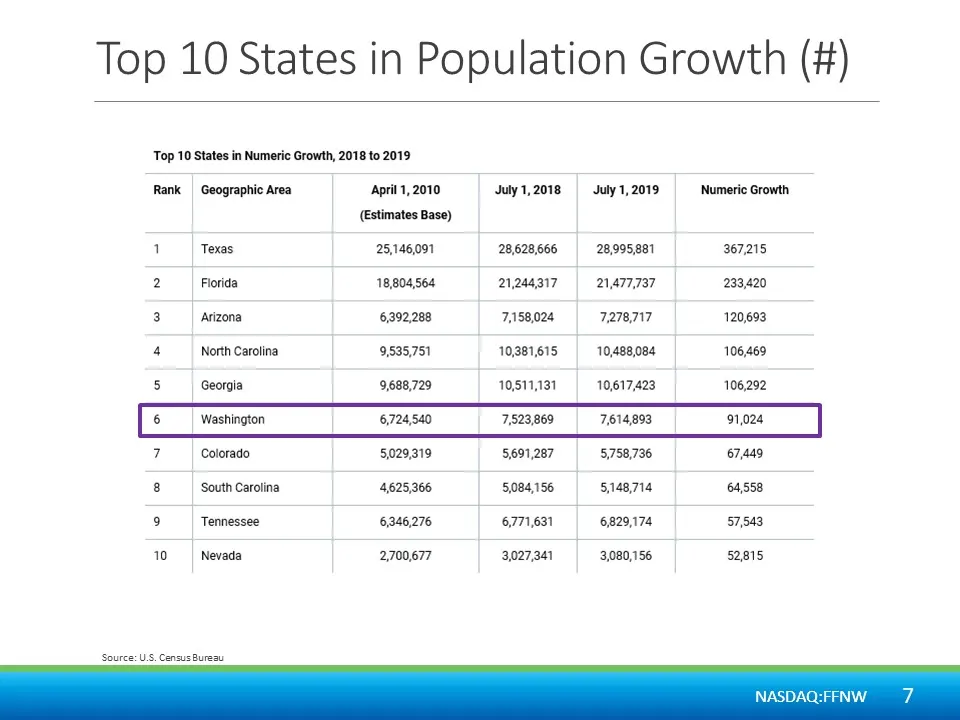
Slide 7: Top States in Population Growth (#)
Top 10 States in Population Growth (#) Top 10 States in Numeric Growth, 2018 to 2019 Rank Geographic Area ‘April 1, 2010 July 1,2018 July1,2019 Numeric Growth (Estimates Base) 1 Texas 25,146091 28,628,666 28,995,881 367215 2 Florida 10,804,564 21244317 21,477,737 233,420 3 Arizona 6392288 7,158,024
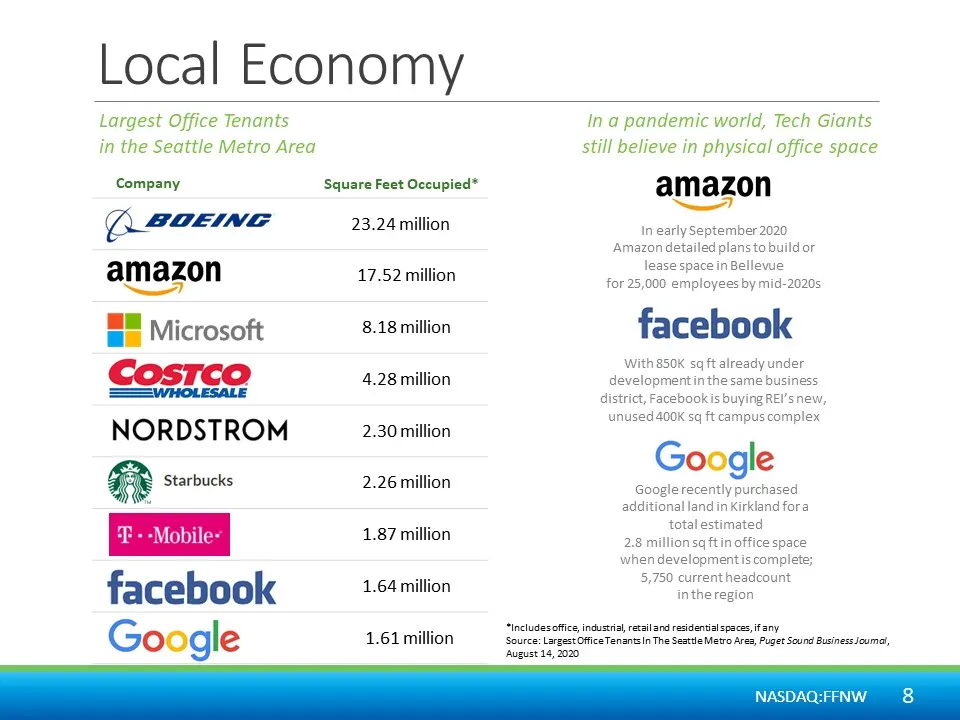
Slide 8: Local Economy
Local Economy Largest Office Tenants in the Seattle Metro Area ‘Company Square Feet Occupied* QSGENG 23.24 million amazon 17.52 million <a | Microsoft 8.18 million Cosrco 4.28 million rf NORDSTROM 2.30 million a ‘Starbucks 2.26 million 1.87 million facebook 1.64 million Google 1.61 million In a pand
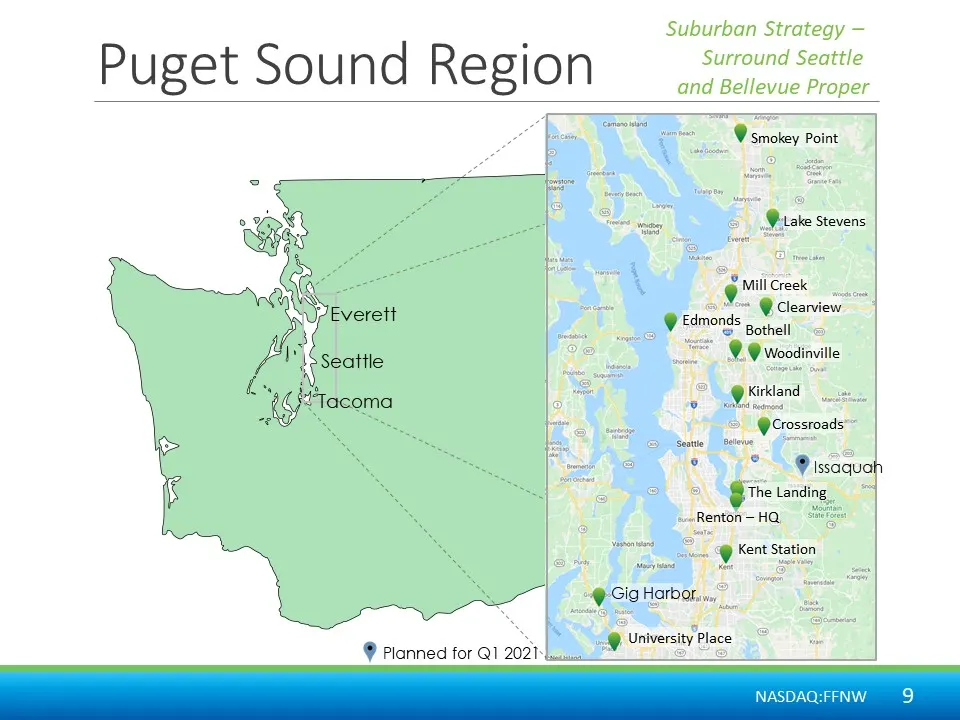
Slide 9: Suburban Strategy — Puget Sound Region
Suburban Strategy — p uget So U nN d Regio nN Surround Seattle and Bellevue Proper eo A smokey Point ; Everett 4 IS seattle {GF Tecoma @ Crossroads” © Teeatte | Betene @ Planned for Q1 2021: NASDAQ:FFNW
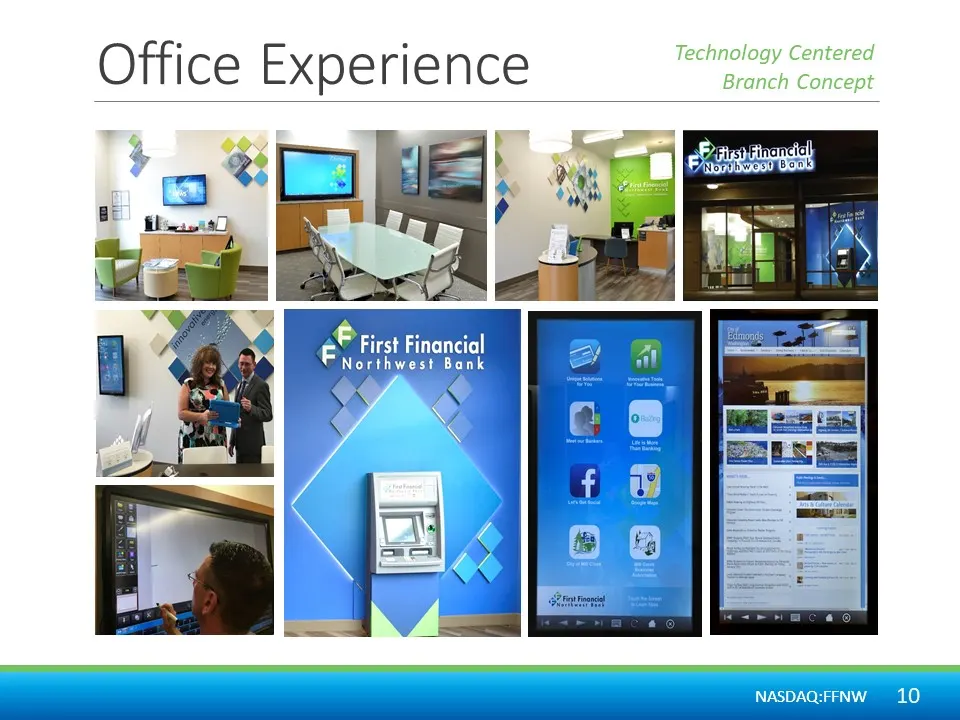
Slide 10: Office Experience
Office Experience ee
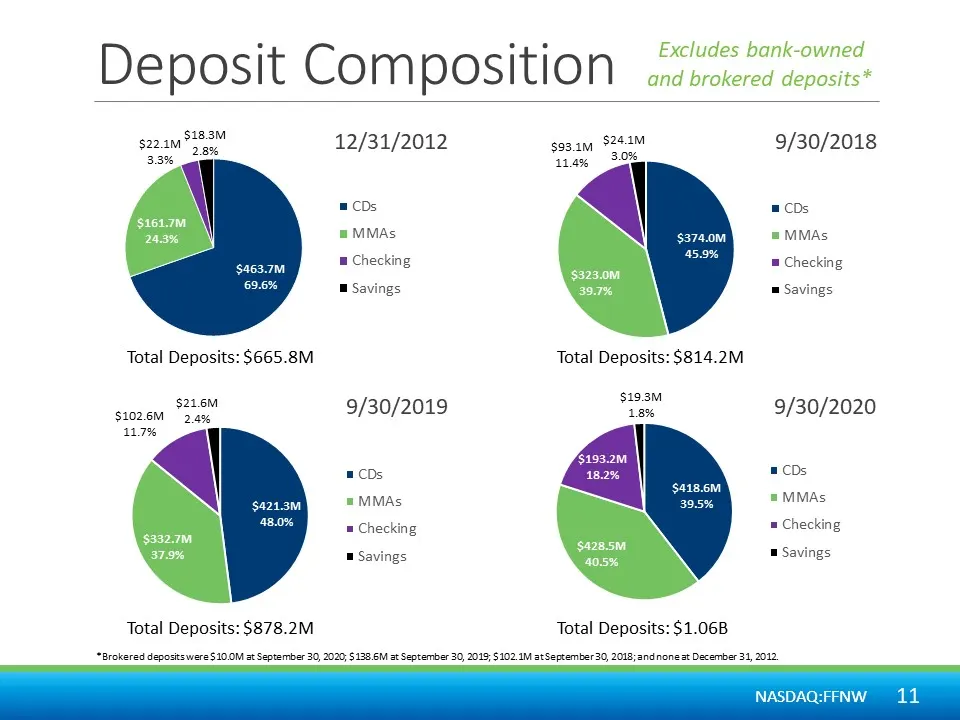
Slide 11: Deposit Composition
Deposit Composition Excludes bank-owned and brokered deposits* $18.aM 28% $22.1M $463.7 69.6% Total Deposits: $665.8M $21.6M $102.6M "> axe 117% Total Deposits: $878.2M 12/31/2012 = CDs = MMAs m Checking m Savings 9/30/2019 = CDs = MMAs = Checking m Savings Total Deposits: $814.2M s19.m 18% $418.6M
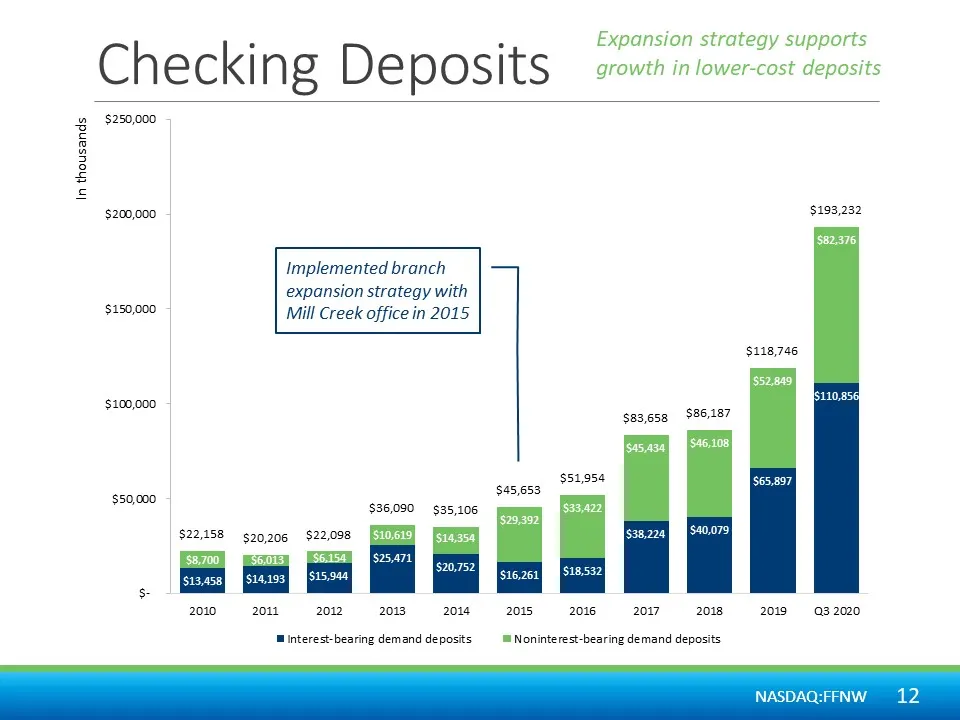
Slide 12: Checking Deposits
Checking Deposits Expansion strategy supports growth in lower-cost deposits $250,000 7 $200,000 Implemented branch expansion strategy with $350,000 Mill Creek office in 2015 $100,000 $50,000 $36,090 $35,106 $22,158 $20,206 $22,098 $8,700 JN $5.01; 2 $14,193 s 2010 «2011. 20122013, 2014 = 2015 $16,26
Slide 13: Expansion Strategy
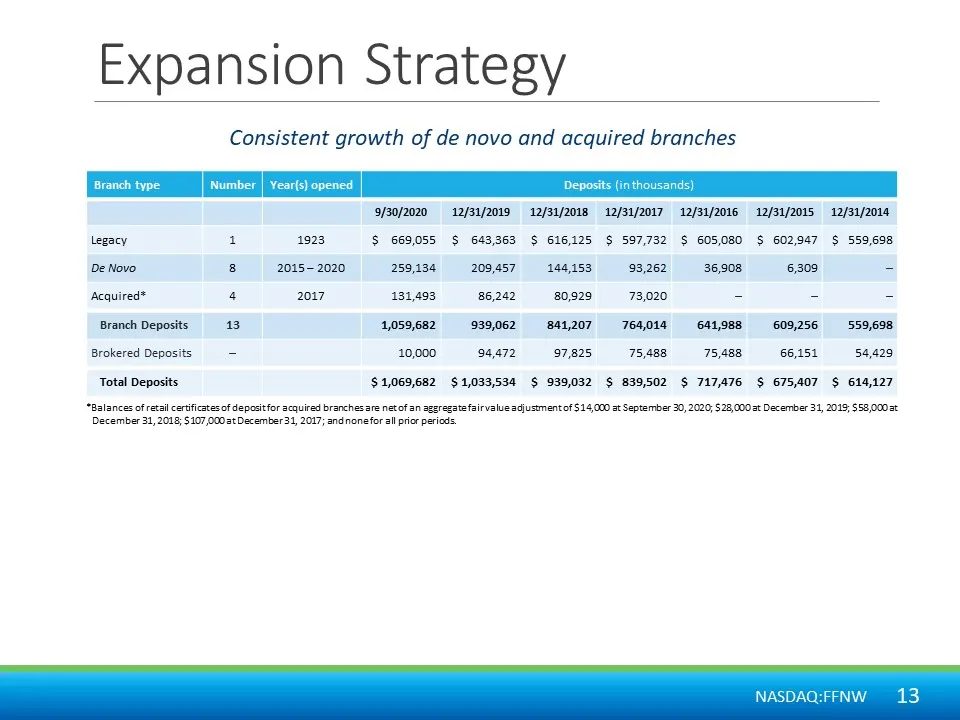
Expansion Strategy Consistent growth of de novo and acquired branches SE A 9/30/2020 12/31/2019 12/31/2018 12/31/2017 12/31/2016 12/31/2015 12/31/2014 Legacy i 1928, $ 669,055 $ 643,363 § 616,125 § 597,732 § 605,080 $ 602,947 $ 559,698 De Novo 8 2015-2020 259,134 209,457 144,153 93,262 36,908 6,309,
Slide 14: Office Expansion Strategy
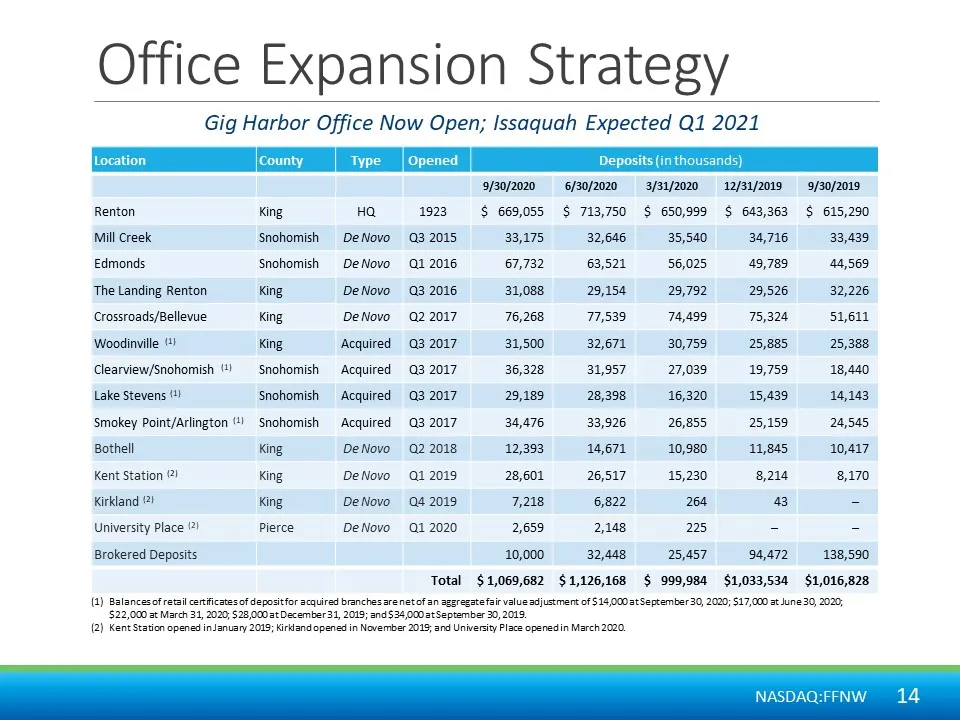
Office Expansion Strategy Gig Harbor Office Now Open; Issaquah Expected Q1 2021 9/30/2020 6/30/2020 3/31/2020 12/31/2019 9/30/2019 Renton king HO 1923 $ 669,055 $ 713,750 $ 650,999 $ 643,363 $ 615,290 Mill Creek Snohomish DeNovo 3 2015 33,175 32,646 35,540 34,716 33,439 Edmonds Snohomish DeNovo Qi 2
Slide 15: Noninterest Expense to Average Total Assets
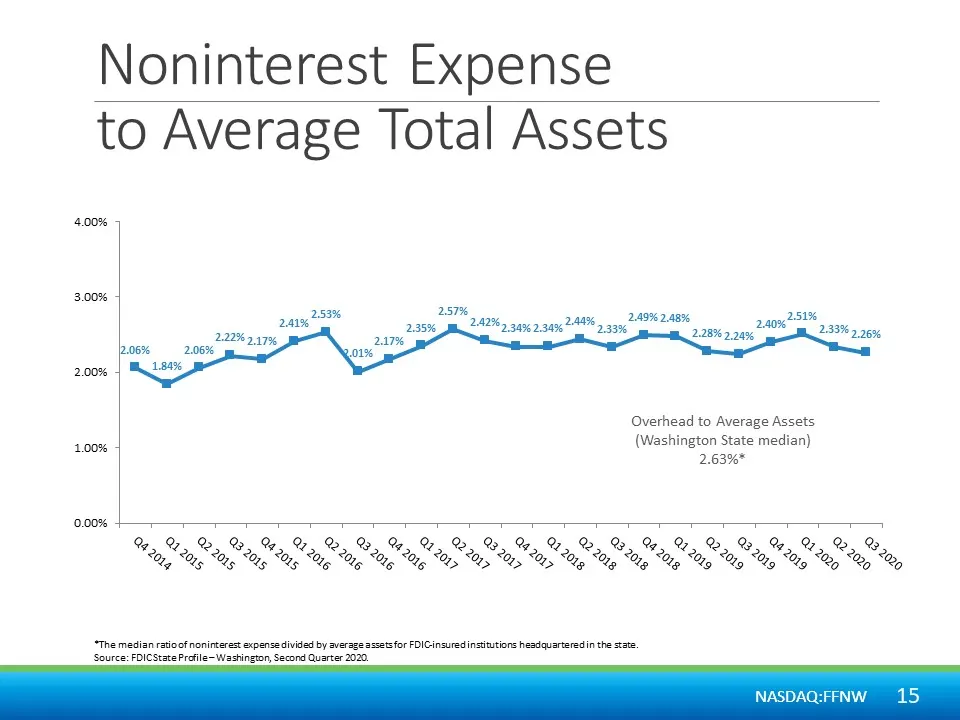
Noninterest Expense to Average Total Assets 4.00% 3.00% 253% Sgt 2.89% 2.48% 251% 240% 2.35% a 242% 7 505 2.30% 0% 9 2335 2 2.38%. 2.22% 217% 2.26% b.o6% 2.06% 2.00% = Overhead to Average Assets ani (Washington State median) 2.63%" ‘The median rtioof nonineeras expanse divided by average assets for
Slide 16: Retail Fee Income
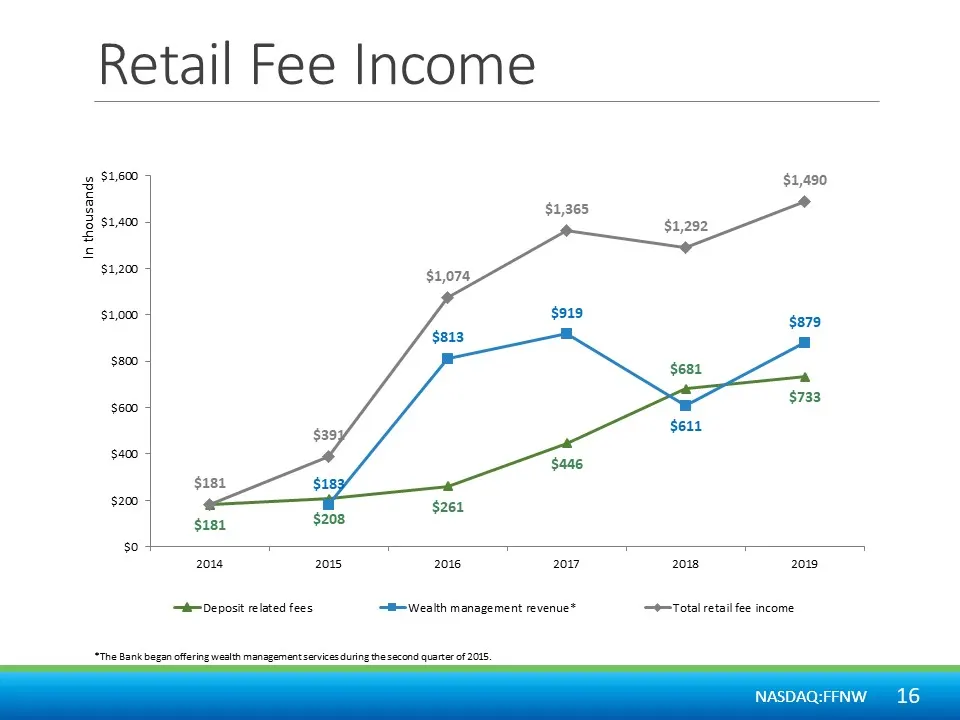
In thousands Retail Fee Income : $1,400 8 $1,000 ‘$800 ‘$600 $400 $200 $261 $11 $208 $0 $1,490 2018 2015, 2016 2017 2018 2019 te Deposit related fees “B—Wealth management revenue* Total retail fee income “The Bank began offering wealth management services during the second quarter of 2015.
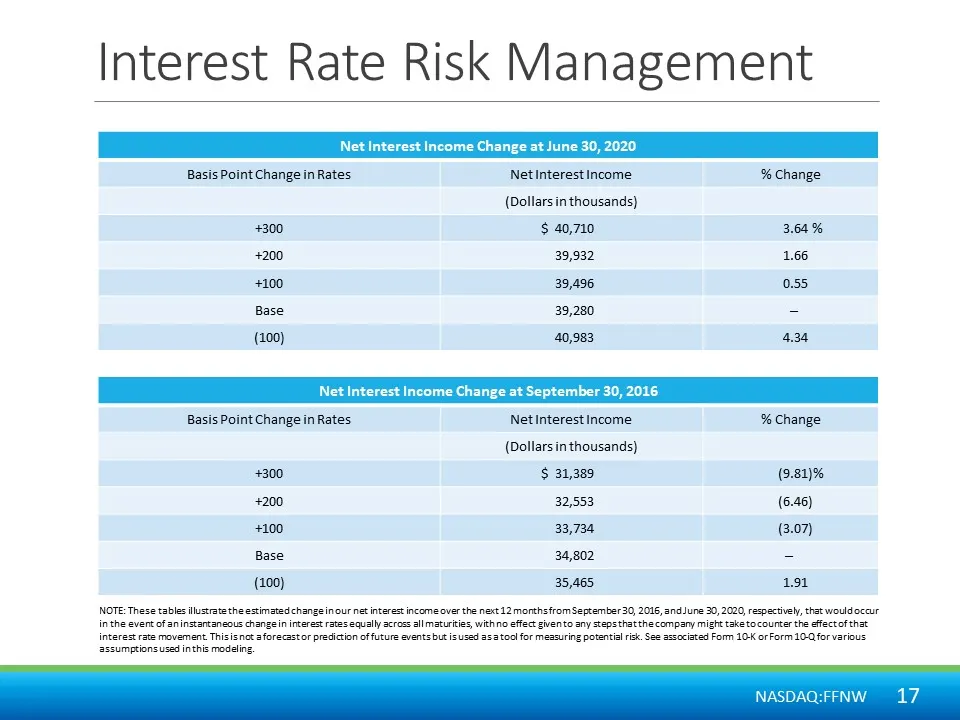
Slide 17: Interest Rate Risk Management
Interest Rate Risk Management Net Interest Income Change at June 30, 2020 Basis Point Change in Rates Net Interest Income % Change (Dollarsin thousands) +300 $ 40,710 3.64% # = Z - = as (100) 40,983 434 Basis Point Change in Rates Net Interest Income '% Change (Dollarsin thousands) +300 $ 31,389 (9.
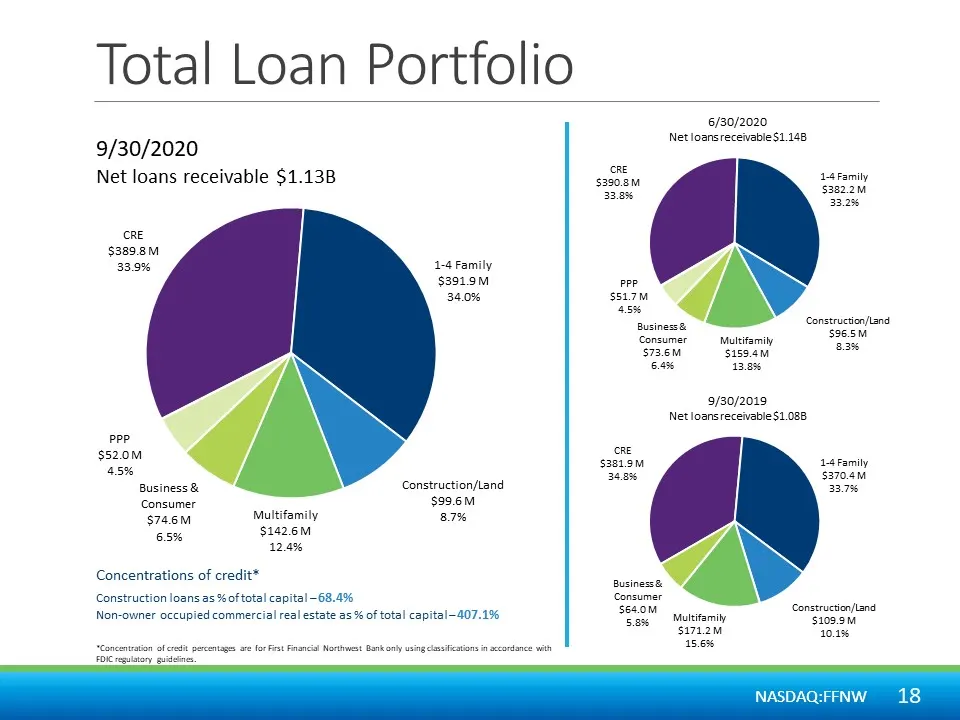
Slide 18: Total Loan Portfolio
Total Loan Portfolio 9/30/2020 Net loans receivable $1.13B cRE $389.8M 33.9% 1-4 Family $391.9M 34.0% ppp 9520M 45% Business & Construction/Land Consumer $99.6M $786M Multifamily a 65% $142.5M 124% Concentrations of credit* Construction loans as %of total capital 68.4% Non-owner occupied commercial
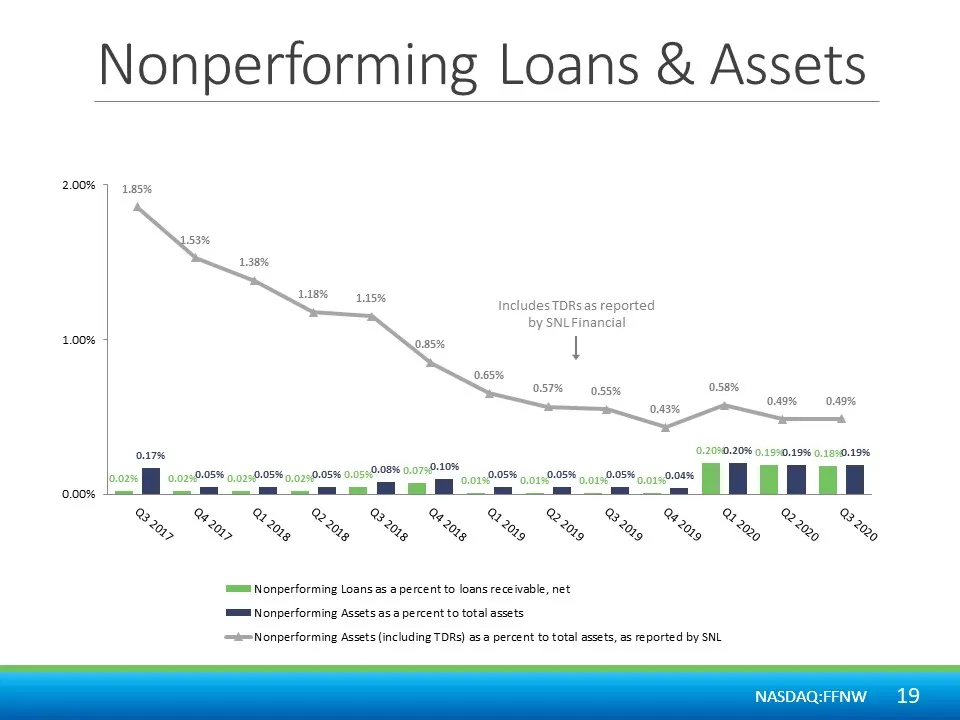
Slide 19: Nonperforming Loans & Assets
Nonperforming Loans & Assets 2.00% 1.00% 0.00% 1.85% Includes TORsas reported by SNLFinancial 049% 0.49% cam 0.209.205 0,1950.195 0,1990.1956 | 08% 0,0730-10% iT | ill iT | )o.025 [IMF 0.025405 0,025 005% o,0739.05% 0.0550. 0.0198°-05% 9,9158-05% o,915805% o,015:0-08% lm Nonperforming Loans as a per
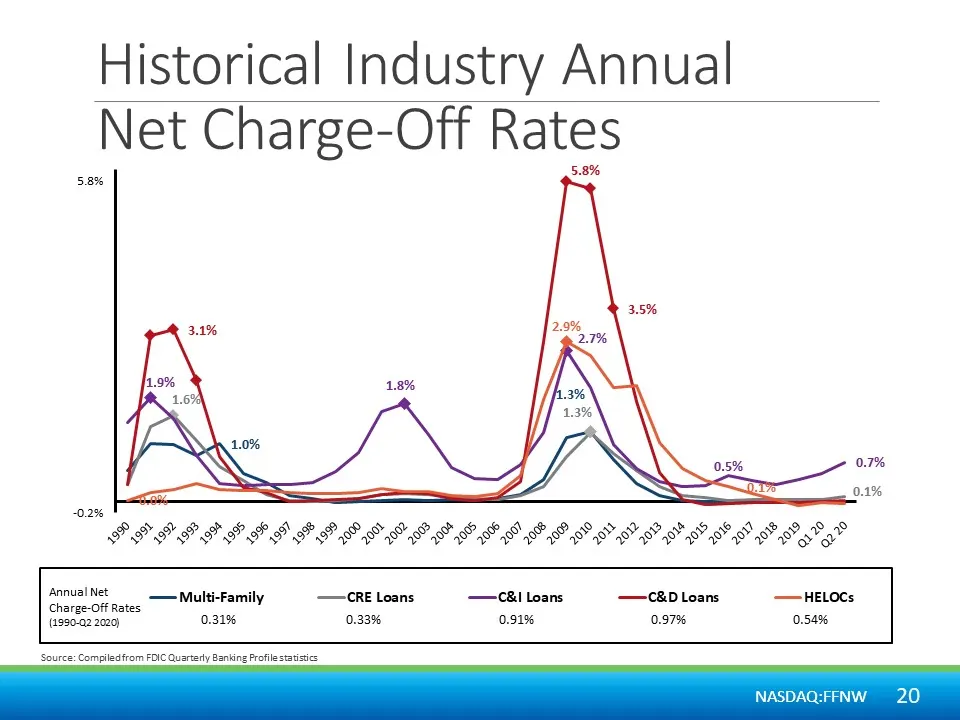
Slide 20: Historical Industry Annual Net Charge-Off Rates
Historical Industry Annual Net Charge-Off Rates 5.8% 02 SIP PP ILI IIS IS SS FP SP SPP PSI. F.2D PILEEILIEIS ESSE ELL ESS ELSI SSIES SSIS oe tog Multi-Family CRE Loans CBI Loans C&D Loans HELOCs rge-off Rates rian 0.31% 0.33% 0.91% 0.97% 05s Source: Compiledfrom FOIC Quartet Banking Profile statisti
Slide 21: Stock Ownership Summary
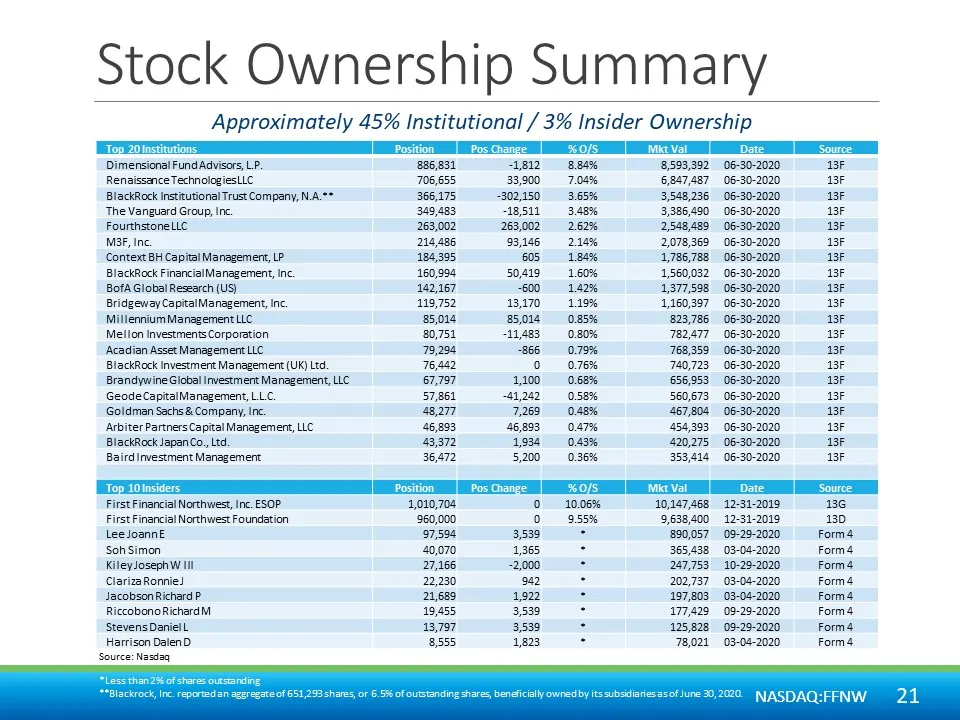
Stock Ownership Summary Approximately 45% Institutional / 3% Insider Ownership Top 20 institutions Mit Val Date. Source: Dimensional Fund Advisors, LP. 886,831 “1812 8.84% 593,392 06-30-2020 13F Renaissance TechnologiesLiC 706,655 33,900 7.08% 6,847,487 06-30-2020 13 BlackRock Institutional Trust Co
Slide 22: Total Return — FFNW vs. KRX
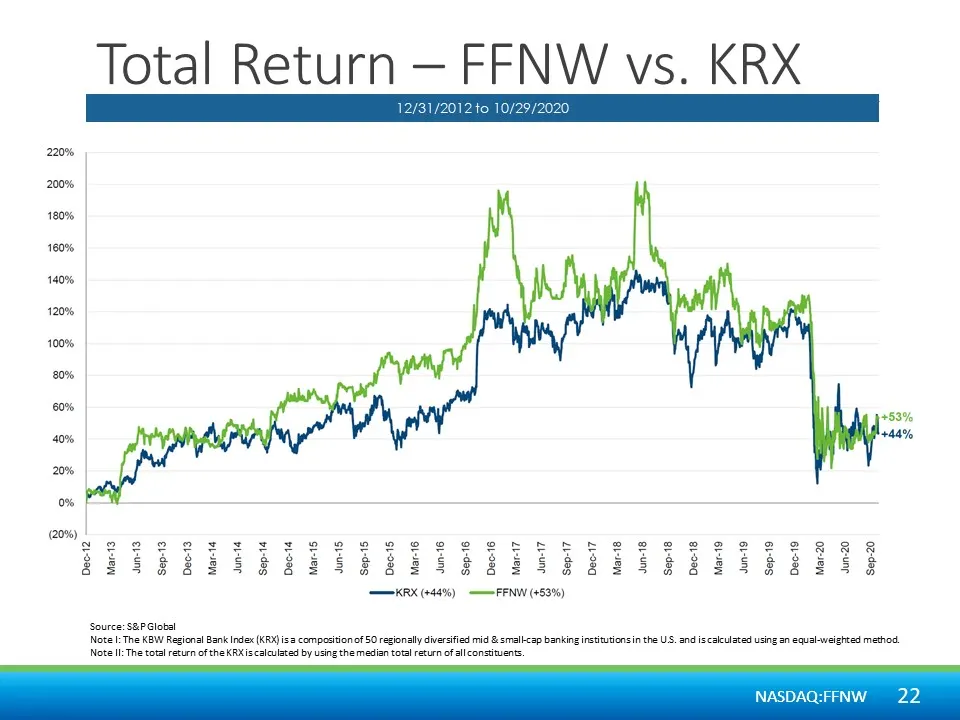
Total Return — FFNW vs. KRX 220% 200% 180% 100% 140% 120% 100% +53% 40% 144% i KX (44%) FEN (453%) Deo-t2 Mar-t3 Jung Sep-13 Deot3 Mar-t4 vun-14 Sep-t4 Dee-t4 Mar-t5 Juneis Sep-15 1 Junes Sep-16 Dees Mar-t7 June? Sep-t7 Dect? Mart@ Jun-t8 Sep-18 Dee-18 Mar-19 Jun-t9 Sep-19 Dee-19 Mar.20 Jun-20 ep-20
Slide 23: Stock Repurchase Plan
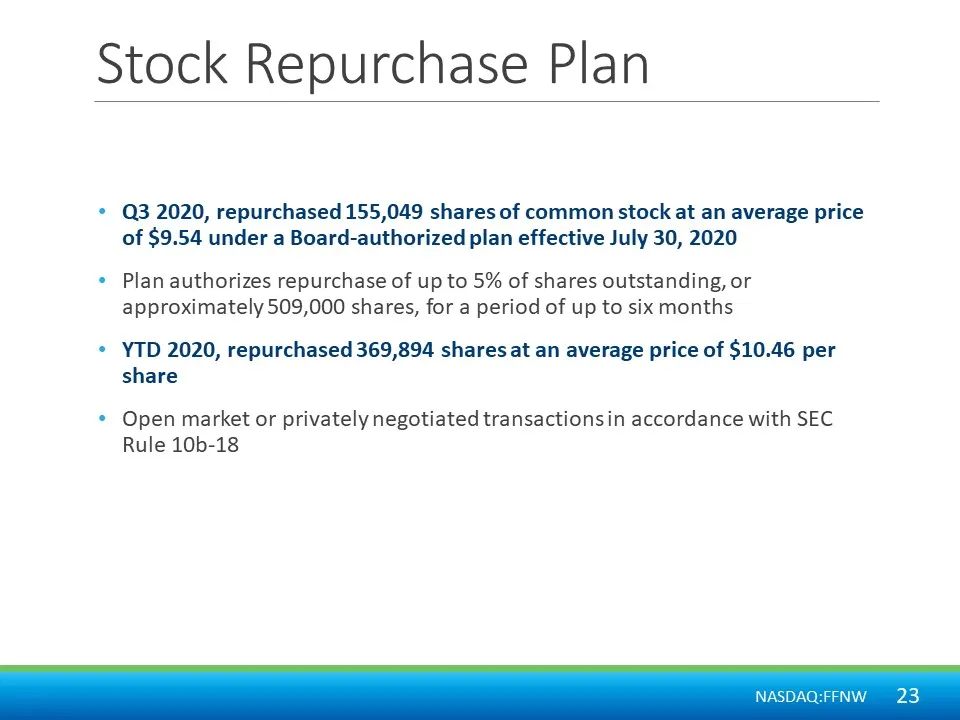
Stock Repurchase Plan * Q3 2020, repurchased 155,049 shares of common stock at an average price of $9.54 under a Board-authorized plan effective July 30, 2020 * Plan authorizes repurchase of up to 5% of shares outstanding, or approximately 509,000 shares, for a period of up to six months * YTD 2020,
Slide 24: FFNW Historical Share Repurchase
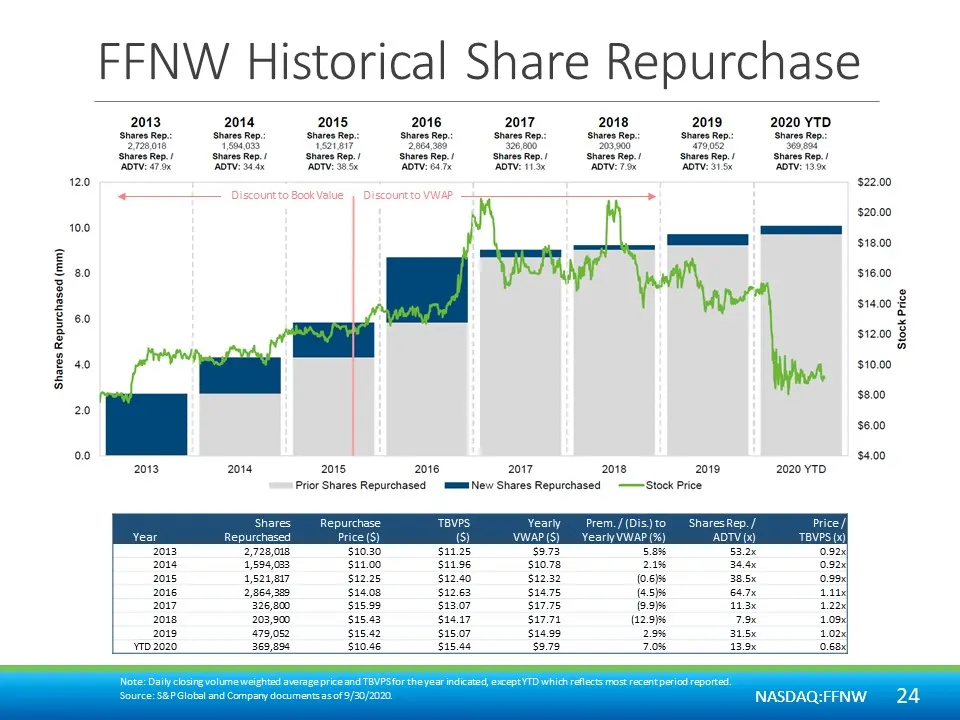
FFNW Historical Share Repurchase 2013 2014 2015 2016 2017 2018 2019 2020 YTD nas ep: Shares Rep «Stare ep:———Sharsep: Share Rep>———SharenRep>———hareaRep: “Shae Rep peti peed pest ses sa sro scone shee ep.! Sharon.) Shareup! Sharniep./ Shares ep./- Shares Rop./ Shares Rp.-——hares Rep. fowsts onary ow
Slide 25: Ongoing Strategic Initiatives
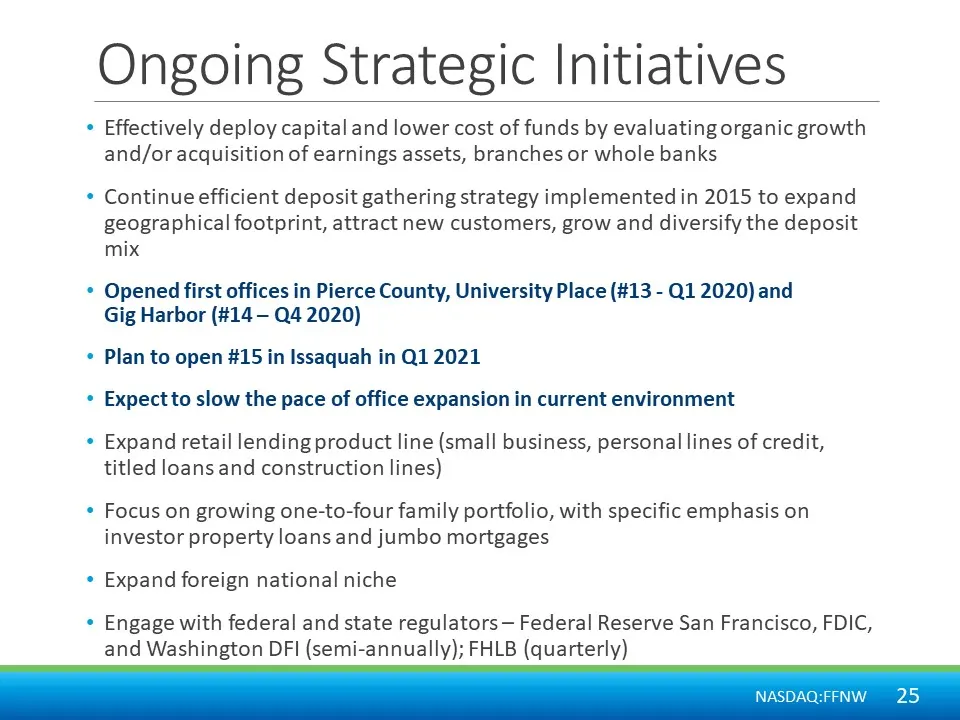
Ongoing Strategic Initiatives Effectively deploy capital and lower cost of funds by evaluating organic growth and/or acquisition of earnings assets, branches or whole banks Continue efficient deposit gathering strategy implemented in 2015 to expand geographical footprint, attract new customers, grow
Slide 26: Recent Strategic Initiatives
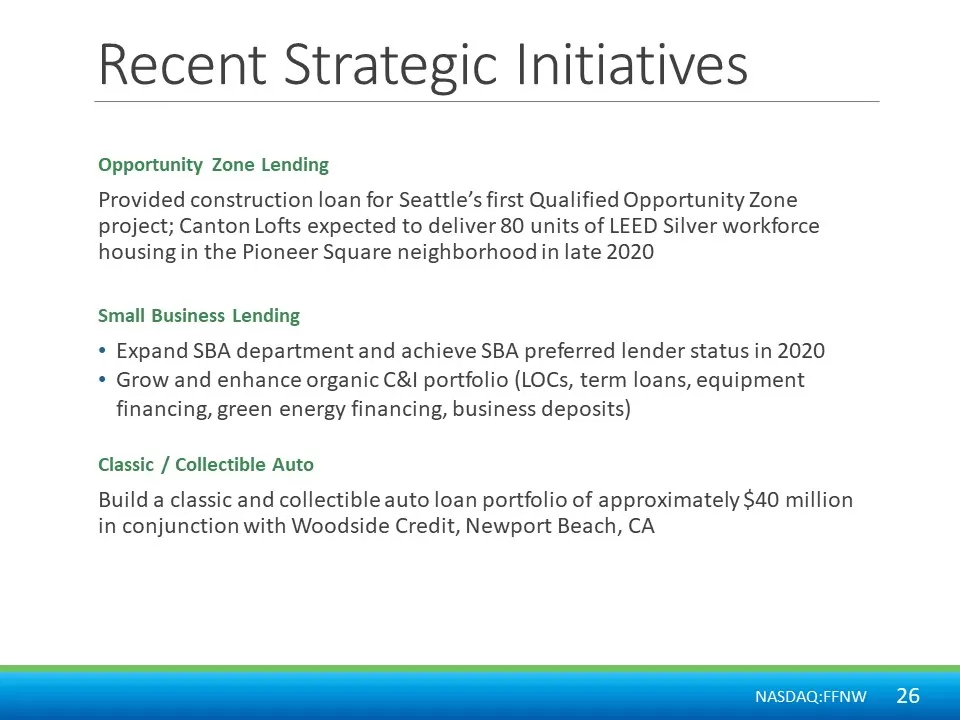
Recent Strategic Initiatives Opportunity Zone Lending Provided construction loan for Seattle’s first Qualified Opportunity Zone project; Canton Lofts expected to deliver 80 units of LEED Silver workforce housing in the Pioneer Square neighborhood in late 2020 Small Business Lending « Expand SBA depa
Slide 27: Pandemic Response
PANDEMIC RESPONSE NASDAQ:FFNW
Slide 28: COVID-19 Response
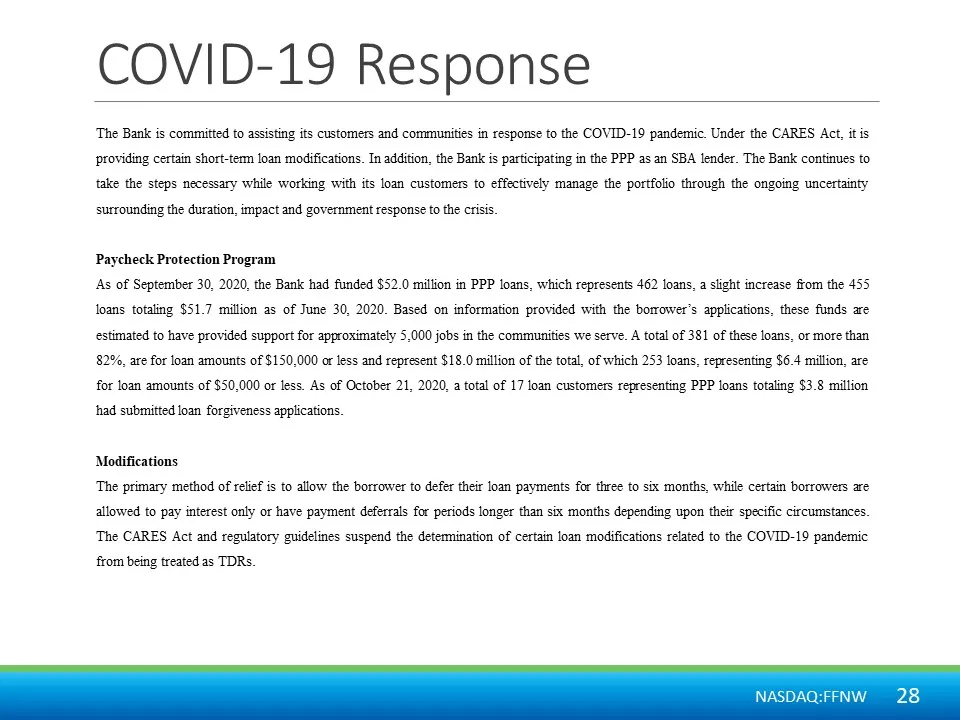
COVID-19 Response The Bank is committed to assisting its customers and communities in response to the COVID-19 pandemic. Under the CARES Act, it is providing certain short-term loan modifications. In addition, the Bank is participating in the PPP as an SBA lender. The Bank continues to take the step
Slide 29: Loans on Deferral Status
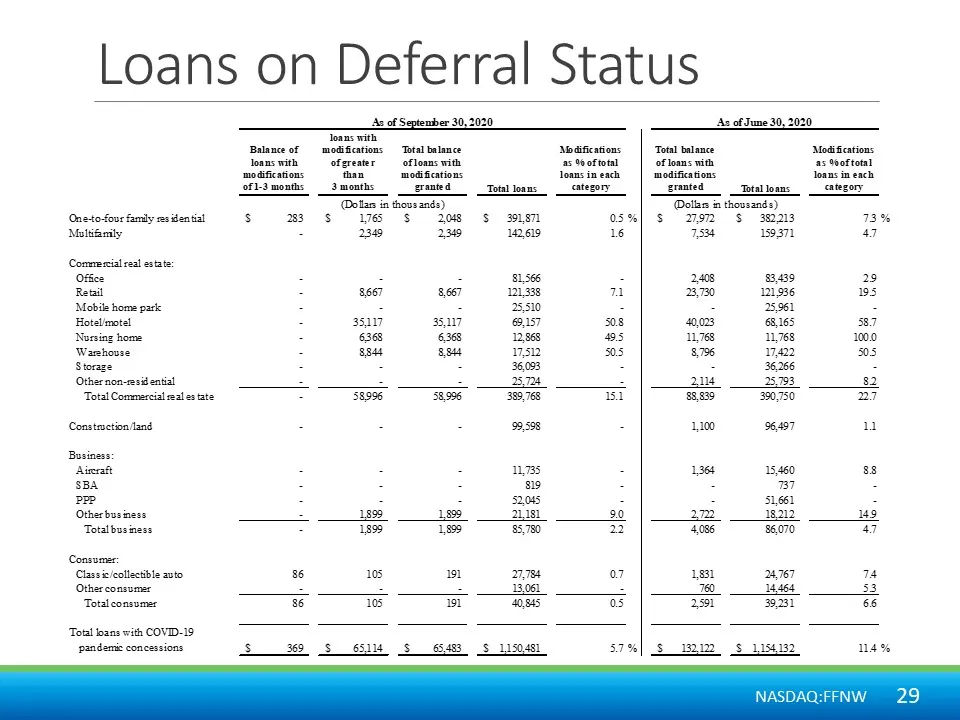
Loans on Deferral Status Onetofoxe family ses dentist Moliganily (Commerial sal estate: Office Retail ‘Mobile home pasie Hotelimotal Nursing home Warshouse Storage Othernon-resi ential, ‘Total Commercial wal estate Constmvstion and Business Aimeaft SBA PEP Otherbusiness Totalbusiness Consumer: Clas
Slide 30: Additional Portfolio Details
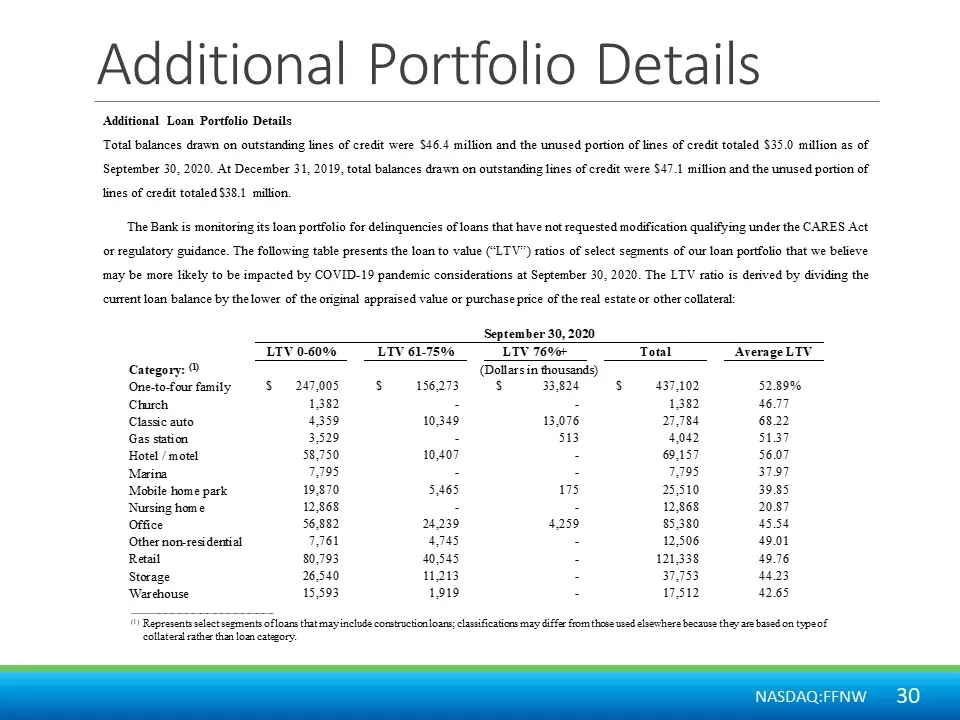
Additional Portfolio Details Additional Loan Portfolio Details Total balances drawn on outstanding lines of credit were $46.4 million and the unused portion of lines of credit totaled $35.0 million as of September 30, 2020. At December 31, 2019, total balances drawn on outstanding lines of credit we
Slide 31: Community Involvement
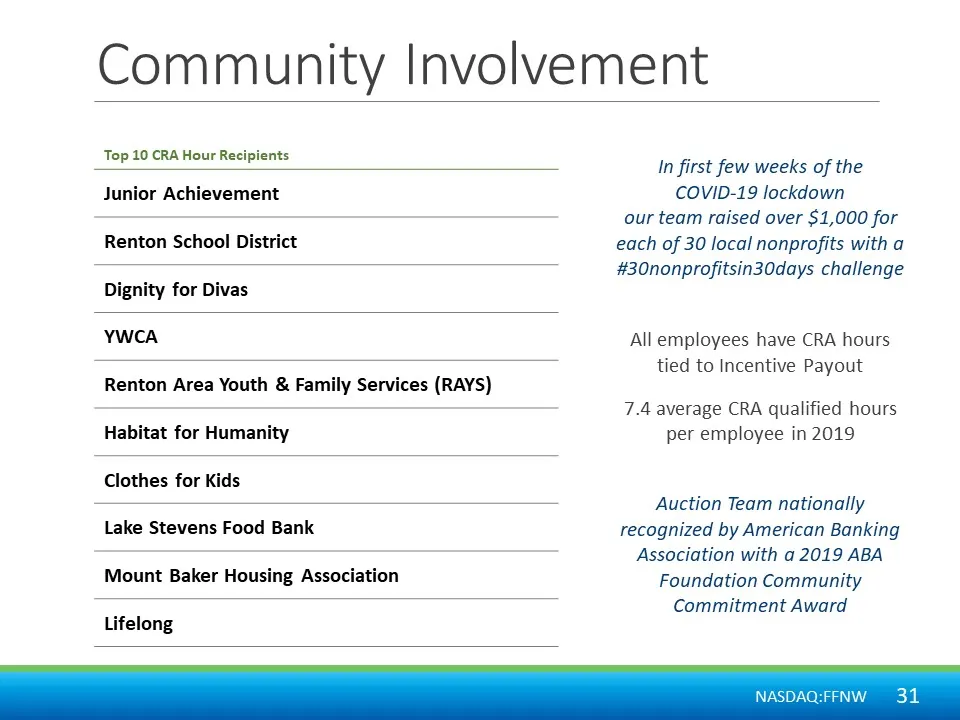
Community Involvement Top 10 CRA Hour Recipients Junior Achievement Renton School District Dignity for Divas YWCA Renton Area Youth & Family Services (RAYS) Habitat for Humanity Clothes for Kids Lake Stevens Food Bank Mount Baker Housing Association Lifelong In first few weeks of the COVID-19 lockdo
Slide 32: Thank You
Slide 33: Appendix
APPENDIX NASDAQ:FFNW
Slide 34: Non-GAAP Financial Measures
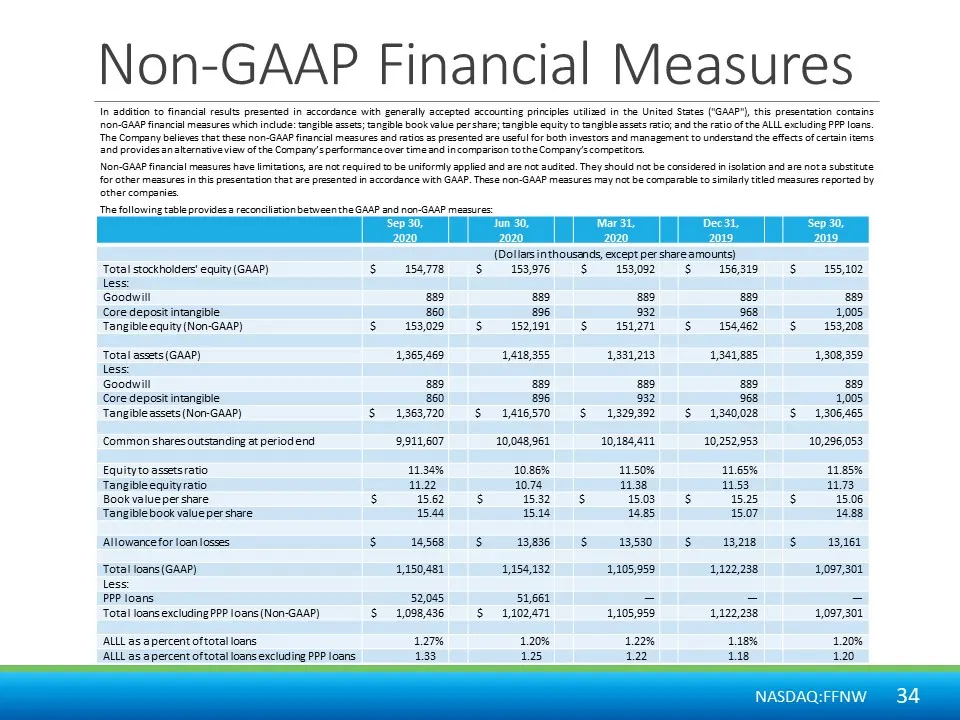
Non-GAAP Financial Measures In addition to financial results presented in accordance with generaly accepted accounting principles utilized in the United States ("GAAP"), this presentation contains non-GAAP finarcial measures which include: tangible assets; tangible book value pershare; tangible equi
Source: SEC EDGAR · 8-K filed Nov 2, 2020
More decks from First Financial Northwest Inc
 Investor Presentation (November 2021)34 slides · Nov 4, 2021
 Shareholder Meeting (June 2019)20 slides · Jun 13, 2019
 Investor Presentation (May 2019)27 slides · May 21, 2019
 Investor Presentation (June 2018)25 slides · Jun 14, 2018
 Investor Presentation (June 2017)37 slides · Jun 15, 2017
 Investor Presentation (August 2016)34 slides · Aug 2, 2016