State Bank Financial Corporation
State Bank Financial — Sandler O'Neill 2012 East Coast Financial Services Conference
14 slides from State Bank Financial's conference presentation, Nov 15, 2012
Slide 1: State Bank Financial Corporation at Sandler O'Neill 2012 East Coast Financial Services Conference
State Bank Financial Corporation Sandler O’Neill 2012 East Coast Financial Services Conference Joe Evans – Chairman and CEO November 15, 2012
Slide 2: Cautionary Note Regarding Forward-Looking Statements
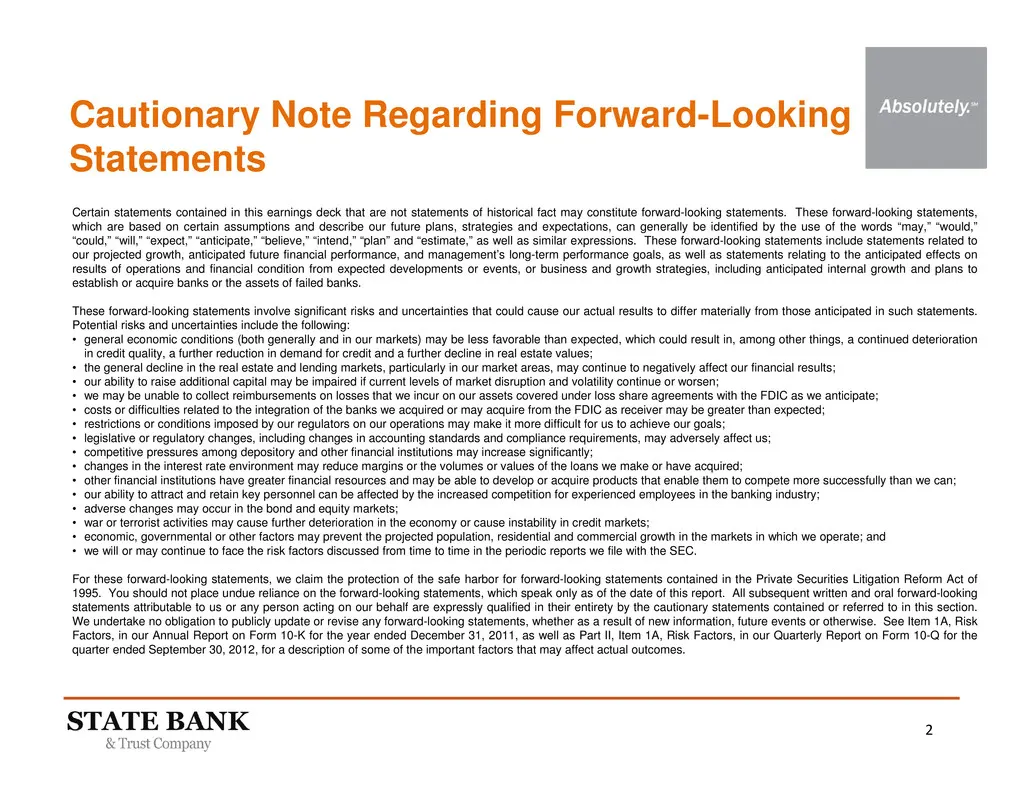
2 Cautionary Note Regarding Forward-Looking Statements Certain statements contained in this earnings deck that are not statements of historical fact may constitute forward-looking statements. These forward-looking statements, which are based on certain assumptions and describe our future plans, stra
Slide 3: State Bank Profile
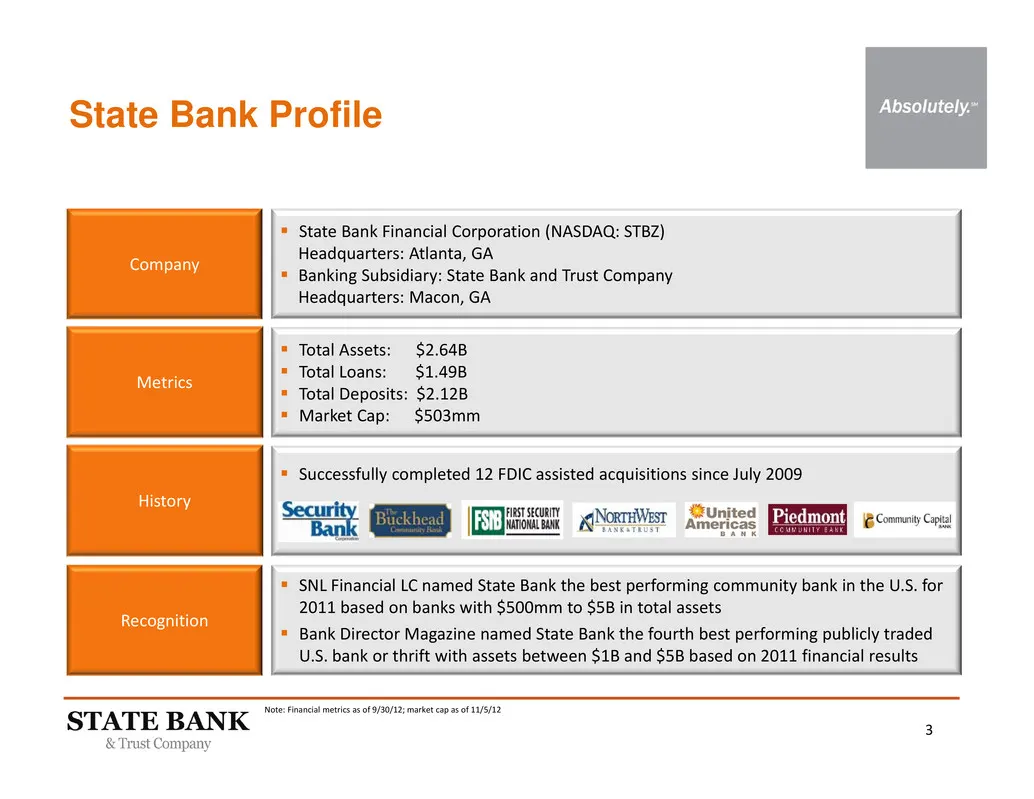
3 State Bank Profile Company Metrics Recognition State Bank Financial Corporation (NASDAQ: STBZ) Headquarters: Atlanta, GA Banking Subsidiary: State Bank and Trust Company Headquarters: Macon, GA Total Assets: $2.64B Total Loans: $1.49B Total Deposits: $2.12B Market Cap: $503mm SNL Fin
Slide 4: 3Q12 Results Summary
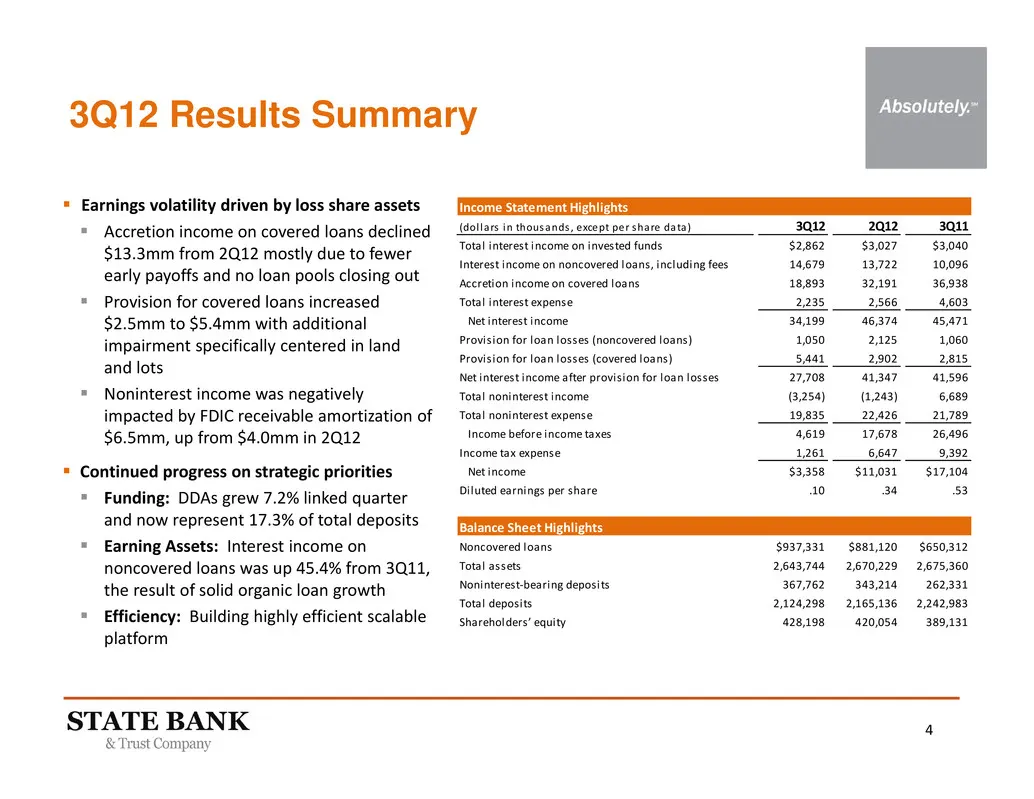
4 3Q12 Results Summary Earnings volatility driven by loss share assets Accretion income on covered loans declined $13.3mm from 2Q12 mostly due to fewer early payoffs and no loan pools closing out Provision for covered loans increased $2.5mm to $5.4mm with additional impairment specifically cen
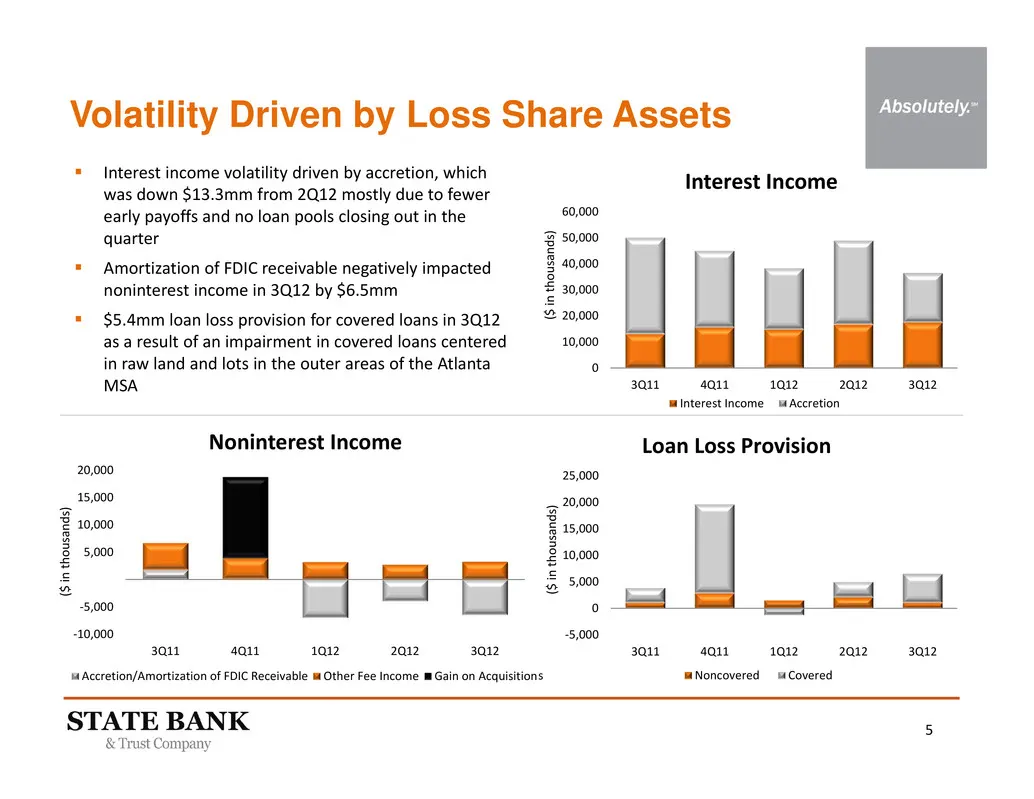
Slide 5: Volatility Driven by Loss Share Assets
5 ‐10,000 ‐5,000 5,000 10,000 15,000 20,000 3Q11 4Q11 1Q12 2Q12 3Q12 Noninterest Income Accretion/Amortization of FDIC Receivable Other Fee Income Gain on Acquisition 0 10,000 20,000 30,000 40,000 50,000 60,000 3Q11 4Q11 1Q12 2Q12 3Q12 Interest Income Interest Income Accretion ‐5,000 0 5,000 10,000
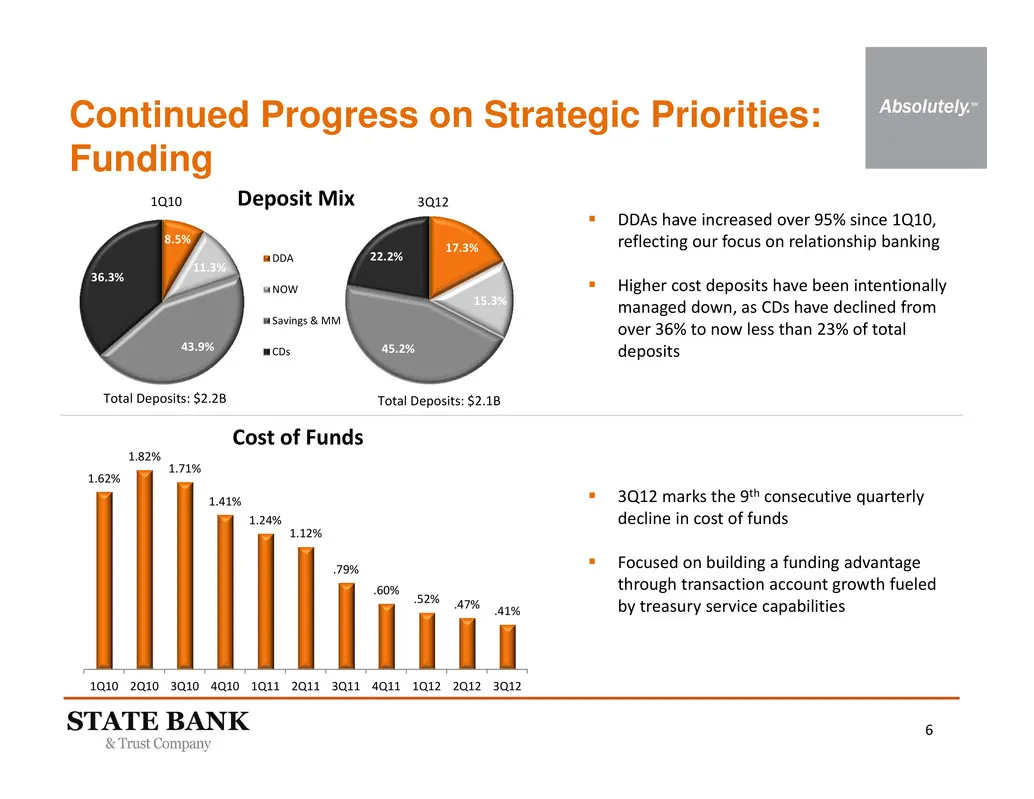
Slide 6: Continued Progress on Strategic Priorities: Funding
6 8.5% 11.3% 43.9% 36.3% DDA NOW Savings & MM CDs 1Q10 17.3% 15.3% 45.2% 22.2% 3Q12 Total Deposits: $2.1B DDAs have increased over 95% since 1Q10, reflecting our focus on relationship banking Higher cost deposits have been intentionally managed down, as CDs have declined from over 36% to now les
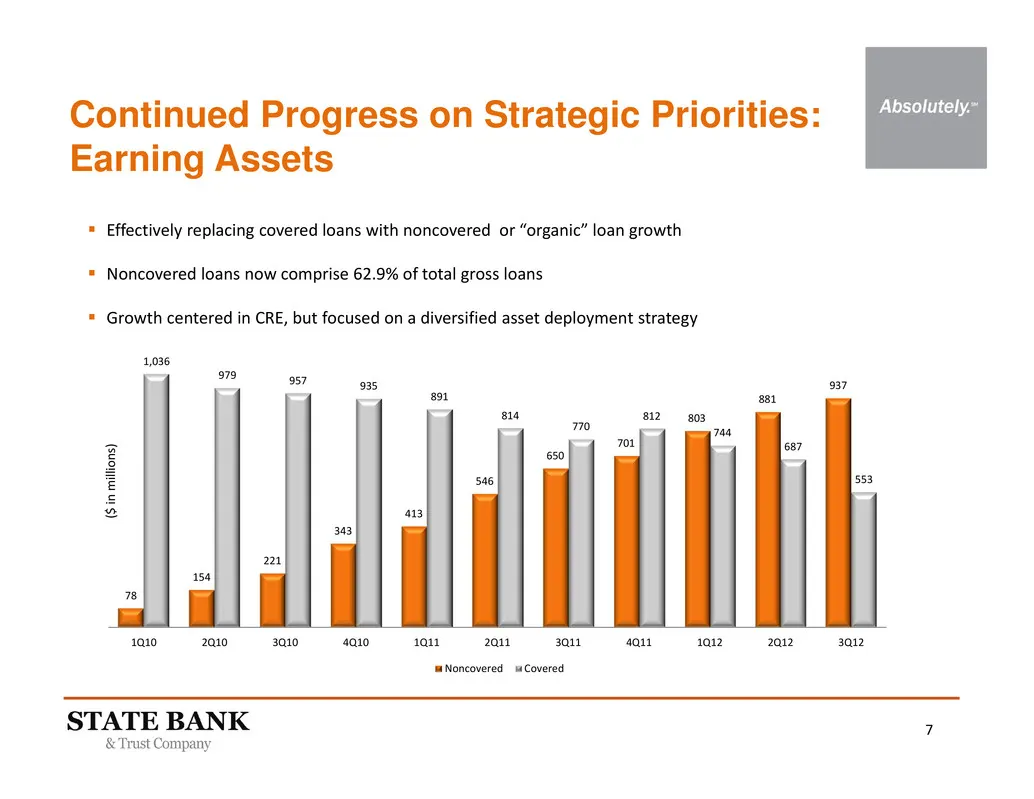
Slide 7: Continued Progress on Strategic Priorities: Earning Assets
7 78 154 221 343 413 546 650 701 803 881 937 1,036 979 957 935 891 814 770 812 744 687 553 1Q10 2Q10 3Q10 4Q10 1Q11 2Q11 3Q11 4Q11 1Q12 2Q12 3Q12 Noncovered Covered ( $ i n m i l l i o n s ) Continued Progress on Strategic Priorities: Earning Assets Effectively replacing covered loans with noncove
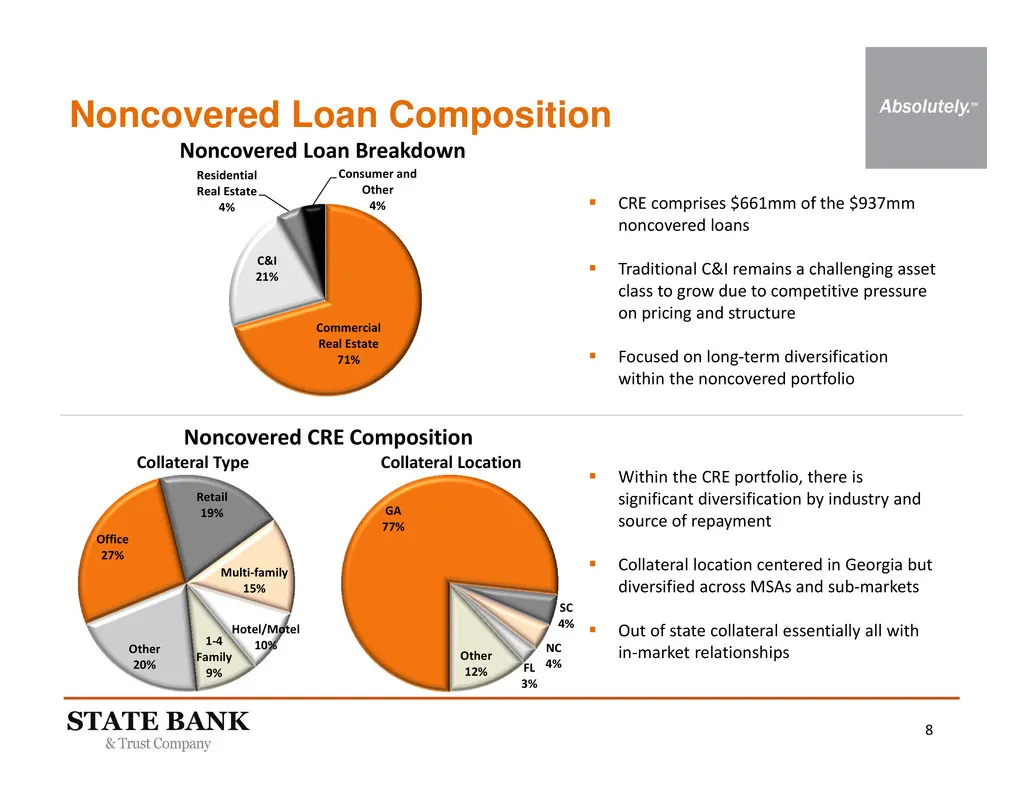
Slide 8: Noncovered Loan Breakdown
8 GA 77% SC 4% NC 4%FL 3% Other 12% Collateral Location Noncovered Loan Composition Commercial Real Estate 71% C&I 21% Residential Real Estate 4% Consumer and Other 4% Noncovered Loan Breakdown CRE comprises $661mm of the $937mm noncovered loans Traditional C&I remains a challenging asset class
Slide 9: Homebuilder Finance Portfolio
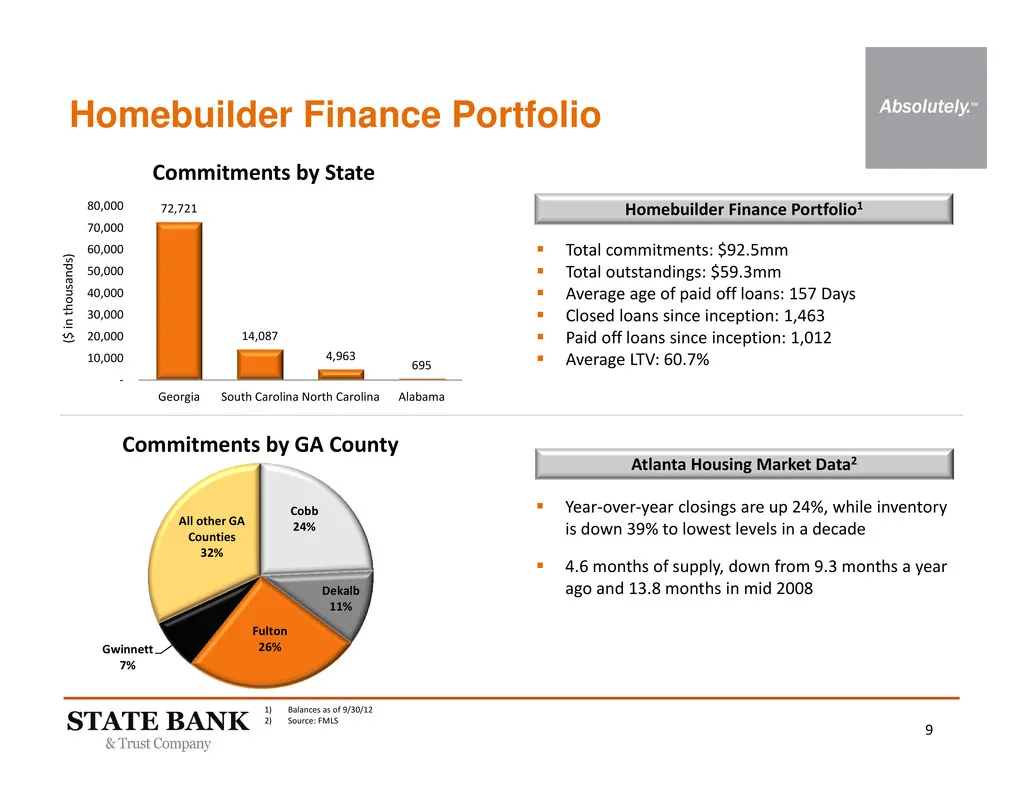
9 72,721 14,087 4,963 695 ‐ 10,000 20,000 30,000 40,000 50,000 60,000 70,000 80,000 Georgia South Carolina North Carolina Alabama Commitments by State ( $ i n t h o u s a n d s ) Homebuilder Finance Portfolio Cobb 24% Dekalb 11% Fulton 26%Gwinnett 7% All other GA Counties 32% Commitments by GA Count
Slide 10: Continued Progress on Strategic Priorities: Efficiency
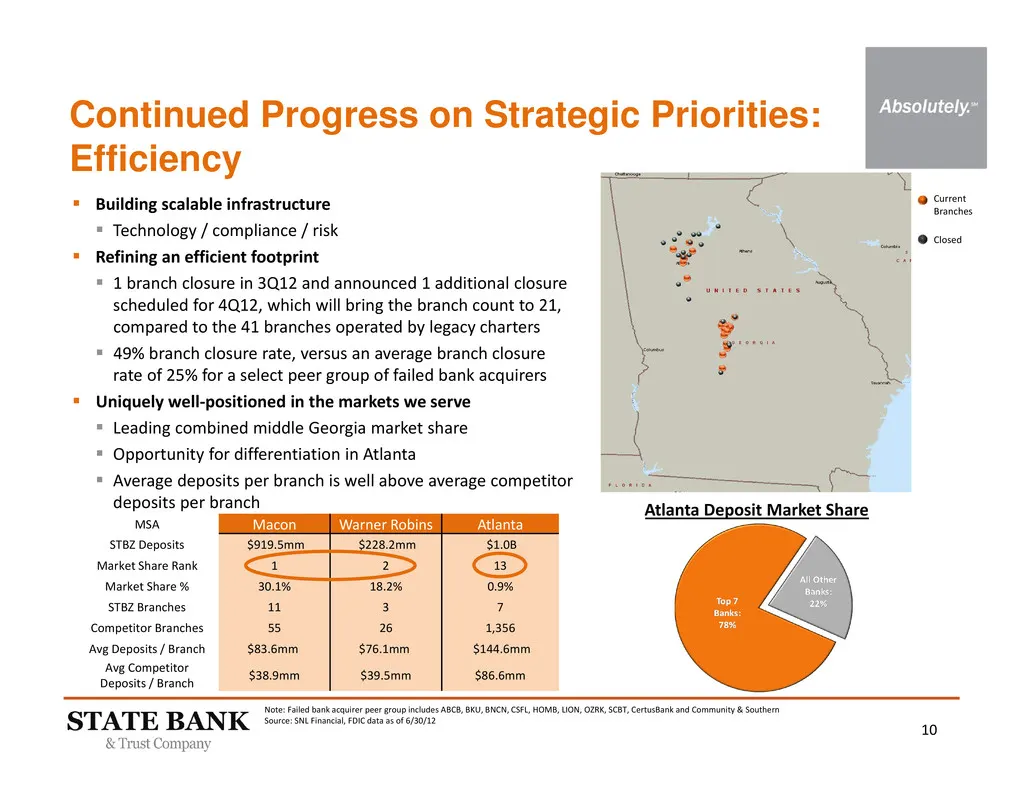
10 Note: Failed bank acquirer peer group includes ABCB, BKU, BNCN, CSFL, HOMB, LION, OZRK, SCBT, CertusBank and Community & Southern Source: SNL Financial, FDIC data as of 6/30/12 Continued Progress on Strategic Priorities: Efficiency Current Branches Closed Building scalable infrastructure Tech
Slide 11: Attractive Georgia Demographics
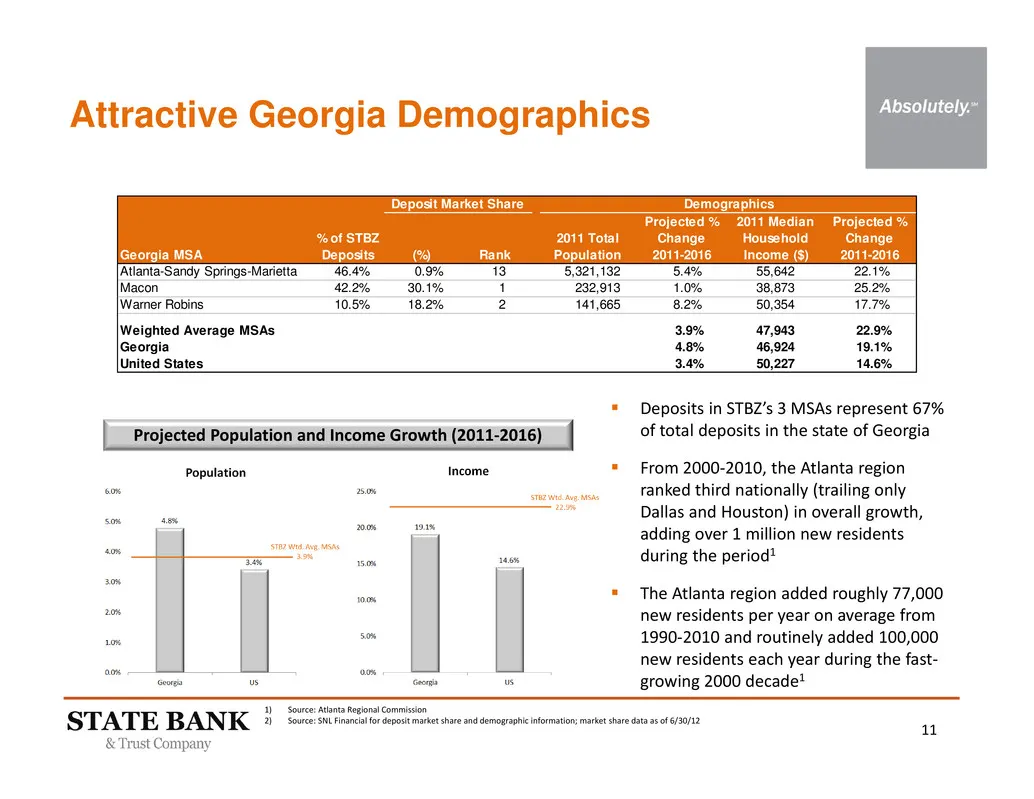
11 Attractive Georgia Demographics Deposits in STBZ’s 3 MSAs represent 67% of total deposits in the state of Georgia From 2000‐2010, the Atlanta region ranked third nationally (trailing only Dallas and Houston) in overall growth, adding over 1 million new residents during the period1 The Atlan
Slide 12: Total Employment Levels
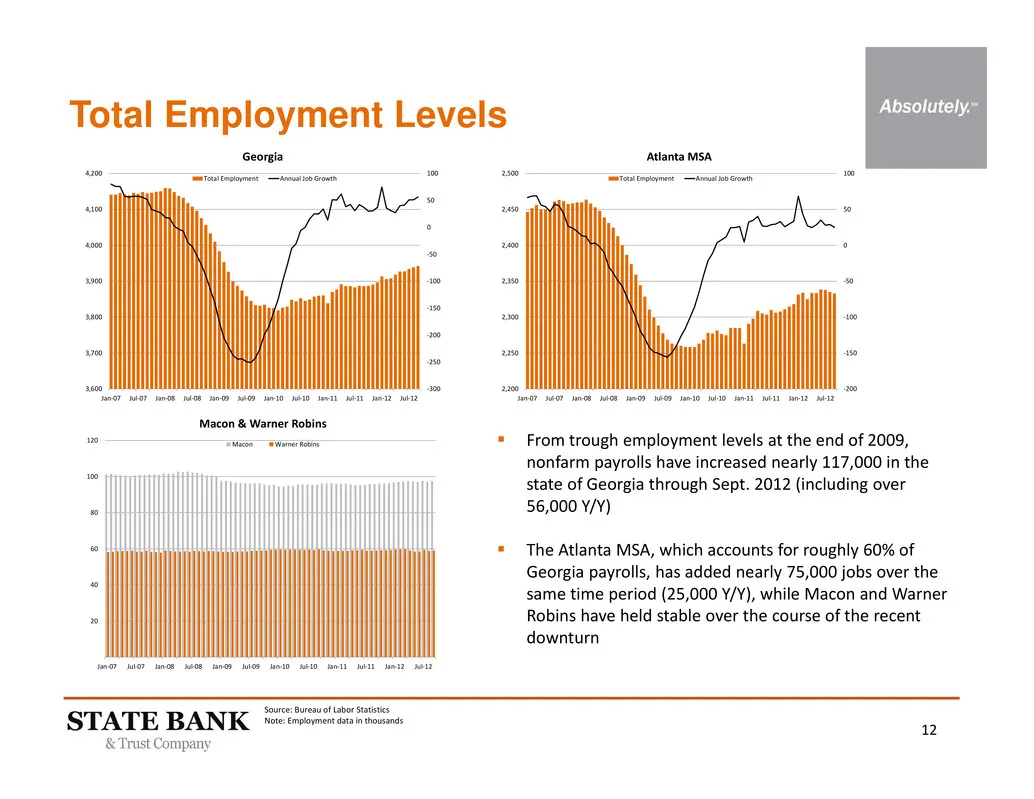
12 Total Employment Levels From trough employment levels at the end of 2009, nonfarm payrolls have increased nearly 117,000 in the state of Georgia through Sept. 2012 (including over 56,000 Y/Y) The Atlanta MSA, which accounts for roughly 60% of Georgia payrolls, has added nearly 75,000 jobs ove
Slide 13: Capital Strength to be Opportunistic
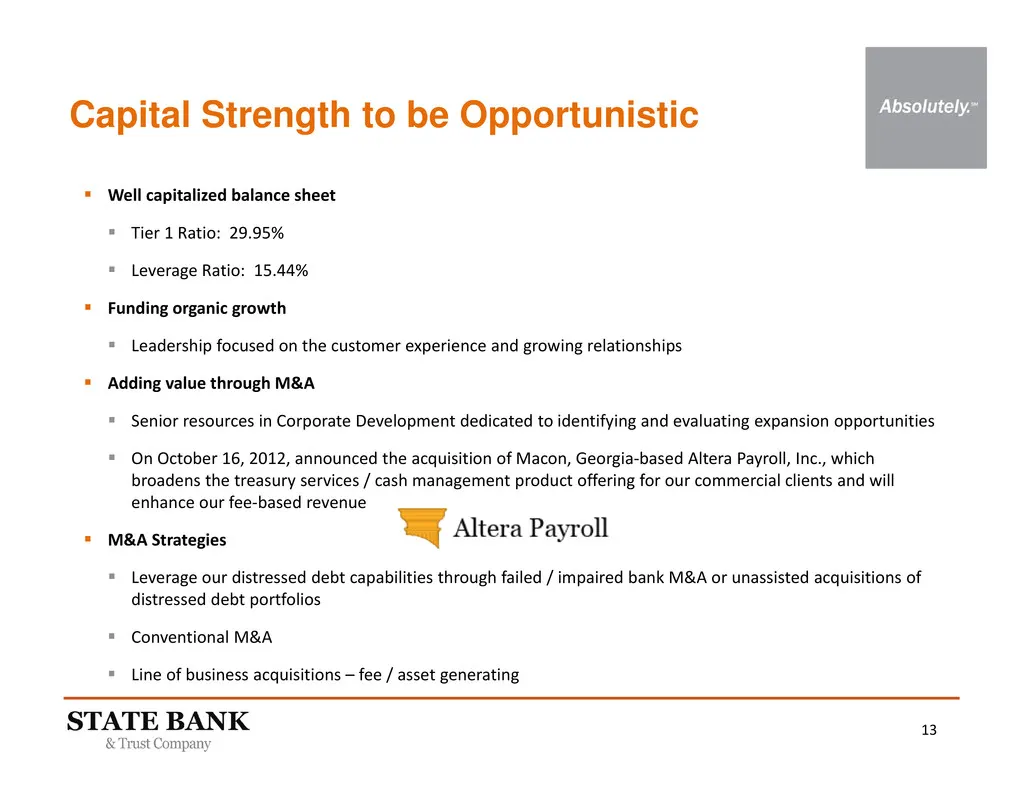
13 Well capitalized balance sheet Tier 1 Ratio: 29.95% Leverage Ratio: 15.44% Funding organic growth Leadership focused on the customer experience and growing relationships Adding value through M&A Senior resources in Corporate Development dedicated to identifying and evaluating expans
Slide 14: Well Positioned Franchise
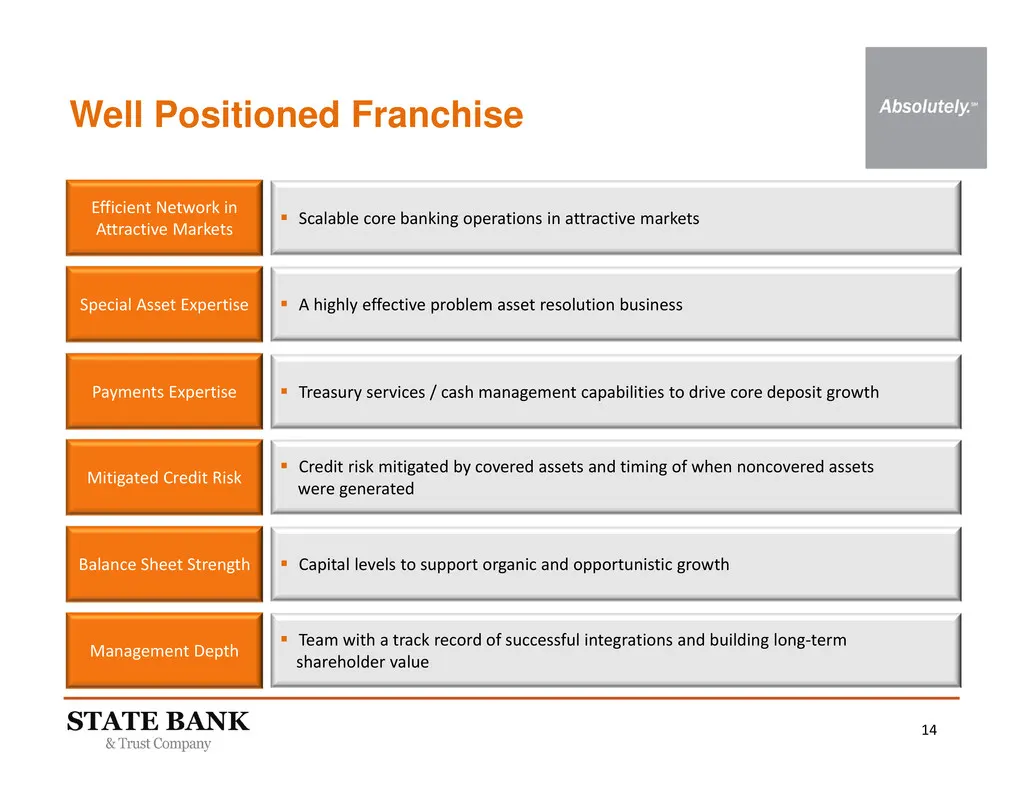
14 Well Positioned Franchise Efficient Network in Attractive Markets Special Asset Expertise Mitigated Credit Risk Balance Sheet Strength Management Depth Scalable core banking operations in attractive markets A highly effective problem asset resolution business Capital levels to support organ
Source: SEC EDGAR · 8-K filed Nov 15, 2012
More decks from State Bank Financial Corporation
 Merger or Acquisition (May 2018)20 slides · May 14, 2018
 Investor Presentation (May 2018)18 slides · May 7, 2018
 Q1 2018 Earnings Presentation11 slides · Apr 26, 2018
 Q4 2017 Earnings Presentation14 slides · Jan 25, 2018
 Investor Presentation (December 2017)18 slides · Dec 11, 2017
 Q3 2017 Earnings Presentation12 slides · Oct 26, 2017