TRC Companies — Needham & Company Growth Conference 2016
30 slides from TRC Companies's conference presentation, Jan 19, 2016
Slide 1: Q1 Fiscal 2016 Investor Review
Q1 Fiscal 2016 Investor Review TRR Jim Stephenson SVP Corp. Development & Planning Needham & Company Growth Conference NYC January 14, 2016
Slide 2: Safe Harbor Statement
Safe Harbor Statement 2 Certain statements in this presentation may be forward-looking statements within the meaning of Section 27A of the Securities Act of 1933 and Section 21E of the Securities Exchange Act of 1934. You can identify these statements by forward-looking words such as "may," "expects
Slide 3: Company Profile
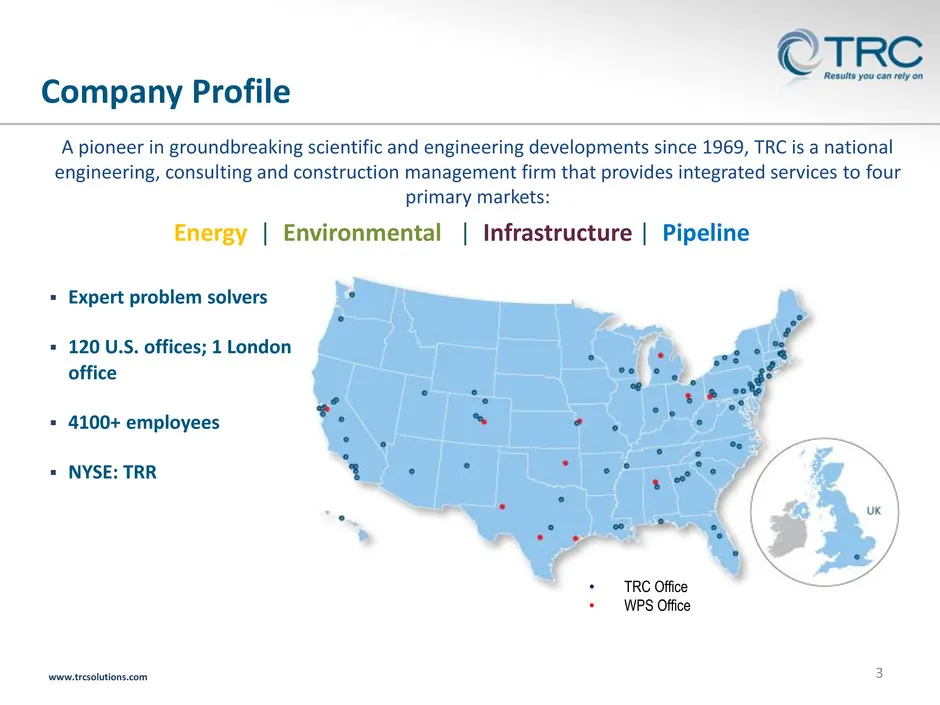
3 Company Profile www.trcsolutions.com • TRC Office • WPS Office Expert problem solvers 120 U.S. offices; 1 London office 4100+ employees NYSE: TRR Energy | Environmental | Infrastructure | Pipeline A pioneer in groundbreaking scientific and engineering developments since 1969, TRC is a nati
Slide 4: Investment Highlights
Investment Highlights 4 Well-positioned as end-to-end solutions provider in markets with solid growth opportunities Executing a focused profitable growth strategy Large addressable market opportunity Robust revenue stream with attractive customer base Strong balance sheet and cash position
Slide 5: TRC's Diversified Business Model (Pre-WPS)
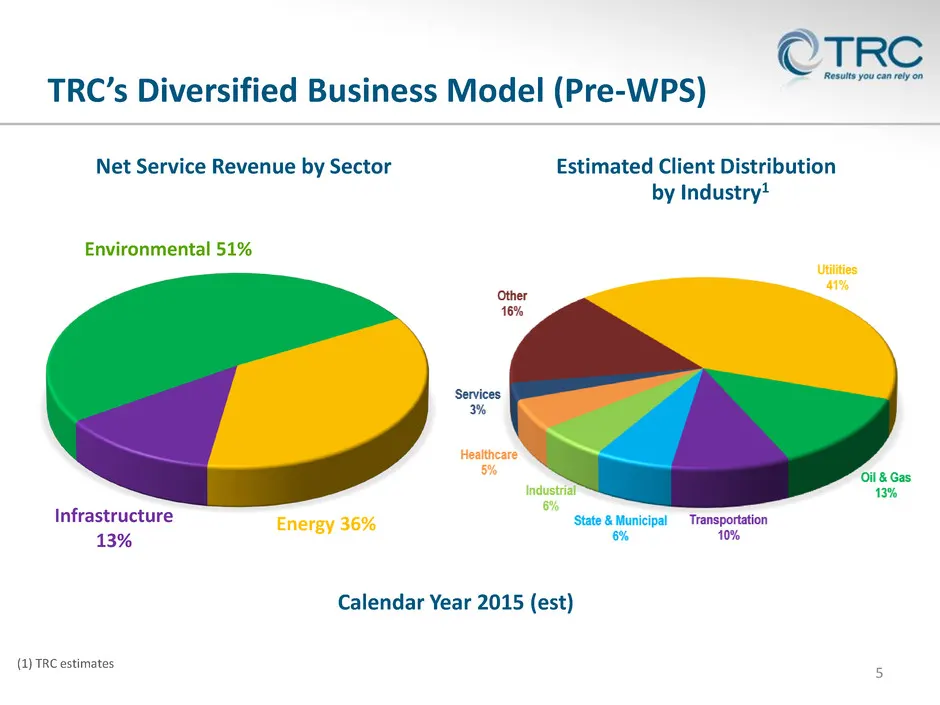
TRC’s Diversified Business Model (Pre-WPS) 5 Net Service Revenue by Sector Calendar Year 2015 (est) Infrastructure 13% Environmental 51% Energy 36% Estimated Client Distribution by Industry1 (1) TRC estimates
Slide 6: TRC's Diversified Business Model (Post WPS)
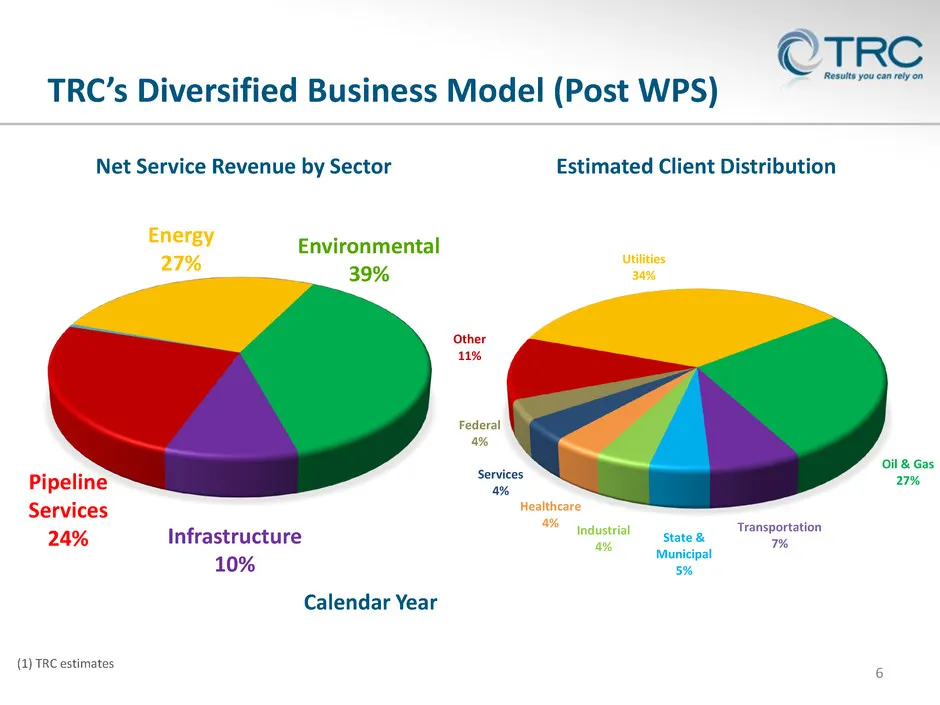
TRC’s Diversified Business Model (Post WPS) 6 Net Service Revenue by Sector Calendar Year 2015 (pro forma) Infrastructure 10% Energy 27% Estimated Client Distribution by Industry1 (1) TRC estimates Pipeline Services 24% Environmental 39% Utilities 34% Oil & Gas 27% Transportation 7%State & Municipal
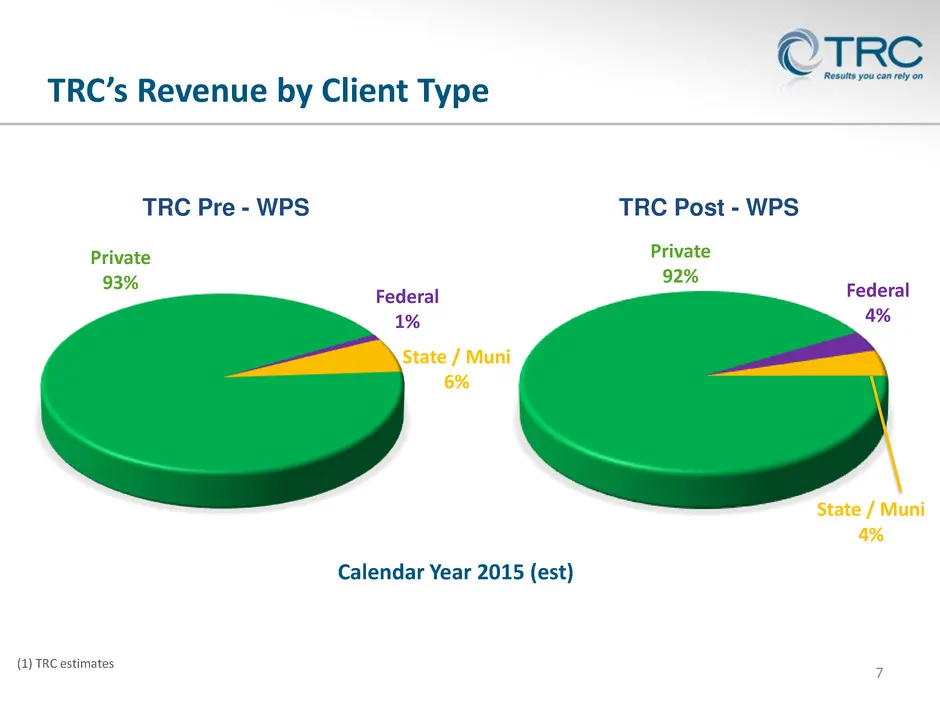
Slide 7: TRC's Revenue by Client Type
Private 92% Federal 4% State / Muni 4% TRC’s Revenue by Client Type 7 Calendar Year 2015 (est) (1) TRC estimates Private 93% Federal 1% State / Muni 6% TRC Pre - WPS TRC Post - WPS
Slide 8: High-Profile Private Sector Clients
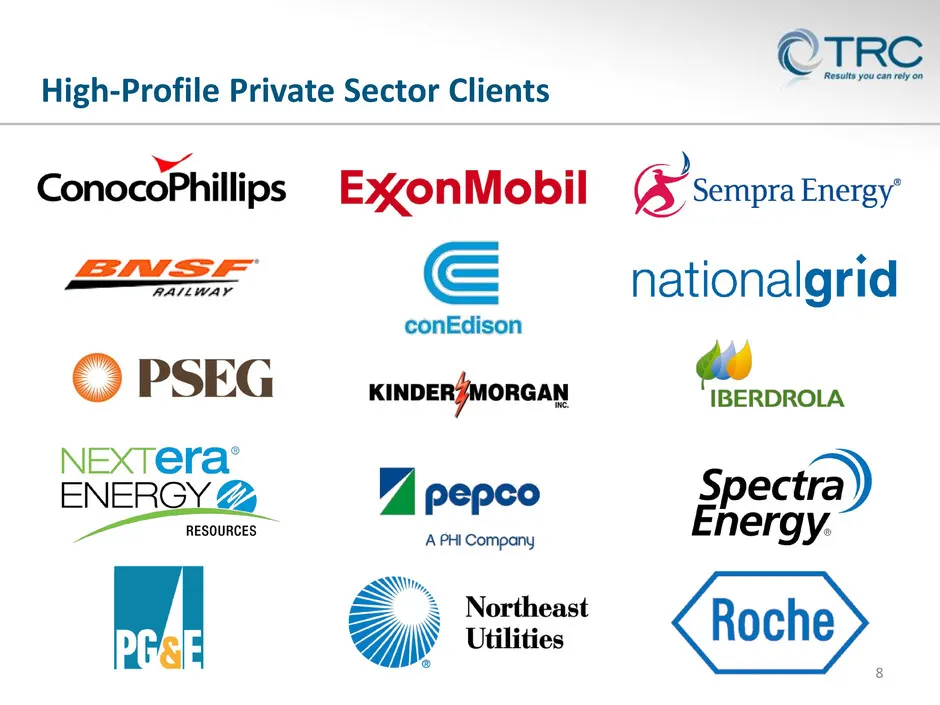
High-Profile Private Sector Clients 8
Slide 9: Working With All Levels of Government
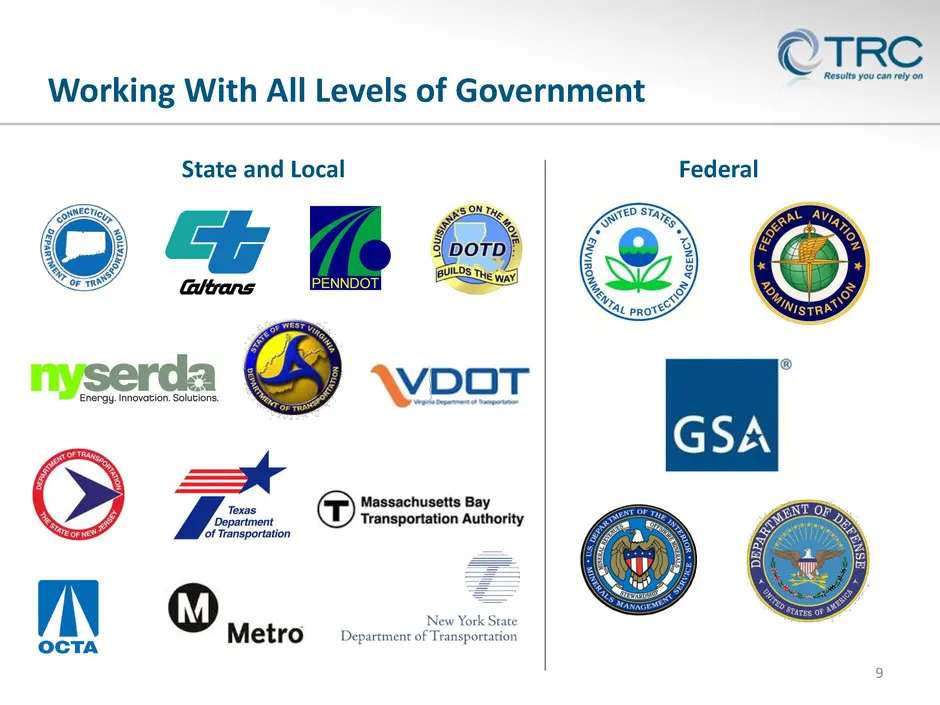
Working With All Levels of Government 9 State and Local Federal
Slide 10: Q1 Fiscal 2016 Overview
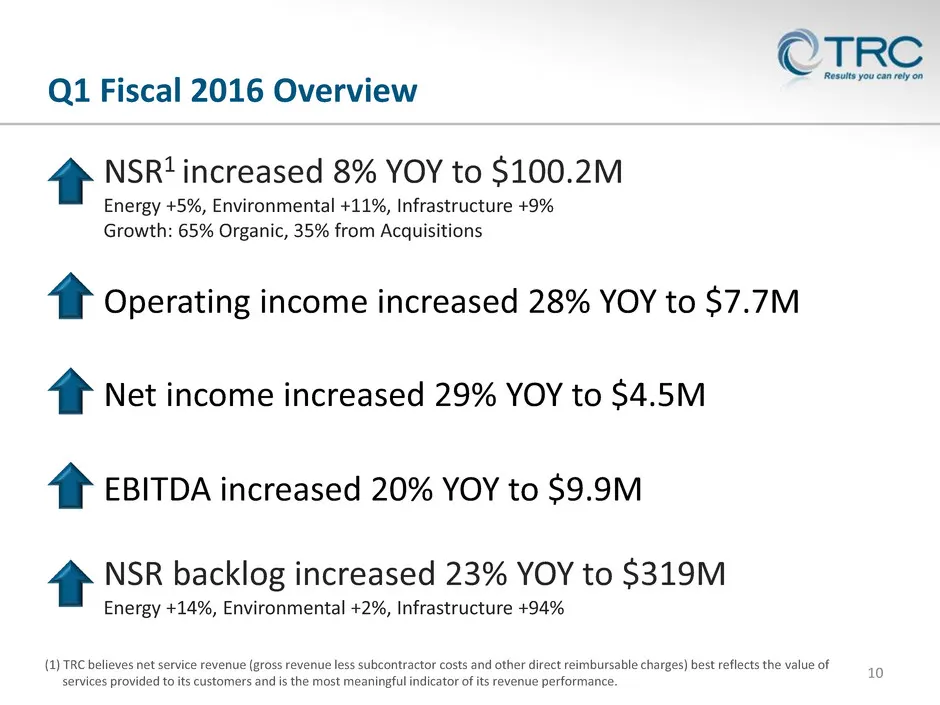
Q1 Fiscal 2016 Overview 10 NSR1 increased 8% YOY to $100.2M Energy +5%, Environmental +11%, Infrastructure +9% Growth: 65% Organic, 35% from Acquisitions Operating income increased 28% YOY to $7.7M NSR backlog increased 23% YOY to $319M Energy +14%, Environmental +2%, Infrastructure +94% (1) TRC bel
Slide 11: Environmental Segment
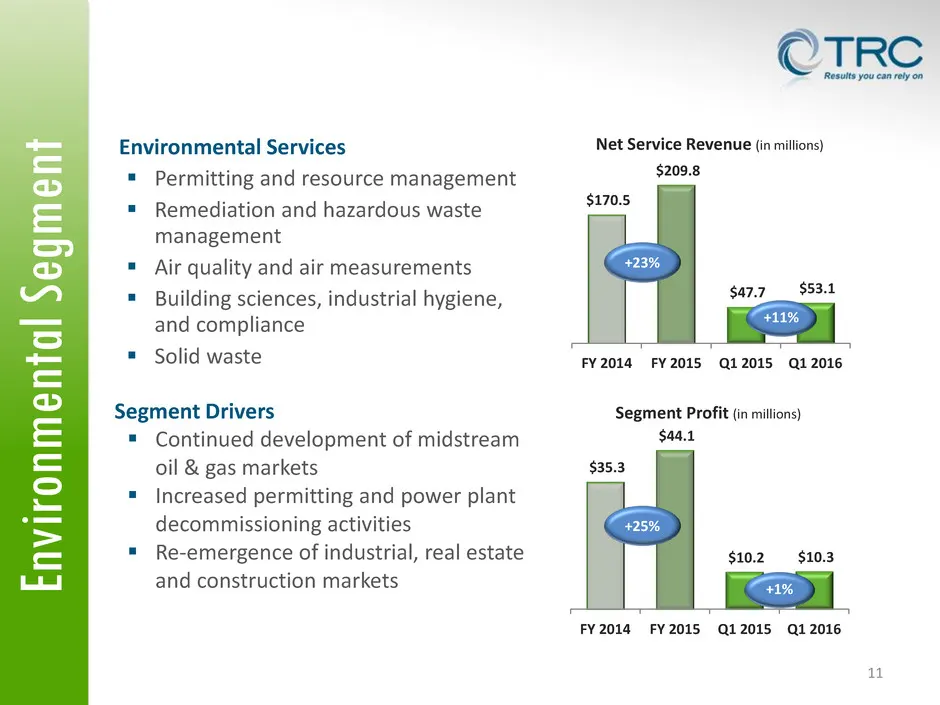
En vi ronmen tal S egmen t 11 Environmental Services Permitting and resource management Remediation and hazardous waste management Air quality and air measurements Building sciences, industrial hygiene, and compliance Solid waste Segment Drivers Continued development of midstream oil & g
Slide 12: Energy Segment
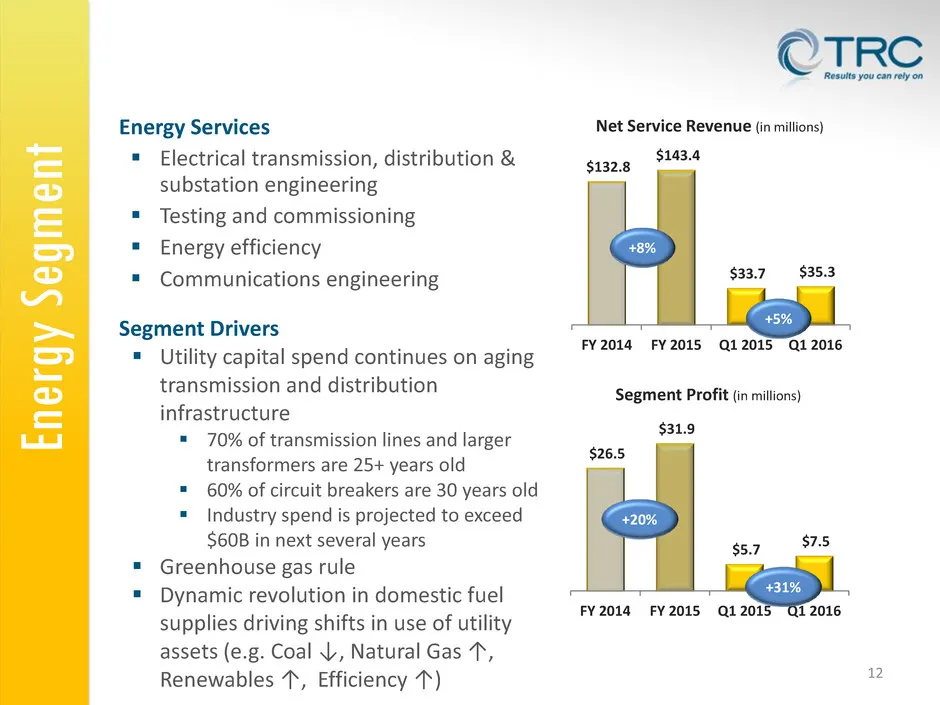
Ene rgy S egmen t 12 Energy Services Electrical transmission, distribution & substation engineering Testing and commissioning Energy efficiency Communications engineering Segment Drivers Utility capital spend continues on aging transmission and distribution infrastructure 70% of transmis
Slide 13: Infrastructure Segment
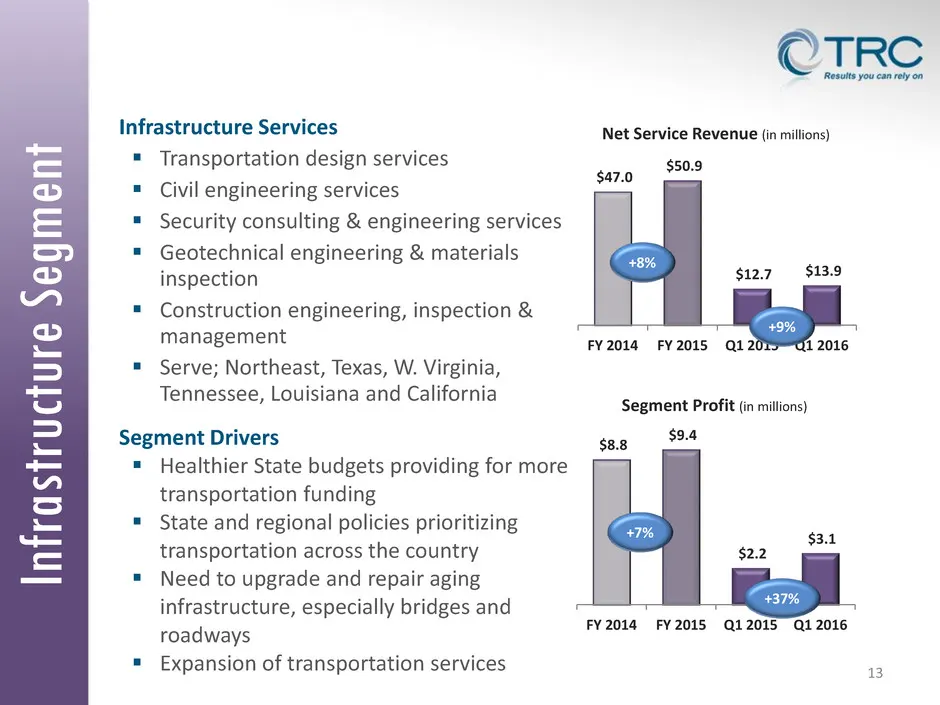
Inf rastruct ur e S egmen t Infrastructure Services Transportation design services Civil engineering services Security consulting & engineering services Geotechnical engineering & materials inspection Construction engineering, inspection & management Serve; Northeast, Texas, W. Virginia,
Slide 14: Growth Strategy
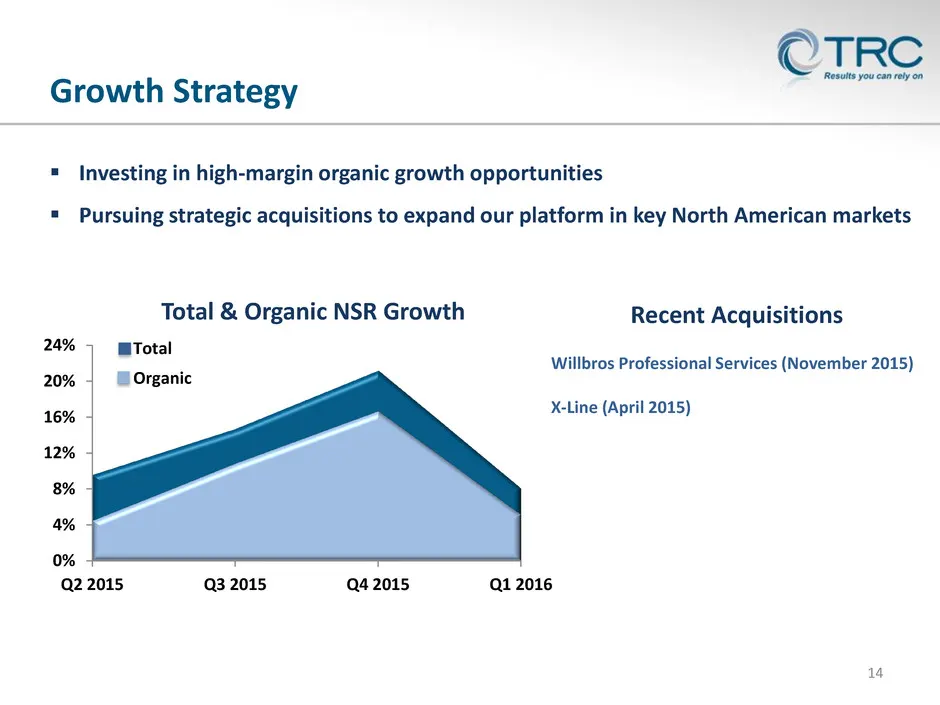
14 Growth Strategy 0% 4% 8% 12% 16% 20% 24% Q2 2015 Q3 2015 Q4 2015 Q1 2016 Total Organic Total & Organic NSR Growth Recent Acquisitions Willbros Professional Services (November 2015) X-Line (April 2015) Investing in high-margin organic growth opportunities Pursuing strategic acquisitions to exp
Slide 15: Macro Market Trends
Macro Market Trends 15 Market dynamics are in a slow roll with continued uncertainty in 2016 Shale development in 2016 is aligned with natural gas demand growth Foreign export is a major driver of natural gas with new demand in 2017 Integrity Verification Process (IVP) compliance spend proje
Slide 16: Willbros Professional Services
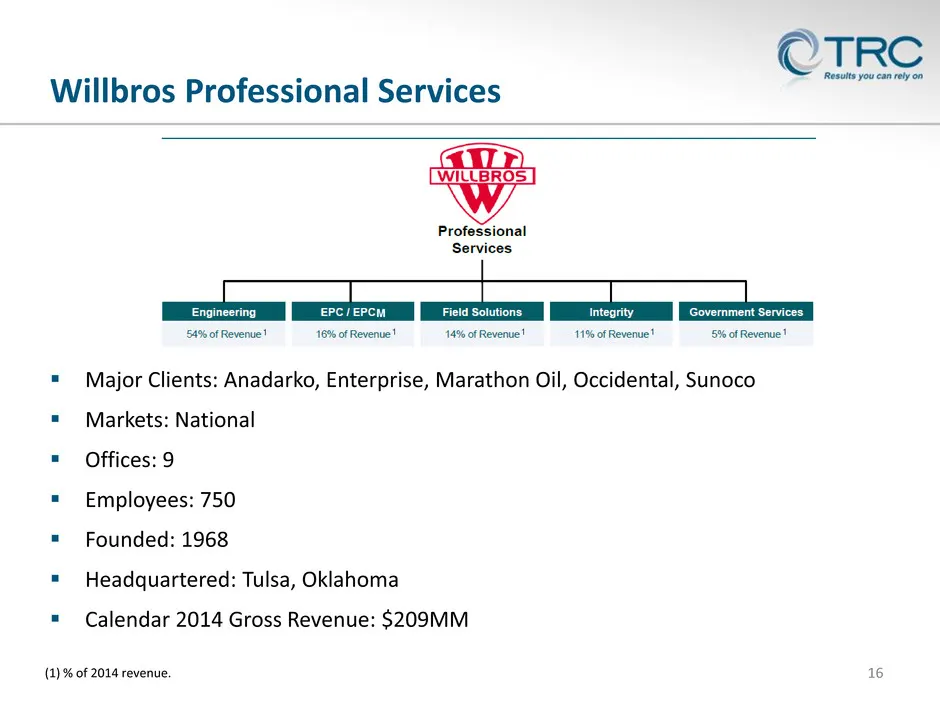
16 Willbros Professional Services Major Clients: Anadarko, Enterprise, Marathon Oil, Occidental, Sunoco Markets: National Offices: 9 Employees: 750 Founded: 1968 Headquartered: Tulsa, Oklahoma Calendar 2014 Gross Revenue: $209MM M 1 1 1 1 1 (1) % of 2014 revenue.
Slide 17: Willbros Transaction Highlights
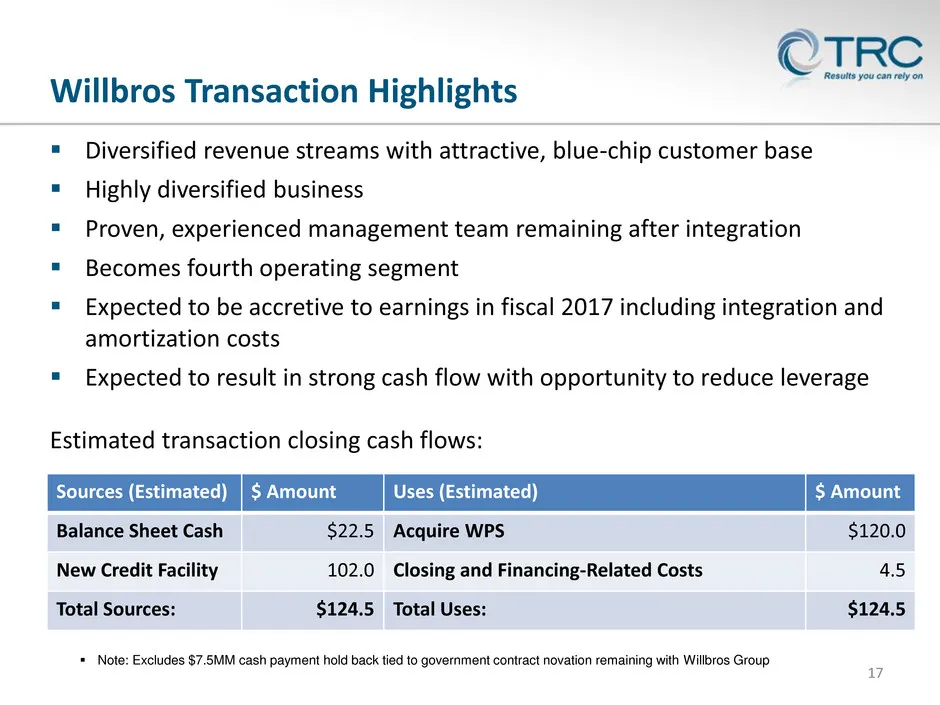
17 Willbros Transaction Highlights Sources (Estimated) $ Amount Uses (Estimated) $ Amount Balance Sheet Cash $22.5 Acquire WPS $120.0 New Credit Facility 102.0 Closing and Financing-Related Costs 4.5 Total Sources: $124.5 Total Uses: $124.5 Diversified revenue streams with attractive, blue-chip cu
Slide 18: Business Synergy - End to End Solutions
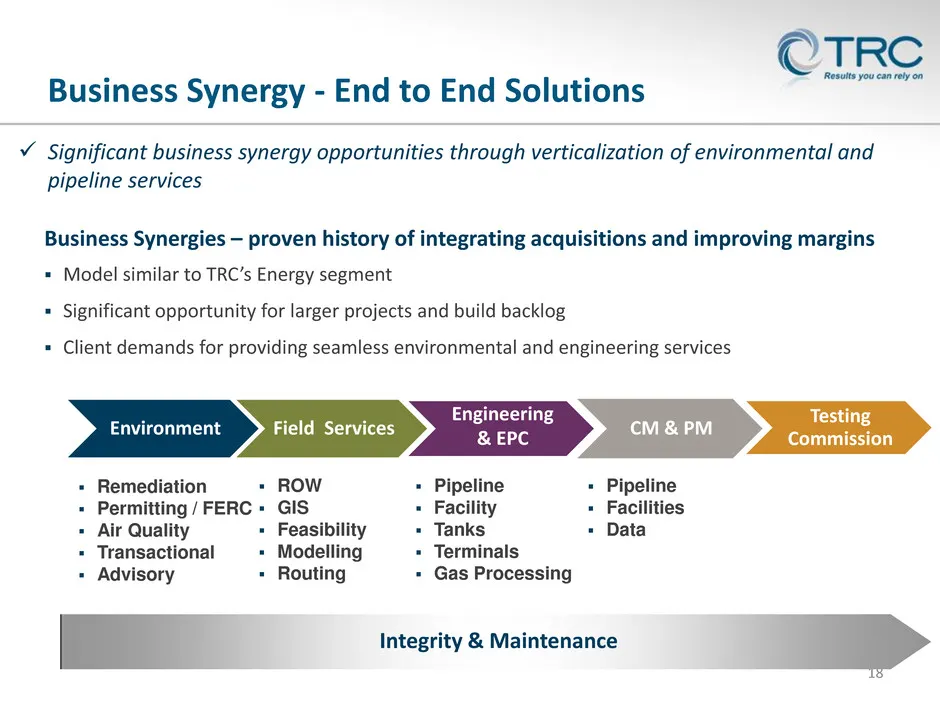
Business Synergy - End to End Solutions 18 Environment Field Services Engineering & EPC CM & PM Testing Commission Integrity & Maintenance Significant business synergy opportunities through verticalization of environmental and pipeline services Business Synergies – proven history of integrating ac
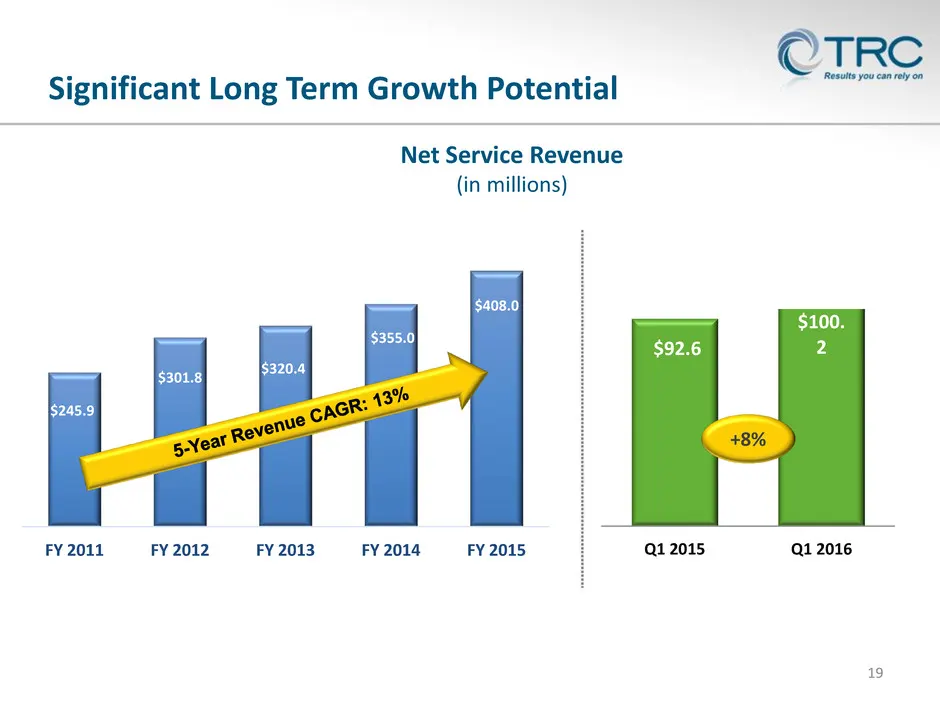
Slide 19: Net Service Revenue Growth
19 $92.6 $100. 2 Q1 2015 Q1 2016 Net Service Revenue (in millions) Significant Long Term Growth Potential +8% $245.9 $301.8 $320.4 $355.0 $408.0 FY 2011 FY 2012 FY 2013 FY 2014 FY 2015
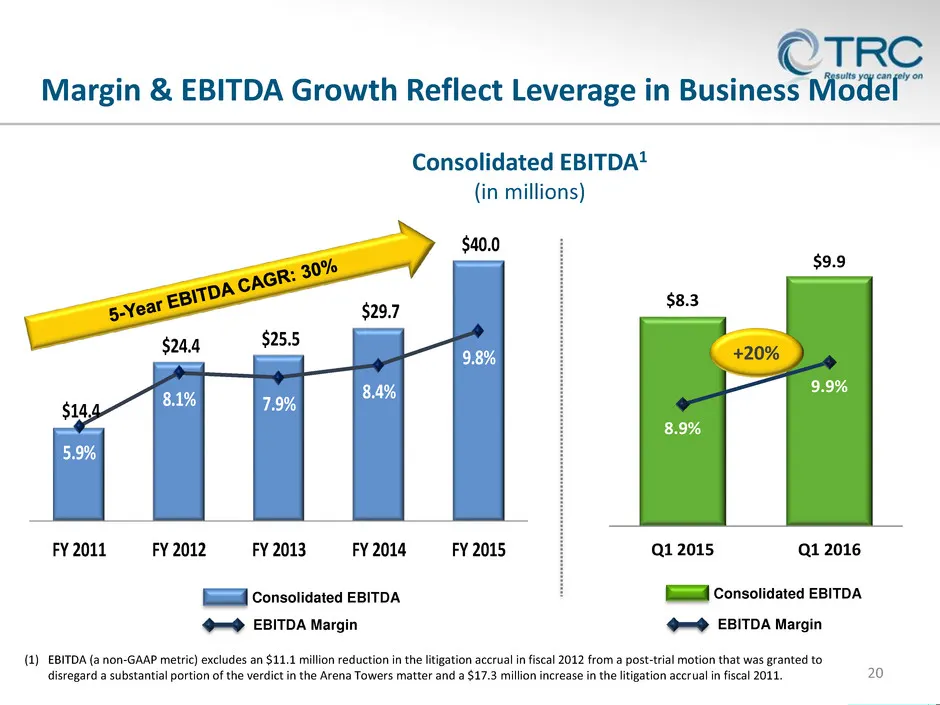
Slide 20: Margin & EBITDA Growth Reflect Leverage in Business Model
$14.4 $24.4 $25.5 $29.7 $40.0 5.9% 8.1% 7.9% 8.4% 9.8% FY 2011 FY 2012 FY 2013 FY 2014 FY 2015 Margin & EBITDA Growth Reflect Leverage in Business Model 20 Consolidated EBITDA (1) EBITDA (a non-GAAP metric) excludes an $11.1 million reduction in the litigation accrual in fiscal 2012 from a post-tria
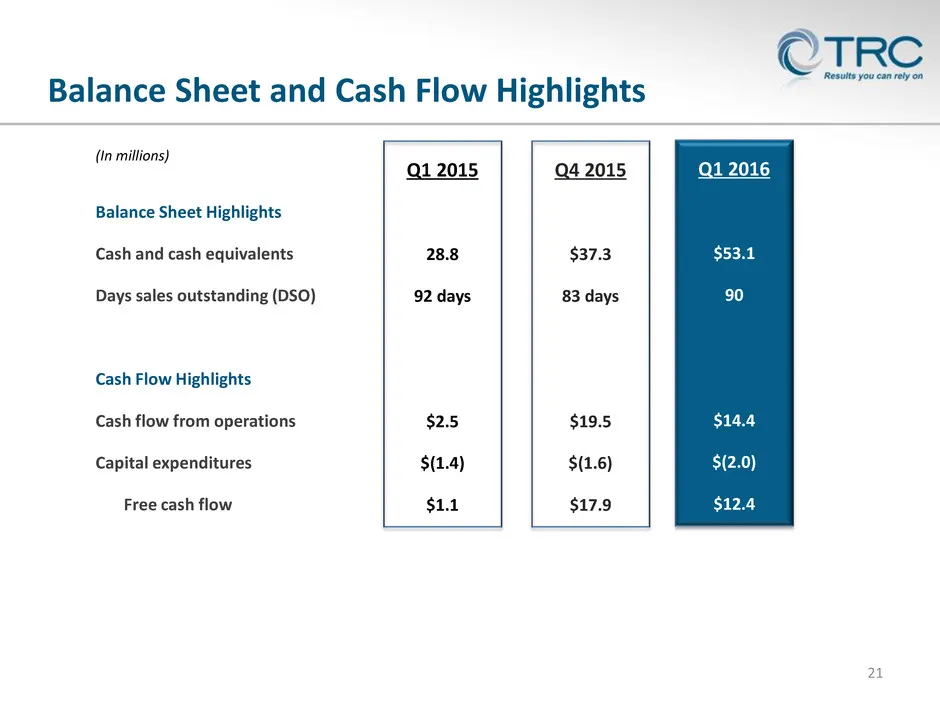
Slide 21: Balance Sheet and Cash Flow Highlights
Q1 2015 28.8 92 days $2.5 $(1.4) $1.1 21 Balance Sheet Highlights Cash and cash equivalents Days sales outstanding (DSO) Cash Flow Highlights Cash flow from operations Capital expenditures Free cash flow Q4 2015 $37.3 83 days $19.5 $(1.6) $17.9 Q1 2016 $53.1 90 $14.4 $(2.0) $12.4 (In millions) Balan
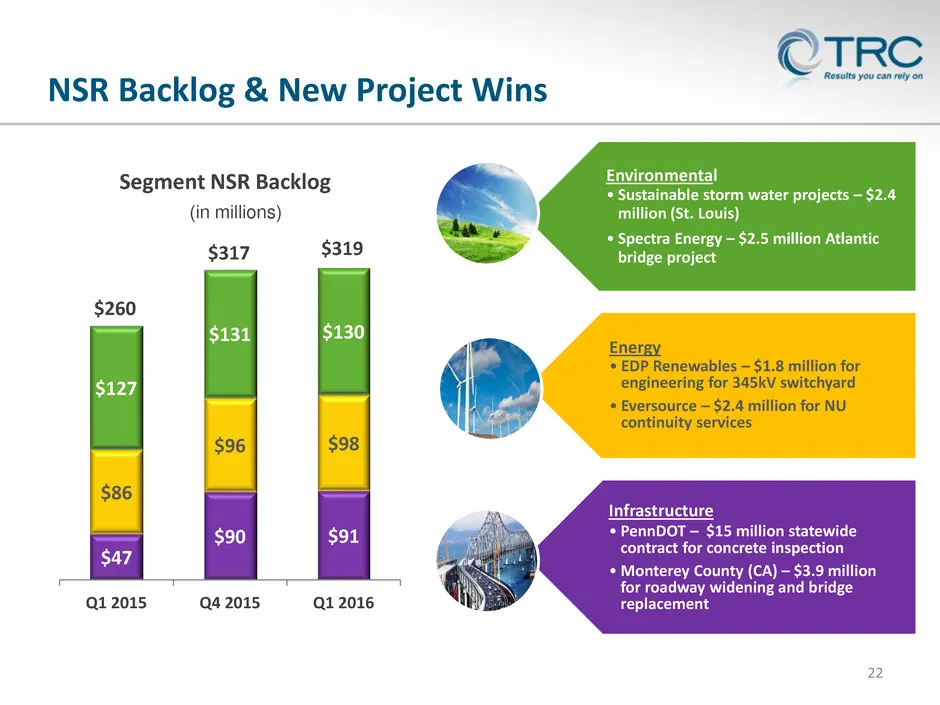
Slide 22: NSR Backlog & New Project Wins
$47 $90 $91 $86 $96 $98 $127 $131 $130 Q1 2015 Q4 2015 Q1 2016 Segment NSR Backlog $319 NSR Backlog & New Project Wins 22 (in millions) $260 $317 Energy • EDP Renewables – $1.8 million for engineering for 345kV switchyard • Eversource – $2.4 million for NU continuity services Environmental • Sustain
Slide 23: Key Initiatives
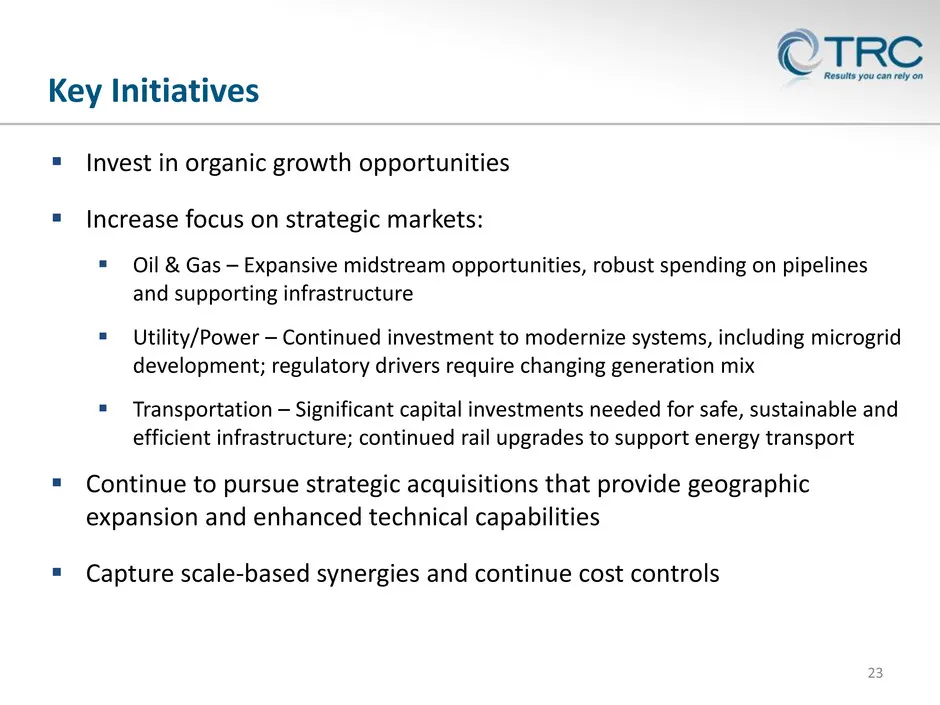
Key Initiatives 23 Invest in organic growth opportunities Increase focus on strategic markets: Oil & Gas – Expansive midstream opportunities, robust spending on pipelines and supporting infrastructure Utility/Power – Continued investment to modernize systems, including microgrid development;
Slide 24: Investment Highlights
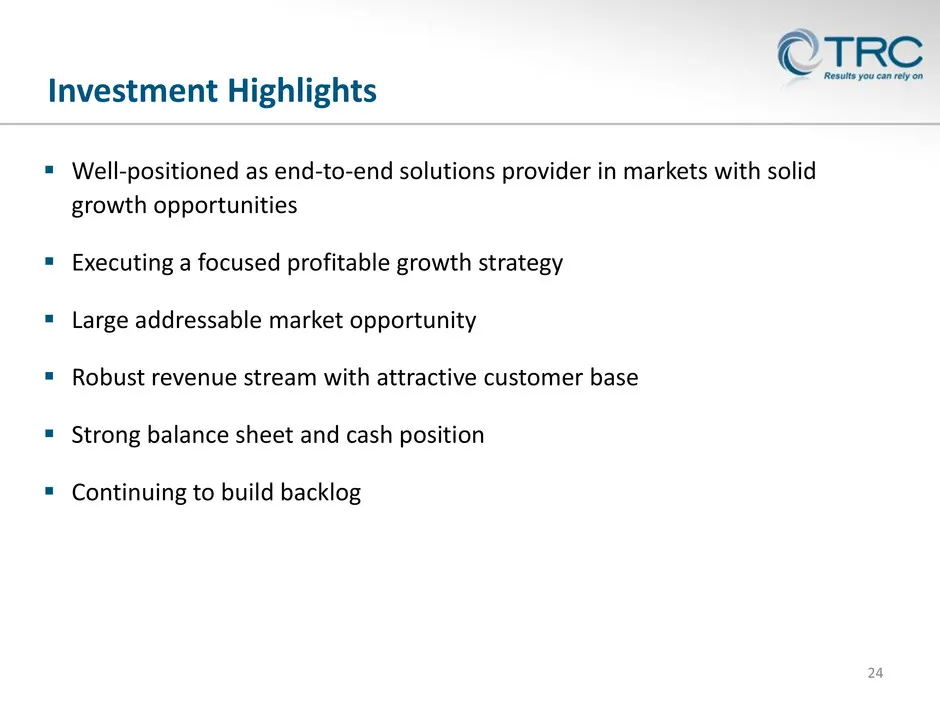
Investment Highlights 24 Well-positioned as end-to-end solutions provider in markets with solid growth opportunities Executing a focused profitable growth strategy Large addressable market opportunity Robust revenue stream with attractive customer base Strong balance sheet and cash positio

Slide 25: Appendix
25 Appendix
Slide 26: Full Year Income Statement Highlights
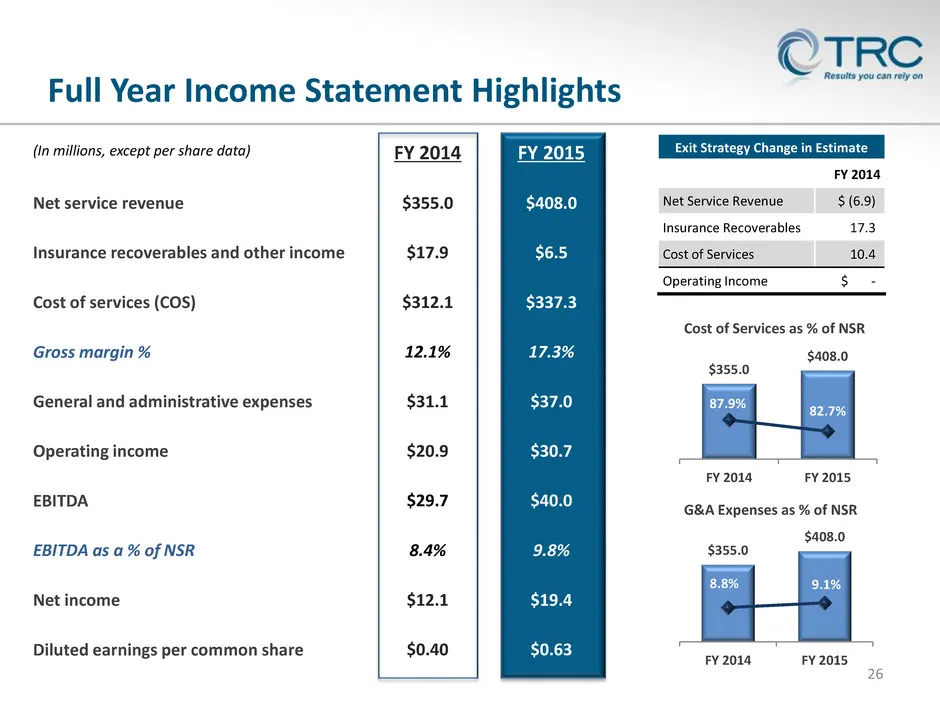
FY 2014 $355.0 $17.9 $312.1 12.1% $31.1 $20.9 $29.7 8.4% $12.1 $0.40 FY 2015 $408.0 $6.5 $337.3 17.3% $37.0 $30.7 $40.0 9.8% $19.4 $0.63 26 (In millions, except per share data) Full Year Income Statement Highlights $355.0 $408.0 87.9% 82.7% FY 2014 FY 2015 Cost of Services as % of NSR $355.0 $408.0
Slide 27: Quarterly Income Statement Highlights
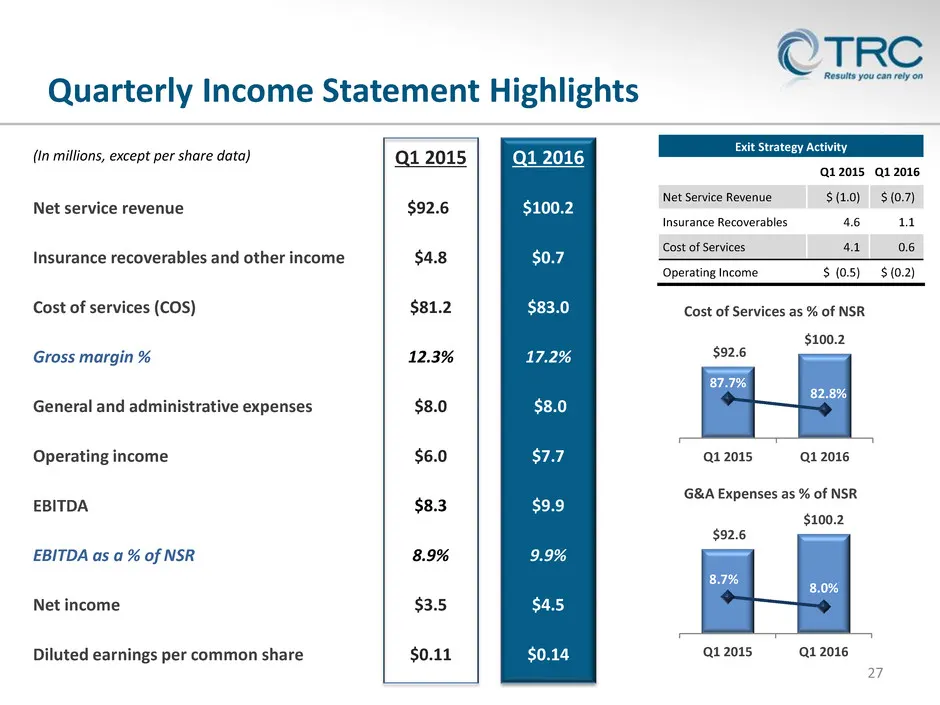
Q1 2016 $100.2 $0.7 $83.0 17.2% $8.0 $7.7 $9.9 9.9% $4.5 $0.14 Q1 2015 $92.6 $4.8 $81.2 12.3% $8.0 $6.0 $8.3 8.9% $3.5 $0.11 27 (In millions, except per share data) Quarterly Income Statement Highlights $92.6 $100.2 87.7% 82.8% Q1 2015 Q1 2016 Cost of Services as % of NSR $92.6 $100.2 8.7% 8.0% Q1 2
Slide 28: Reconciliation of Non-GAAP Measures
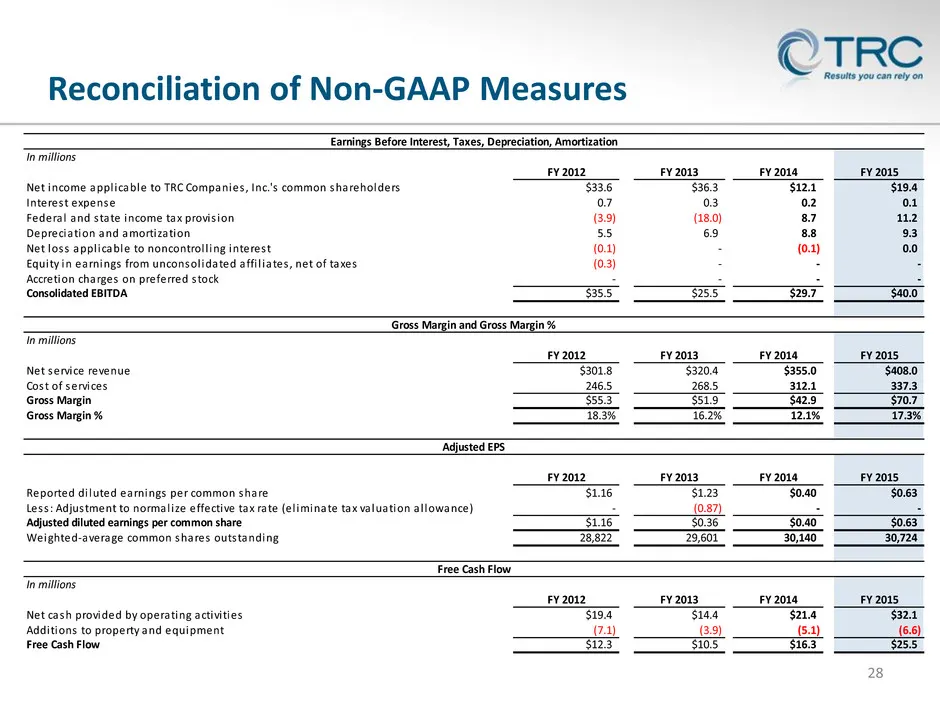
Reconciliation of Non-GAAP Measures 28 In millions FY 2012 FY 2013 FY 2014 FY 2015 Net income appl icable to TRC Companies , Inc.'s common shareholders $33.6 $36.3 $12.1 $19.4 Interest expense 0.7 0.3 0.2 0.1 Federal and s tate income tax provis ion (3.9) (18.0) 8.7 11.2 Depreciation and amortizatio
Slide 29: Reconciliation of Non-GAAP Measures
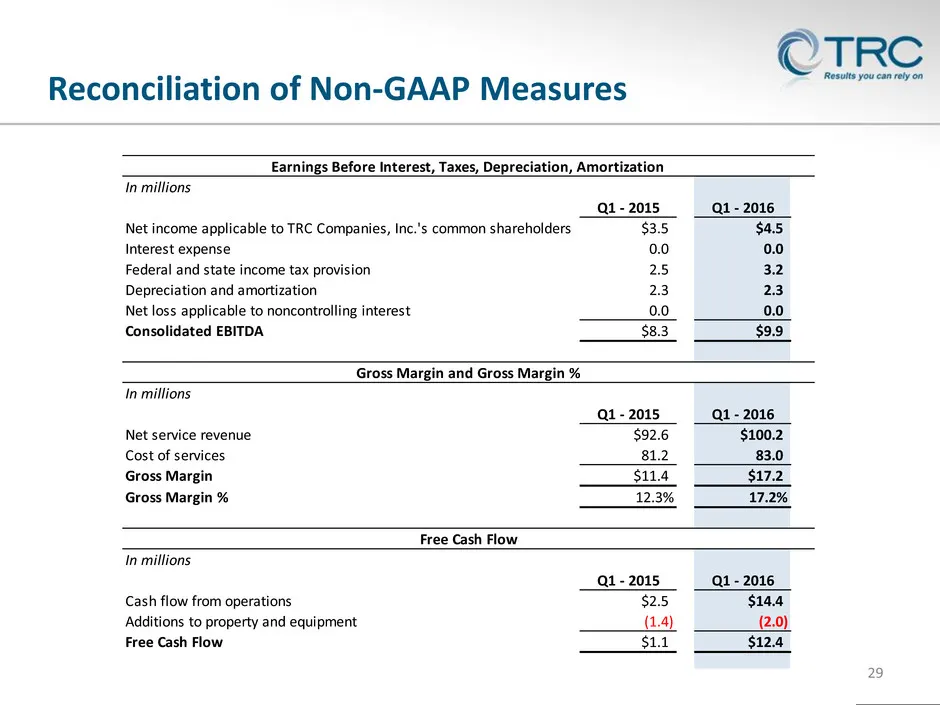
Reconciliation of Non-GAAP Measures 29 In millions Q1 - 2015 Q1 - 2016 Net income applicable to TRC Companies, Inc.'s common shareholders $3.5 $4.5 Interest expense 0.0 0.0 Federal and state income tax provision 2.5 3.2 Depreciation and amortization 2.3 2.3 Net loss applicable to noncontrolling inte
Slide 30: Definitions for Non-GAAP Measures
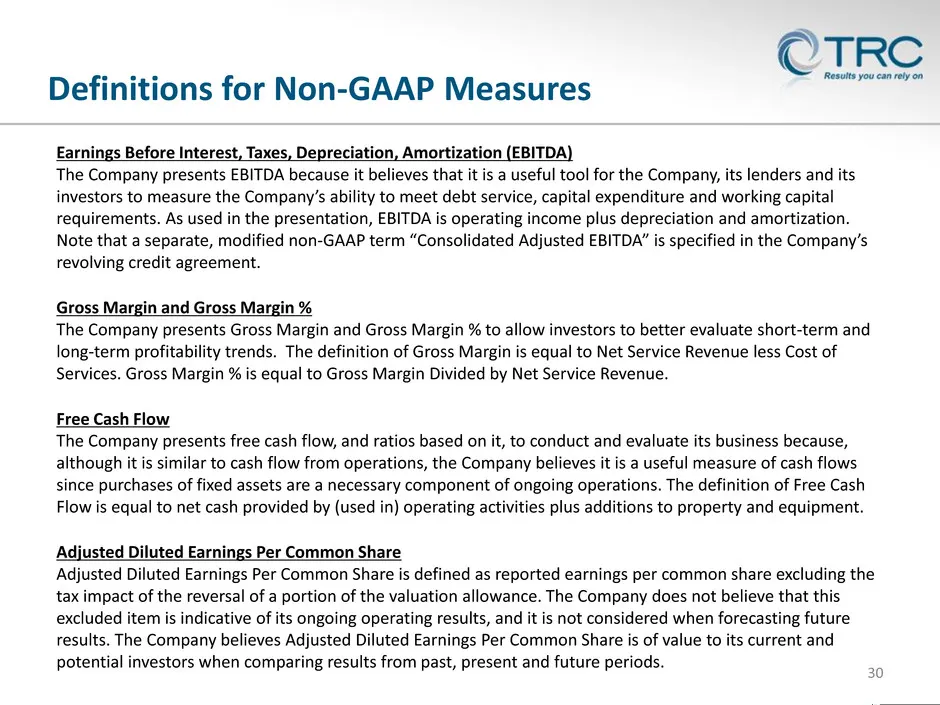
Definitions for Non-GAAP Measures 30 Earnings Before Interest, Taxes, Depreciation, Amortization (EBITDA) The Company presents EBITDA because it believes that it is a useful tool for the Company, its lenders and its investors to measure the Company’s ability to meet debt service, capital expenditure
Source: SEC EDGAR · 8-K filed Jan 19, 2016