Omnicare — J.P. Morgan Healthcare Conference 2014
40 slides from Omnicare's conference presentation, Jan 14, 2014

Slide 1: Omnicare
Omnicare
Slide 2: Forward-Looking Statements
Forward-Looking Statements Certain of the statements made today and listed within ji ion slides are f rd-looki ‘statements within the meaning of the Private Securities Litigation Reform Act of 1995. These forward-| looking statements include, but: are not limited to, all statements regarding the int
Slide 3: John Workman, Chief Executive Officer
John Workman Wy e ane Omnicare Chief Executive Officer

Slide 4: Omnicare Overview
Wy ome Omnicare Overview
Slide 5: Long-Term Care Group
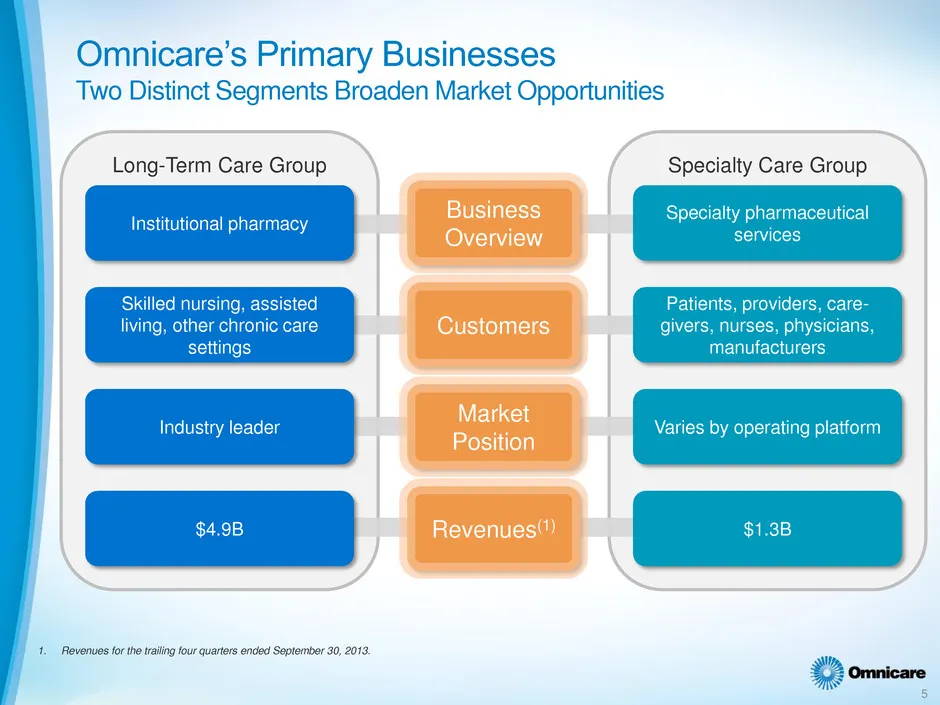
Long-Term Care Group Business Overview Customers SE Market Position Revenues") SE Nee 1. Revenues fo the trailing four quarters ended September 30, 2019, Specialty Care Group
Slide 6: Omnicare's Primary Businesses
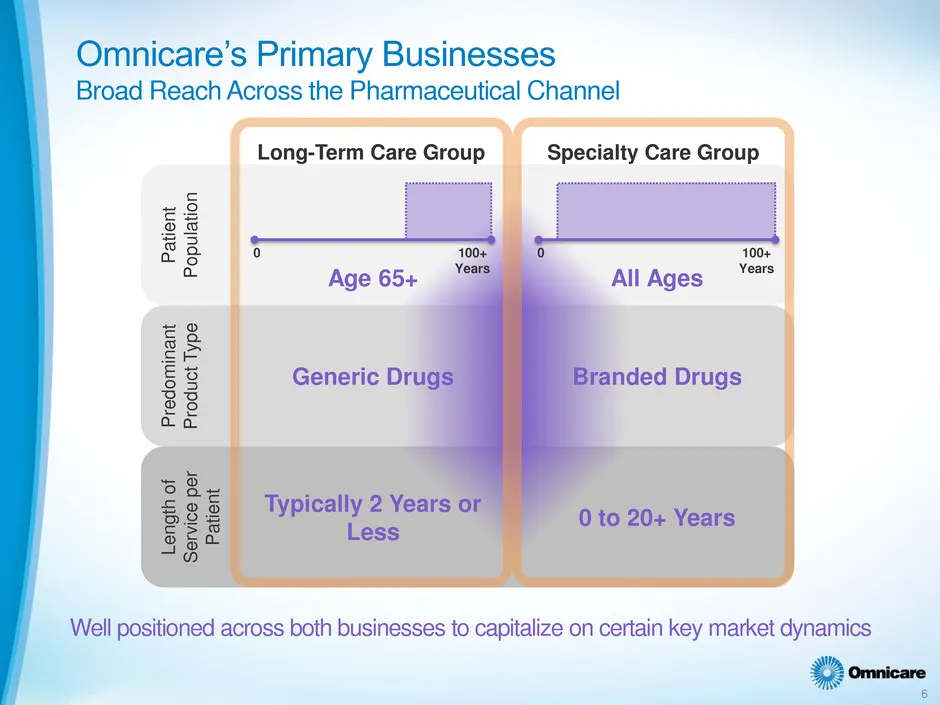
| Omnicare’s Primary Businesses Broad Reach Across the Pharmaceutical Channel Long-Term Care Group Specialty Care Group Patient Population tor 0 100 Ye Ye Age 65+ ——- AllAges “** Generic Drugs Branded Drugs Predominant Product Type Typically 2 Years or 0 to 20+ Years Less Length of Service per Patie

Slide 7: Omnicare Market Dynamics
RNY ly, J jq¢ Omnicare Market Dynamics
Slide 8: Market Dynamics — Long-Term Care
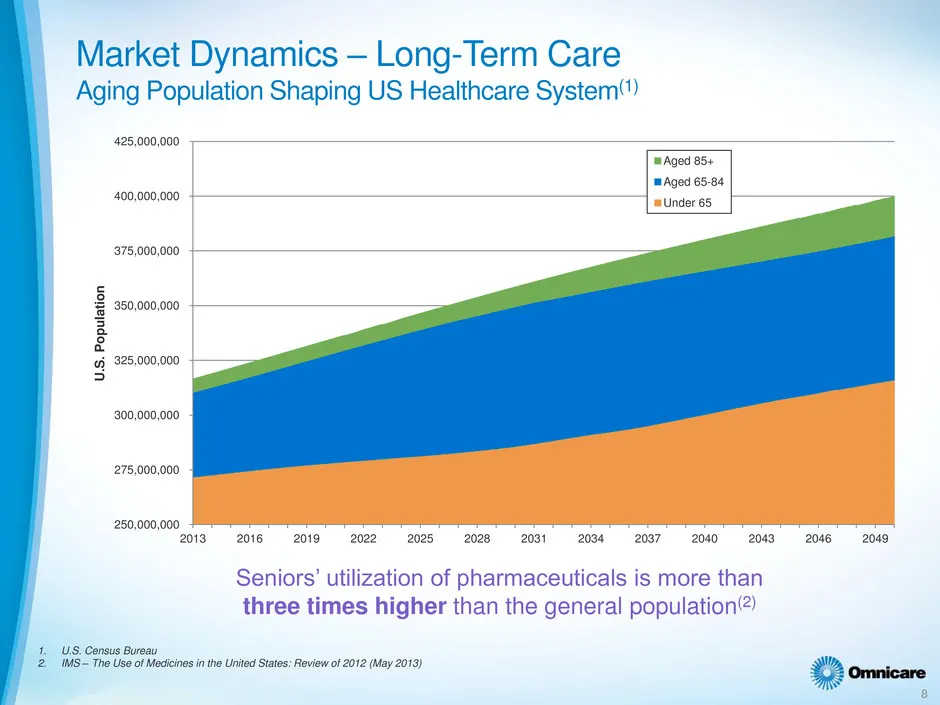
Market Dynamics — Long-Term Care Aging Population Shaping US Healthcare System") 425,000,000 400,000,000 375,000,000 350,000,000 U.S. Population 325,000,000 300,000,000 275,000,000 250,000,000 2013-2016 += 2019-2022 «2025 ©2028-2031 2034 «= 2037 «2040 204320462049 Seniors’ utilization of pharmaceuti
Slide 9: Market Dynamics — Long-Term Care
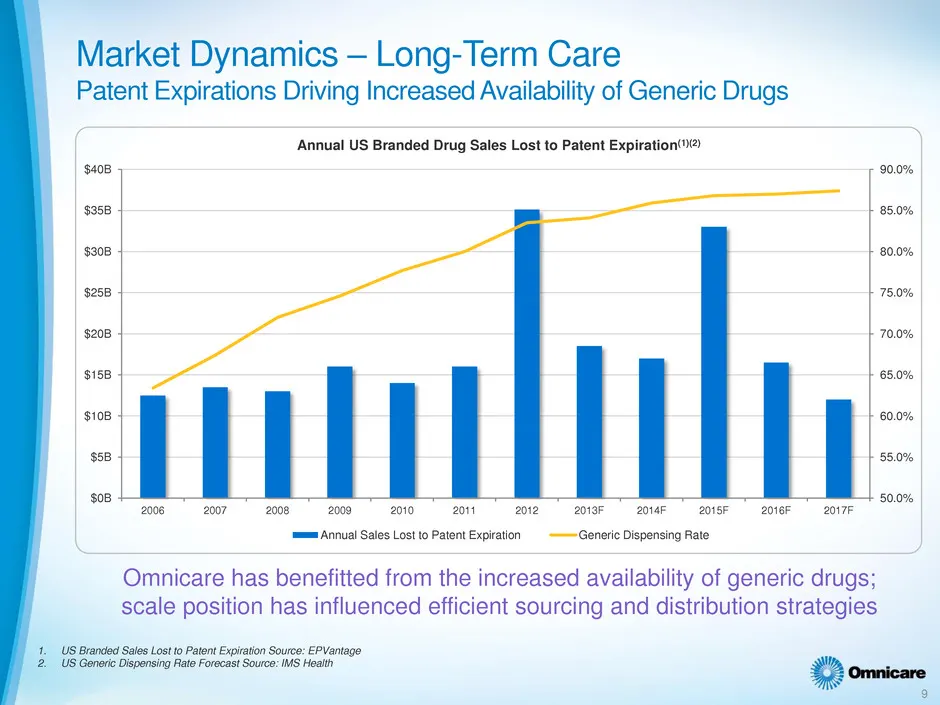
Market Dynamics — Long-Term Care Patent Expirations Driving Increased Availability of Generic Drugs Annual ‘$408 90.0% $358 85.0% $308 80.0% $258 75.0% | || szo8 70.0% $158 65.0% ‘$108 60.0% $5B 55.0% ‘$0B 50.0% ee ed Omnicare has benefitted from the increased availability of generic drugs; scale po
Slide 10: Market Dynamics
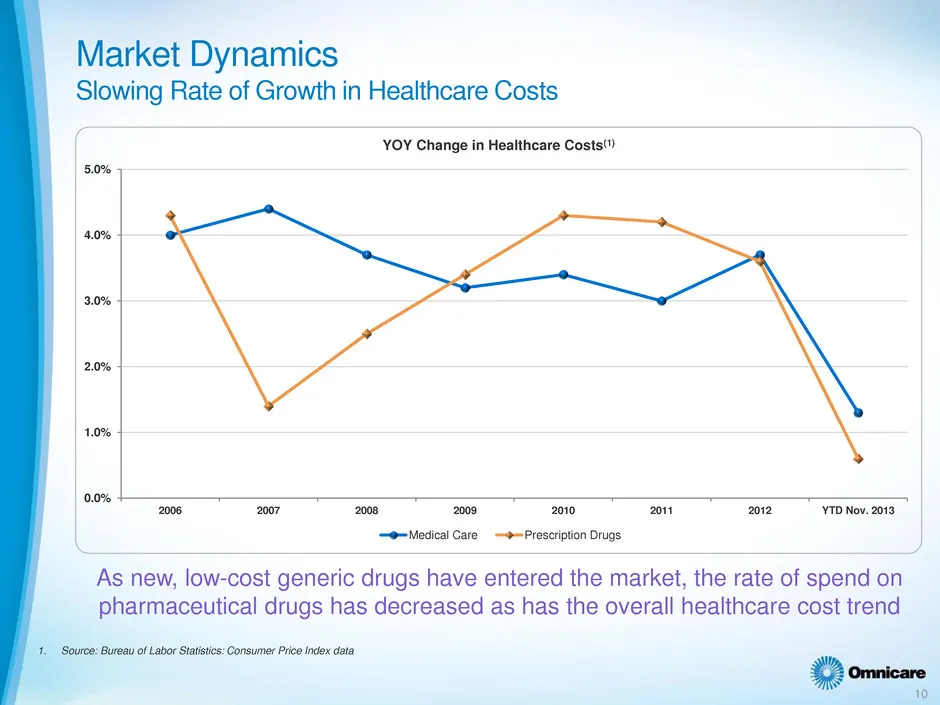
Market Dynamics Slowing Rate of Growth in Healthcare Costs YOY Change in Healthcare Costs" : 5.0% 4.0% | 3.0% | | (| 20% i 1.0% 0.0% 2006 2007 2008 2009 2010 zon 2012” YTD Nov. 2013 eMedical Care —#-Prescripion Drugs AS new, low- cost generic drugs have entered the market, the rate of spend on al dr
Slide 11: Market Dynamics — Specialty Care
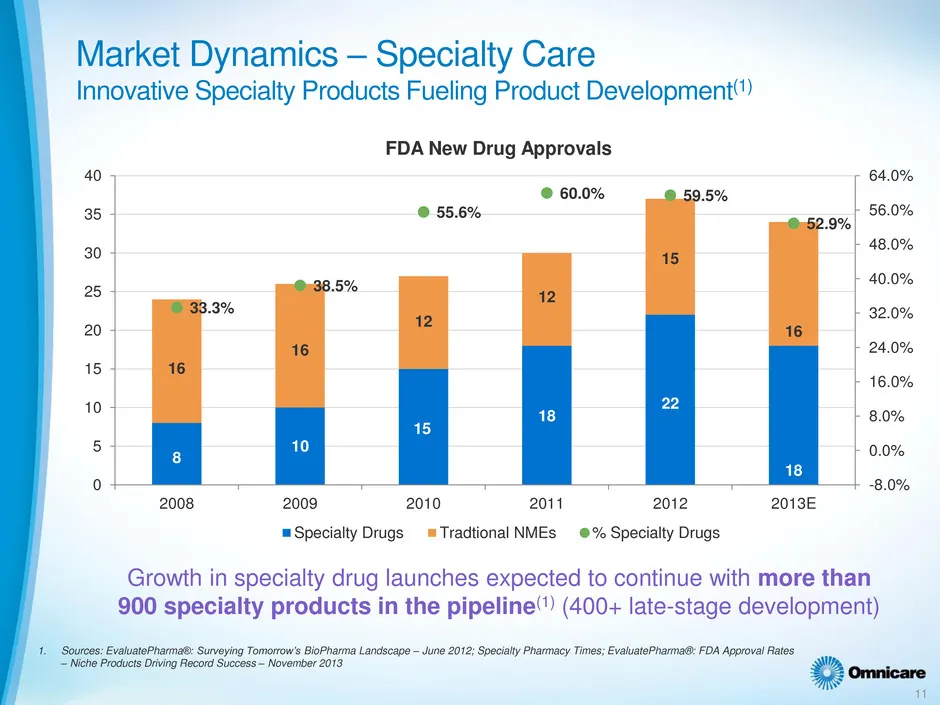
Market Dynamics — Specialty Care Innovative Specialty Products Fueling Product Development’) FDA New Drug Approvals 64.0% @ 60.0% 9.5% 56.0% @ 55.6% 48.0% 40.0% 32.0% 24.0% 16.0% 8.0% 0.0% “8.0% 2008 2009 2010 2011 2012 2013E = Specialty Drugs = Tradtional NMEs © % Specialty Drugs Growth in specialt
Slide 12: Market Dynamics — Specialty Care
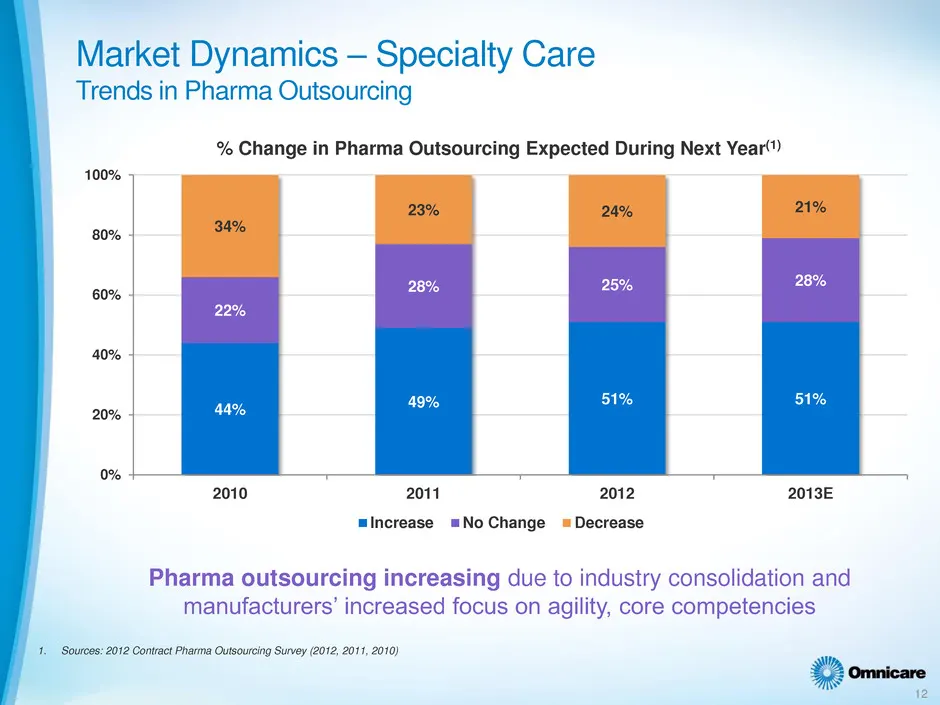
Market Dynamics — Specialty Care Trends in Pharma Outsourcing 100% % Change in Pharma Outsourcing Expected During Next Year“) 22% 2010 2011 2012 2013E uIncrease =No Change «Decrease Pharma outsourcing increasing due to industry consolidation and manufacturers’ increased focus on agility, core compet

Slide 13: Omnicare's Evolution
Wy “yg; Omnicare Omnicare’s Evolution
Slide 14: Omnicare's Evolution
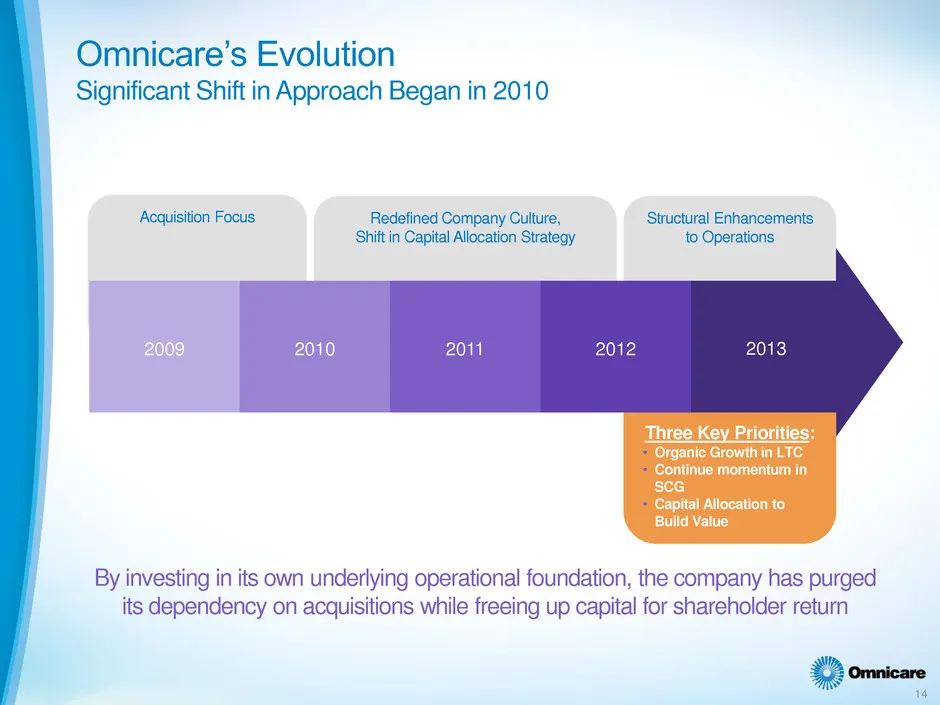
Omnicare’s Evolution Significant Shift in Approach Began in 2010 Acquisition Focus Redefined Company Culture, ‘Structural Enhancements Shift in Capital Allocation Strategy ratio Three Key Pi S: ‘Organic Growth Ga ntinue momentu =e Allocation to Build Value By investing in its own underlying operatio
Slide 15: Focus on Three Priorities — Retrospective Review
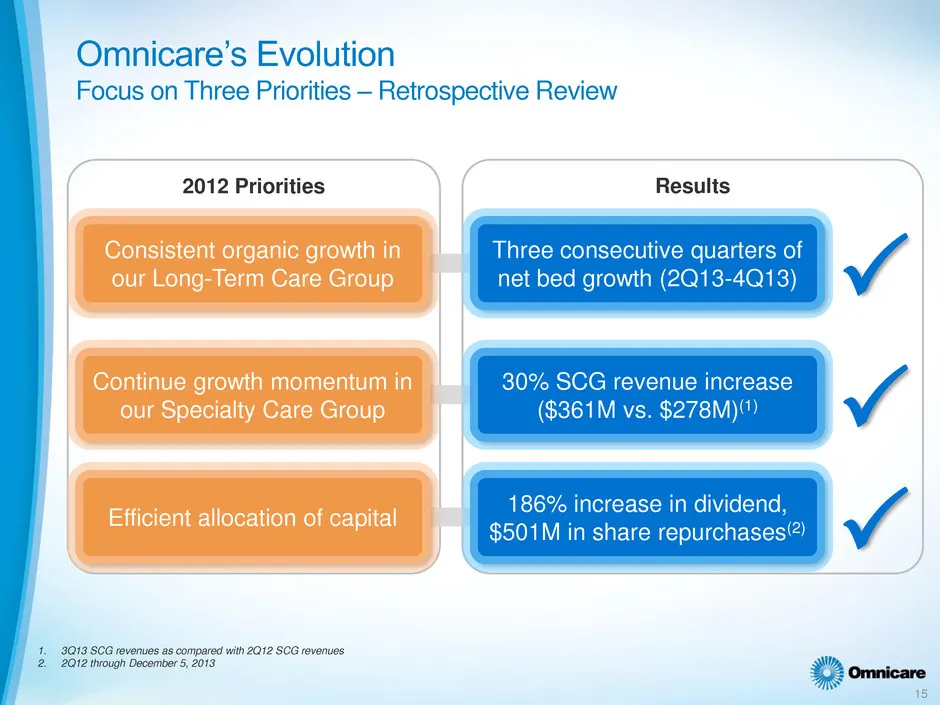
Omnicare’s Evolution Focus on Three Priorities — Retrospective Review 2012 Priorities Results Consistent organic growth in Three consecutive quarters of our Long-Term Care Group net bed growth (2Q13-4Q13) Continue growth momentum in 30% SCG revenue increase our Specialty Care Group ($361M vs. $278M)
Slide 16: Cash-Based EPS More Reflective of Robust Cash Flows
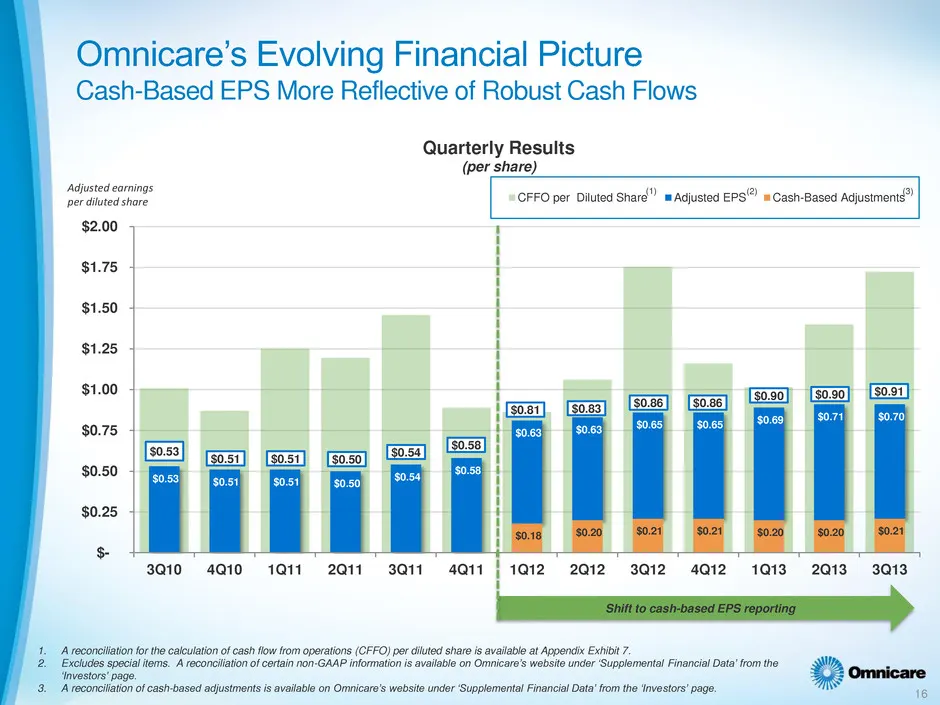
Omnicare’s Evolving Financial Picture Cash-Based EPS More Reflective of Robust Cash Flows Quarterly Results (per share) ‘Adjusted earnings 4 per dlvted shore ‘= CFFO per Diluted Shard” mAdjusted EPS” = Cash-Based Adjustments” 4Q10 111 211-311 4Q11 | 1012-212 3Q12_ 412-1413 2Q13_-3Q13. g ae fects roe
Slide 17: Shift in Strategy Toward Allocating Capital
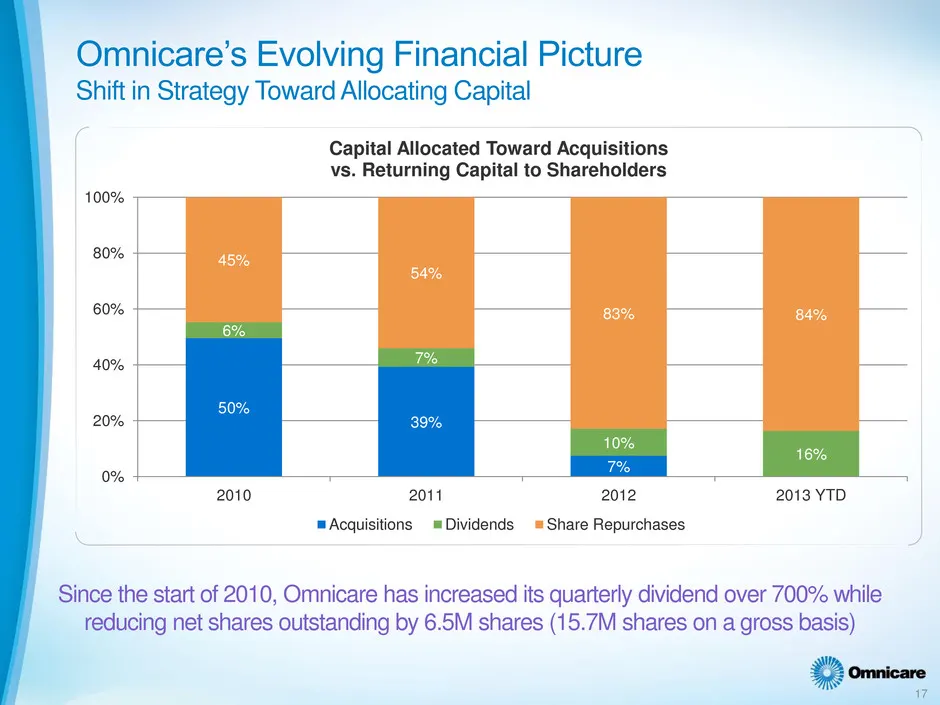
Omnicare’s Evolving Financial Picture Shift in Strategy Toward Allocating Capital Capital Allocated Toward Acquisitions vs. Returning Capital to Shareholders 2010 2011 2012 2013 YTD "Acquisitions = Dividends = Share Repurchases Since the start of 2010, Omnicare has increased its quarterly dividend o
Slide 18: Improving Return on Equity (ROE)
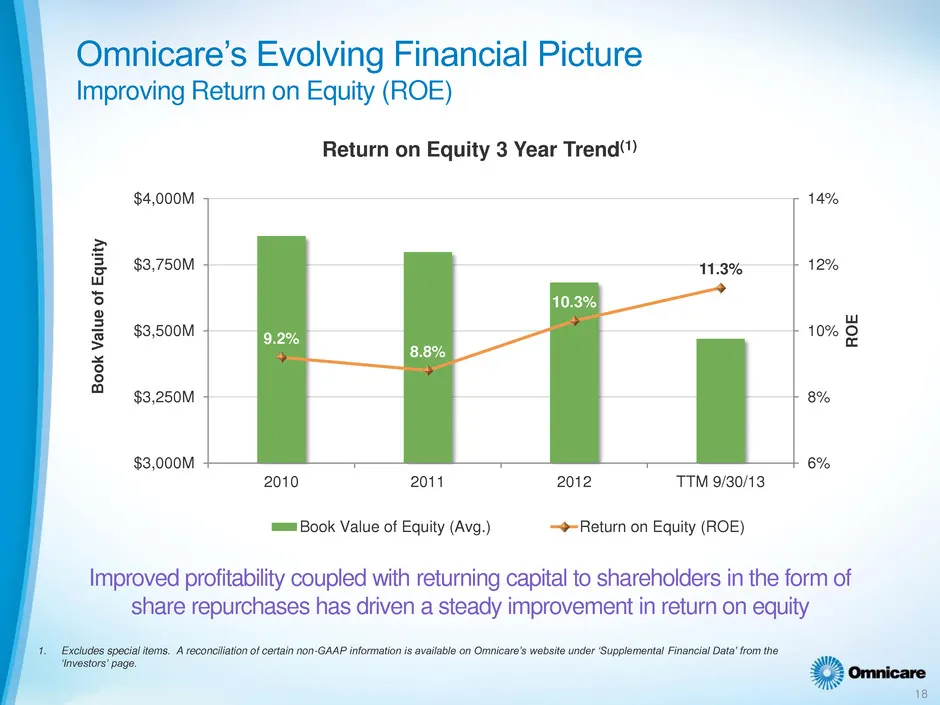
Omnicare’s Evolving Financial Picture Improving Return on Equity (ROE) Return on Equity 3 Year Trend“) $4,000M 14% 2 2 $3,750M 12% a 3. g 3 we = $3,500M 10% 9 & S a $3,250M 8% $3,000M 2010 2011 2012 TT™M 9/30/13 mmm Book Value of Equity (Avg.) —@ Return on Equity (ROE) Improved profitability coupled
Slide 19: Outpaced Growth from Specialty Care Group
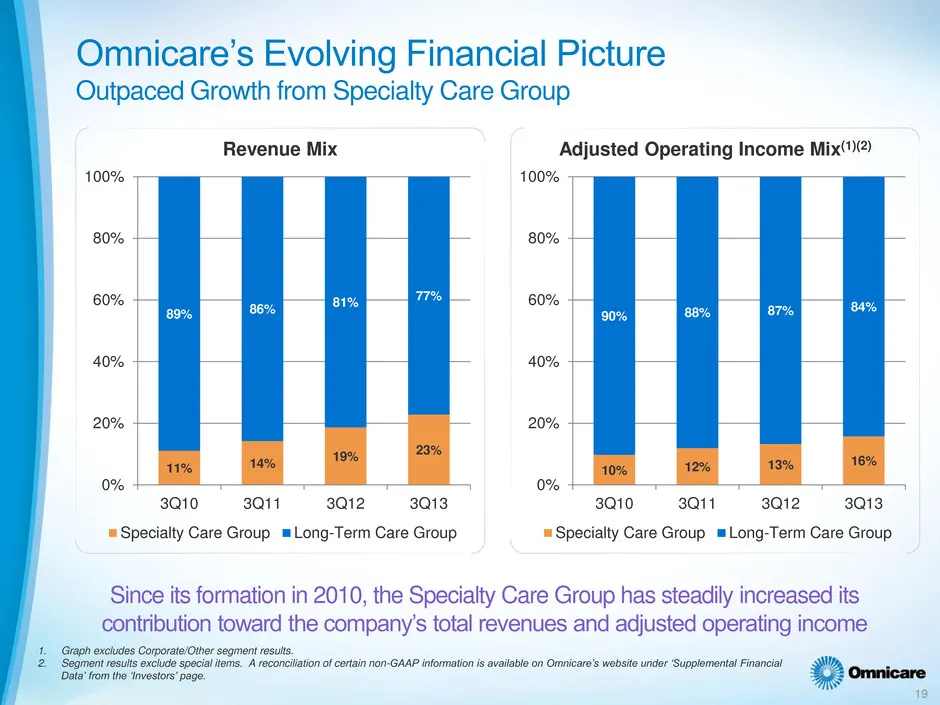
Omnicare’s Evolving Financial Picture Outpaced Growth from Specialty Care Group Revenue Mix Adjusted Operating Income Mix()@) 100% 100% 80% 80% 60% 60% 40% 20% 20% 0% 0% 3Q10 3Q11 3Q12 3Q13 = Specialty Care Group = Long-Term Care Group 3Q10 3Qtt 3Q12 = Specialty Care Group = Long-Term Care Group 3Q1

Slide 20: Nitin Sahney, President & Chief Operating Officer
Nitin Sahney Wy e ane Omnicare President & Chief Operating Officer
Slide 21: Operational Repositioning
RNY ly, “yg; Omnicare Operational Repositioning
Slide 22: Multi-Phased Operating Plan
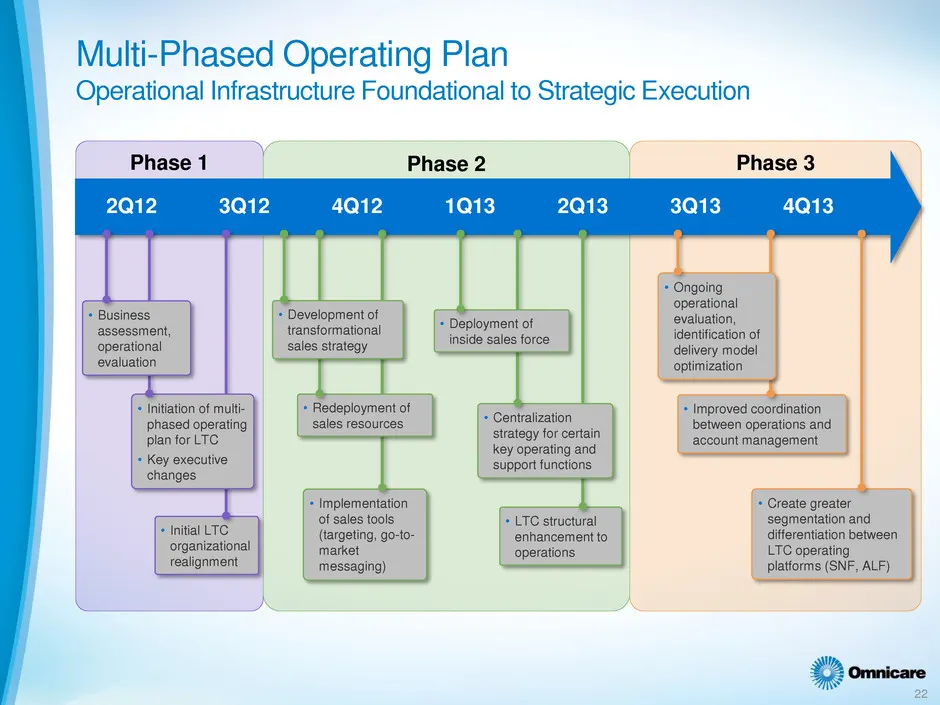
Multi-Phased Operating Plan Operational Infrastructure Foundational to Strategic Execution a ” P Phase 1 | Phase 2 Phase 3 2Q12 3Q12 4Q12 1Q13 2013 3Q13 4Q13 + Development of transformational eee les strategy por for te. strategy for certain + Improved coordination ions and ‘account management suppo
Slide 23: Improved Selling Effectiveness in Long-Term Care
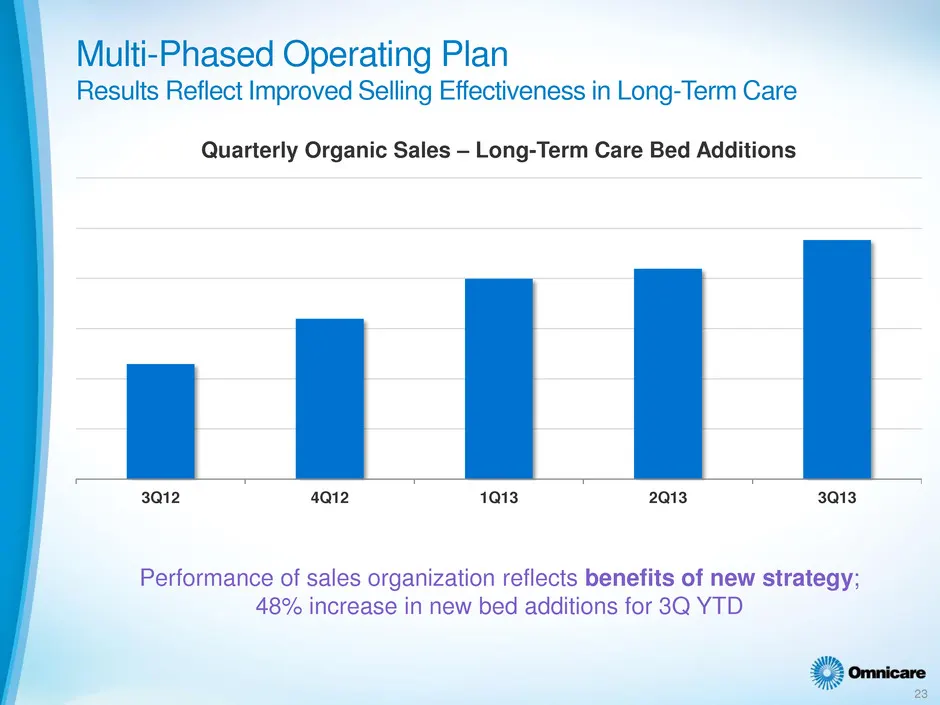
Multi-Phased Operating Plan Results Reflect Improved Selling Effectiveness in Long-Term Care Quarterly Organic Sales — Long-T Care Bed Performance of sales organization reflects benefits of new strategy; 48% increase in new bed additions for 3Q YTD 2 omnicare 23
Slide 24: Long-Term Care Customer Experience Improving
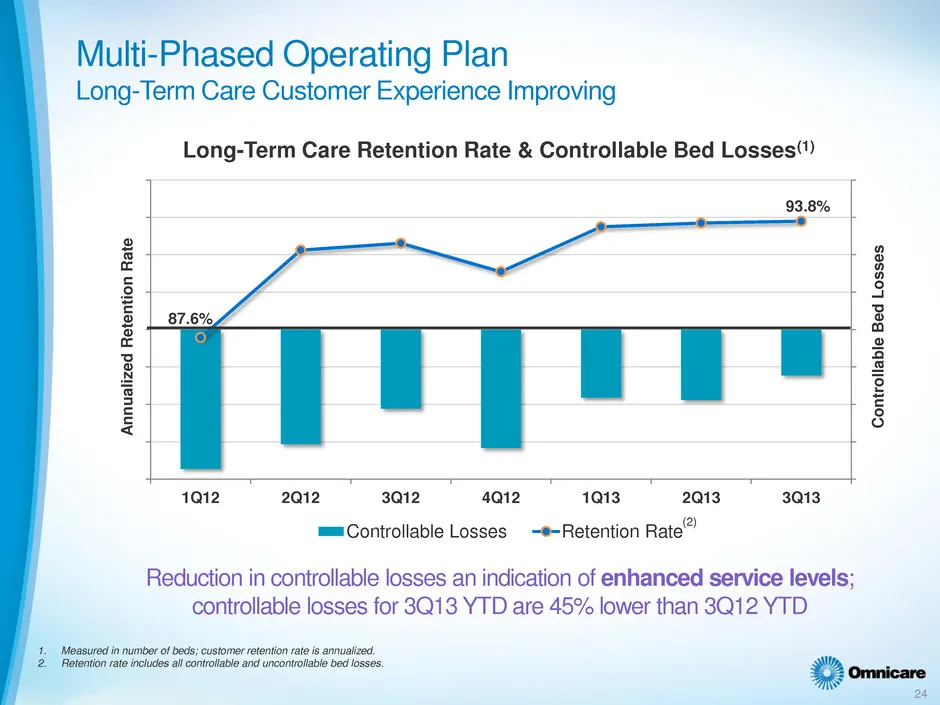
Multi-Phased Operating Plan Long-Term Care Customer Experience Improving Annualized Retention Rate Long-Term Care ‘ion Rate & C Bed Losses“) 93.8% Controllable Bed Losses 1Q12 2Q12 3Q12 4Q12 1013 2013 3Q13 ==Controllable Losses -®-Retention Rate” Reduction in controllable losses an indication of enh
Slide 25: Pathway to Achieving Sustainable Volume Growth
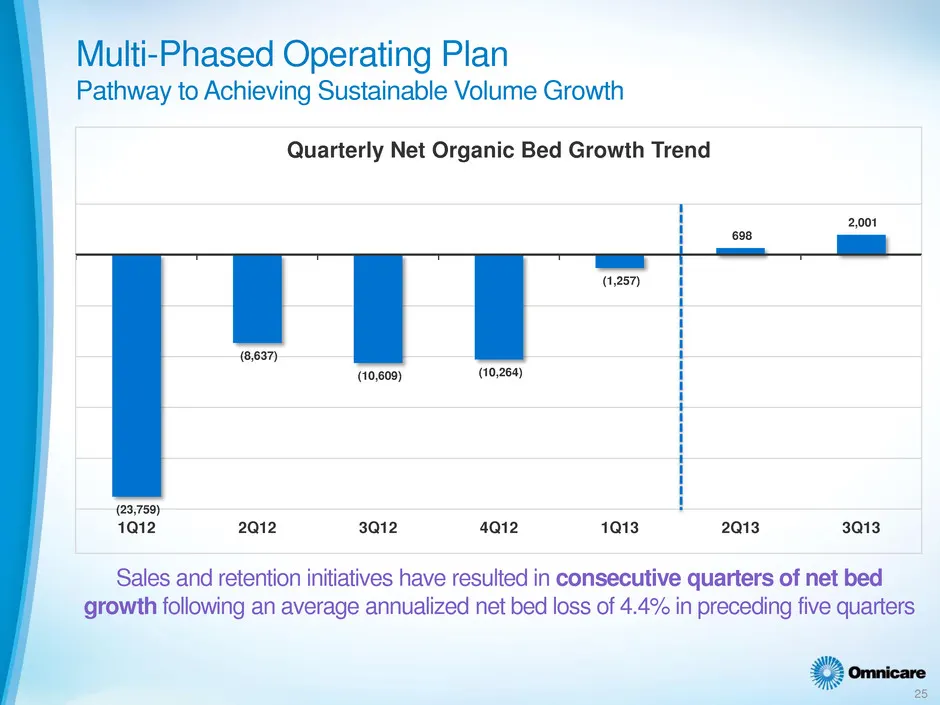
Multi-Phased Operating Plan Pathway to Achieving Sustainable Volume Growth Quarterly Net Organic Bed Growth Trend 2,001 | (1,287) (10,609) (10,264) (23,759) 1Q12 2Q12 3Q12 4Qi2 1013 2Q13 313 Sales and retention initiatives have resulted in consecutive quarters of net bed growth following an average
Slide 26: Growing the Pipeline for Specialty Care Growth
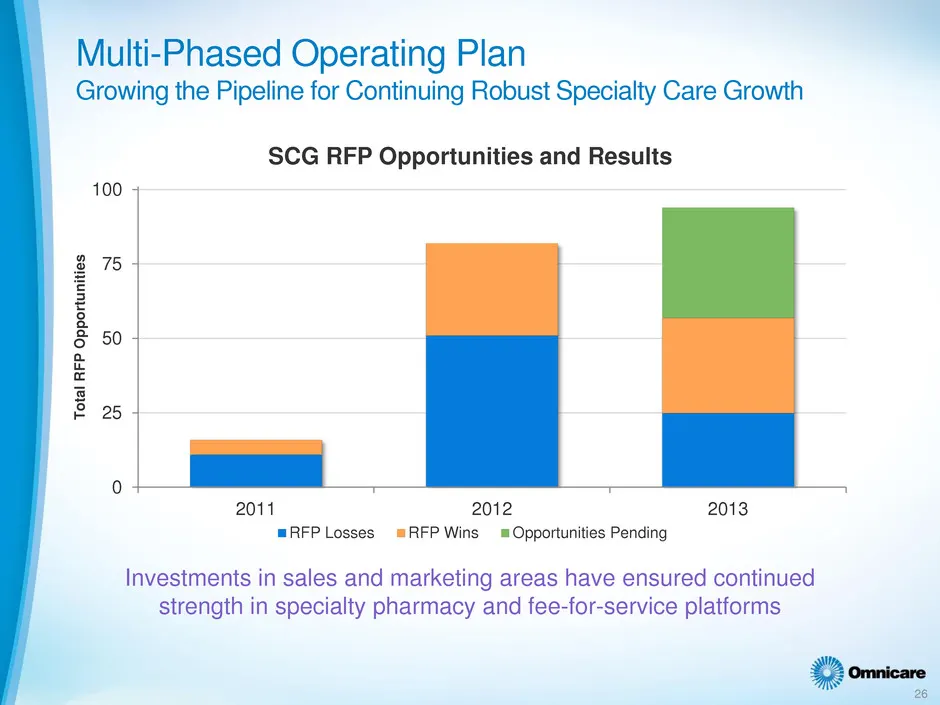
Multi-Phased Operating Plan Growing the Pipeline for Continuing Robust Specialty Care Growth SCG RFP Opportunities and Results 75 Total RFP Opportunities a 3 2011 2012 2013 =RFP Losses =RFP Wins = Opportunities Pending Investments in sales and marketing areas have ensured continued strength in speci
Slide 27: Strategic Execution
RNY ly, “yg; Omnicare Strategic Execution
Slide 28: Residential — Independent Skilled
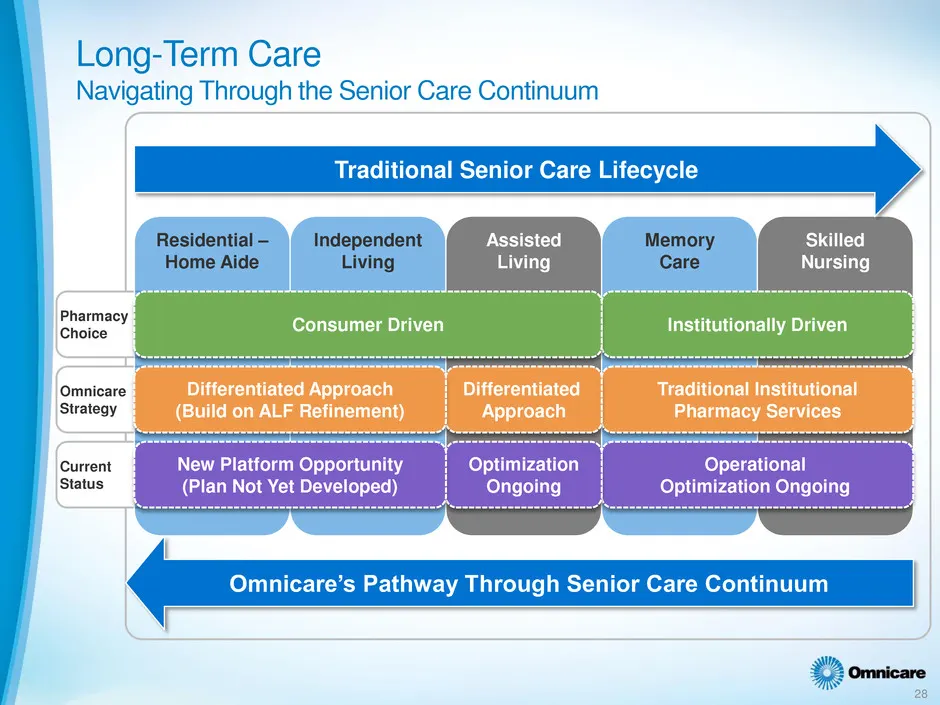
Residential — Independent Skilled Home Aide Living iving Ci Nursing Pharmacy ‘ eg Choice Consumer Driven Institutionally Di raditional Institutional Omnicare Differentiated Approach { Differentiated ‘at (Build on ALF Refinement) Pharmacy Services Strategy Approach Current Status
Slide 29: Brand Support, Patient Support, Supply Chain, Specialty Pharmacy
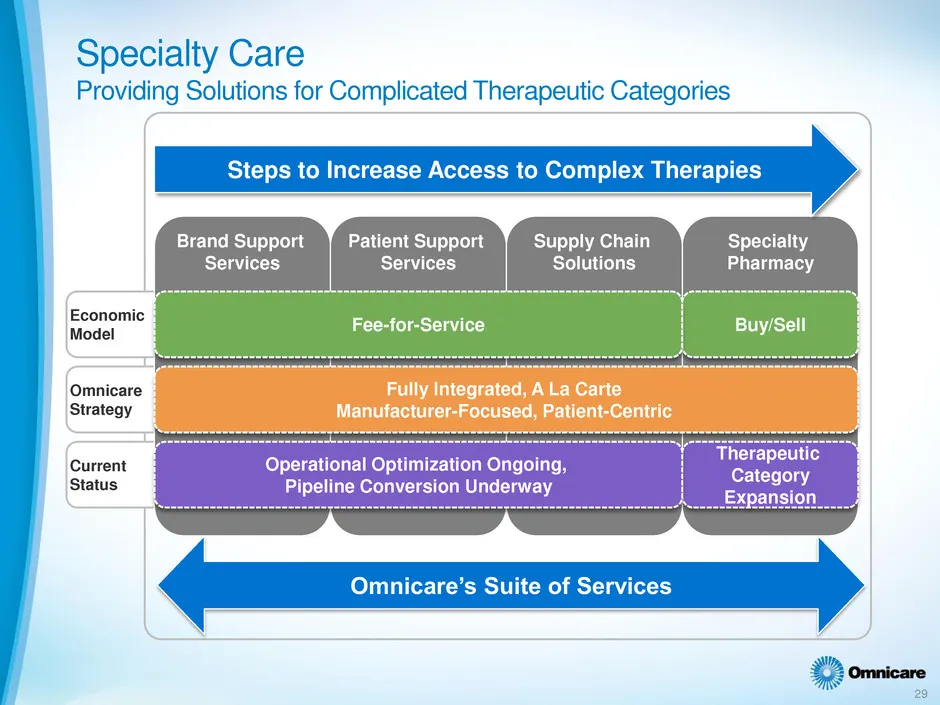
Brand Support Patient Support Supply Chain Specialty Services Services Solutions Pharmacy Fee-for-Service Buy/Sell Economic Model Omnicare Fully Integrated, A La Cart arte Strategy Menuracturer: Focused, Patient-Centric Current Status
Slide 30: Growth Drivers
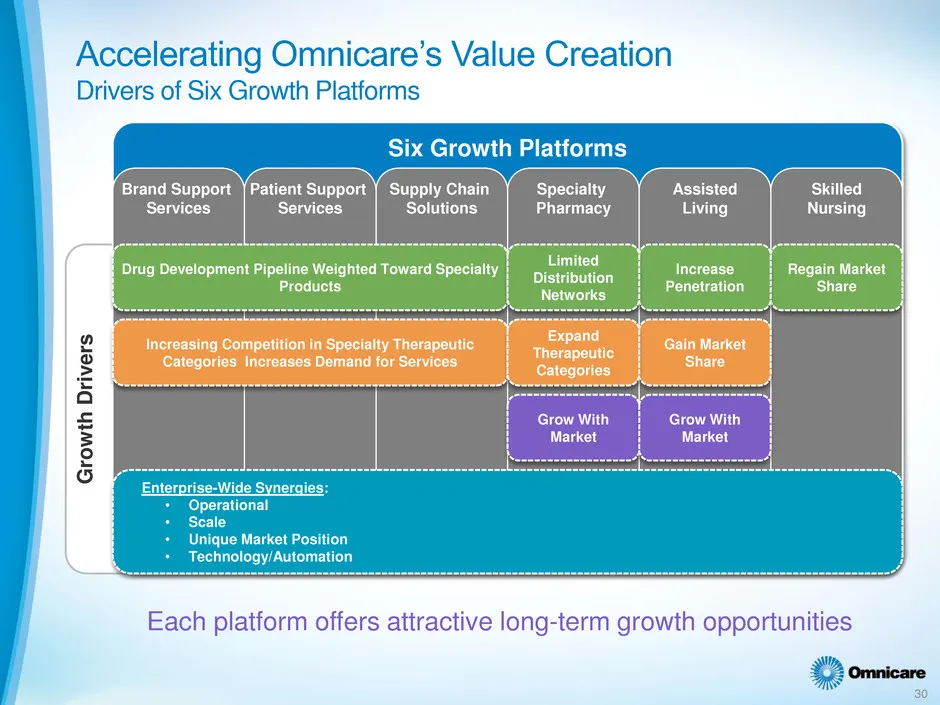
Growth Drivers Brand Support Patient Support { Supply Chain i i Solutions Increasing Competition in Specialty Therapeutic Categories Increases Demand for Services Specialty Pharmacy Limited Distribution Networks Expand Therapeutic Categories Assisted Living Increase Penetration Gain Market Share Ski
Slide 31: Accelerating Omnicare's Value Creation
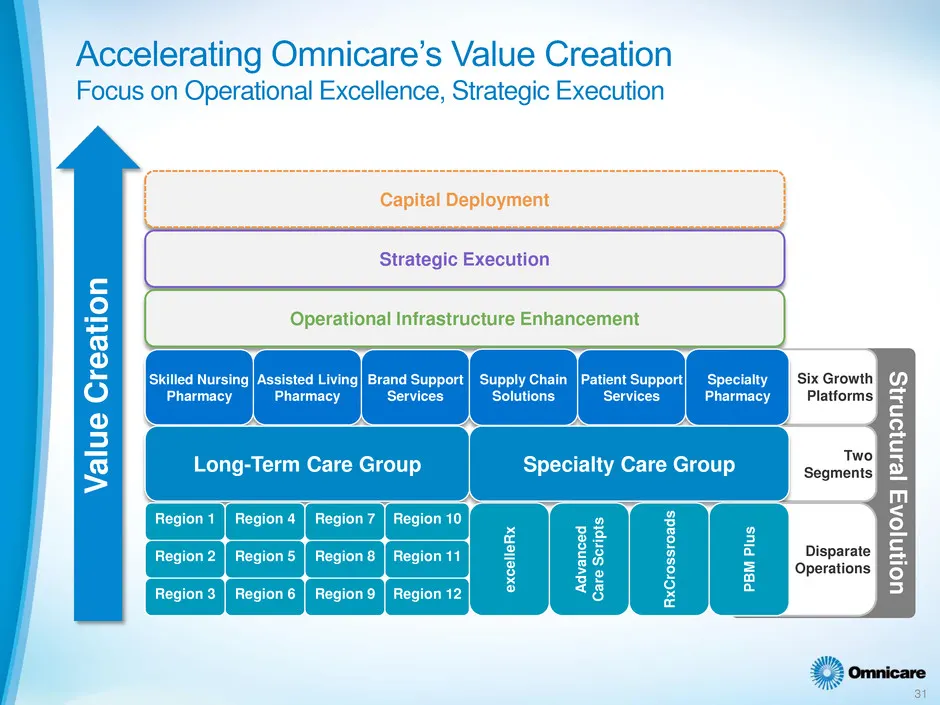
Accelerating Omnicare’s Value Creation Focus on Operational Excellence, Strategic Execution [ Strategic Execution Skilled Nursing | Assisted Living| Brand Support| Supply Chain |Patient Support| Specialty harmacy ‘Term Care Group Specialty Care Group Value Creation PBM Plus 8 3 s 5 3 £ 8 & excelleRx

Slide 32: Omnicare
Omnicare

Slide 33: Omnicare Appendix
RNY ly, “yg; Omnicare Appendix
Slide 34: Exhibit — Financial Performance
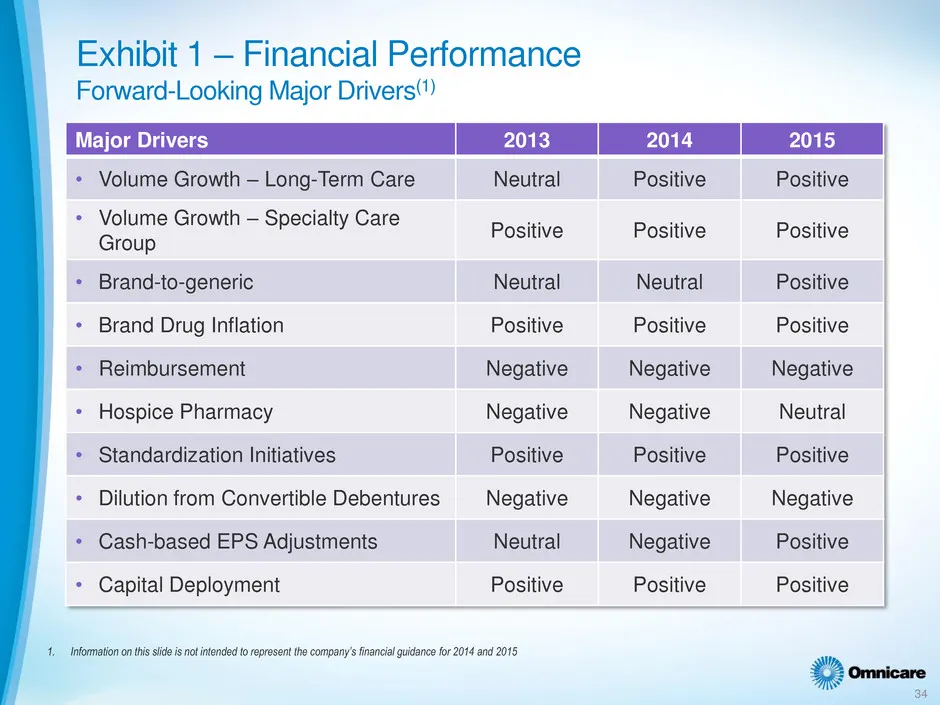
Exhibit 1 — Financial Performance Forward-Looking Major Drivers‘) 2013 2014 | 2015 * Volume Growth — Long-Term Care Neutral Positive Positive o Nelltata erent = Seely Gare Positive Positive Positive + Brand-to-generic Neutral Neutral Positive » Brand Drug Inflation Positive Positive Positive » Reimb
Slide 35: Exhibit — Omnicare's Primary Business
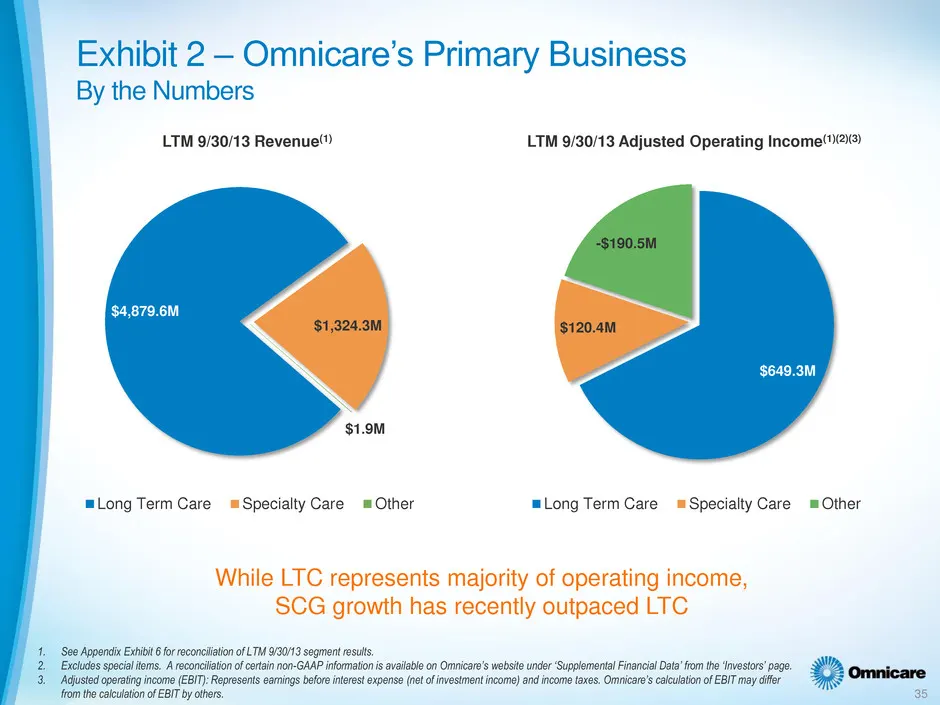
Exhibit 2 —- Omnicare’s Primary Business By the Numbers LTM 9/30/13 Revenue) LTM 9/30/13 Adjusted Operating Income!)2\® $1.9M mLong Term Care mSpecialty Care = Other Long Term Care Specialty Care = Other While LTC represents majority of operating income, SCG growth has recently outpaced LTC ne 3. Ad
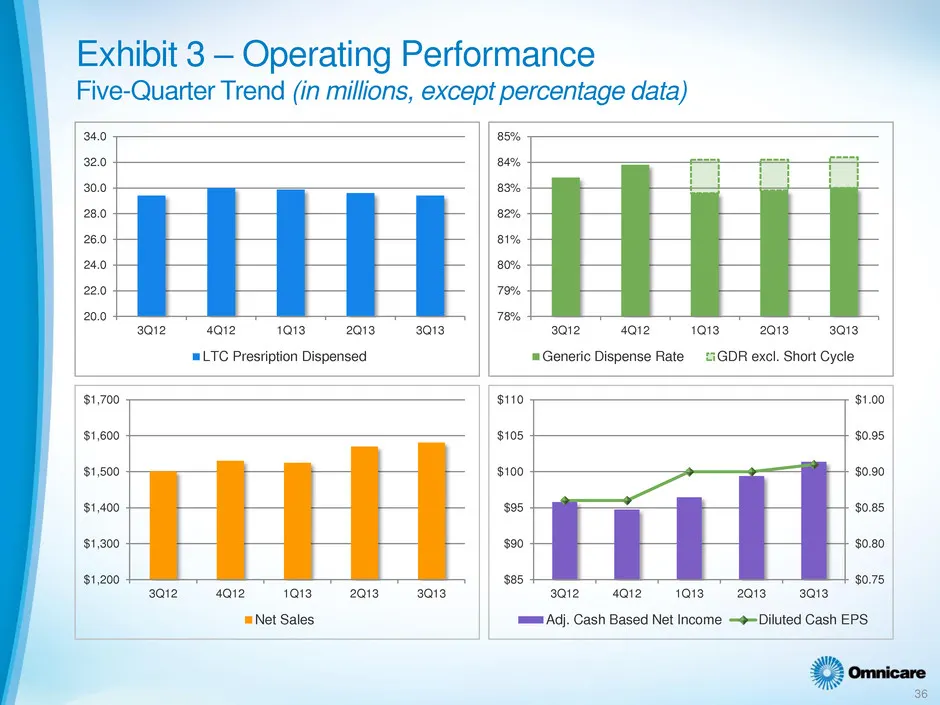
Slide 36: Exhibit — Operating Performance
Exhibit 3 —- Operating Performance Five-Quarter Trend (in millions, except percentage data) 340 85% 320 84% 300 83% 28.0 82% 260 81% 240 80% 220 79% 200 78% sor 4Q12113_—NB 3B. saz aie 101s eats 03 ‘= LTC Presription Dispensed Generic Dispense Rate SiGDR excl. Short Cycle $1,700 $110 $1.00 $1,600 $1
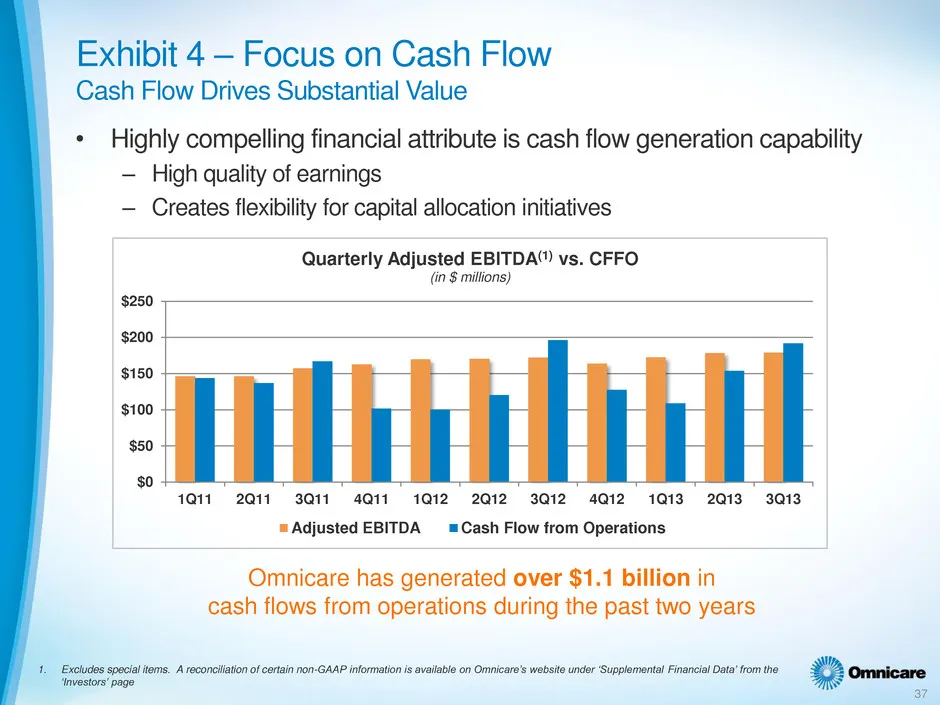
Slide 37: Exhibit — Focus on Cash Flow
Exhibit 4 — Focus on Cash Flow Cash Flow Drives Substantial Value Highly compelling financial attribute is cash flow generation capability — High quality of earnings — Creates flexibility for capital allocation initiatives Quarterly Adjusted EBITDA” vs. CFFO (it in $ millions) 1Q11-2Q11 3Q11 4Q11 1Q
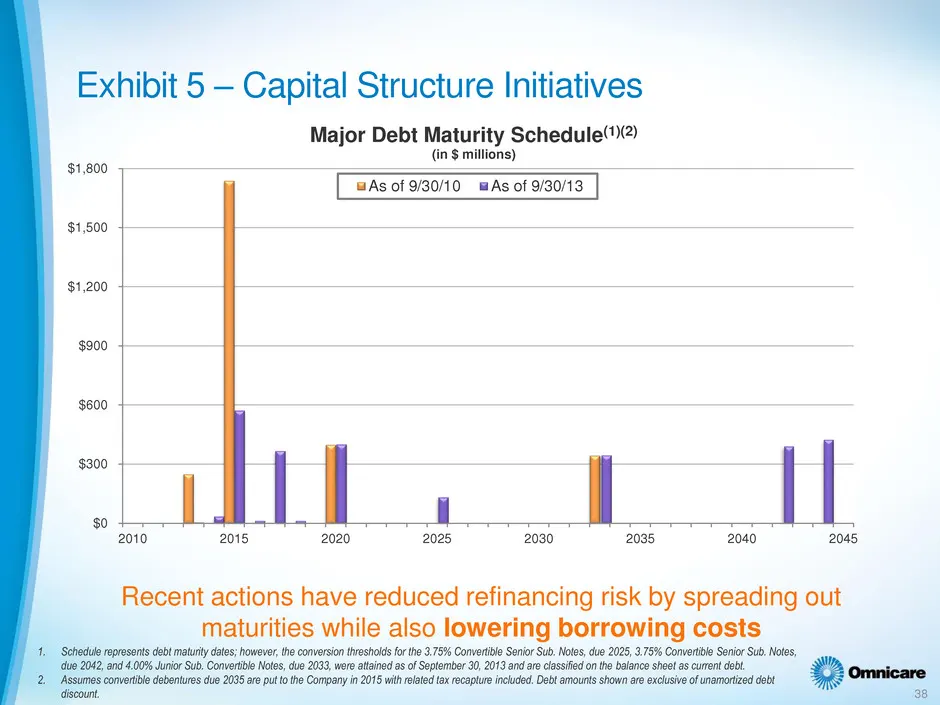
Slide 38: Exhibit — Capital Structure Initiatives
Exhibit 5 — Capital Structure Initiatives Major Debt Maturity Schedule 2) (in $ millions) BAs of 9/30/10 BAs of 9/30/13 $300 | _| so | il 2010 2015 2020 2025 2030 2035 2045 Recent actions have reduced refinancing risk by spreading out maturities while also lowering borrowing costs 1. Schedule repres
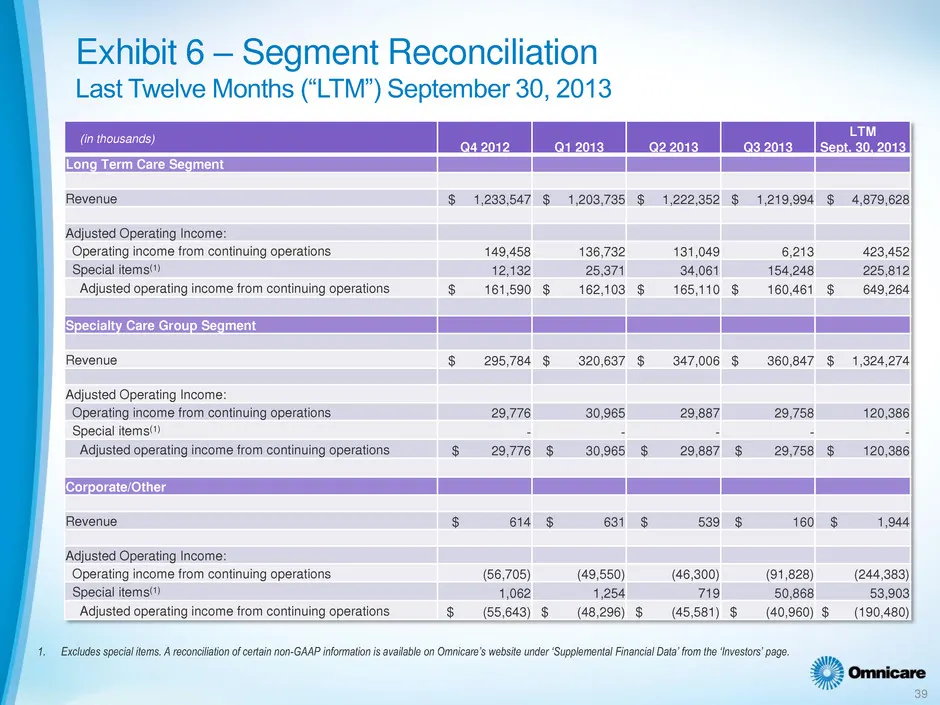
Slide 39: Exhibit - Segment Reconciliation
Exhibit 6 - Segment Reconciliation Last Twelve Months (“LTM”) September 30, 2013 Lcsaoe | crane | caters | oasis len ani 942012 912013 Q 93.2013 30,2013 ———kK——E—E_E—E—__E=SES ad Long Term Care Segment Revenue $ 1,233,547 $ 1,203,735 $ 1,222,352 $ 1,219,994 $ 4,879,628 Adjusted Operating Income: Ope
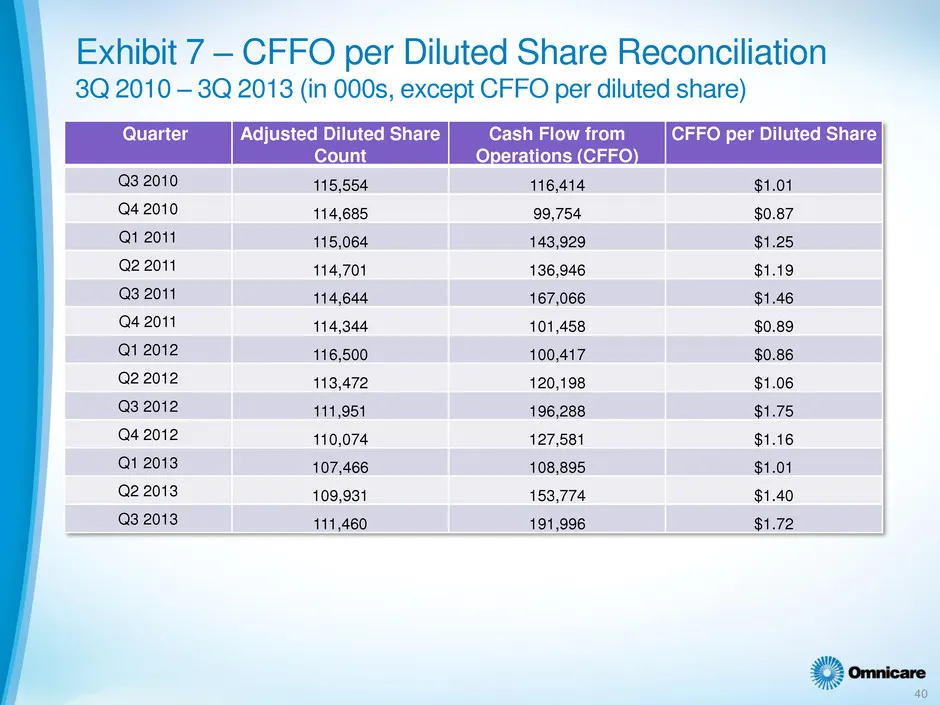
Slide 40: Exhibit — CFFO per Diluted Share Reconciliation
lf Exhibit 7 — CFFO per Diluted Share Reconciliation 3Q 2010 — 3Q 2013 (in 000s, except CFFO per diluted share) i La Adjusted Diluted Share Cash Flow from CFFO per Diluted Share Count Operations (CFFO) Q3 2010 Q4 2010 Qi 2011 Q2 2011 Q3 2011 Q4 2011 Q1 2012 Q2 2012 Q3 2012 Q4 2012 Q1 2013 Q2 2013 Q3
Source: SEC EDGAR · 8-K filed Jan 14, 2014
More decks from Omnicare Inc
 Bank of America Merrill Lynch 2015 Health Care Conference20 slides · May 12, 2015
 Q1 2015 Earnings Presentation17 slides · Apr 29, 2015
 Q4 2014 Earnings Presentation18 slides · Feb 25, 2015
 33rd Annual J.P. Morgan Healthcare Conference (January 2015)34 slides · Jan 12, 2015
 Credit Suisse conference (November 2014)21 slides · Nov 10, 2014
 Q3 2014 Earnings Presentation16 slides · Oct 24, 2014