Provident Bankshares — Merger or Acquisition (May 2004)
39 slides from Provident Bankshares's merger presentation, May 4, 2004

Slide 1: Provident Bankshares Corporation
PROVIDENT BANKSHARES CORPORATION

Slide 2: Additional Information and Forward-Looking Statements
Provident Bankshares Corporation and Southern Financial Bancorp, Inc. have filed a joint proxy statement/prospectus and other relevant documents concerning the merger with the United States Securities and Exchange Commission (the “SEC”). WE URGE INVESTORS TO READ THE JOINT PROXY STATEMENT/PROSPECTUS

Slide 3: Agenda
AGENDA HISTORY THE PROVIDENT DISTINCTION KEY STRATEGIES SOUTHERN FINANCIAL MERGER IMPROVE FINANCIAL FUNDAMENTALS
Slide 4: History
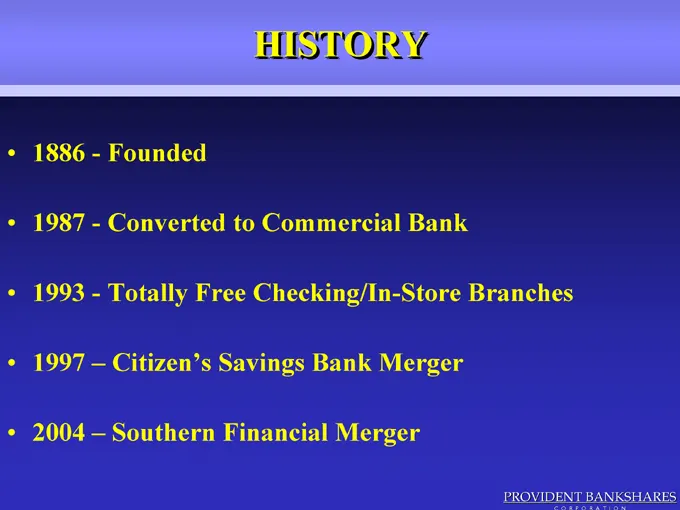
HISTORY • 1886—Founded • 1987—Converted to Commercial Bank • 1993—Totally Free Checking/In-Store Branches • 1997 – Citizen’s Savings Bank Merger • 2004 – Southern Financial Merger

Slide 5: The Provident Distinction
THE PROVIDENT DISTINCTION
Slide 6: Unique by What We Are
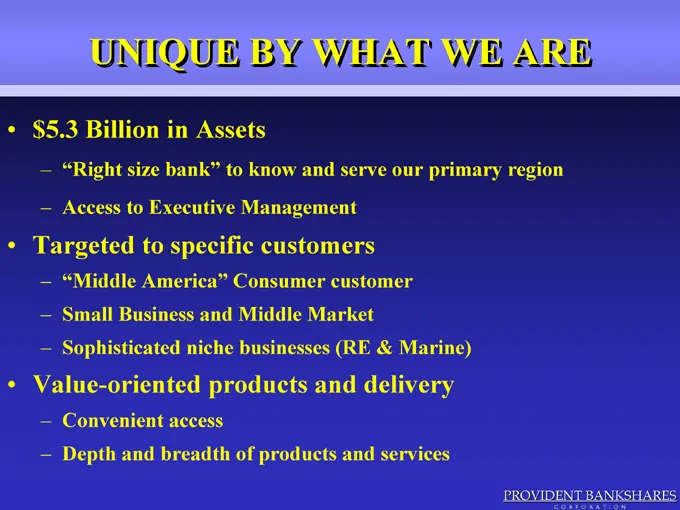
UNIQUE BY WHAT WE ARE •$ 5.3 Billion in Assets – “Right size bank” to know and serve our primary region – Access to Executive Management • Targeted to specific customers – “Middle America” Consumer customer – Small Business and Middle Market – Sophisticated niche businesses (RE & Marine) • Value-ori
Slide 7: Key Strategies
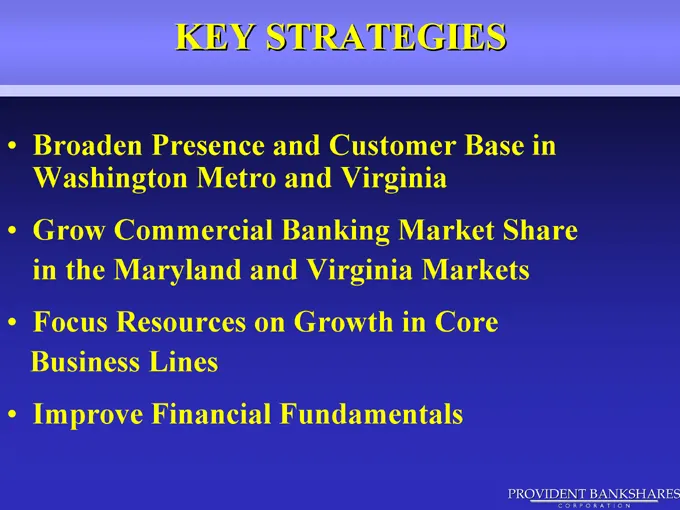
KEY STRATEGIES • Broaden Presence and Customer Base in Washington Metro and Virginia • Grow Commercial Banking Market Share in the Maryland and Virginia Markets • Focus Resources on Growth in Core Business Lines • Improve Financial Fundamentals

Slide 8: Broaden Presence and Customer Base in Washington Metro and Virginia
BROADEN PRESENCE AND CUSTOMER BASE IN WASHINGTON METRO AND VIRGINIA
Slide 9: Virginia and Washington Metro Expansion
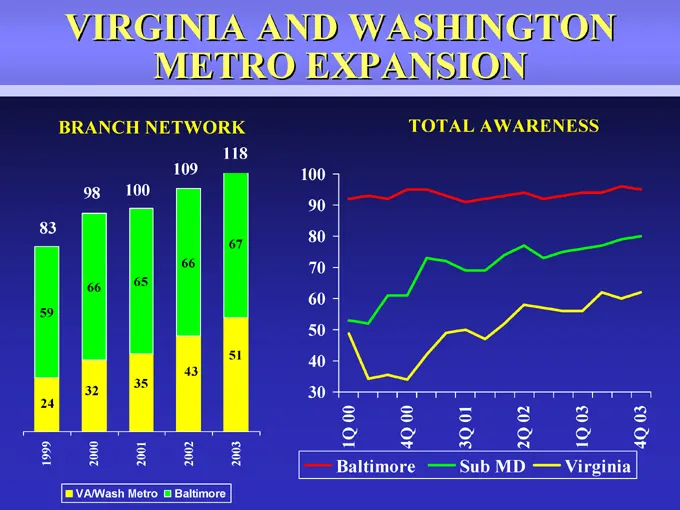
VIRGINIA AND WASHINGTON METRO EXPANSION BRANCH NETWORK 98 100 66 65 1999 2000 2001 2002 2003 VA/Wash Metro Baltimore TOTAL AWARENESS Baltimore Sub MD Virginia
Slide 10: Checking Balance Growth VA/Washington Metro
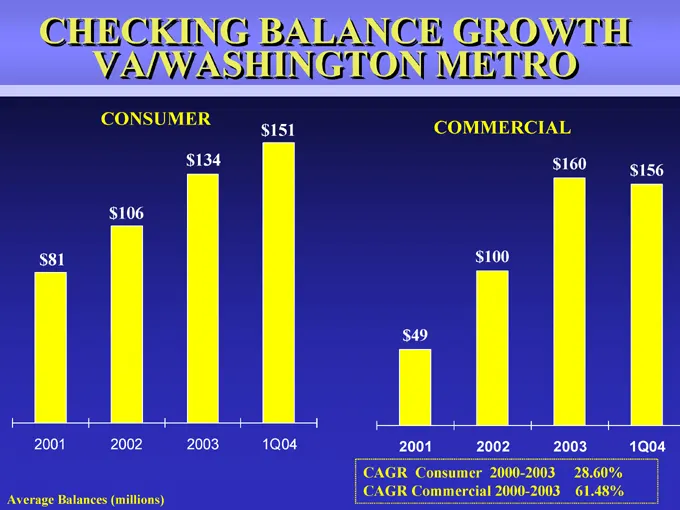
CHECKING BALANCE GROWTH VA/WASHINGTON METRO CONSUMER $ 81 2001 $ 106 2002 $ 134 2003 $ 151 1Q04 Average Balances (millions) COMMERCIAL $ 2001 $ 100 2002 $ 160 2003 $ 156 1Q04 CAGR Consumer 2000-2003 28.60% CAGR Commercial 2000-2003 61.48%
Slide 11: Grow Commercial Banking Market Share in the Maryland and Virginia Markets
GROW COMMERCIAL BANKING MARKET SHARE IN THE MARYLAND AND VIRGINIA MARKETS
Slide 12: Core Commercial Loan and Deposit/Repo Growth
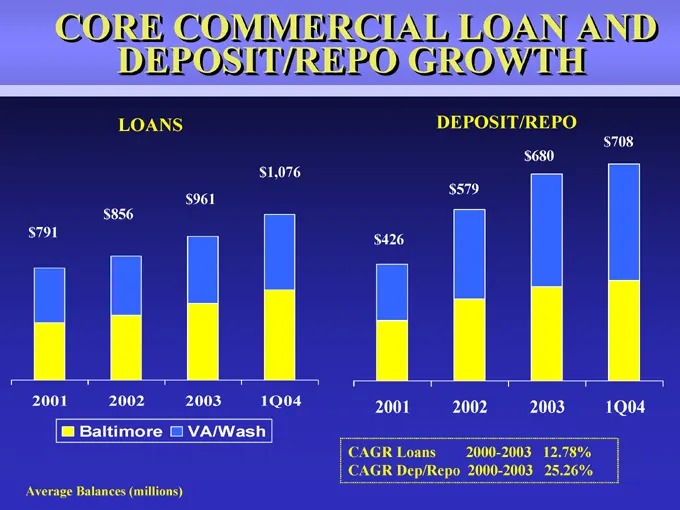
CORE COMMERCIAL LOAN AND DEPOSIT/REPO GROWTH LOANS $ 1,076 $ 961 $ 856 $ 791 2001 2002 2003 1Q04 Baltimore VA/Wash Average Balances (millions) DEPOSIT/REPO $ 426 2001 $ 579 2002 $ 680 2003 $ 708 1Q04 CAGR Loans 2000-2003 12.78% CAGR Dep/Repo 2000-2003 25.26%

Slide 13: Focus Resources on Growth in Core Business Lines
FOCUS RESOURCES ON GROWTH IN CORE BUSINESS LINES
Slide 14: Core Loan and Deposit Growth
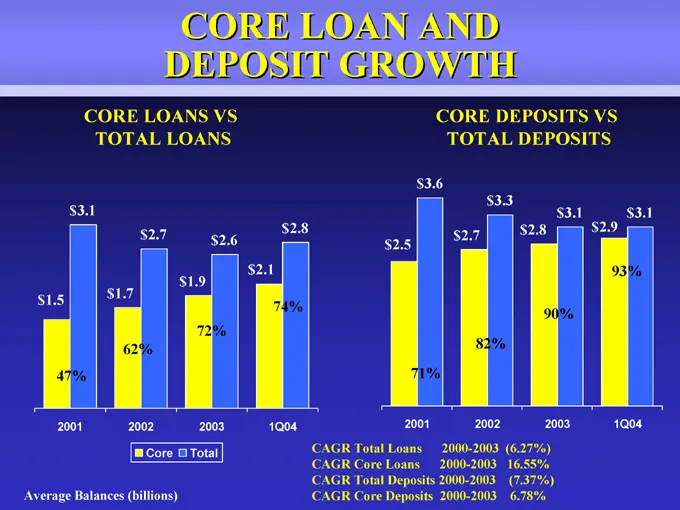
CORE LOAN AND DEPOSIT GROWTH CORE LOANS VS TOTAL LOANS $ 3.1 $ 2.7 $ 2.8 $ 2.6 $ 2.1 $ 1.9 $ 1.5 $ 1.7 74% 72% 62% 47% 2001 2002 2003 1Q04 Core Total Average Balances (billions) CORE DEPOSITS VS TOTAL DEPOSITS $ 3.6 $ 3.3 $ 3.1 $ 3.1 $ 2.8 $ 2.9 $ 2.7 $ 2.5 93% 90% 82% 71% 2001 2002 2003 1Q04 CAGR T

Slide 15: Strategic Merger: Southern Financial Bank
STRATEGIC MERGER Southern Financial Bank
Slide 16: Southern Financial Bancorp, Inc
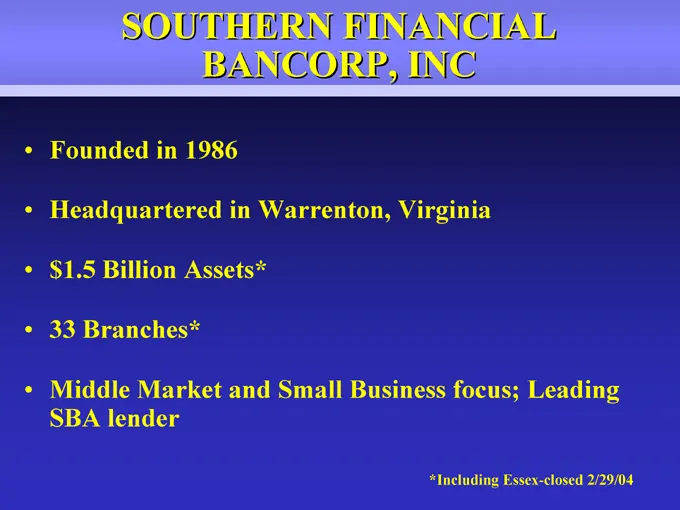
SOUTHERN FINANCIAL BANCORP, INC • Founded in 1986 • Headquartered in Warrenton, Virginia •$ 1.5 Billion Assets* • 33 Branches* • Middle Market and Small Business focus; Leading SBA lender *Including Essex-closed 2/29/04
Slide 17: Transaction Strengths
TRANSACTION STRENGTHS Strategic Fit Cultural Compatibility Financial Opportunity
Slide 18: Strategic Fit
STRATEGIC FIT Continues Provident’s market share expansion in the high growth markets of Virginia
Slide 19: Virginia: Strong Banking Market
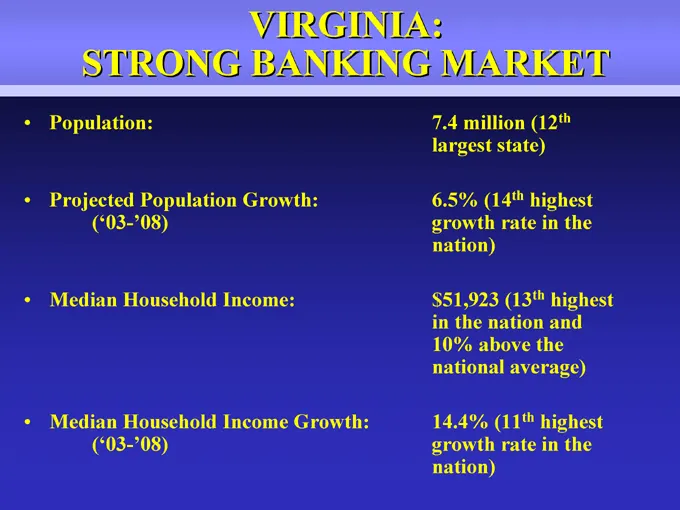
VIRGINIA: STRONG BANKING MARKET • Population: 7.4 million (12th largest state) • Projected Population Growth: 6.5% (14th highest (‘03-’08) growth rate in the nation) • Median Household Income: $51,923 (13th highest in the nation and 10% above the national average) • Median Household Income Growth: 1
Slide 20: Pro Forma Franchise
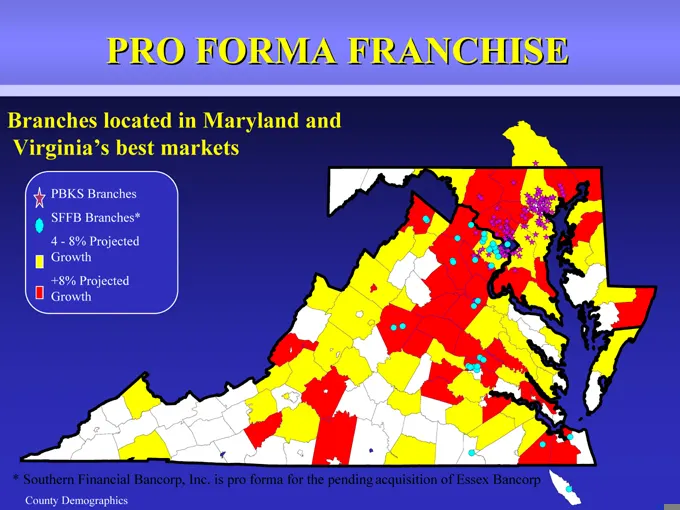
PRO FORMA FRANCHISE Branches located in Maryland and Virginia’s best markets PBKS Branches SFFB Branches* 4—8% Projected Growth +8% Projected Growth * Southern Financial Bancorp, Inc. is pro forma for the pending acquisition of Essex Bancorp County Demographics
Slide 21: Strategic Fit
STRATEGIC FIT Adds significant competitive advantage for business banking companies with a powerful integrated suite of online banking services
Slide 22: Cultural Compatibility
CULTURAL COMPATABILITY Customer oriented Employee focused Community supporter Excellent credit quality
Slide 23: Financial Opportunity
FINANCIAL OPPORTUNITY • Accretive to GAAP and cash EPS in first full year of combined operations • Identified, achievable cost savings • Combined loan composition well-balanced • Significant potential for retail loan and deposit growth
Slide 24: Deal Structure
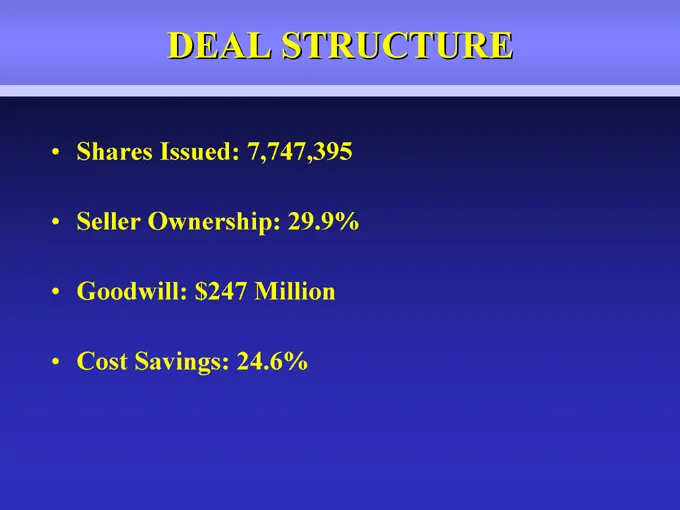
DEAL STRUCTURE • Shares Issued: 7,747,395 • Seller Ownership: 29.9% • Goodwill: $247 Million • Cost Savings: 24.6%
Slide 25: Deal Structure
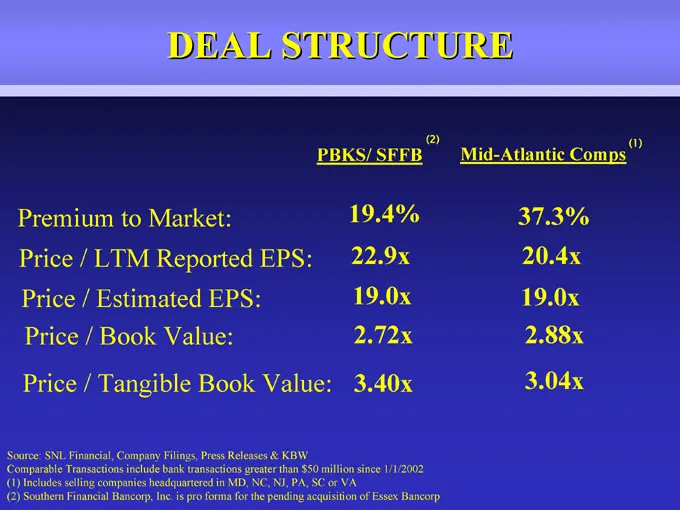
DEAL STRUCTURE (2) (1) PBKS/ SFFB Mid-Atlantic Comps Premium to Market: 19.4% 37.3% Price / LTM Reported EPS: 22.9x 20.4x Price / Estimated EPS: 19.0x 19.0x Price / Book Value: 2.72x 2.88x Price / Tangible Book Value: 3.40x 3.04x Source: SNL Financial, Company Filings, Press Releases & KBW Comparabl
Slide 26: Capital Recovery and Optimization Plan
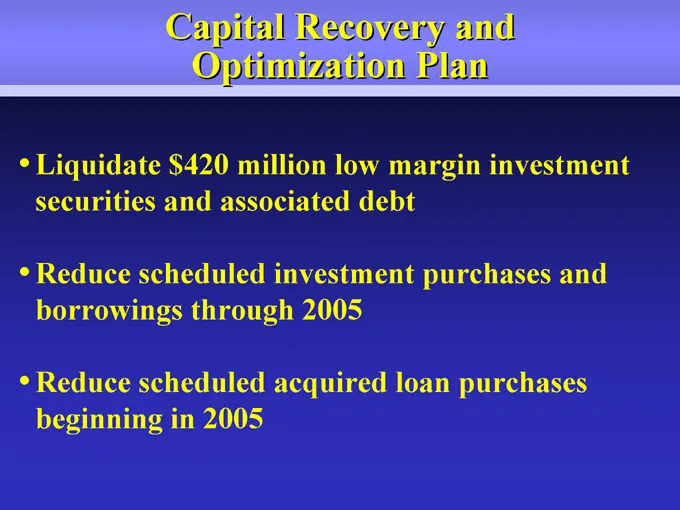
Capital Recovery and Optimization Plan • Liquidate $420 million low margin investment securities and associated debt • Reduce scheduled investment purchases and borrowings through 2005 • Reduce scheduled acquired loan purchases beginning in 2005
Slide 27: Capital Recovery and Optimization Plan
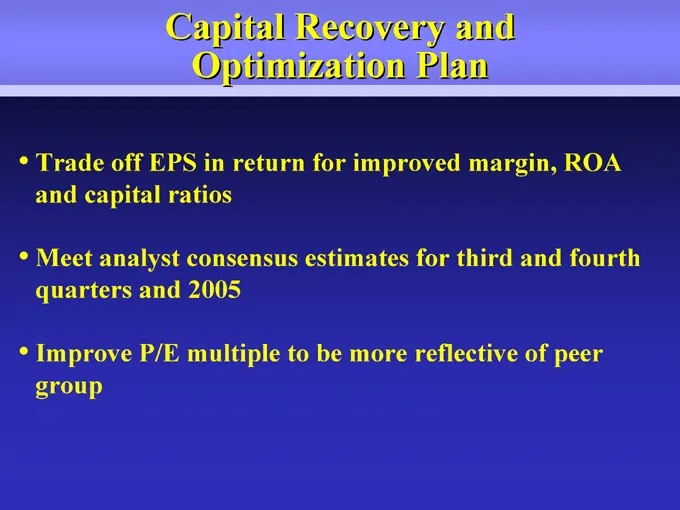
Capital Recovery and Optimization Plan • Trade off EPS in return for improved margin, ROA and capital ratios • Meet analyst consensus estimates for third and fourth quarters and 2005 • Improve P/E multiple to be more reflective of peer group
Slide 28: Capital Recovery and Optimization Plan: Pro-forma Results
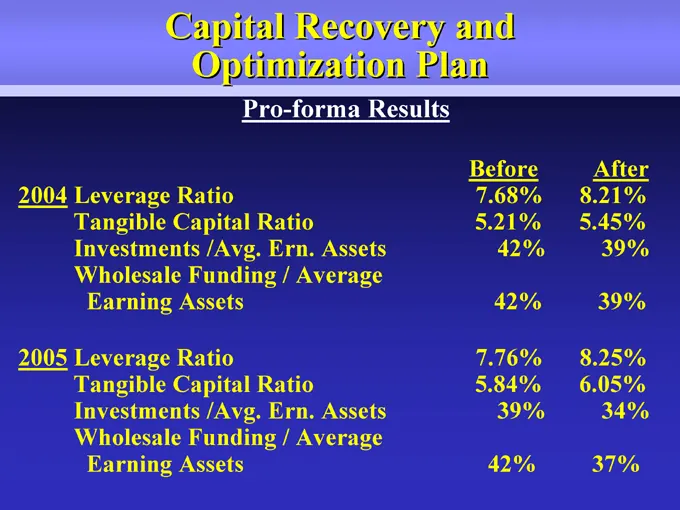
Capital Recovery and Optimization Plan Pro-forma Results Before After 2004 Leverage Ratio 7.68% 8.21% Tangible Capital Ratio 5.21% 5.45% Investments /Avg. Ern. Assets 42% 39% Wholesale Funding / Average Earning Assets 42% 39% 2005 Leverage Ratio 7.76% 8.25% Tangible Capital Ratio 5.84% 6.05% Investm
Slide 29: Capital Recovery and Optimization Plan: Pro-forma Results
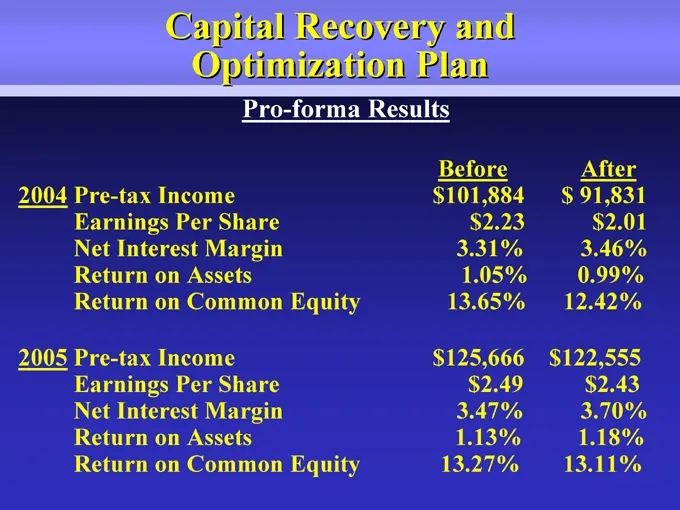
Capital Recovery and Optimization Plan Pro-forma Results Before After 2004 Pre-tax Income $ 101,884 $ 91,831 Earnings Per Share $ 2.23 $ 2.01 Net Interest Margin 3.31% 3.46% Return on Assets 1.05% 0.99% Return on Common Equity 13.65% 12.42% 2005 Pre-tax Income $ 125,666 $ 122,555 Earnings Per Share

Slide 30: Improve Financial Fundamentals
IMPROVE FINANCIAL FUNDAMENTALS
Slide 31: Improve Financial Fundamentals: Core Loans and Deposits
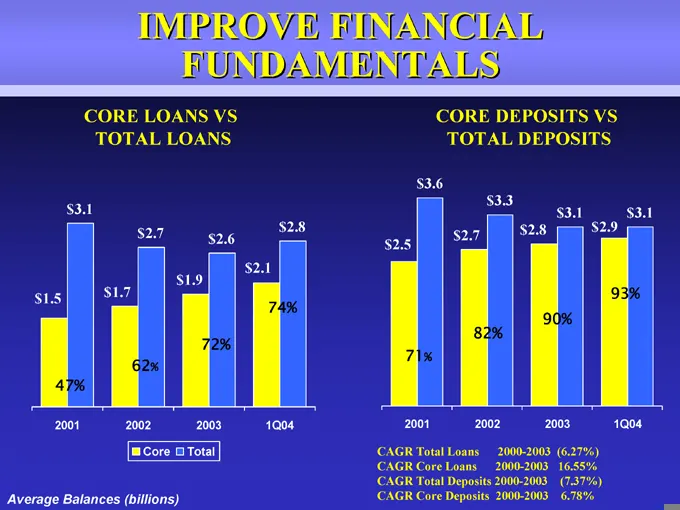
IMPROVE FINANCIAL FUNDAMENTALS CORE LOANS VS TOTAL LOANS $ 3.1 $ 2.7 $ 2.8 $ 2.6 $ 2.1 $ 1.9 $ 1.5 $ 1.7 74% 72% 62% 47% 2001 2002 2003 1Q04 Core Total Average Balances (billions) CORE DEPOSITS VS TOTAL DEPOSITS $ 3.6 $ 3.3 $ 3.1 $ 3.1 $ 2.8 $ 2.9 $ 2.7 $ 2.5 93% 90% 82% 71 % 2001 2002 2003 1Q04 CAG
Slide 32: Non Performing Loans and Net Charge Offs
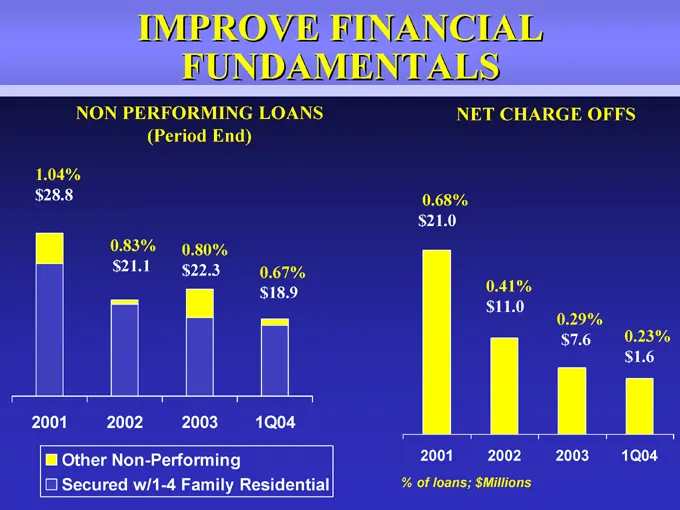
IMPROVE FINANCIAL FUNDAMENTALS NON PERFORMING LOANS (Period End) 1.04% $ 28.8 0.83% 0.80% $ 21.1 $ 22.3 0.67% $ 18.9 2001 2002 2003 1Q04 Other Non-Performing Secured w/1-4 Family Residential NET CHARGE OFFS 0.68% $ 21.0 0.41% $ 11.0 0.29% $ 7.6 0.23% $ 1.6 2001 2002 2003 1Q04 % of loans; $Millions
Slide 33: Net Interest Margin and Efficiency Ratio
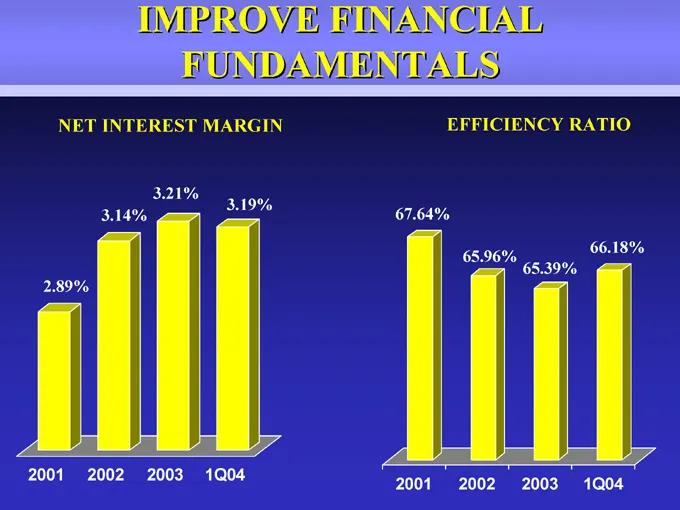
IMPROVE FINANCIAL FUNDAMENTALS NET INTEREST MARGIN 3.21% 3.19% 3.14% 2.89% 2001 2002 2003 1Q04 EFFICIENCY RATIO 67.64% 66.18% 65.96% 65.39% 2001 2002 2003 1Q04
Slide 34: Return on Average Assets and Common Equity
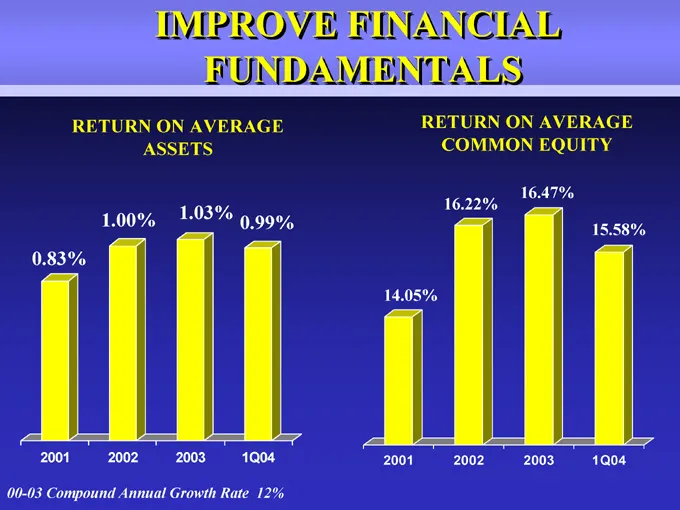
IMPROVE FINANCIAL FUNDAMENTALS RETURN ON AVERAGE ASSETS 1.00% 1.03% 0.99% 0.83% 2001 2002 2003 1Q04 00-03 Compound Annual Growth Rate 12% RETURN ON AVERAGE COMMON EQUITY 16.47% 16.22% 15.58% 14.05% 2001 2002 2003 1Q04
Slide 35: Leverage and Total Risk-Based Capital
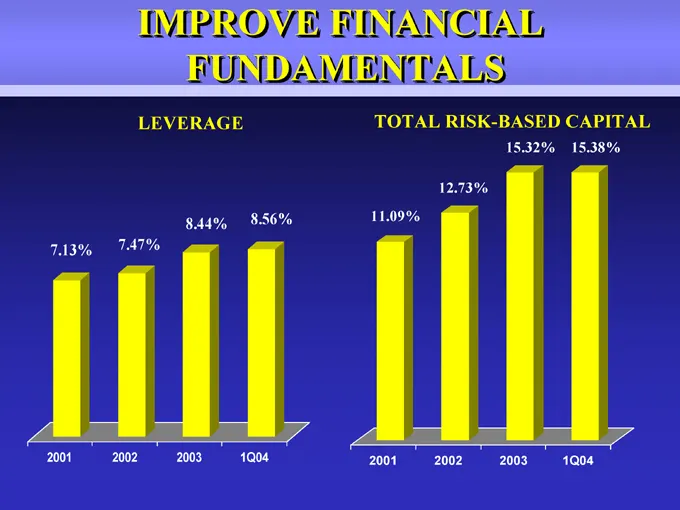
IMPROVE FINANCIAL FUNDAMENTALS LEVERAGE 8.44% 8.56% 7.13% 7.47% 2001 2002 2003 1Q04 TOTAL RISK-BASED CAPITAL 15.32% 15.38% 12.73% 11.09% 2001 2002 2003 1Q04
Slide 36: Diluted Earnings Per Share and Cash Dividend
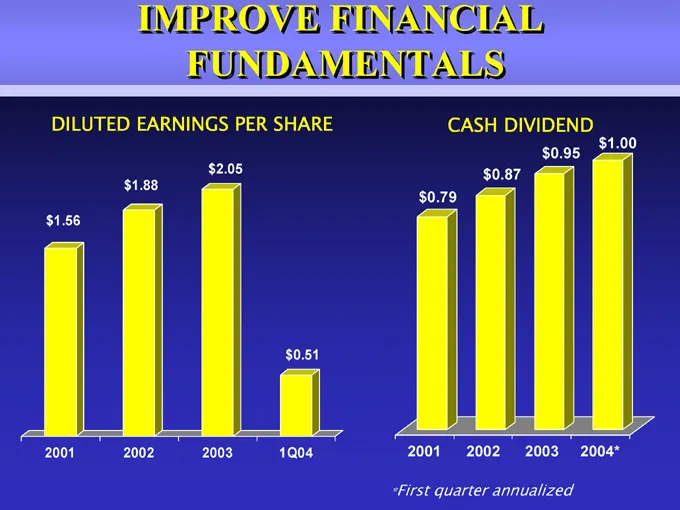
IMPROVE FINANCIAL FUNDAMENTALS DILUTED EARNINGS PER SHARE $ 2.05 $ 1.88 $ 1.56 $ 0.51 2001 2002 2003 1Q04 CASH DIVIDEND $ 0.79 2001 $ 1.00 $ 0.95 $ 0.87 2002 2003 2004* *First quarter annualized
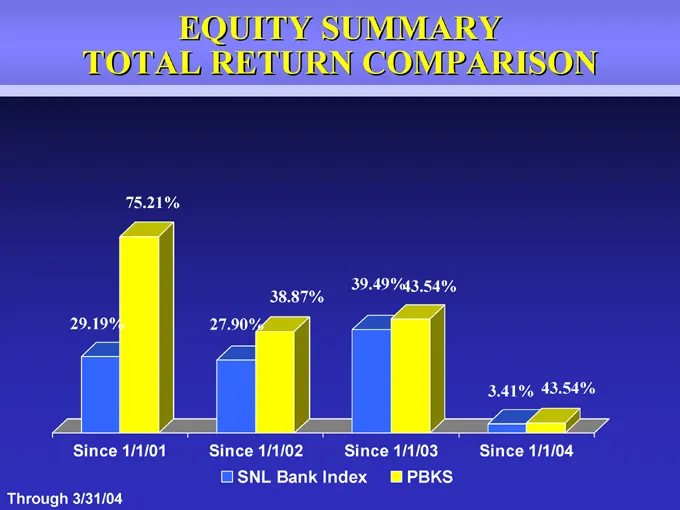
Slide 37: Equity Summary: Total Return Comparison
EQUITY SUMMARY TOTAL RETURN COMPARISON 75.21% 39.49% 43.54% 38.87% 29.19% 27.90% 3.41% 43.54% Since 1/1/01 Since 1/1/02 Since 1/1/03 Since 1/1/04 SNL Bank Index PBKS Through 3/31/04

Slide 38: Investment Attributes
INVESTMENT ATTRIBUTES • Core balance sheet momentum • Effective expansion strategy • Growing market share in attractive markets • Stable and improving credit quality • Experienced management team

Slide 39: Provident Bankshares Corporation
PROVIDENT BANKSHARES CORPORATION (www.provbank.com) Contact: Media: Lillian Kilroy: (410) 277-2833 Investment Community: Trish Ferrick: (540) 341-8073
Source: SEC EDGAR · 8-K filed May 4, 2004
More decks from Provident Bankshares Corp
 Merger or Acquisition (December 2008)32 slides · Dec 19, 2008
 2007 Stifel Nicolaus Financial Institutions Investor Conference52 slides · Dec 6, 2007
 Investor Presentation (November 2007)49 slides · Nov 8, 2007
 FTN Midwest Small and Mid Cap Bank Conference 200757 slides · Sep 6, 2007
 Investor Presentation (May 2007)51 slides · May 8, 2007
 KBW Regional Bank Conference 200751 slides · Feb 28, 2007