American National Bankshares Inc
American National Bankshares — Investor Presentation (August 2013)
22 slides from American National Bankshares's investor presentation, Aug 21, 2013
Slide 1: American National Bankshares Inc.
<=> AMERICAN NATIONAL BANKSHARES INC. A Century of Experience and 21st Century Banking Solutions Just the Bank You Would Imagine. SS Her.
Slide 2: Forward-Looking Statements
FORWARD-LOOKING STATEMENTS Certain statements in this presentation may constitute “forward-looking statements” within the meaning of the Private Securities Litigation Reform Act of 1995. Forward-looking statements are statements that include projections, predictions, expectations or beliefs about fu
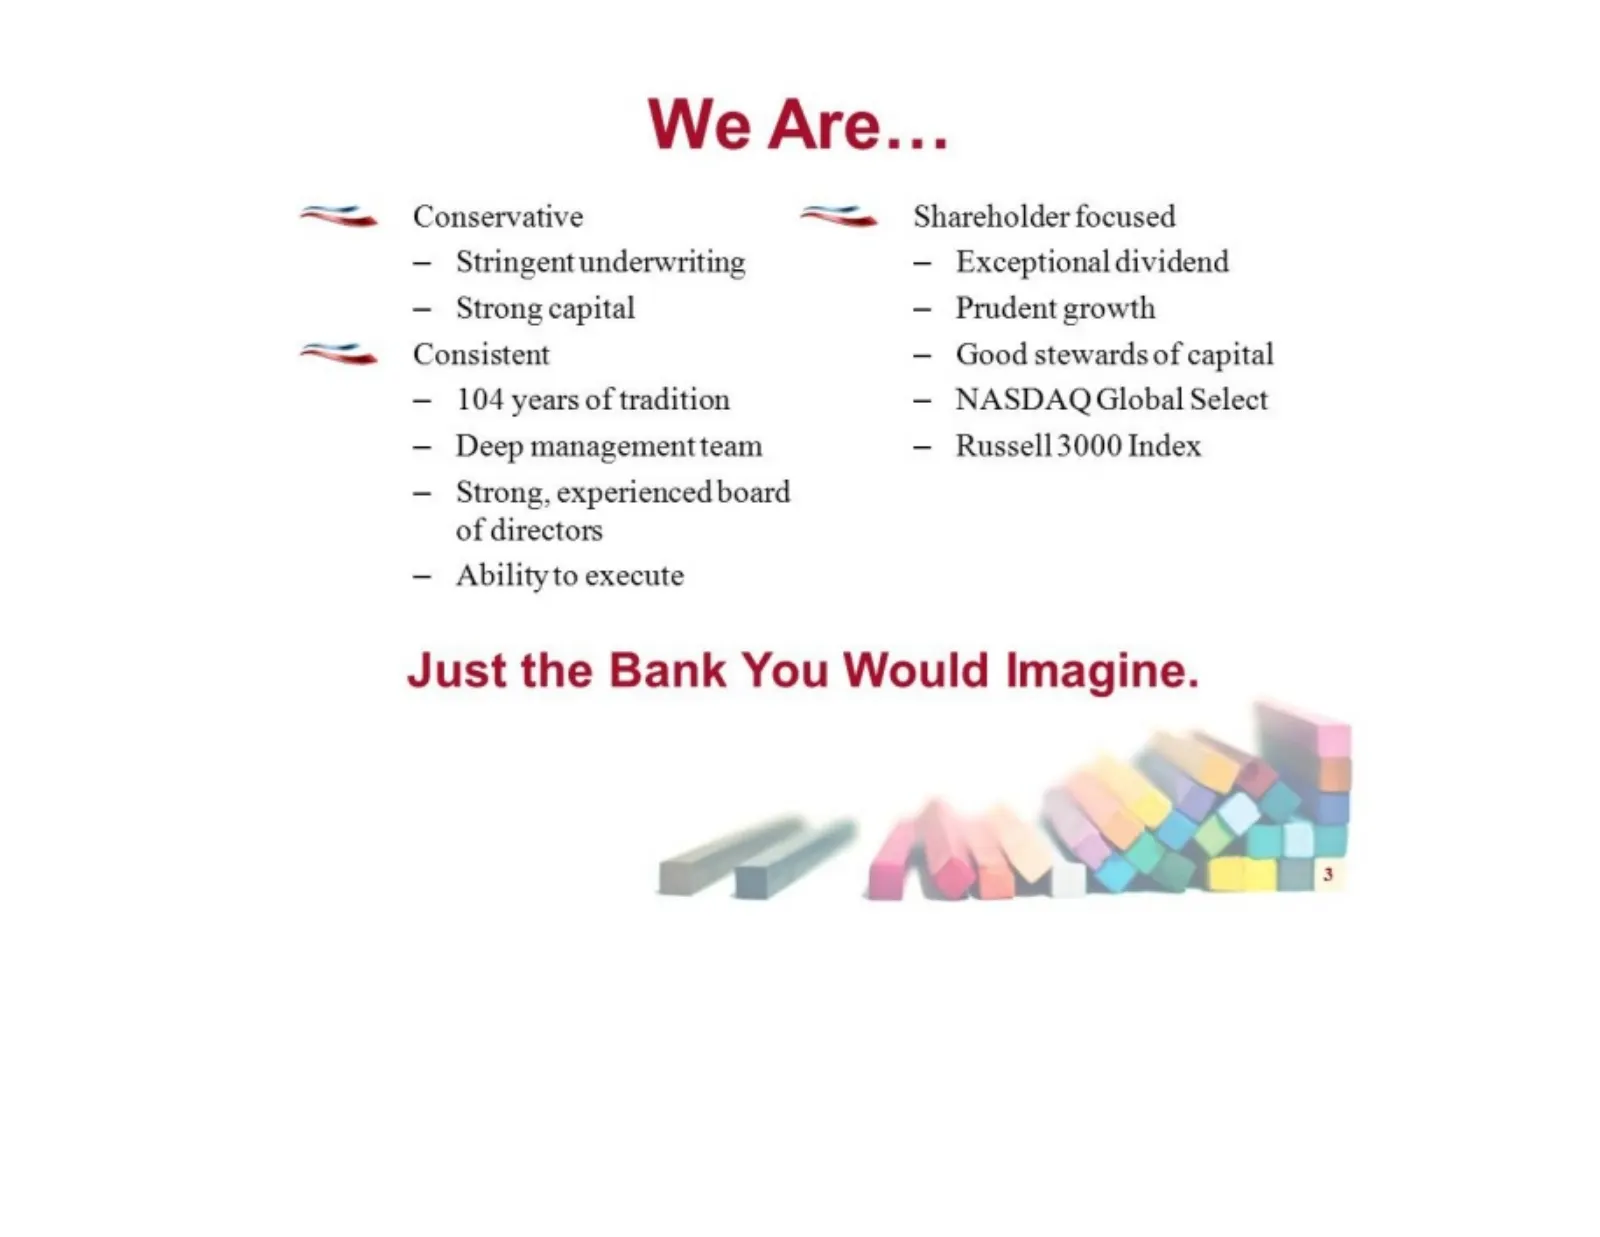
Slide 3: We Are...
I We Are... Conservative == = Shareholder focused — Stringent underwriting — Exceptional dividend — Strong capital — Prudent growth Consistent — Good stewards of capital — 104 years of tradition -— NASDAQGlobal Select — Deep managementteam — Russell 3000 Index — Strong, experienced board of director
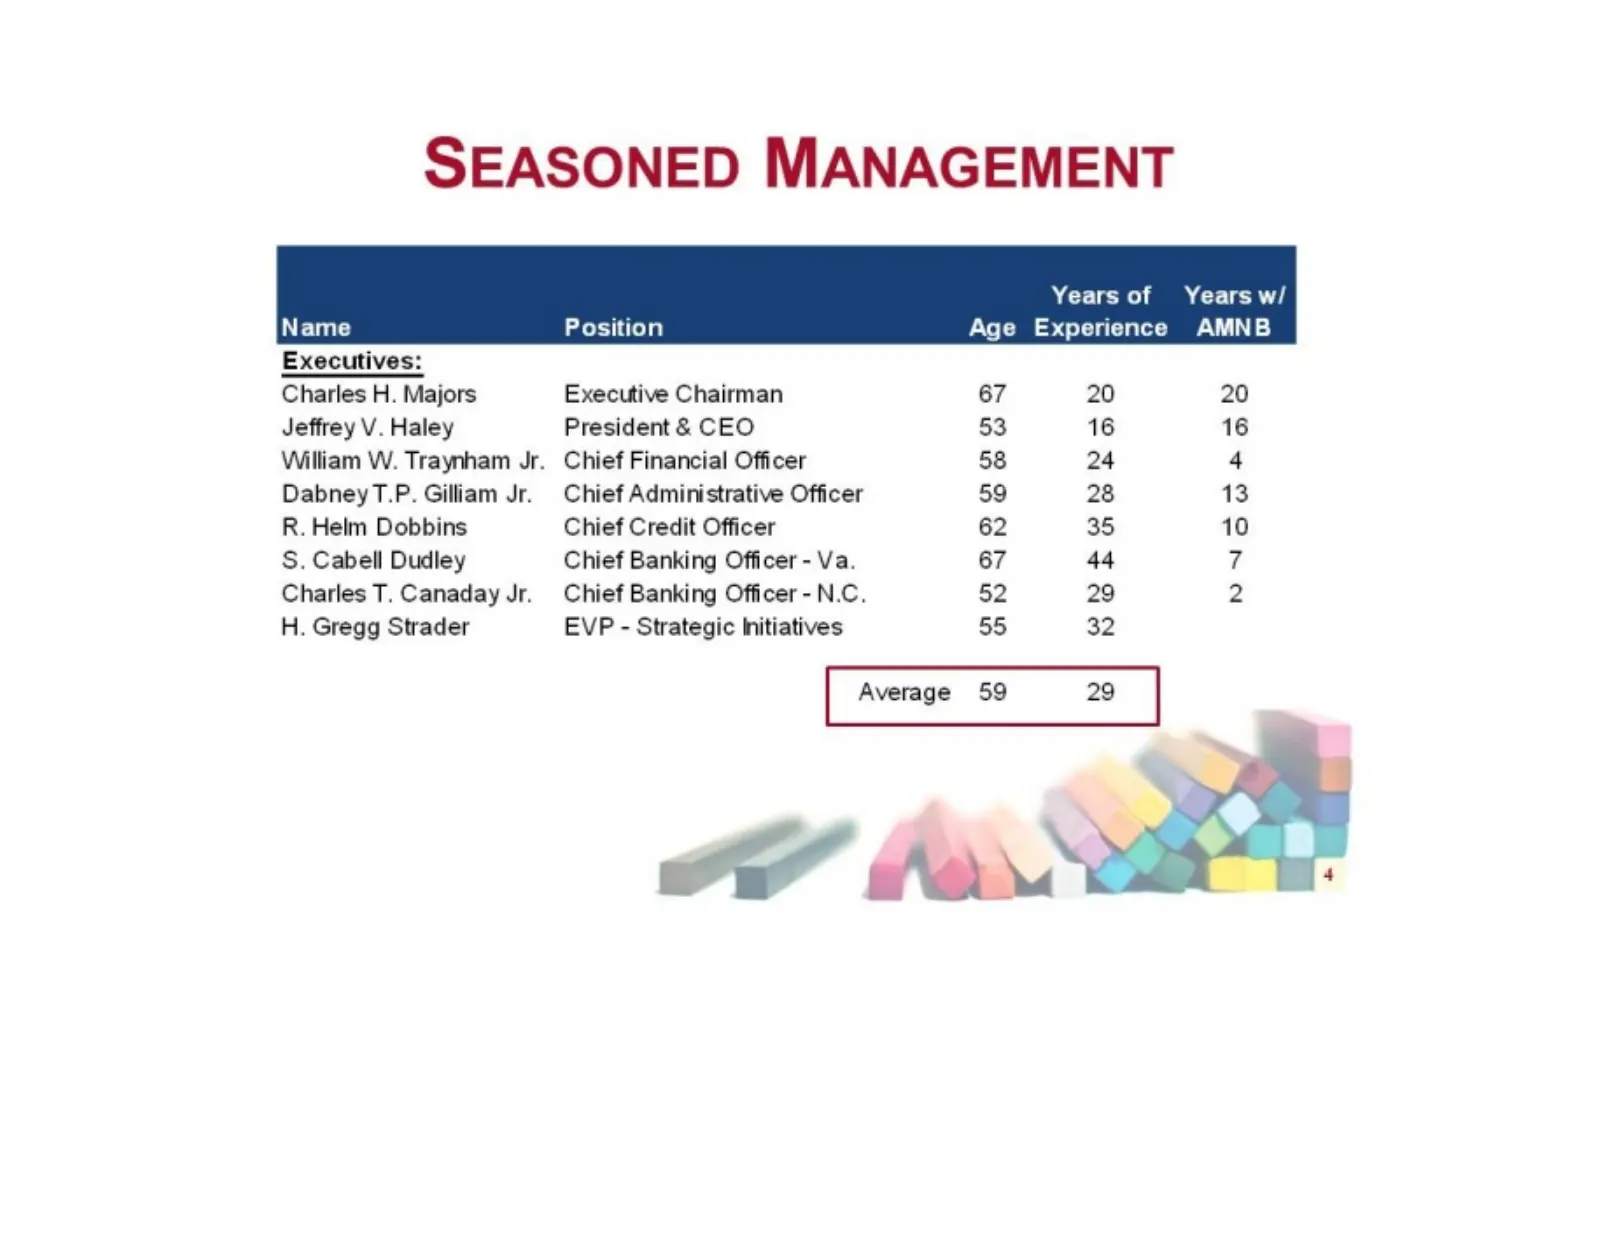
Slide 4: Seasoned Management
SEASONED MANAGEMENT Executives: Charles H. Majors Jeffrey V. Haley William W. Traynham Jr. Dabney T.P. Gilliam Jr. R. Helm Dobbins S. Cabell Dudley Charles T. Canaday Jr. H. Gregg Strader Yearsof Years w/ Position Age Experience AMNB Executive Chairman 67 20 20 President & CEO 53 16 16 Chief Financi
Slide 5: Significant Recent Accomplishments
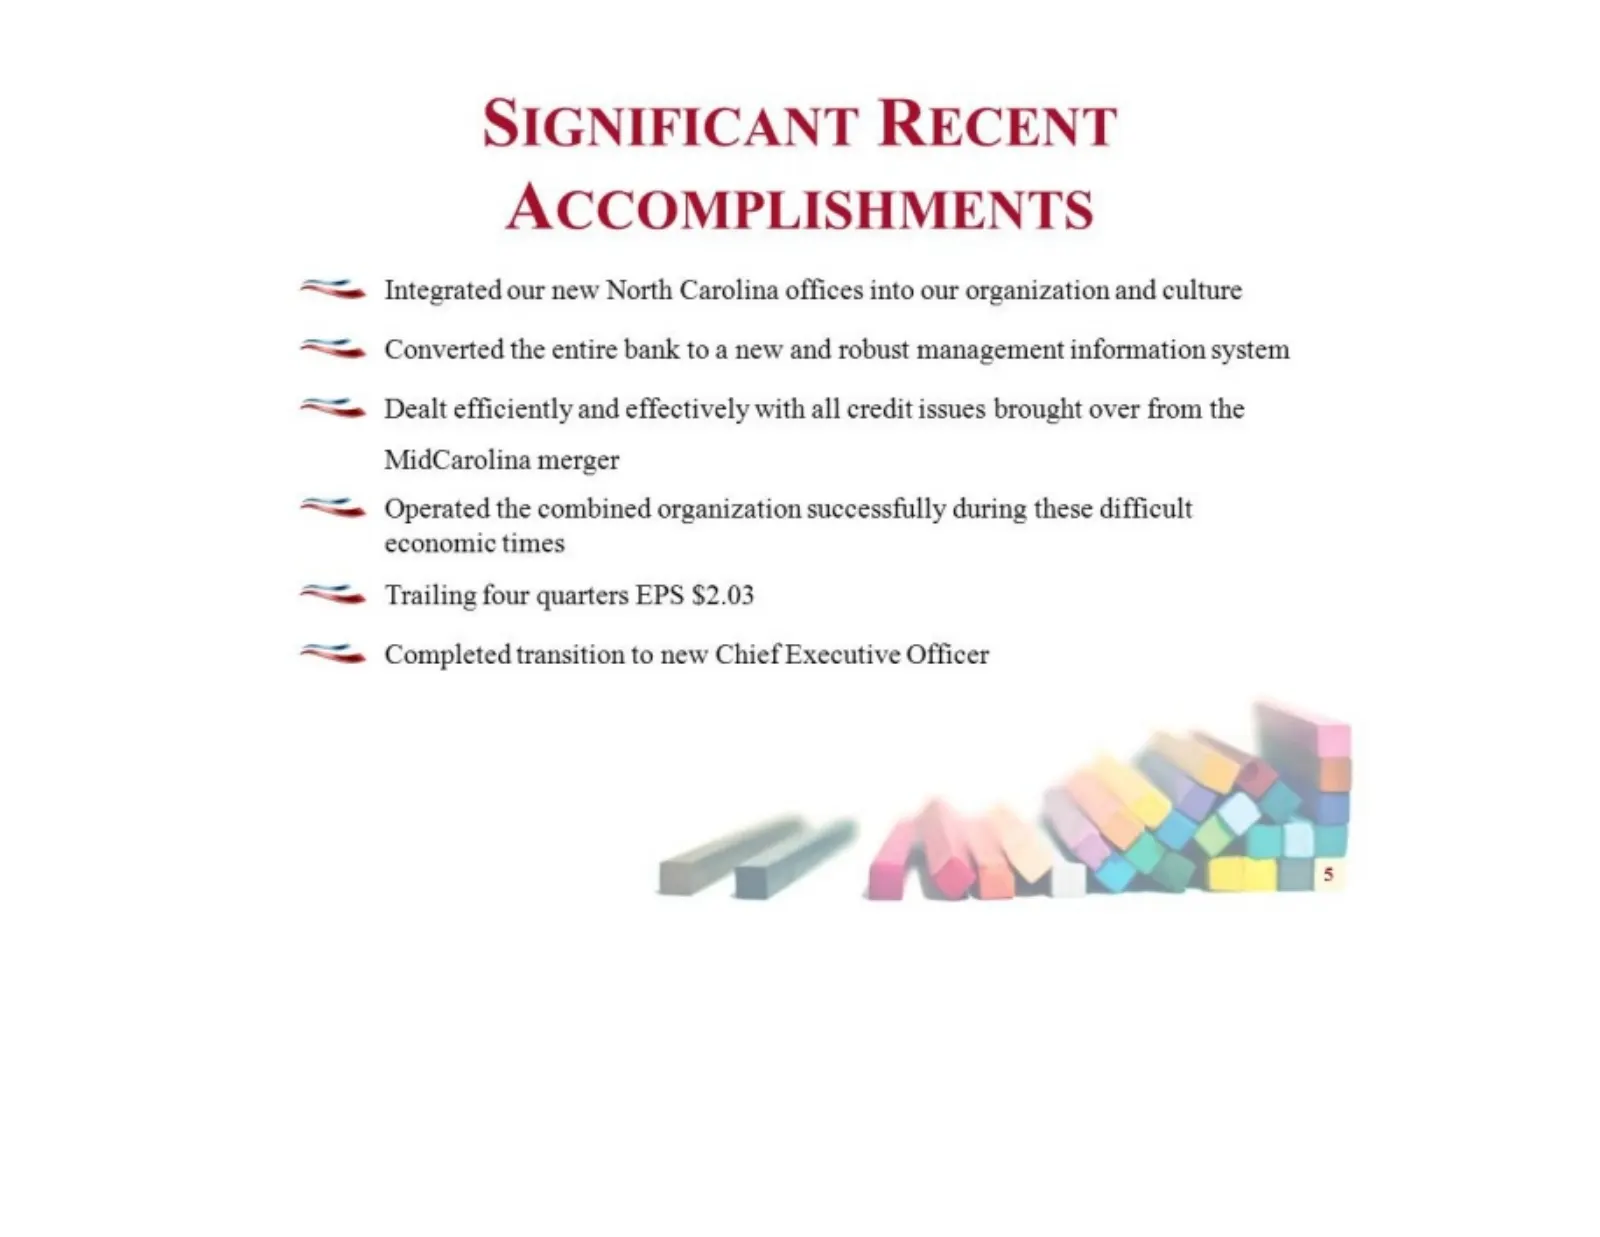
Mii Mf SIGNIFICANT RECENT ACCOMPLISHMENTS Integrated our new North Carolina offices into our organization and culture Converted the entire bank to a new and robust management information system Dealt efficiently and effectively with all credit issues brought over from the MidCarolina merger Operated
Slide 6: Q2 2013 Highlights
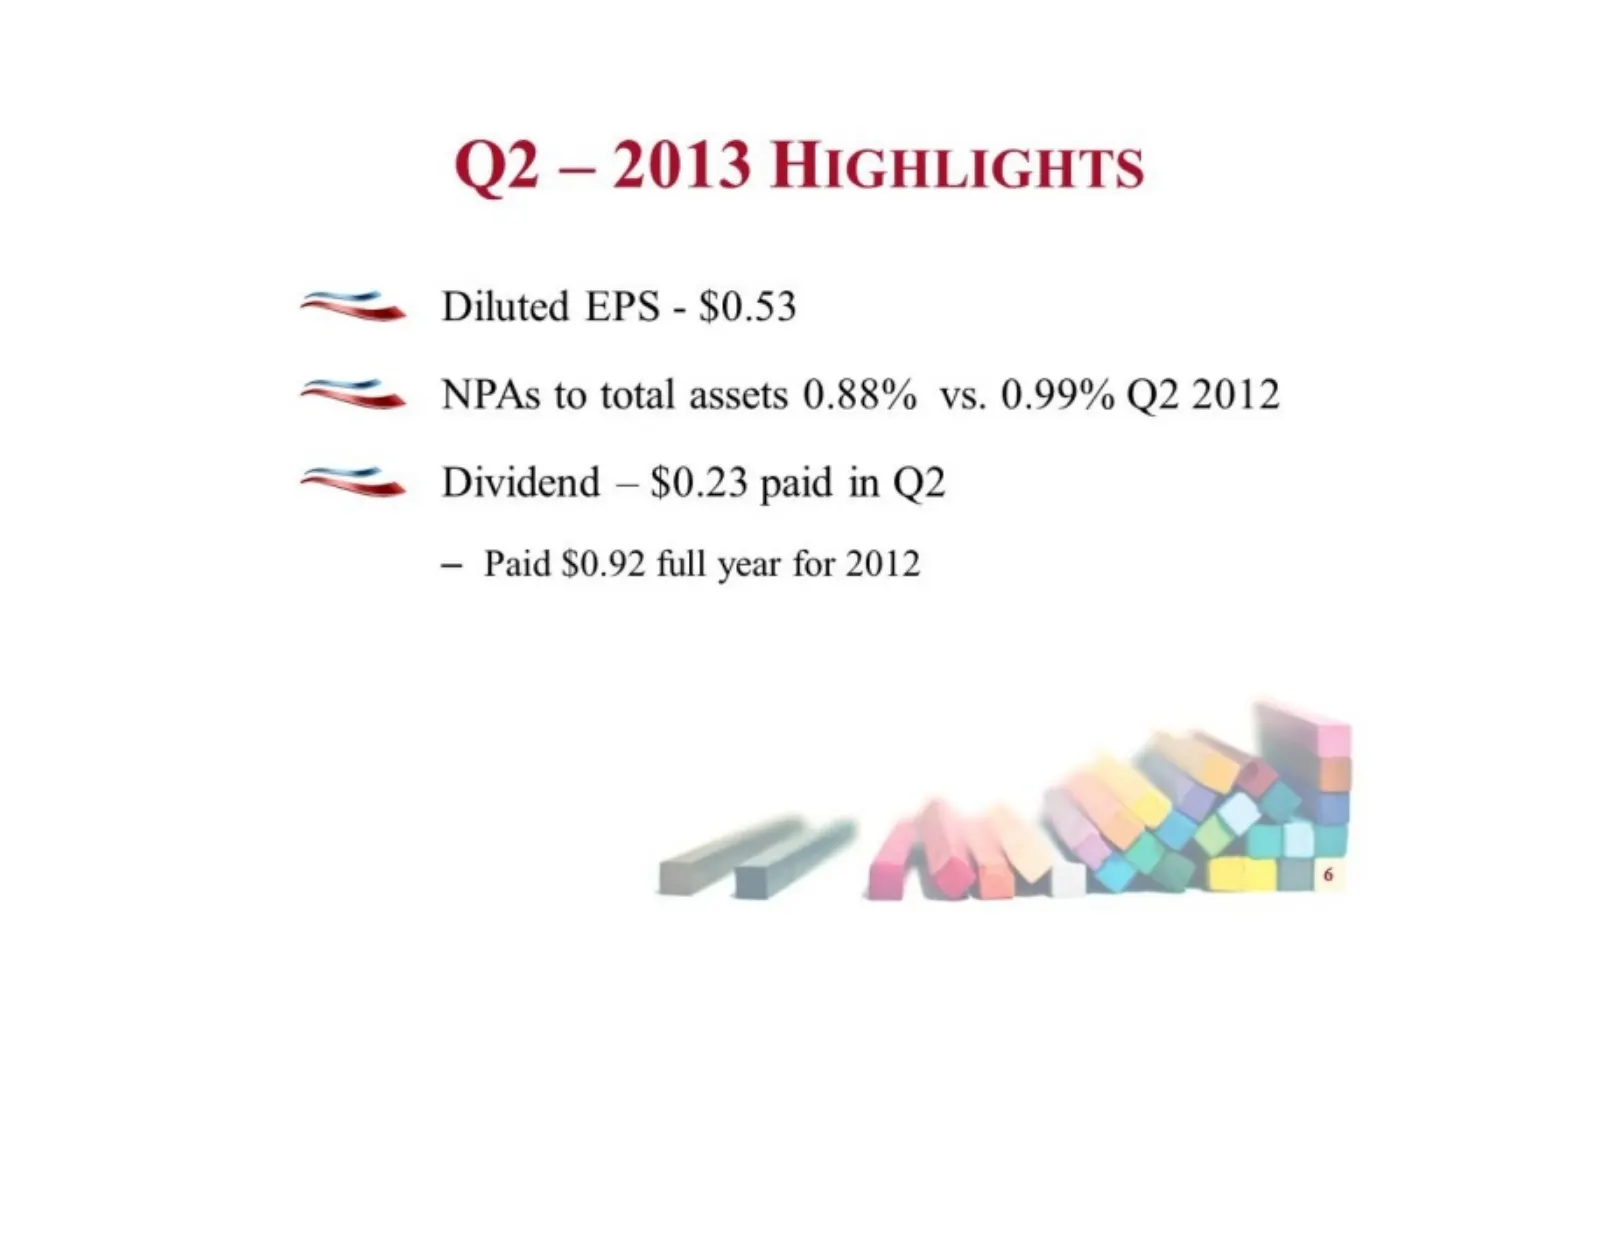
Ki Q2 — 2013 HIGHLIGHTS Diluted EPS - $0.53 NPAs to total assets 0.88% vs. 0.99% Q2 2012 Dividend — $0.23 paid in Q2 — Paid $0.92 full year for 2012
Slide 7: Capital Levels
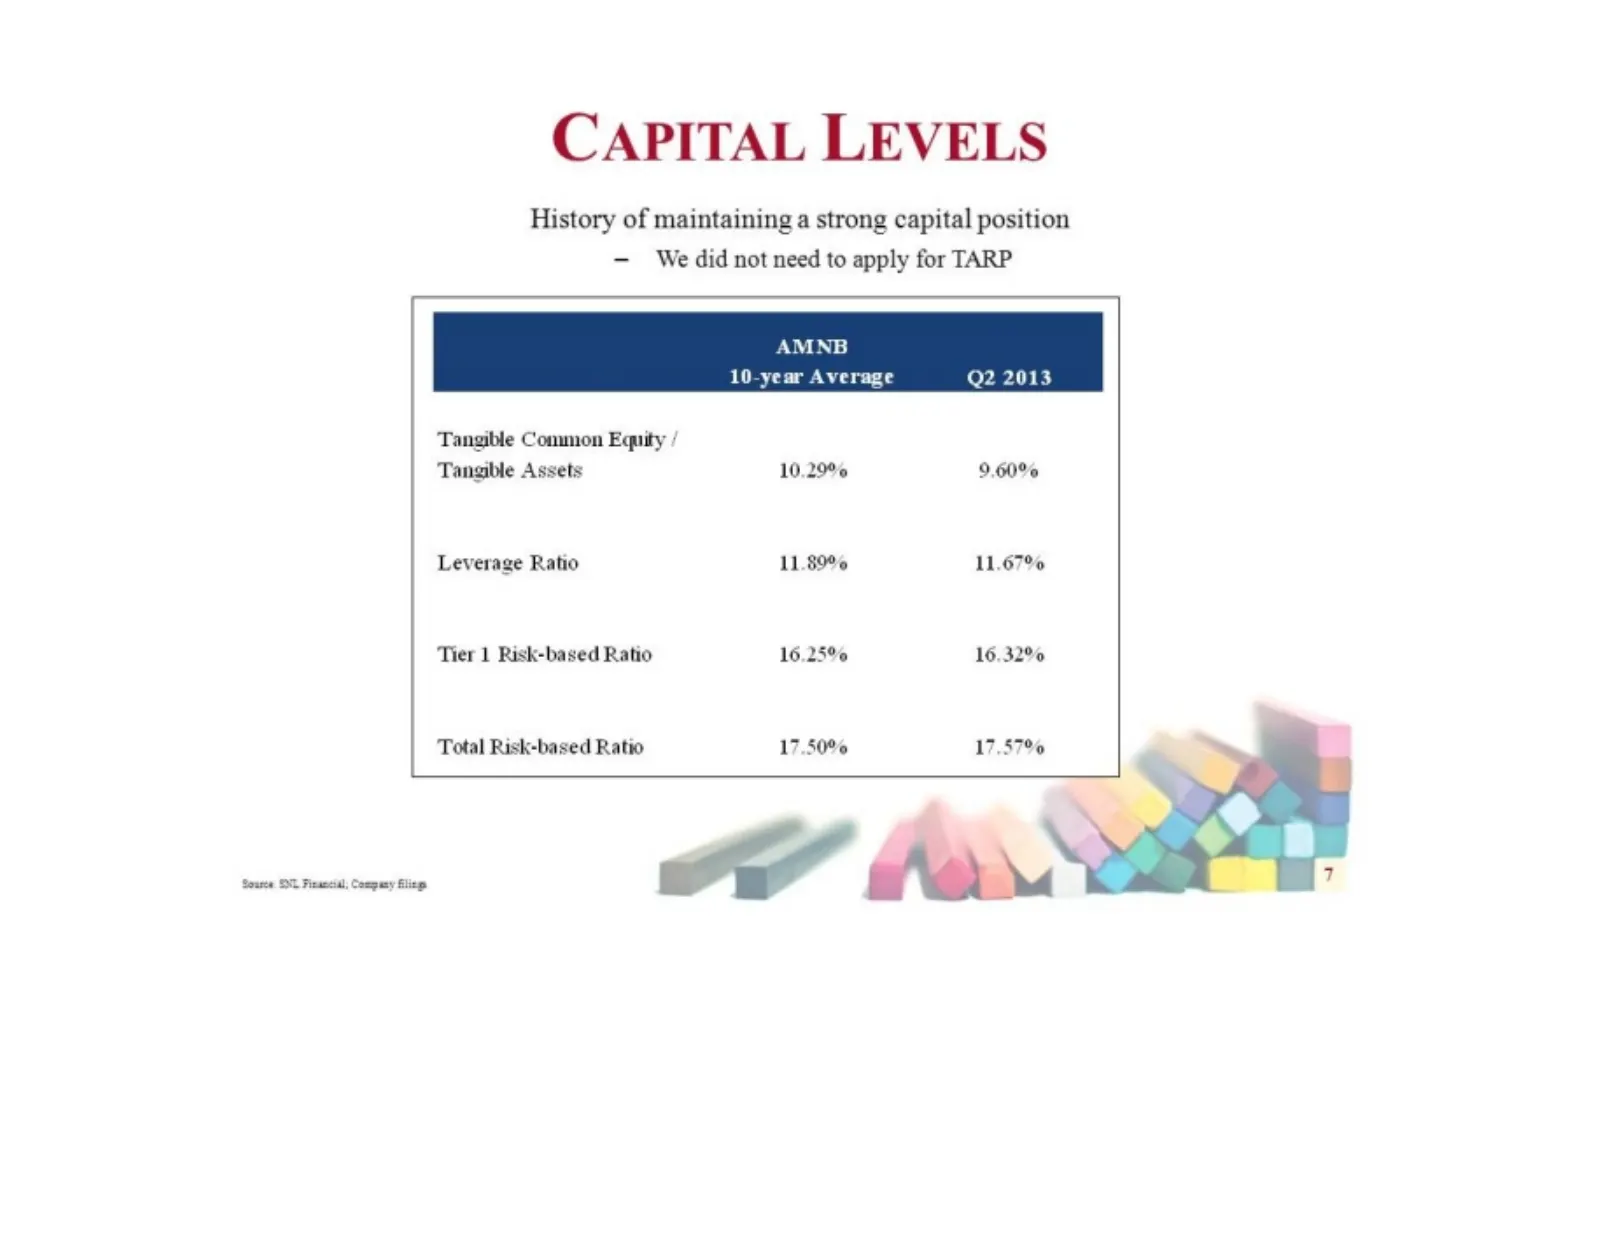
Source CAPITAL LEVELS History of maintaining a strong capital position — We did not need to apply for TARP Q2 2013 Tangible Common Equity / Tangible Assets 10.29% 9.60% Leverage Ratio 11.89% 11.67% Tier 1 Risk-based Ratio 16.25% 16.32% Total Risk-based Ratio SO Fieancal, Company Bliss
Slide 8: Nationwide MRQ Comparison
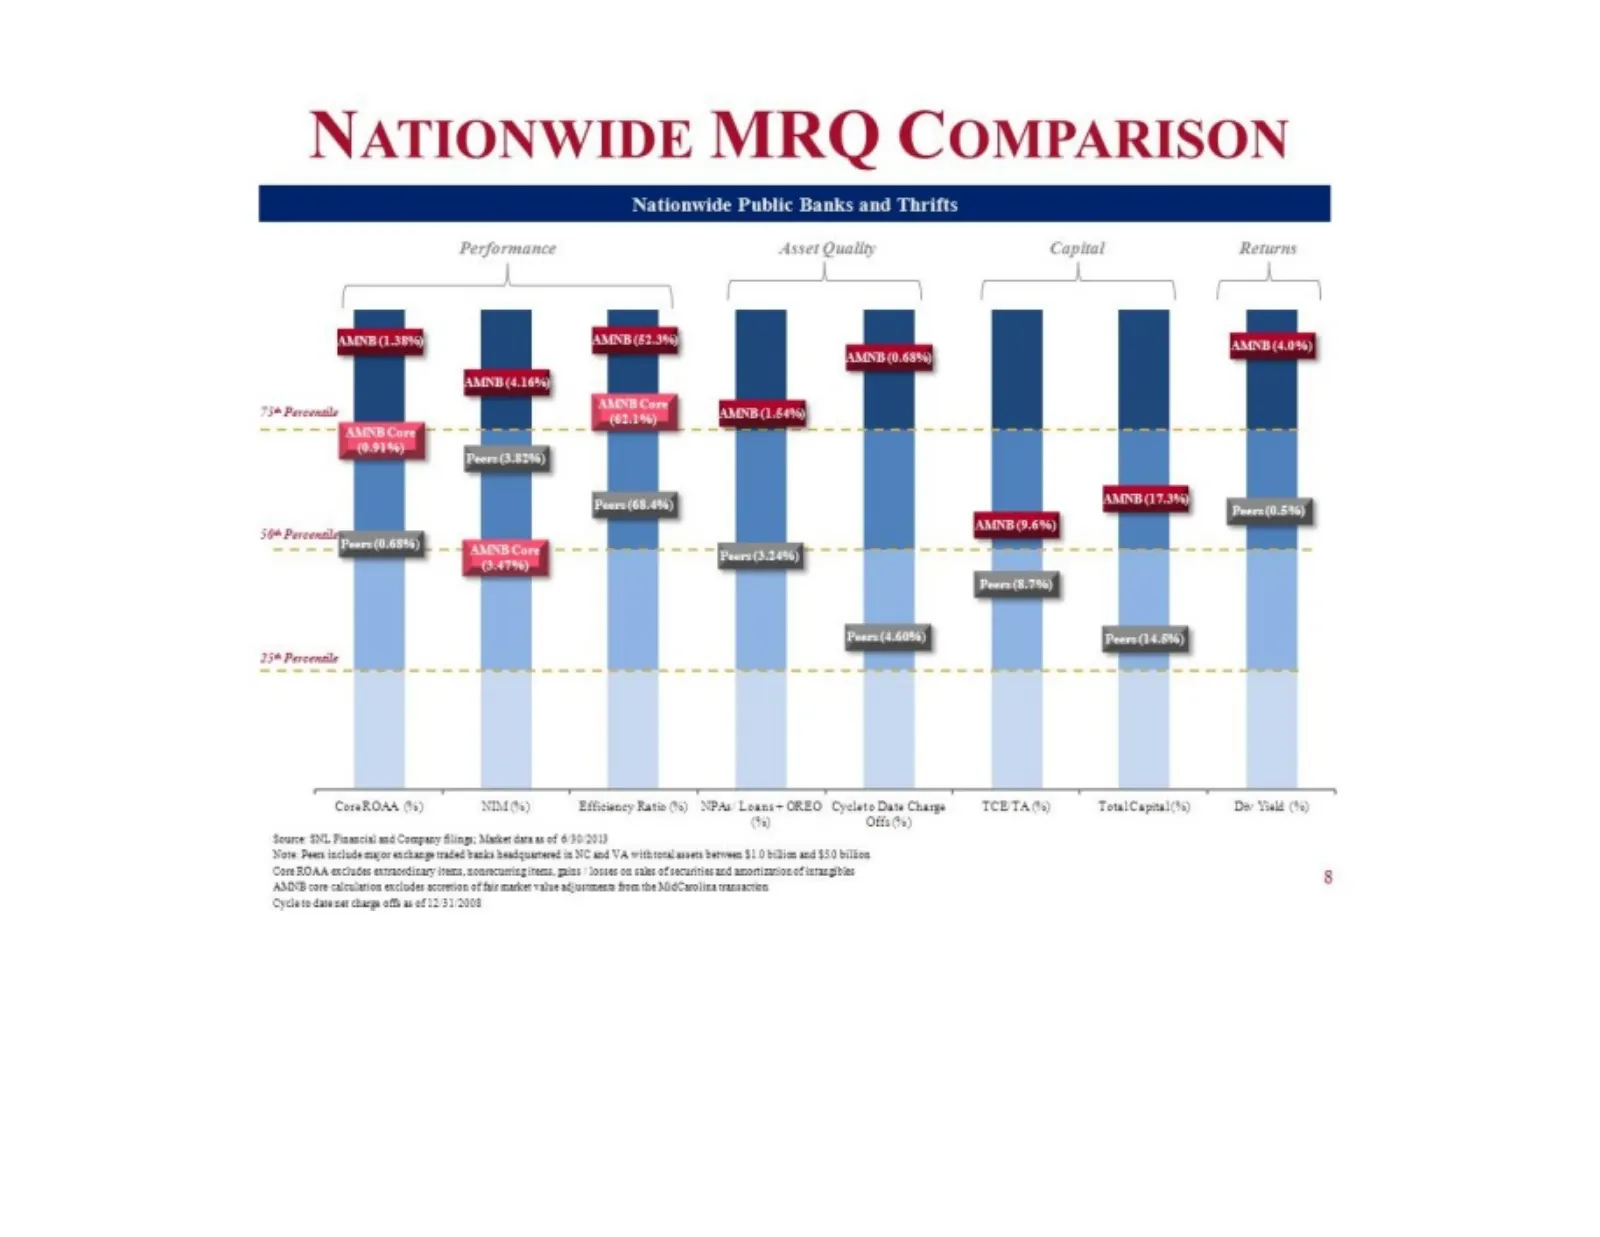
NATIONWIDE MRQ COMPARISON Natic Je Public Banks and Thrift Performance Asset Quality Capital Returns | \ j j { \ 758 Pereomaile -----—i - - --- -- -- CersROAA NIMC Eificisney Ratios) NPAs Leans~OREO CyclateDats Charge = TCE TA TotlCapial( ts * Offs) Source S02 Piamscin est Company Slings; Master dar
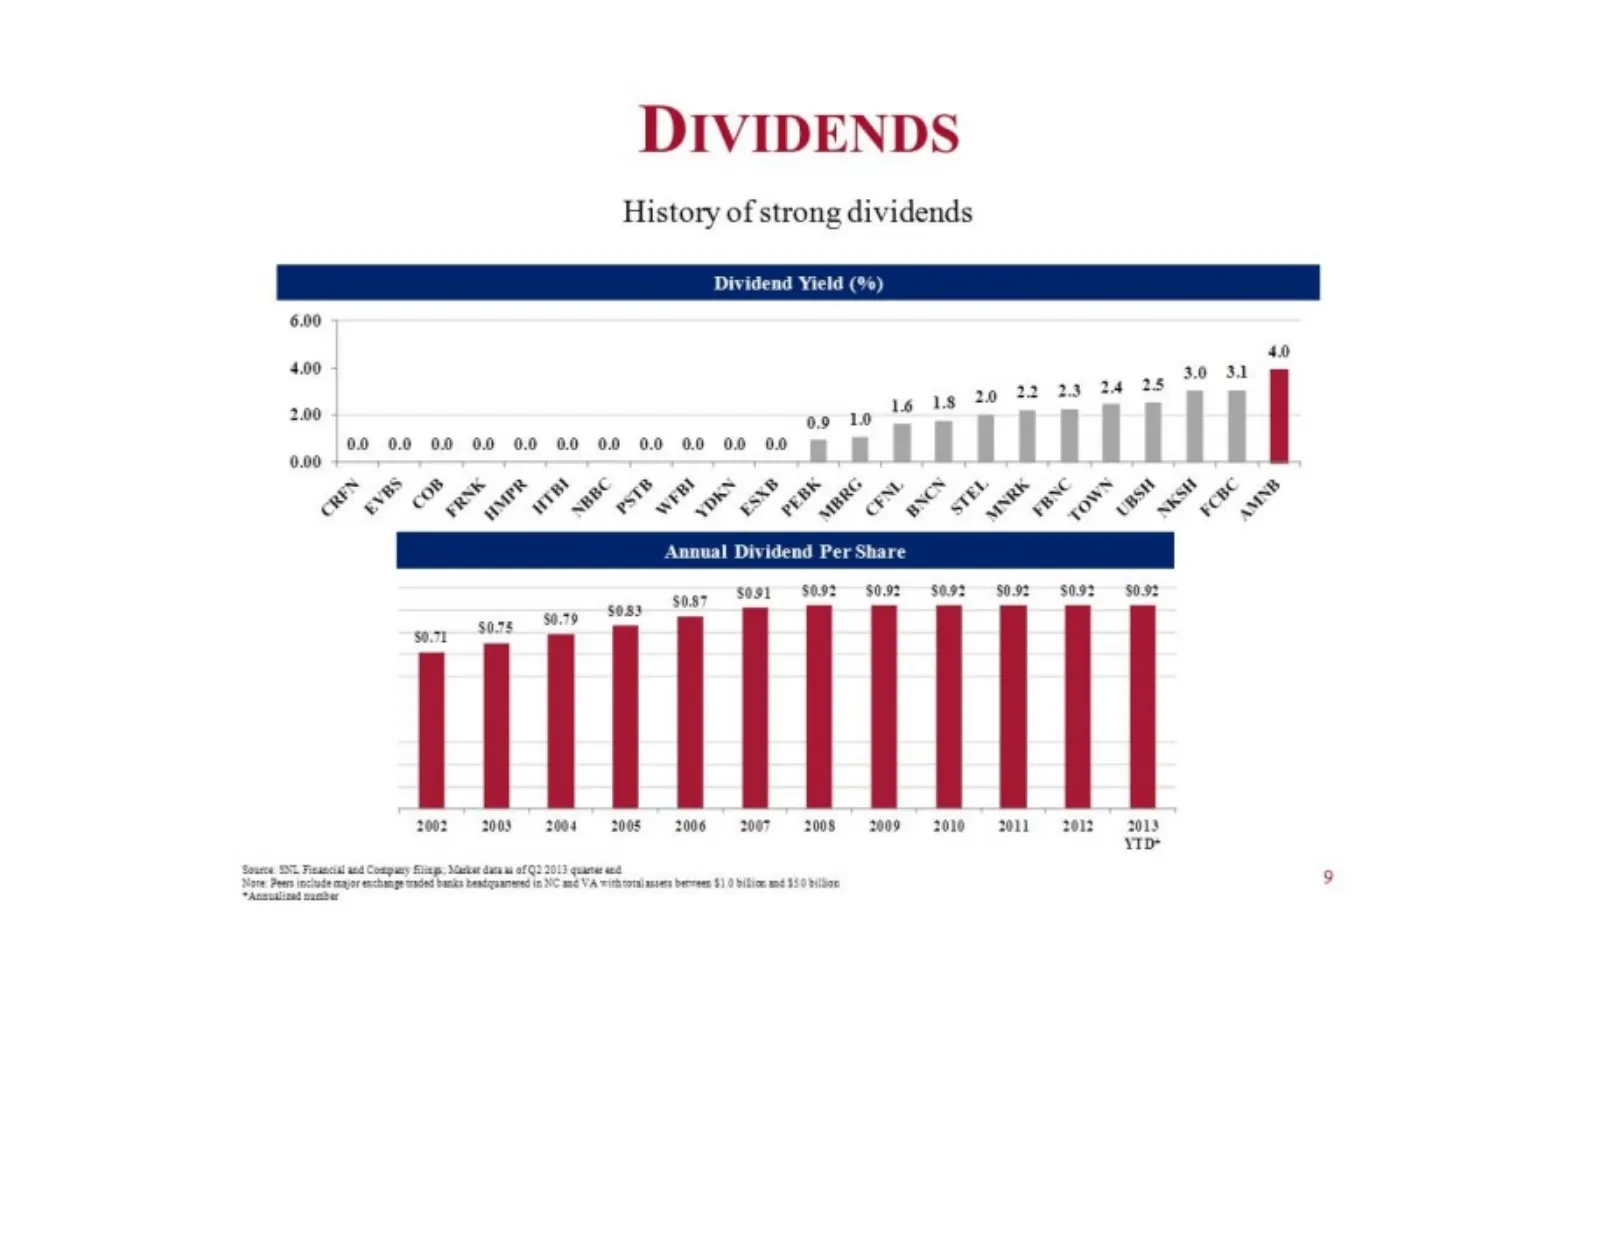
Slide 9: Dividends
DIVIDENDS History of strong dividends Dividend Yield (%) 6.00 40 4.00 5 2.00 0.00 + 2 s $092 $0.92 $092 $0.92 $0.92 $0.92 $0.75 2002 2003 3 9 2010 211 2012 2013 vID> al ued Company Slings, Madhur daa as of 2 20 ajar exchange sade baniks bextquarmme in
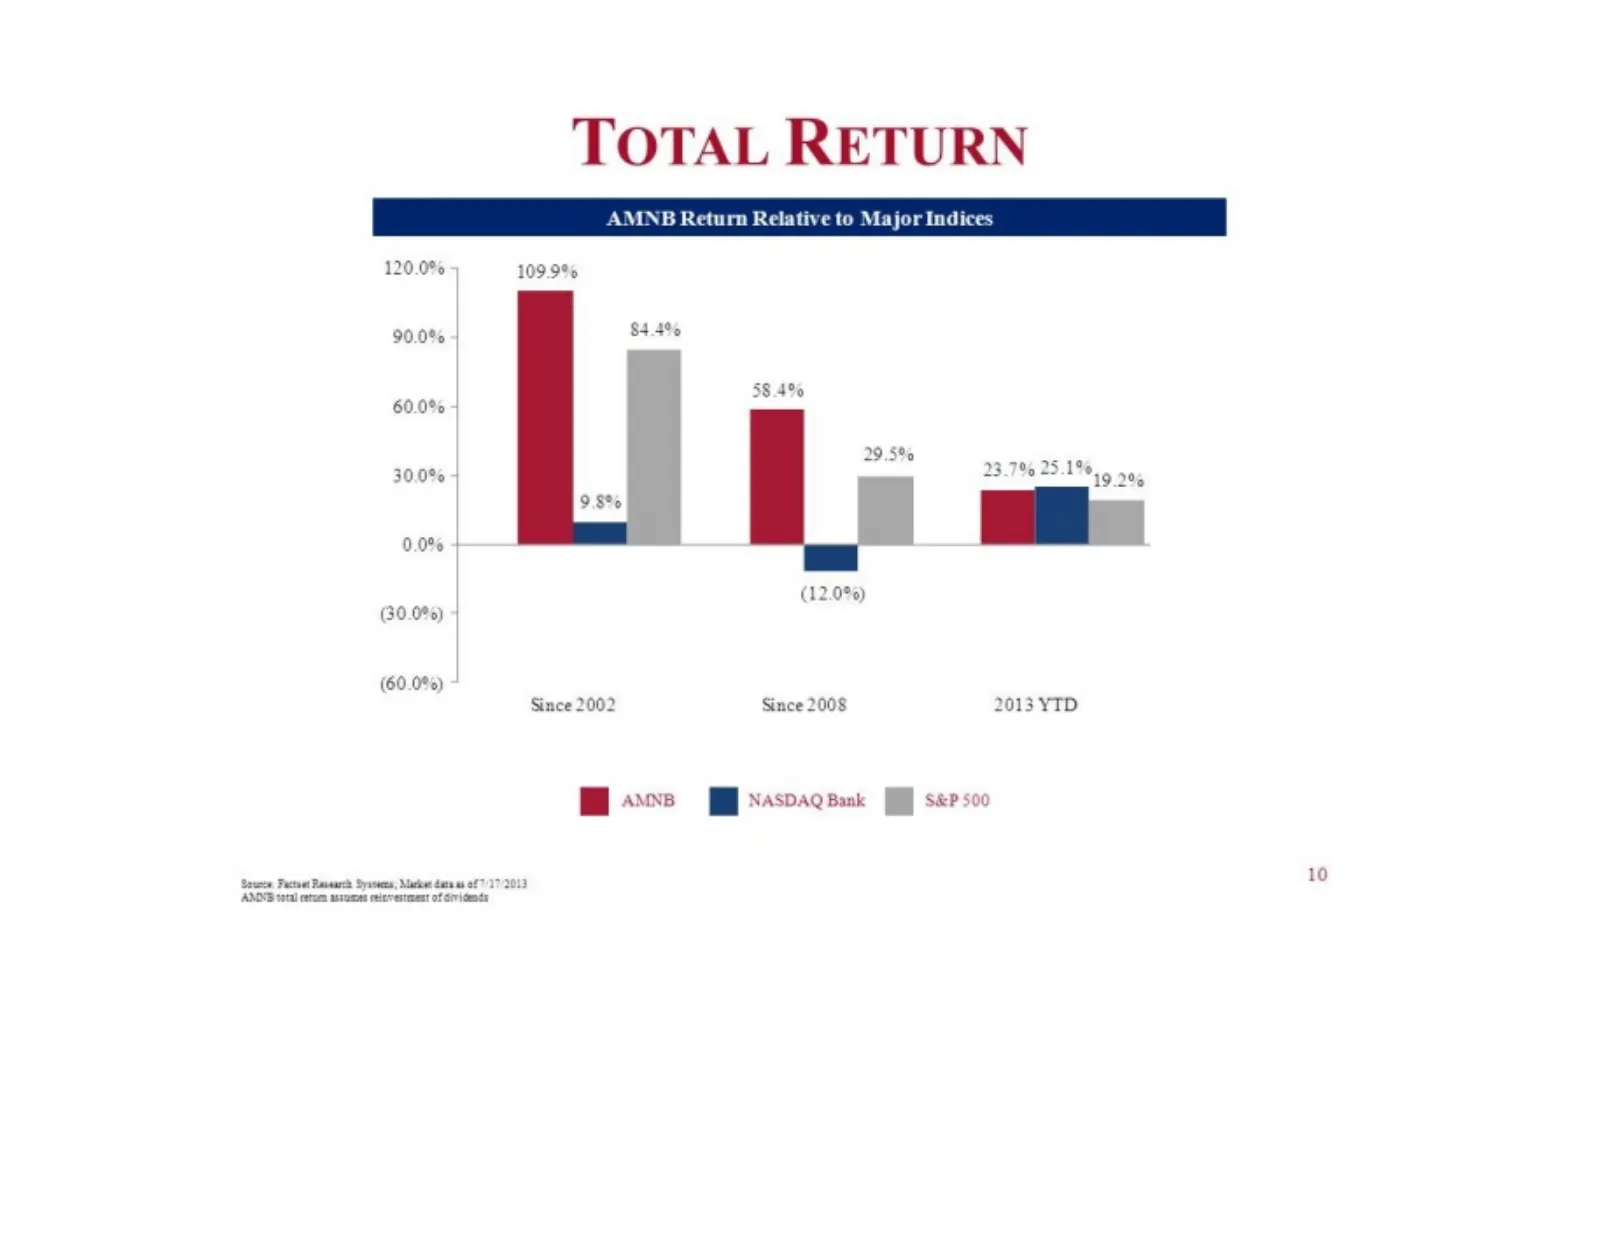
Slide 10: Total Return
TOTAL RETURN AMNB Return Rek to Major Indices 120.0% 4 109.9% 90.0% 4 84.4% 38.4% 60.0% + 29.5% 30.0% + o L 0.0% + (12.0%) (30.0%) + (60.0%) Since 2002 Since 2008 2013 YTD Hy woe BP saspaqnank fj ser soo Soumce Factuet Research Syaneens, Macioee data. 10 AND trac trae mcrae of
Slide 11: Financial Performance
Financial Performance «ee
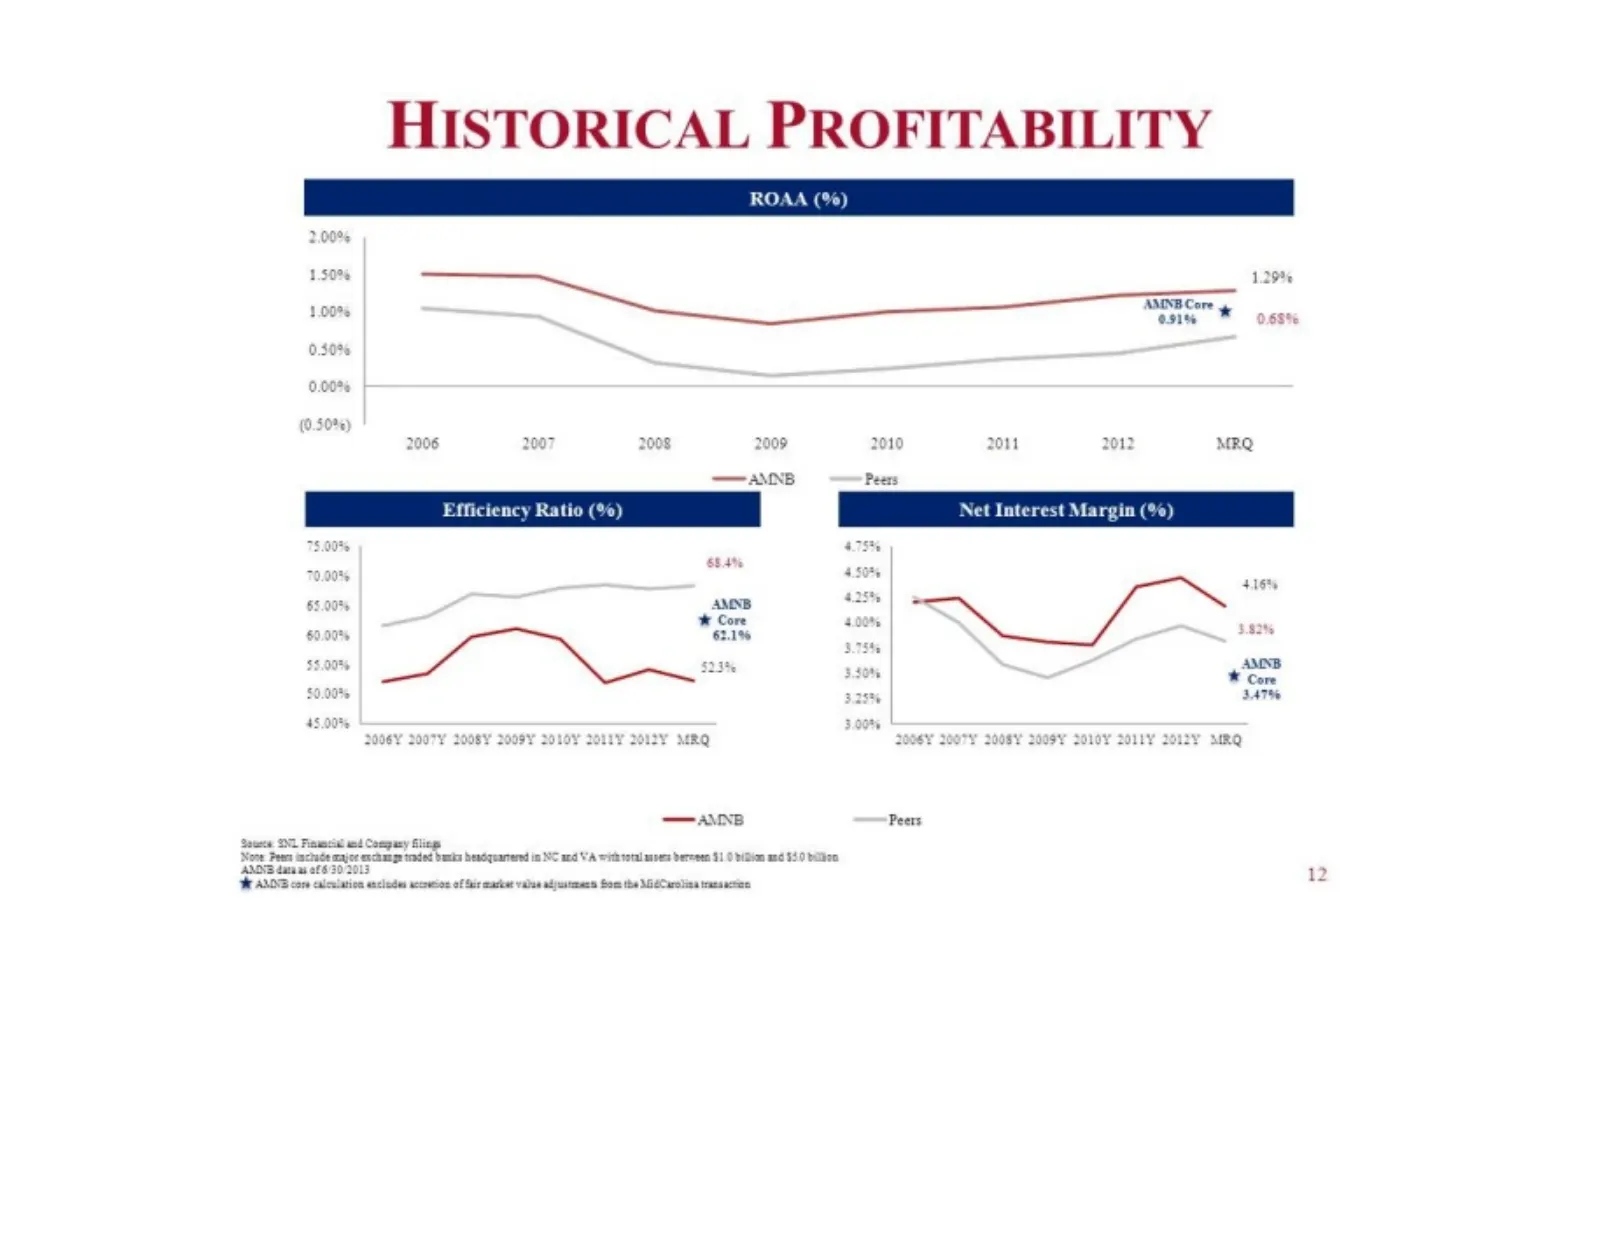
Slide 12: Historical Profitability
HISTORICAL PROFITABILITY 1.50% 129% 1am Mae sss 0.50% 0.00% (0.50%) 2006 2007 08 2009 2010 2011 2012 MRQ Peers 475% ANB Peers Cand WA withoacal avers Dernnen $1 0 biDion ané $50 balboa
Slide 13: Diverse Revenue Stream
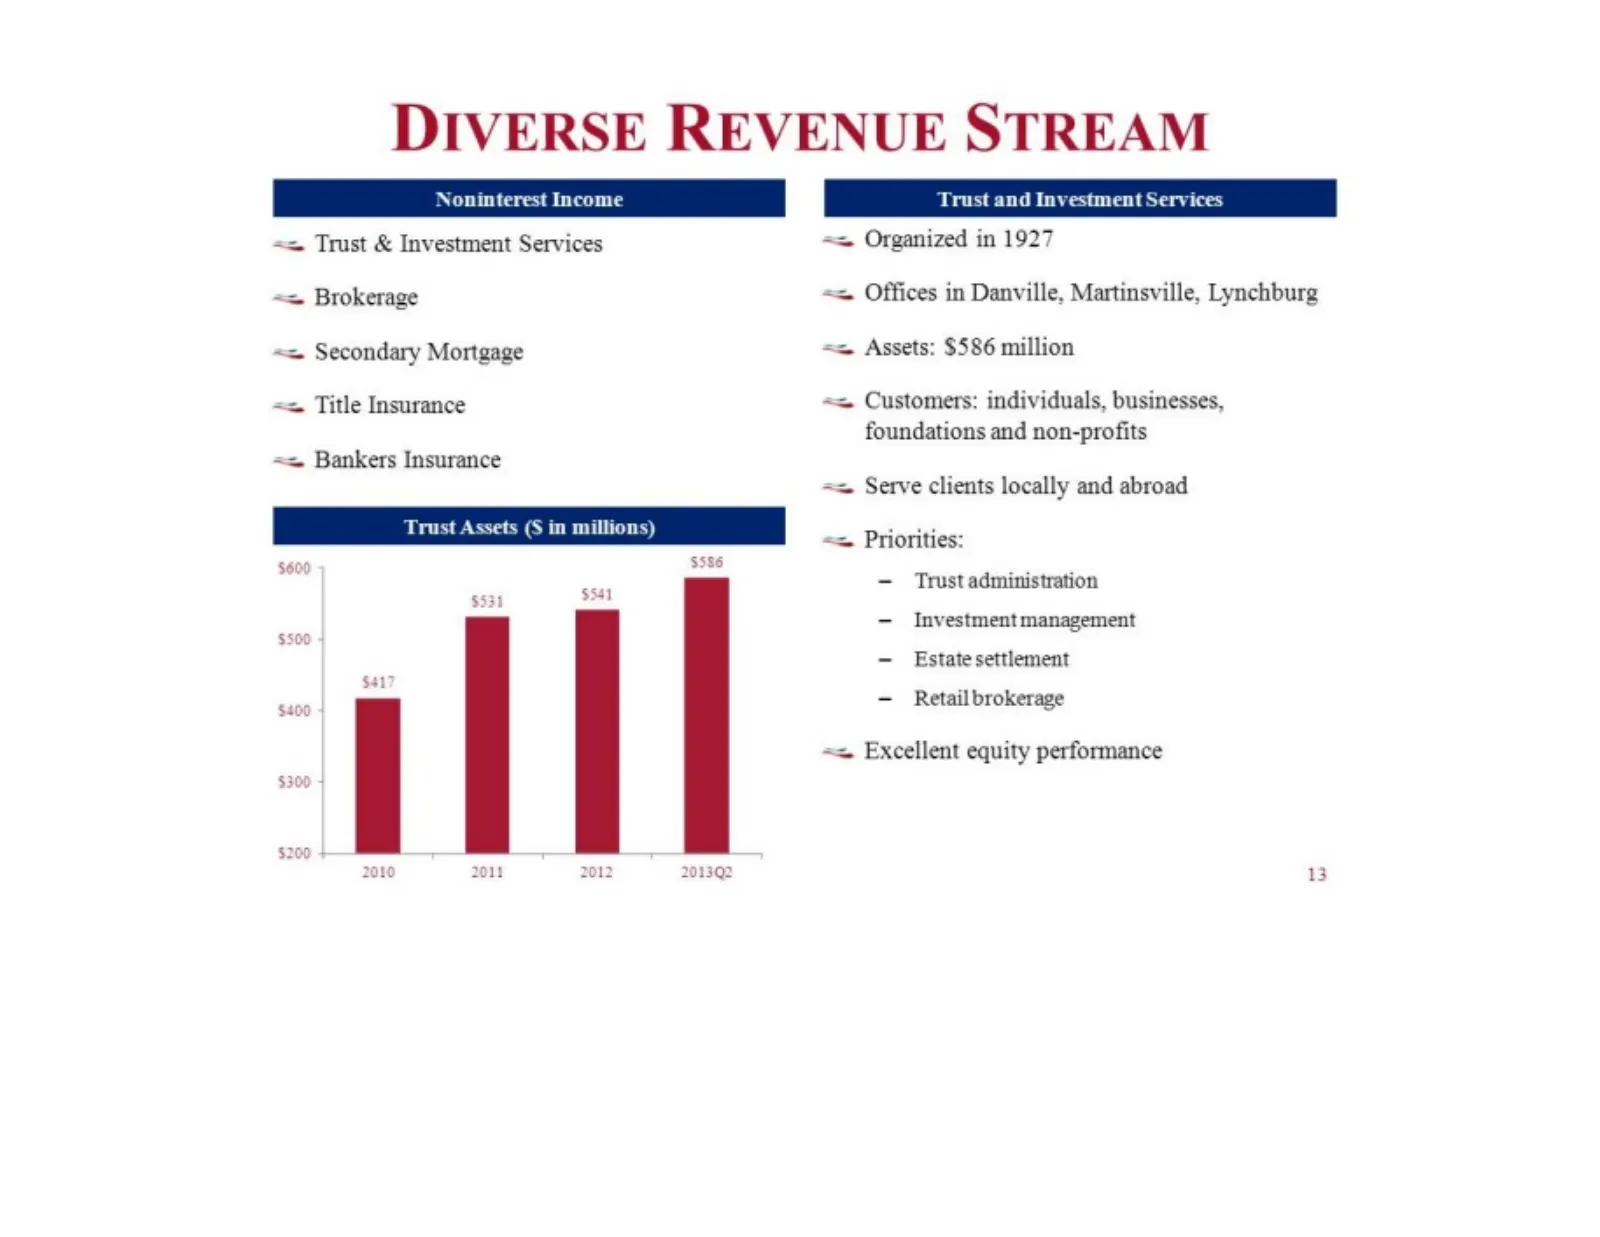
DIVERSE REVENUE STREAM == Trust & Investment Services == Organized in 1927 == Brokerage <= Offices in Danville, Martinsville, Lynchburg <= Secondary Mortgage == Assets: $586 million == Title Insurance == Customers: individuals, businesses, foundations and non-profits == Bankers Insurance == Serve cl
Slide 14: Loan Portfolio
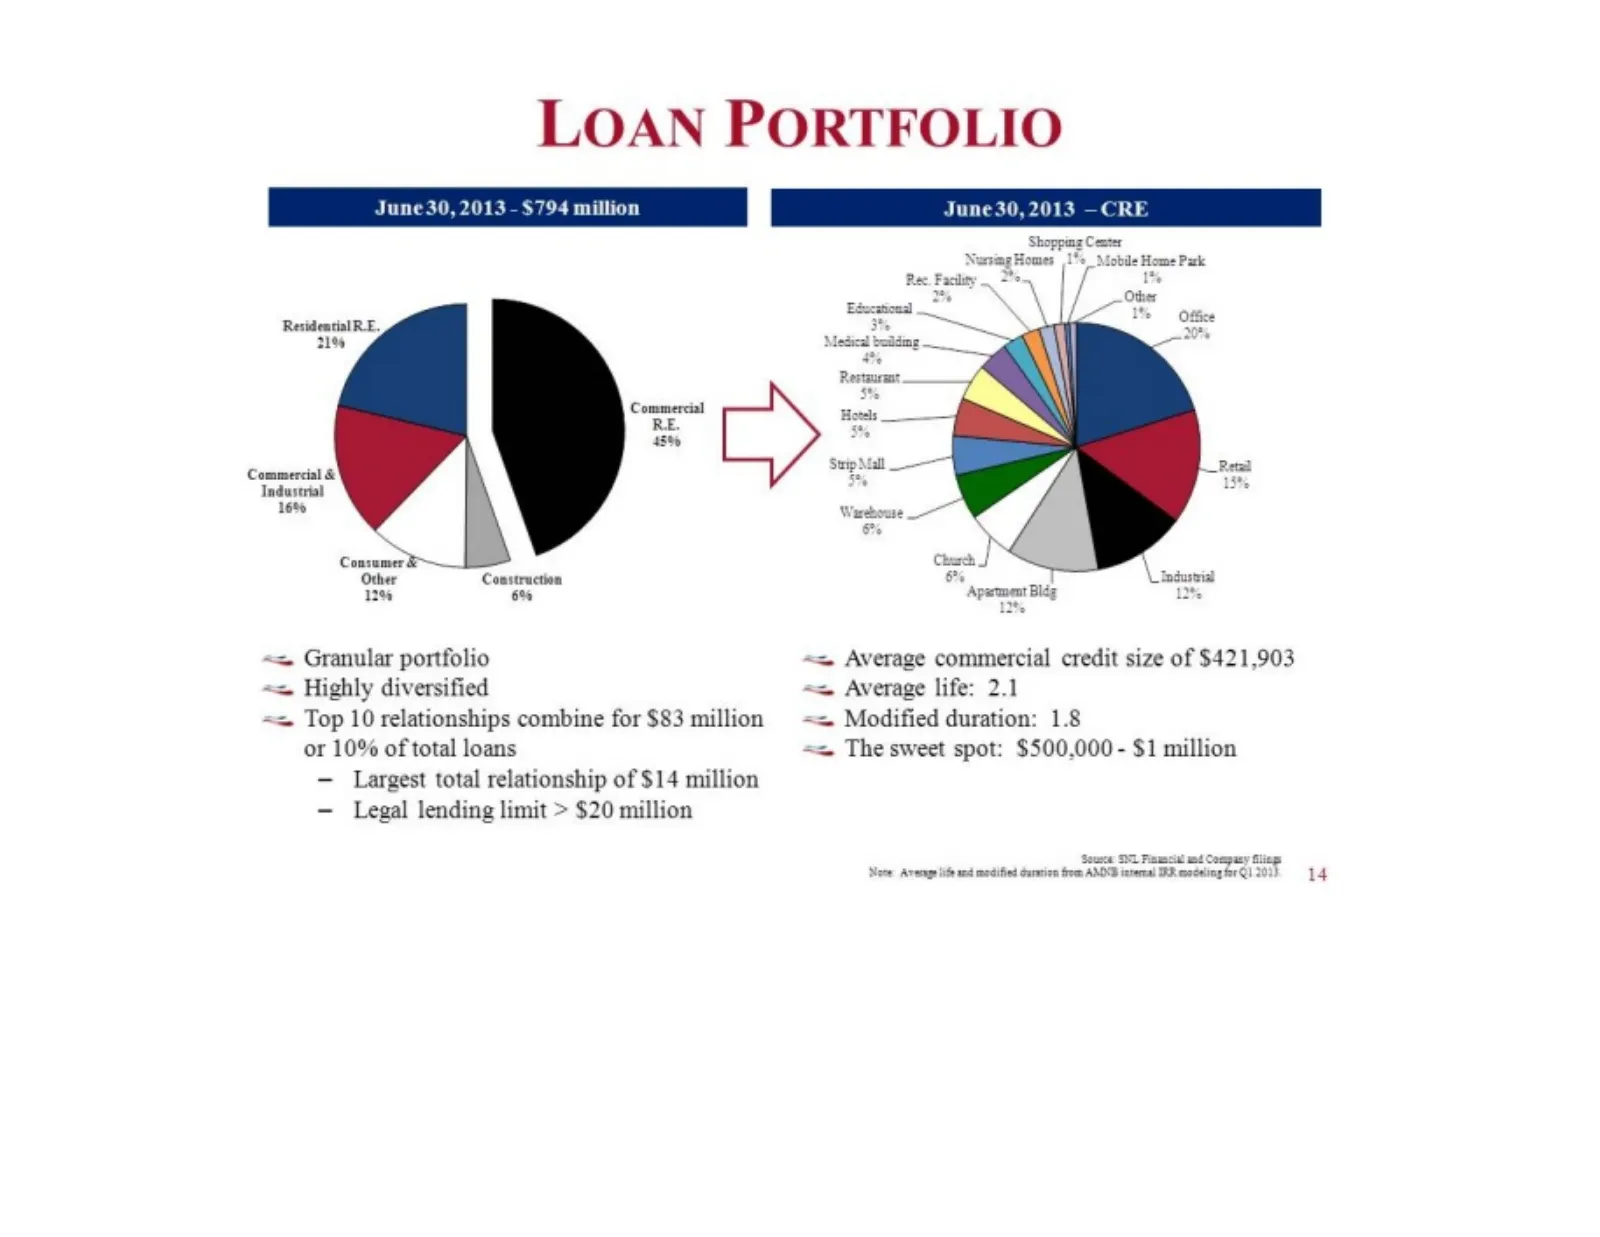
LOAN PORTFOLIO June 30, 2013 - $794 million Residential RE. 21% Commercial & Industrial 16% Consumer &— Construction 12% 6% «= Granular portfolio == Highly diversified == Top 10 relationships combine for $83 million or 10% of total loans — Largest total relationship of $14 million — Legal lending li
Slide 15: Underwriting Process
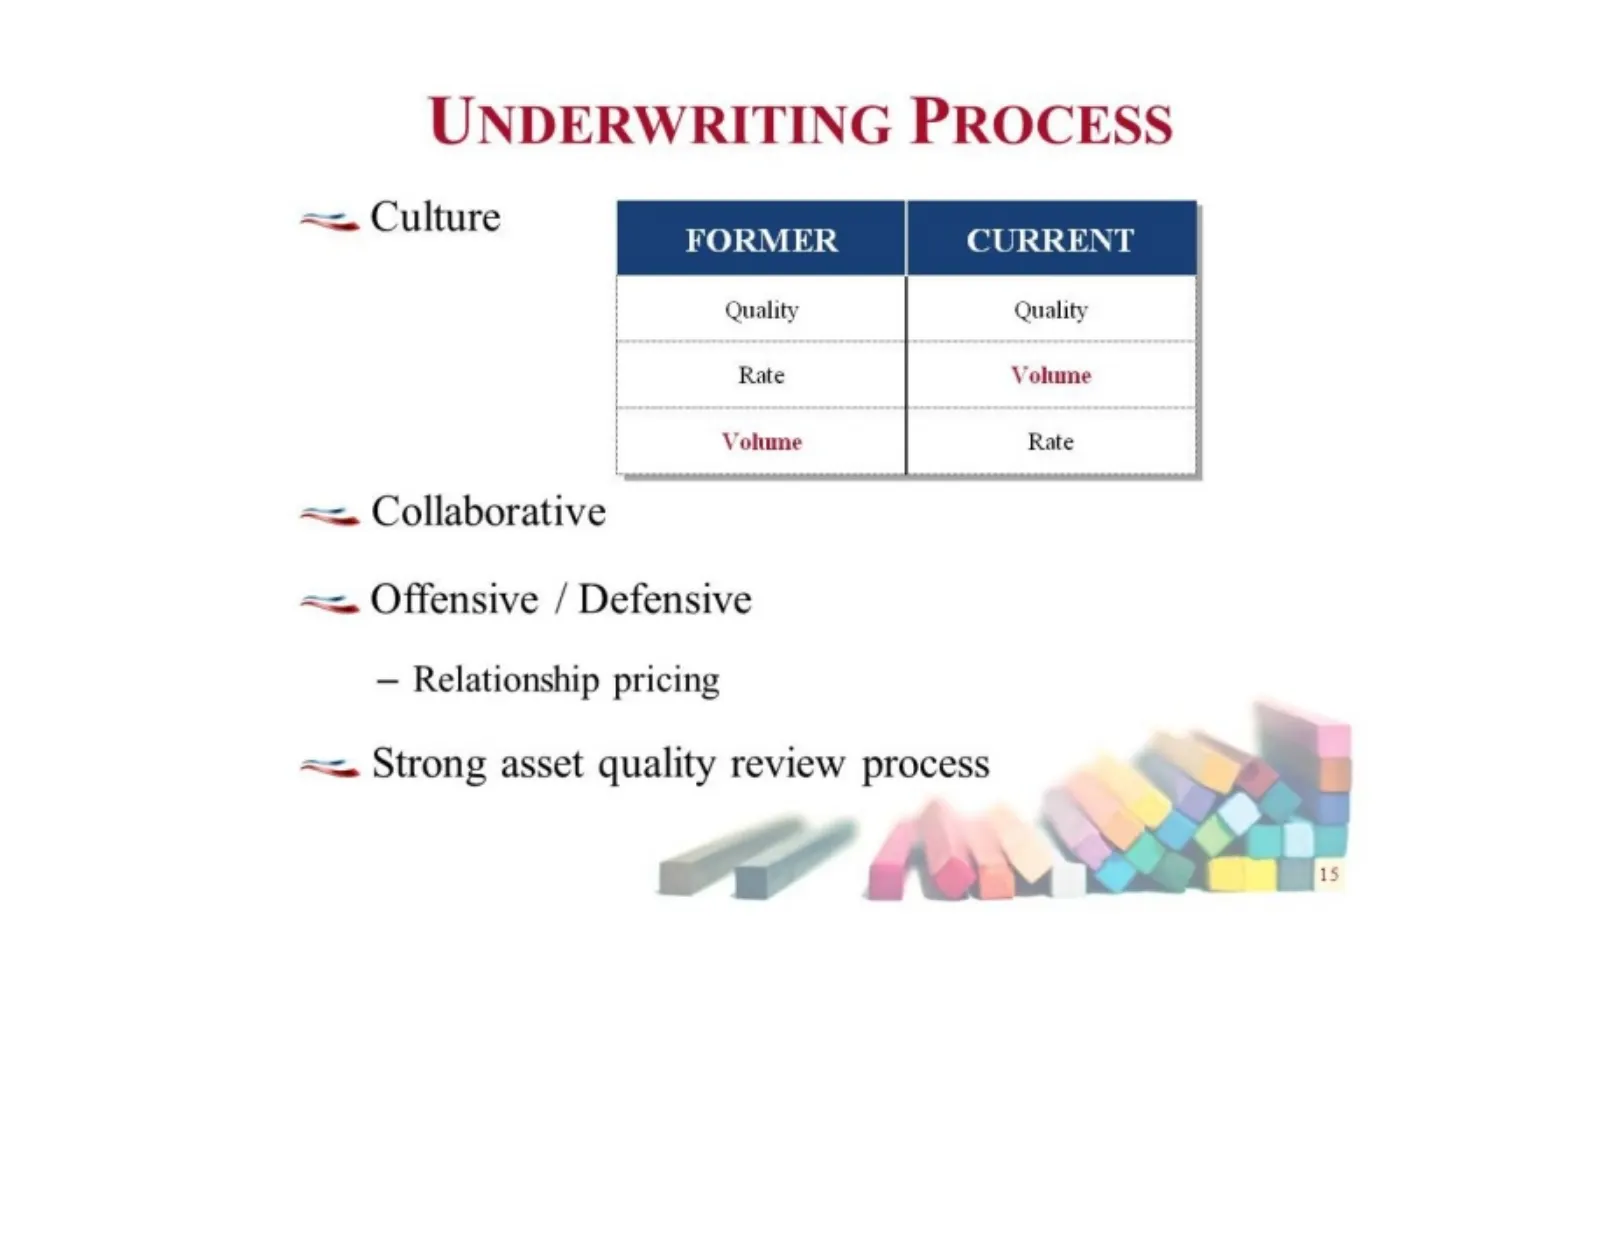
UNDERWRITING PROCESS == Culture ==. Collaborative == Offensive / Defensive — Relationship pricing == Strong asset quality review process CS Mer.
Slide 16: Superior Asset Quality
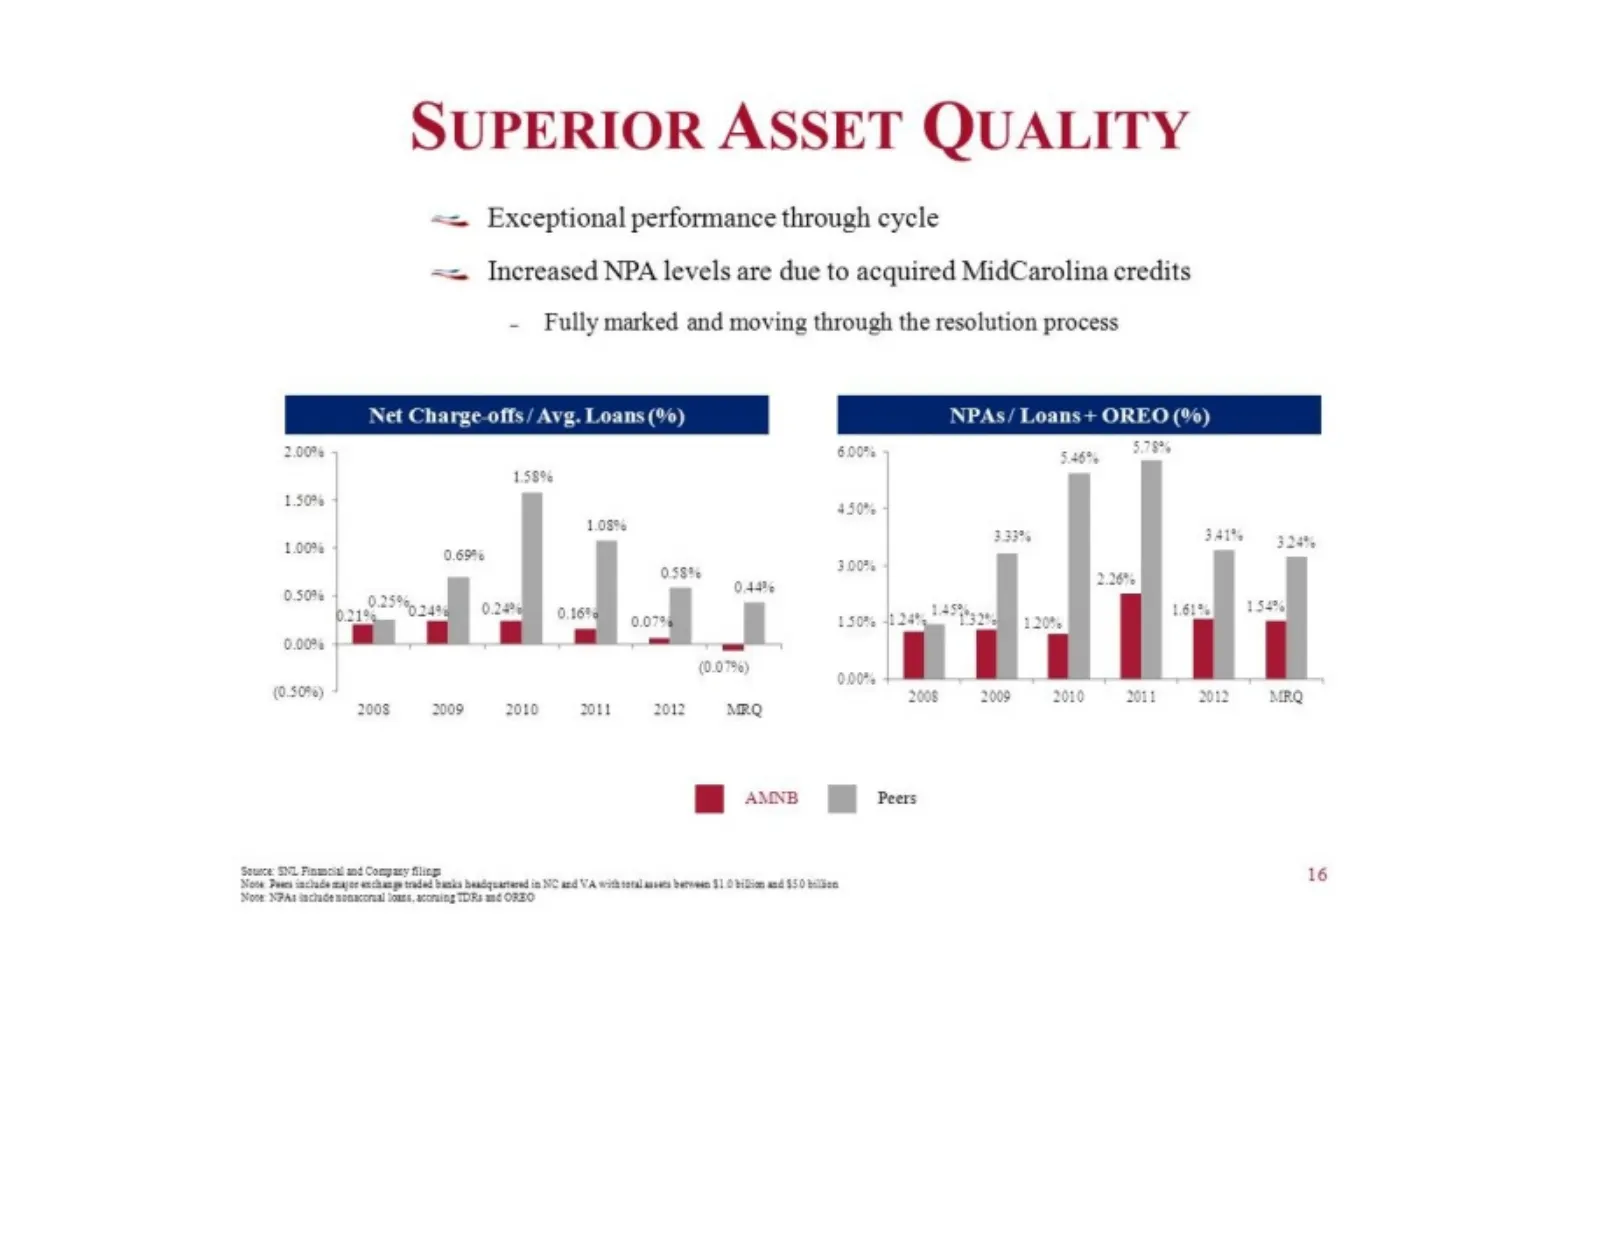
SUPERIOR ASSET QUALITY == Exceptional performance through cycle == Increased NPA levels are due to acquired MidCarolina credits - Fully marked and moving through the resolution process NPA OREO ( 2.00% 600% say 158% 150% | 1.08% 1.00% — oss% 226 O44 clic sg 0.24% . ee | HW (0.07%) (0.50%) x11 2008 «
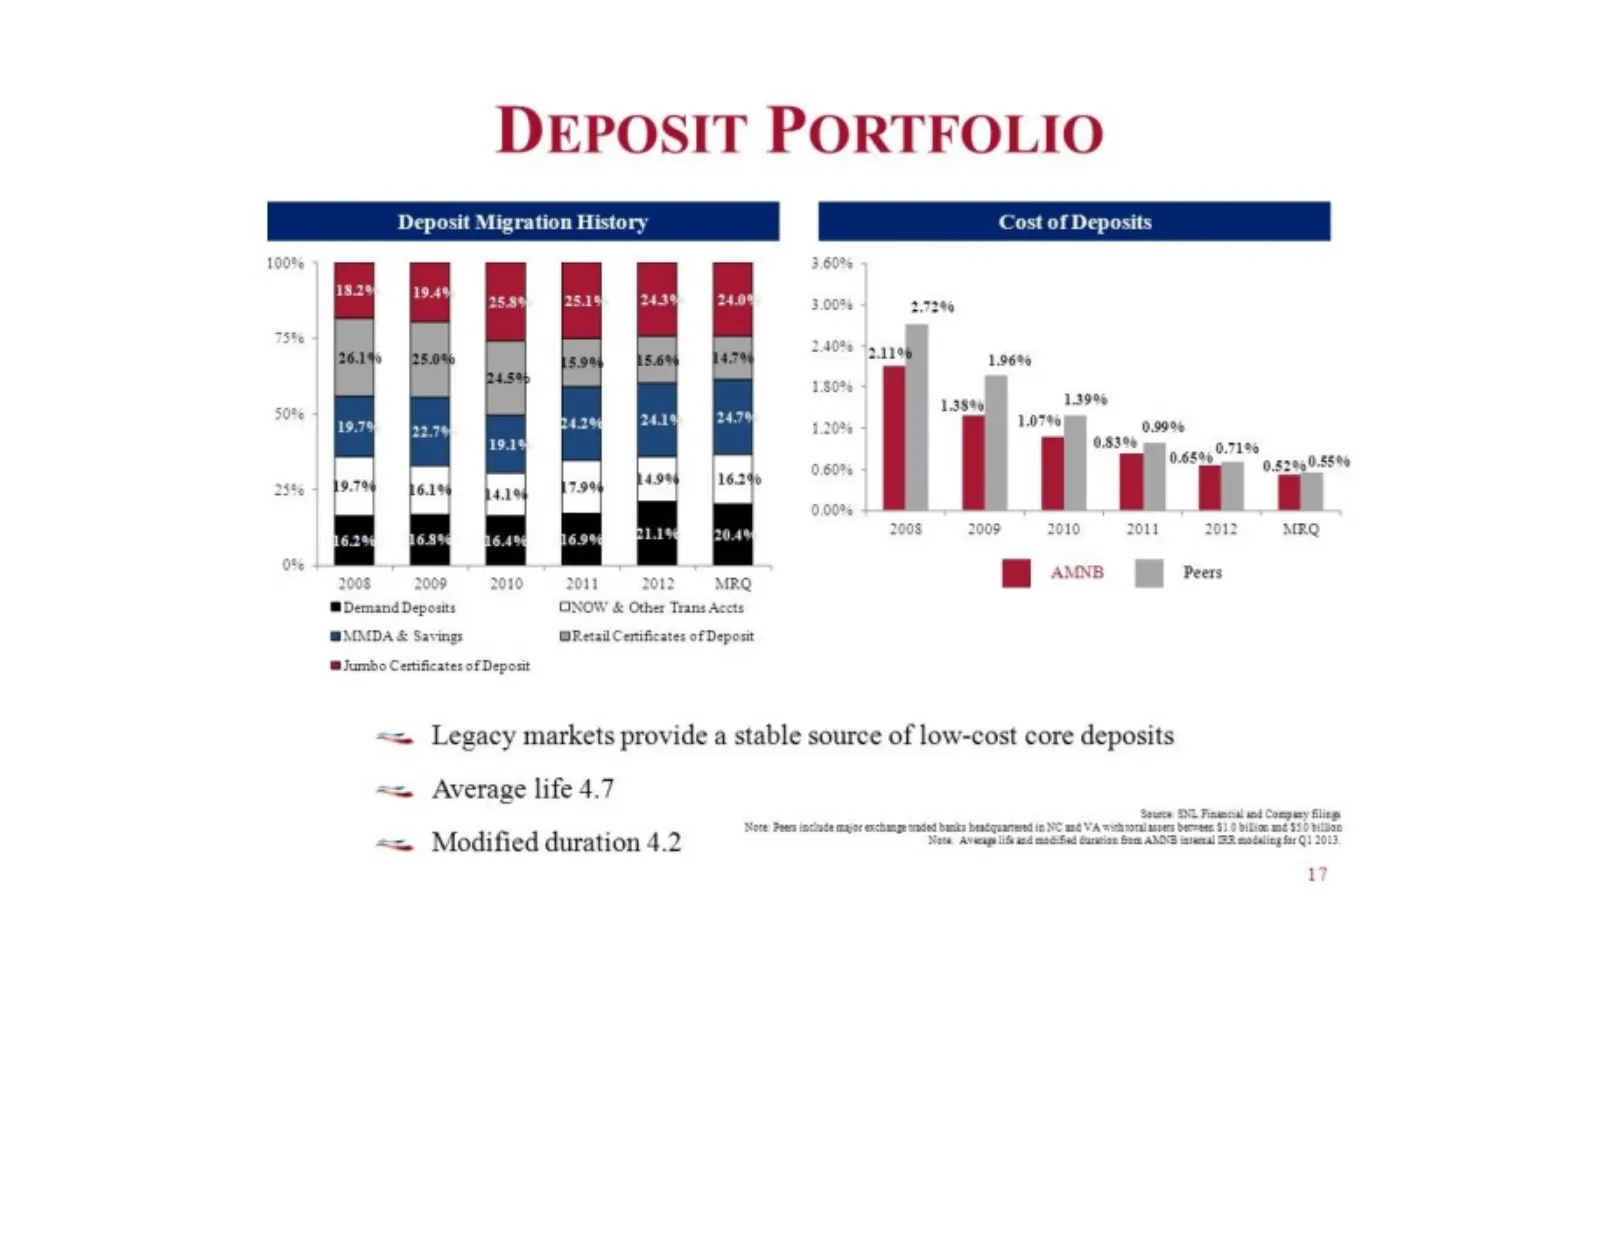
Slide 17: Deposit Portfolio
DEPOSIT PORTFOLIO 190% 3.60% 3.00% 2m 240% fy co 1.96% 180% _ 1380 1.39% 120% 4 1.07% 0.99% 033 5 o71% 0.60% bee 0.82950.58% bf fe ia 0.00% . 2008 += 2009S «2010S 2011S 2012, MQ 0% : i 2008 = 2009 2011 «2012, MRQ Bi ovce Oh res WDemand Deposits ONOW & Other Trans Accts |NIMDA & Savings Retail Centif
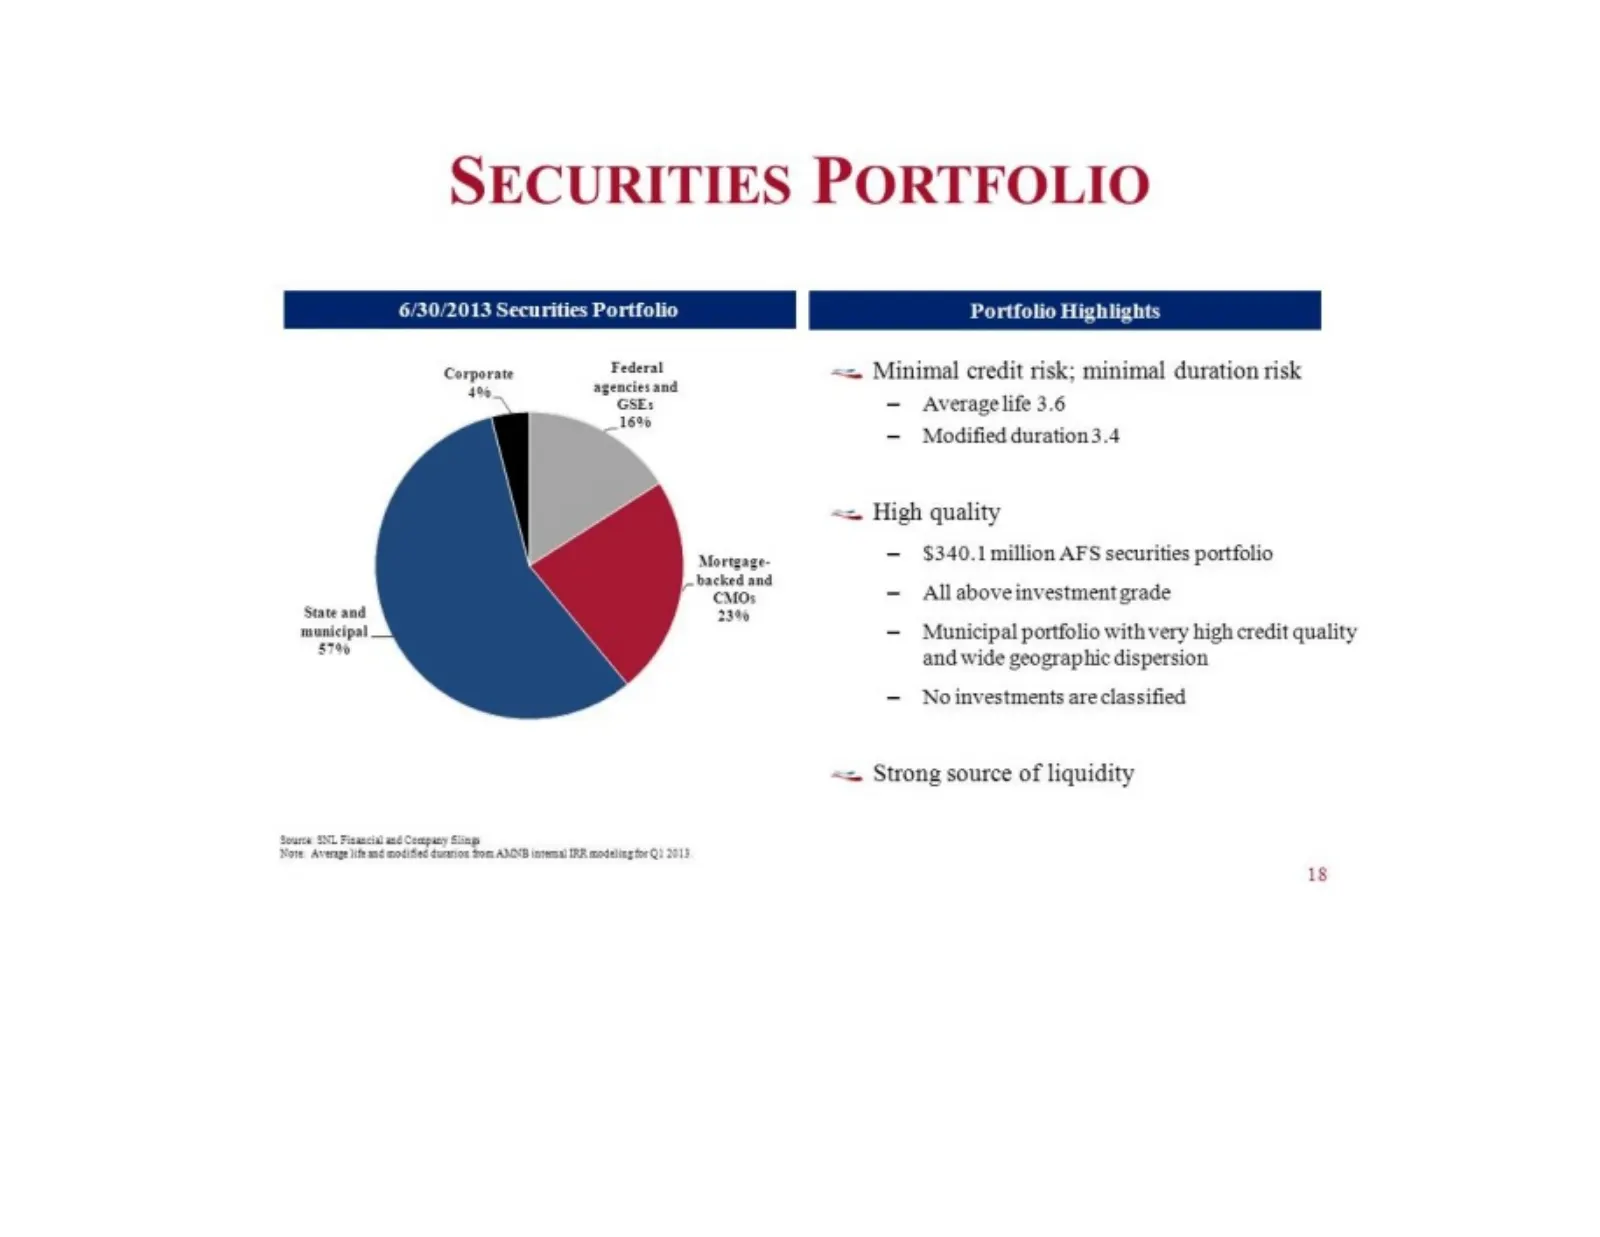
Slide 18: Securities Portfolio
SECURITIES PORTFOLIO 6/3 013 Securities Portfolio ortfolio Highlights Corporate Federal == Minimal credit risk; minimal duration risk 1% agencies and - Average life 3.6 - Modified duration3.4 GSEs 16% == High quality — $340.1 million AFS securities portfolio = Allaboveinvestment grade - Municipal po
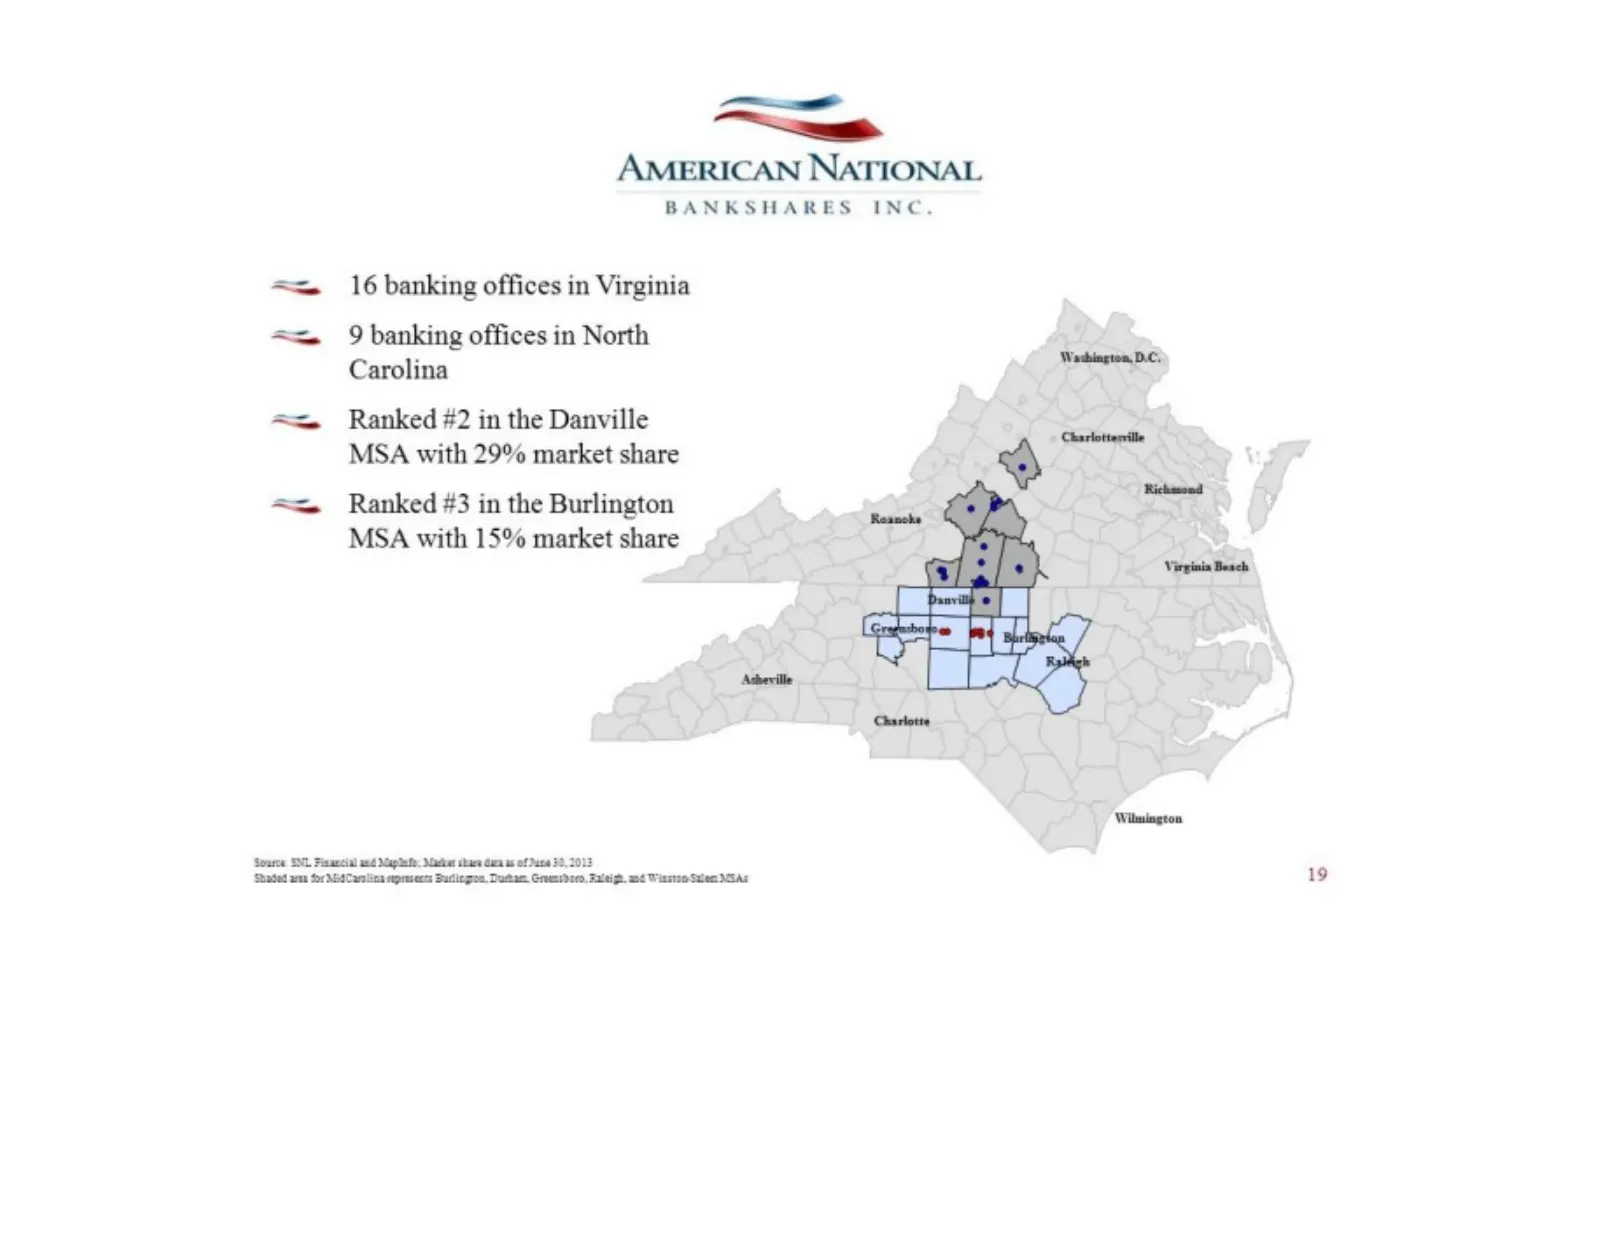
Slide 19: American National Bankshares Inc. footprint
ee —a AMERICAN NATIONAL BANKSHARES INC. 16 banking offices in Virginia 9 banking offices in North Carolina Ranked #2 in the Danville MSA with 29% market share Ranked #3 in the Burlington MSA with 15% market share bod r Source SN2 Fisacial and Mapefe, Sader share Gara as of Pata 32,2013 ‘Seaded aru f
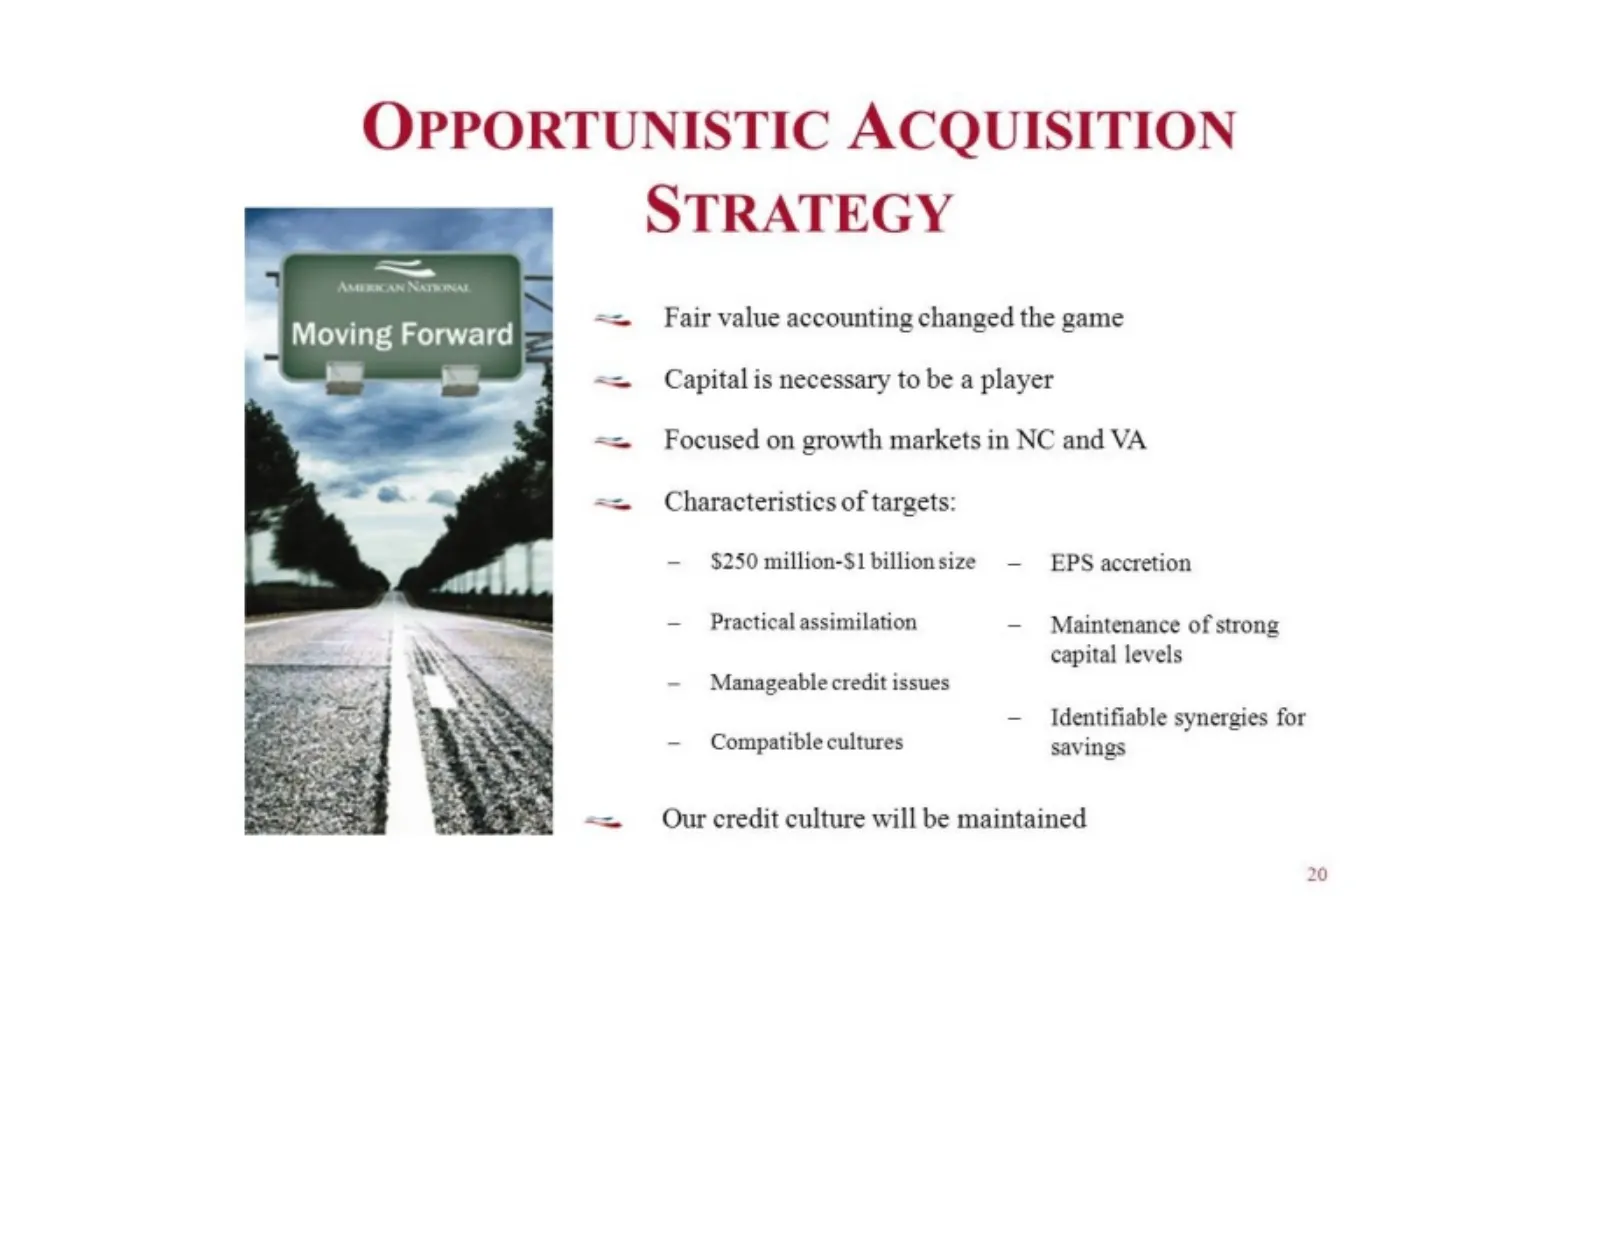
Slide 20: Opportunistic Acquisition Strategy
OPPORTUNISTIC ACQUISITION STRATEGY Fair value accounting changed the game Capital is necessary to be a player Focused on growth markets in NC and VA Characteristics of targets: — $250 million-$1 billionsize -— EPS accretion — Practical assimilation — Maintenance of strong capital levels — Manageable
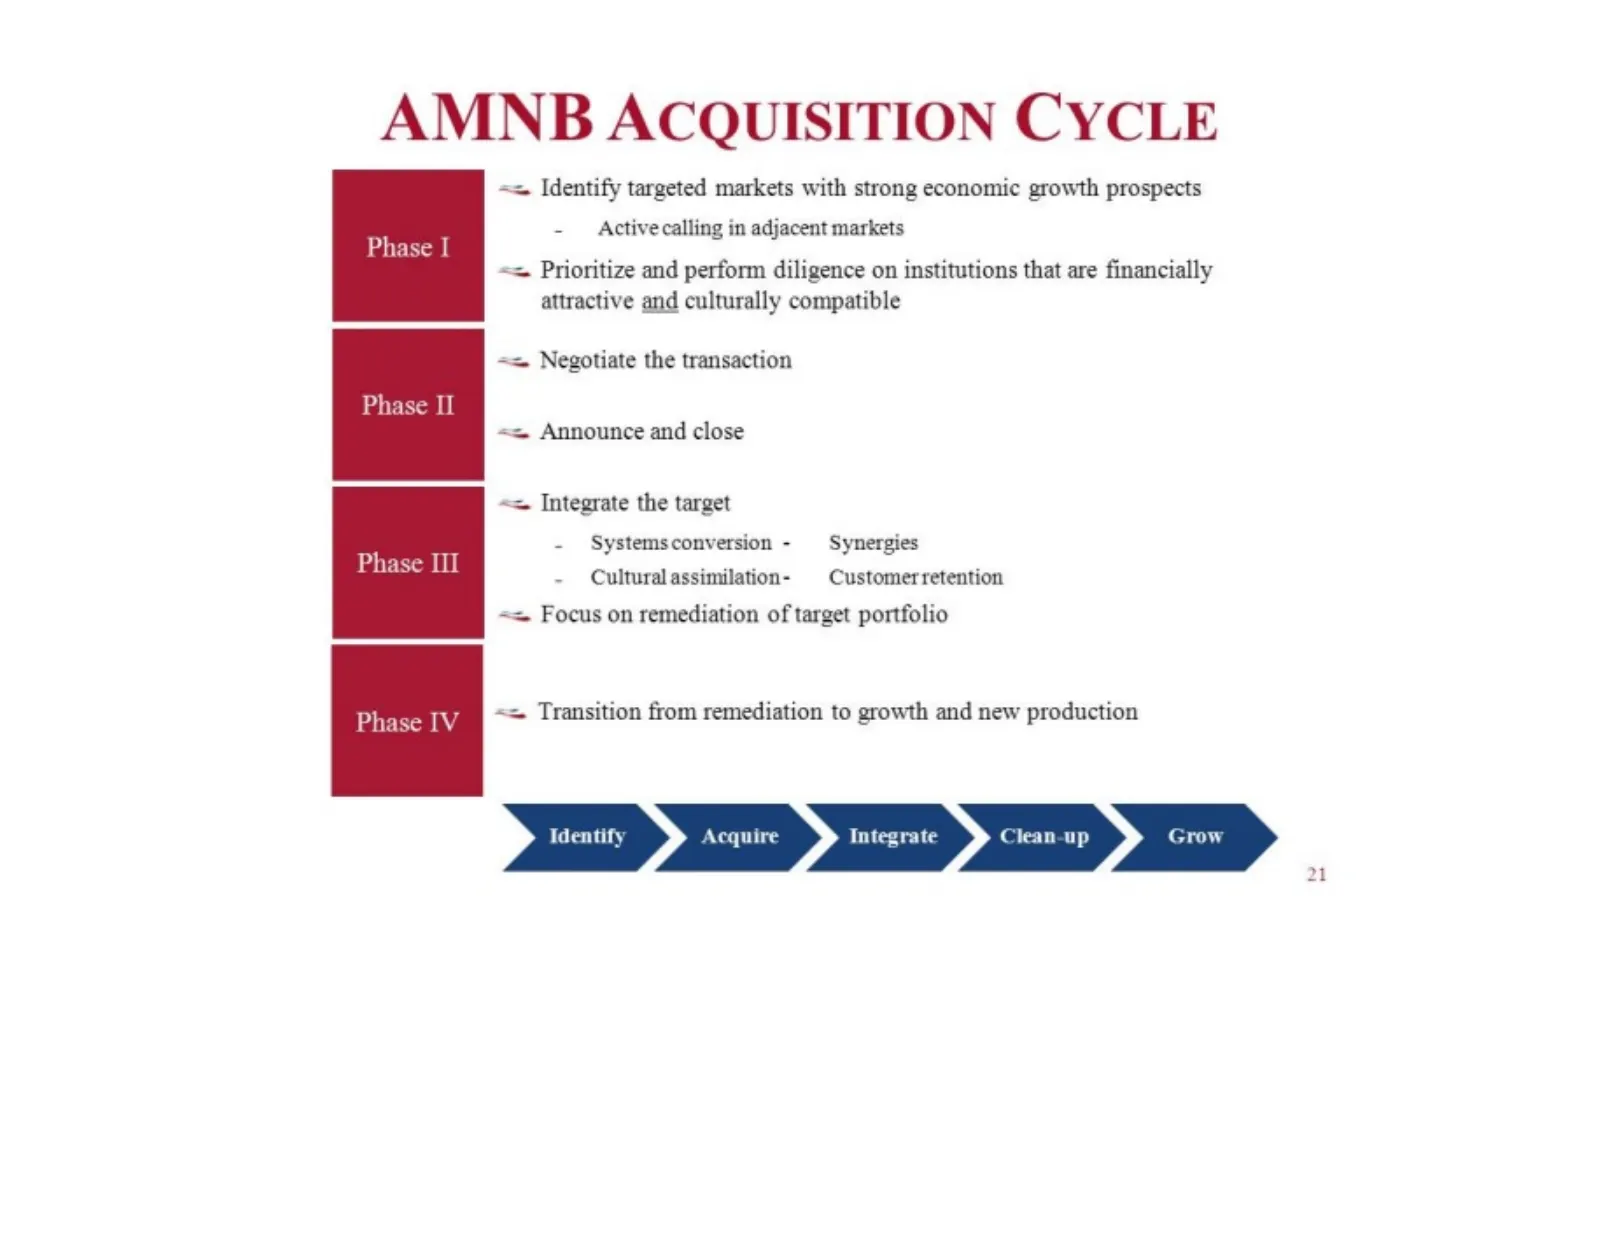
Slide 21: AMNB Acquisition Cycle
AMNB ACQUISITION CYCLE == Identify targeted markets with strong economic growth prospects - Activecalling in adjacent markets Phase I «= Prioritize and perform diligence on institutions that are financially attractive and culturally compatible == Negotiate the transaction Phase II == Announce and cl
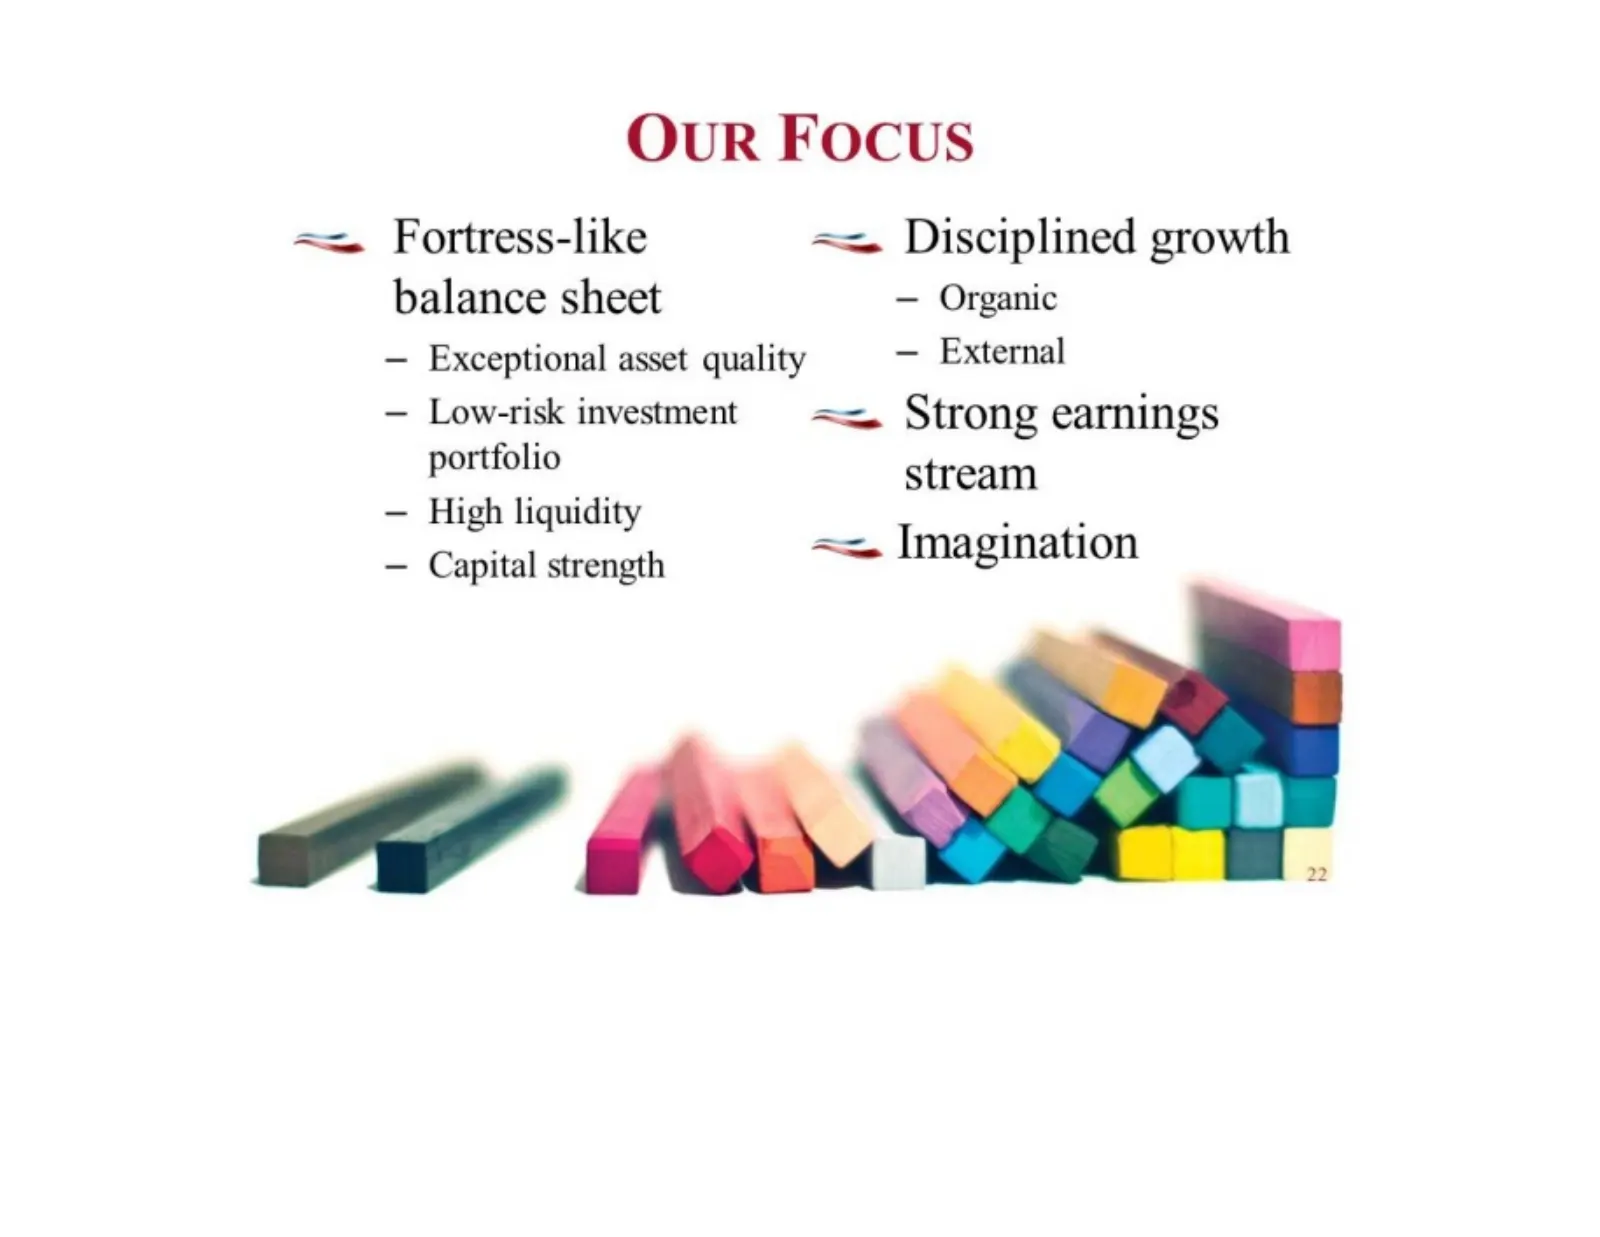
Slide 22: Our Focus
OUR FOCUS == Fortress-like == Disciplined growth balance sheet — Organic — Exceptional asset quality — External — Low-risk investment es Strong earnings portfolio stream — High liquidity — Capital strength == Imagination
Source: SEC EDGAR · 8-K filed Aug 21, 2013
More decks from American National Bankshares Inc
 Investor Presentation (July 2022)32 slides · Jul 27, 2022
 Investor Presentation (June 2022)32 slides · Jun 14, 2022
 Investor Presentation (May 2021)34 slides · May 28, 2021
 Investor Presentation (July 2019)47 slides · Jul 29, 2019
 Investor Presentation (July 2019)47 slides · Jul 8, 2019
 Investor Presentation (March 2019)42 slides · Mar 25, 2019