Texas Industries — Hodges Capital Management Annual Investment Forum 2009
47 slides from Texas Industries's conference presentation, Sep 2, 2009
Slide 1: Hodges Capital Management Annual Investment Forum
HODGES CAPITAL MANAGEMENT 1174 ANNUAL INVESTMENT FORUM DALLAS SEPTEMBER 2, 2009
Slide 2: Forward-Looking Statement
| FORWARD-LOOKING STATEMENT ita] Certain statements contained in this presentation are “forward-looking statements” within the meaning of the Private Securities Litigation Reform Act of 1995. Such statements are subject to risks, uncertainties and other factors, which could cause actual results to d
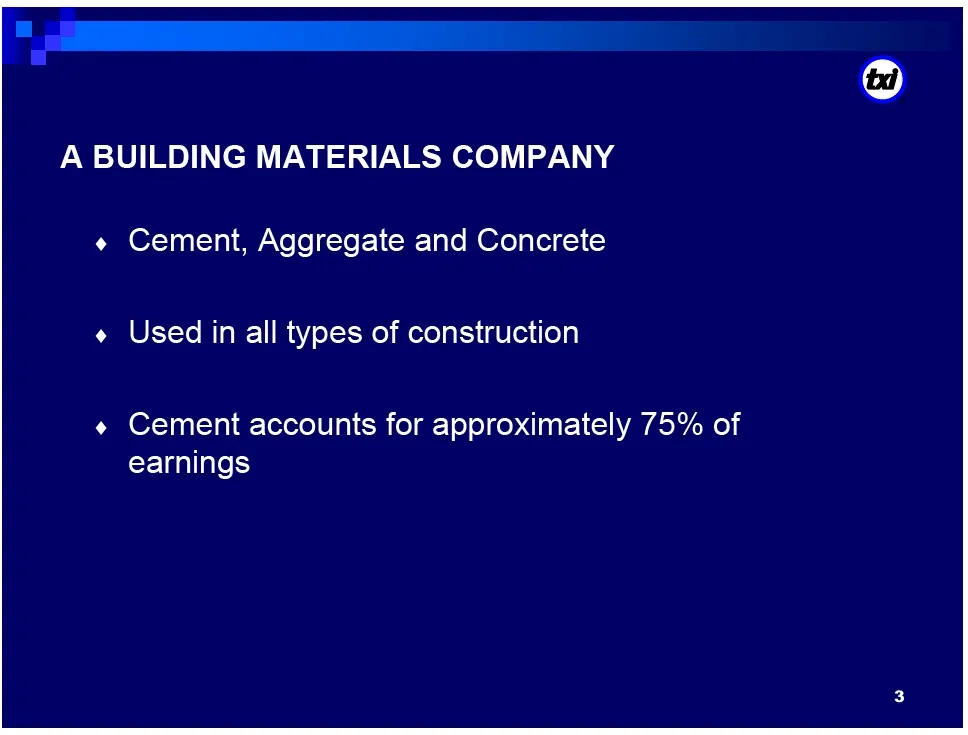
Slide 3: A Building Materials Company
| A BUILDING MATERIALS COMPANY « Cement, Aggregate and Concrete ¢ Used in all types of construction ¢ Cement accounts for approximately 75% of earnings
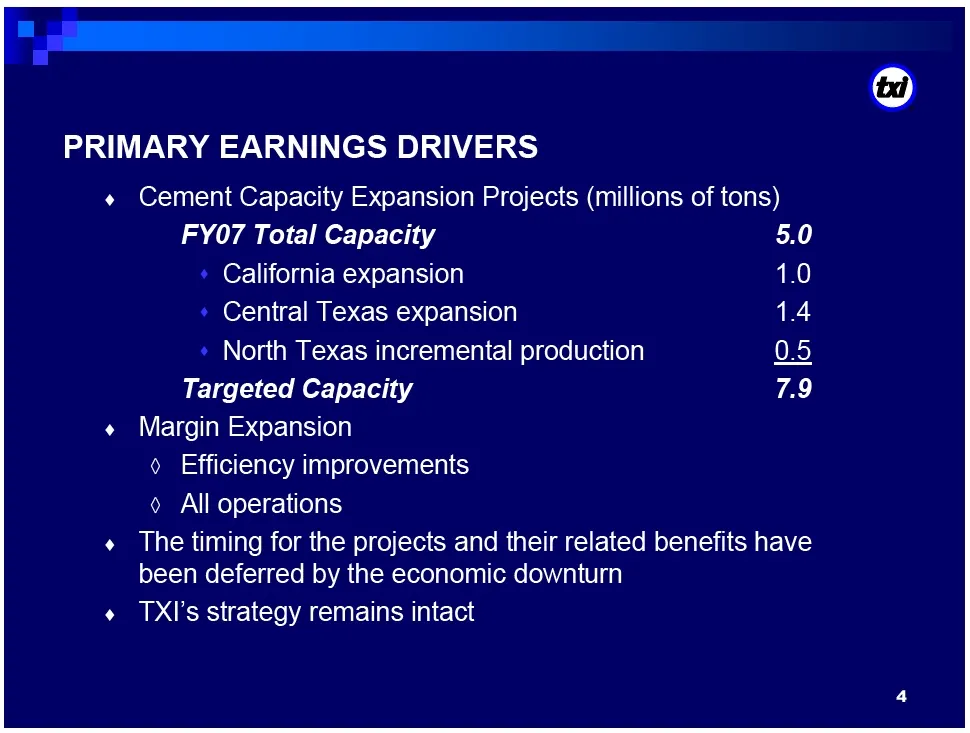
Slide 4: Primary Earnings Drivers
TT PRIMARY EARNINGS DRIVERS + Cement Capacity Expansion Projects (millions of tons) FY07 Total Capacity 5.0 » California expansion 1.0 » Central Texas expansion 1.4 » North Texas incremental production OS Targeted Capacity 7.9 Margin Expansion 0 Efficiency improvements 0 All operations The timing fo
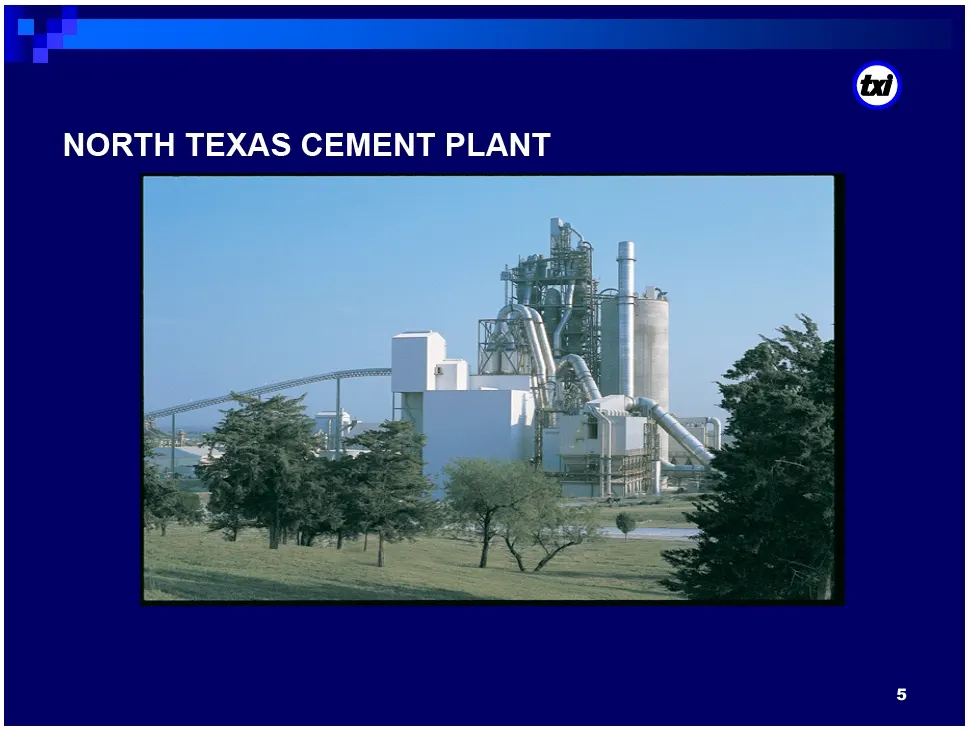
Slide 5: North Texas Cement Plant
NORTH TEXAS CEMENT PLANT
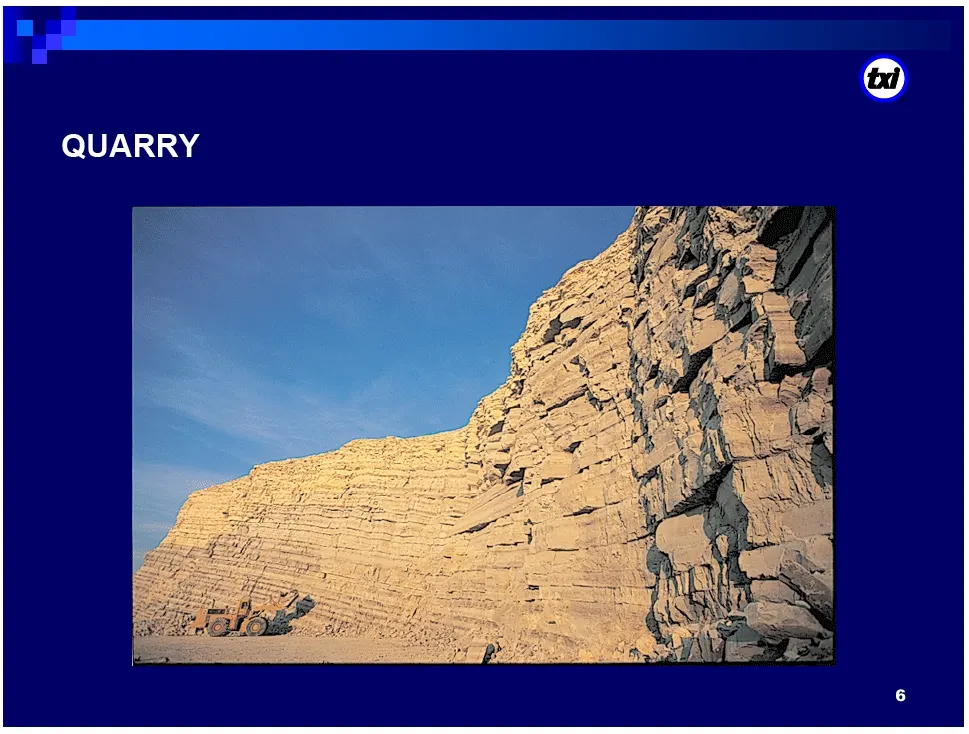
Slide 6: Quarry
QUARRY
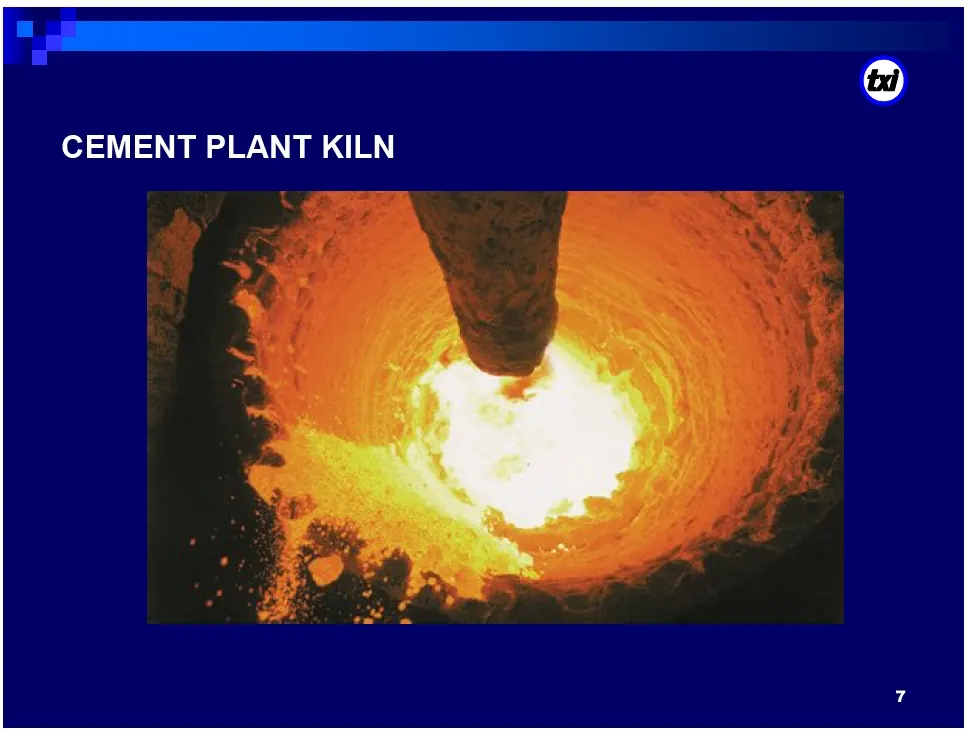
Slide 7: Cement Plant Kiln
TT CEMENT PLANT KILN
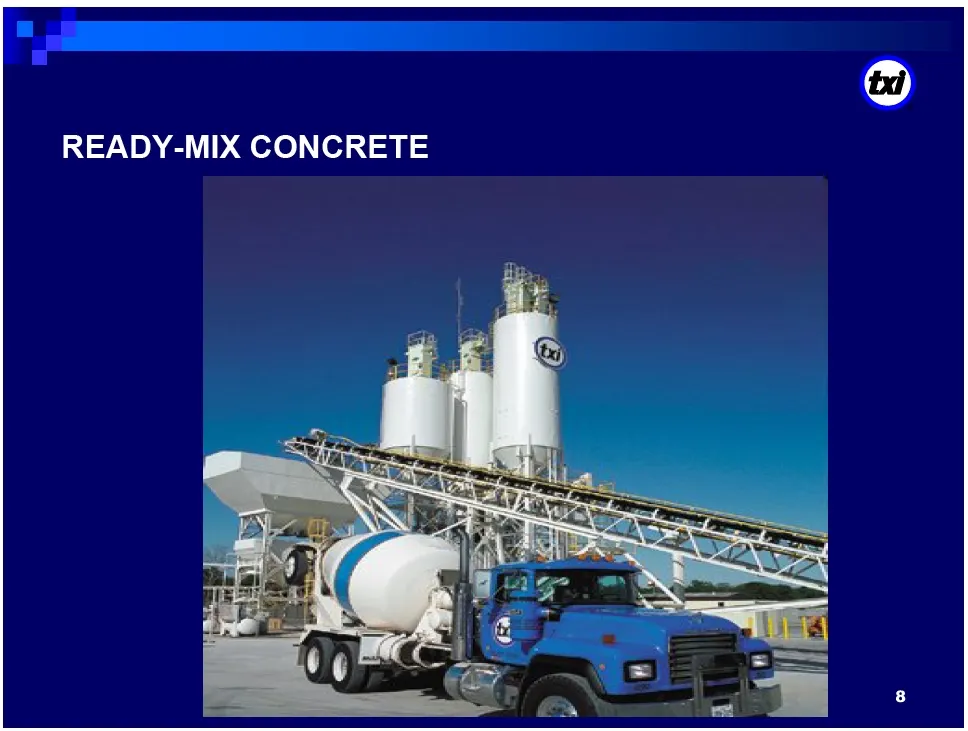
Slide 8: Ready-Mix Concrete
: READY-MIX CONCRETE
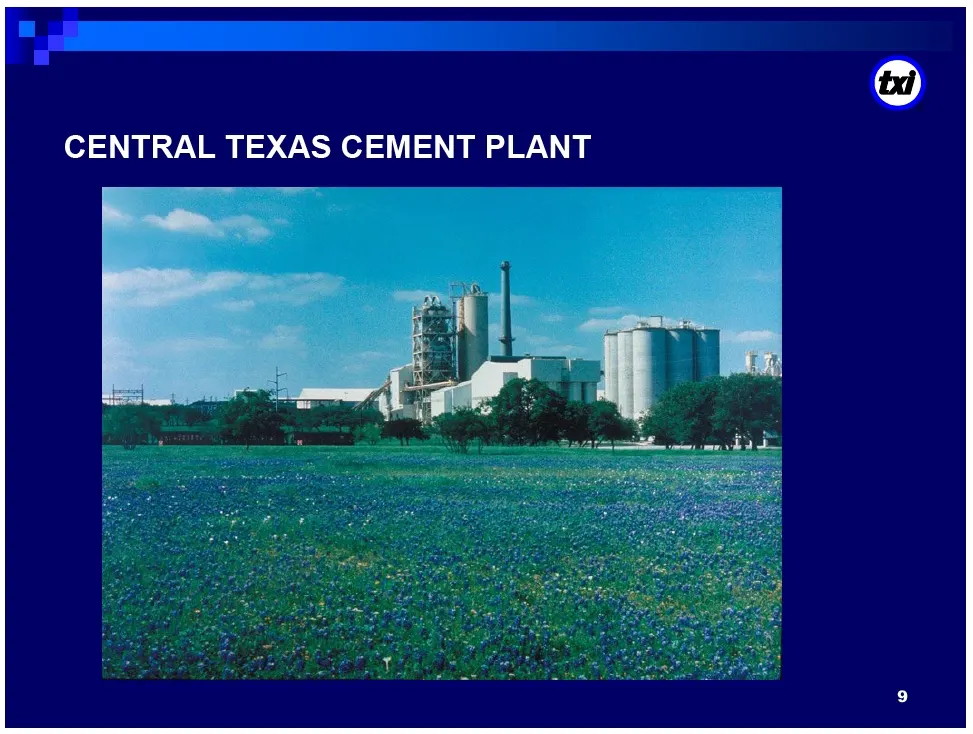
Slide 9: Central Texas Cement Plant
CENTRAL TEXAS CEMENT PLANT
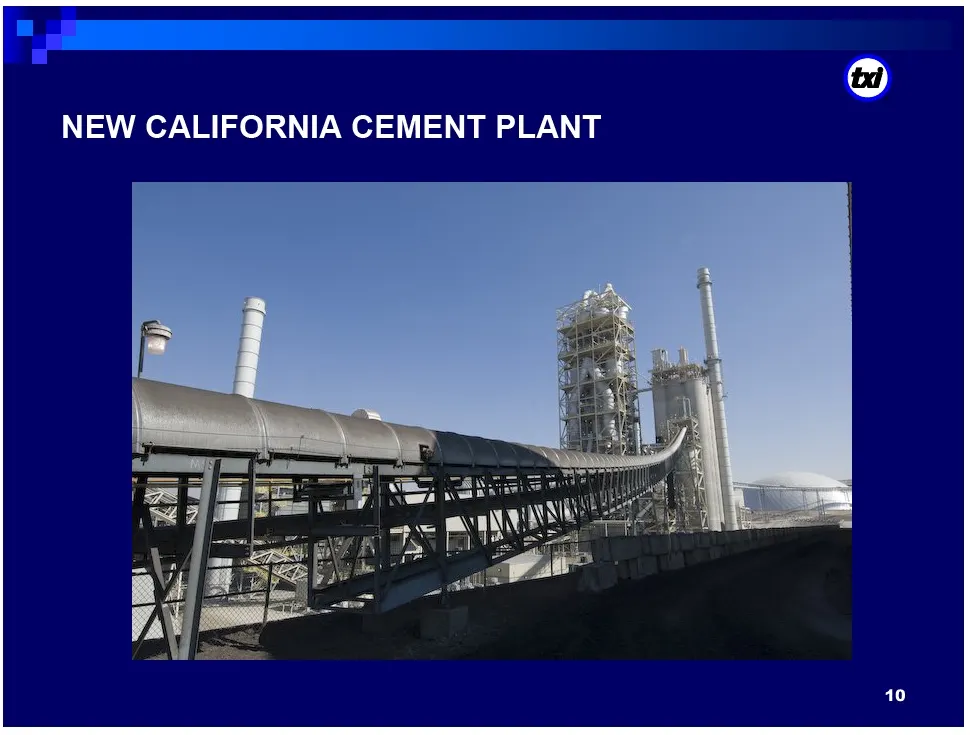
Slide 10: New California Cement Plant
NEW CALIFORNIA CEMENT PLANT
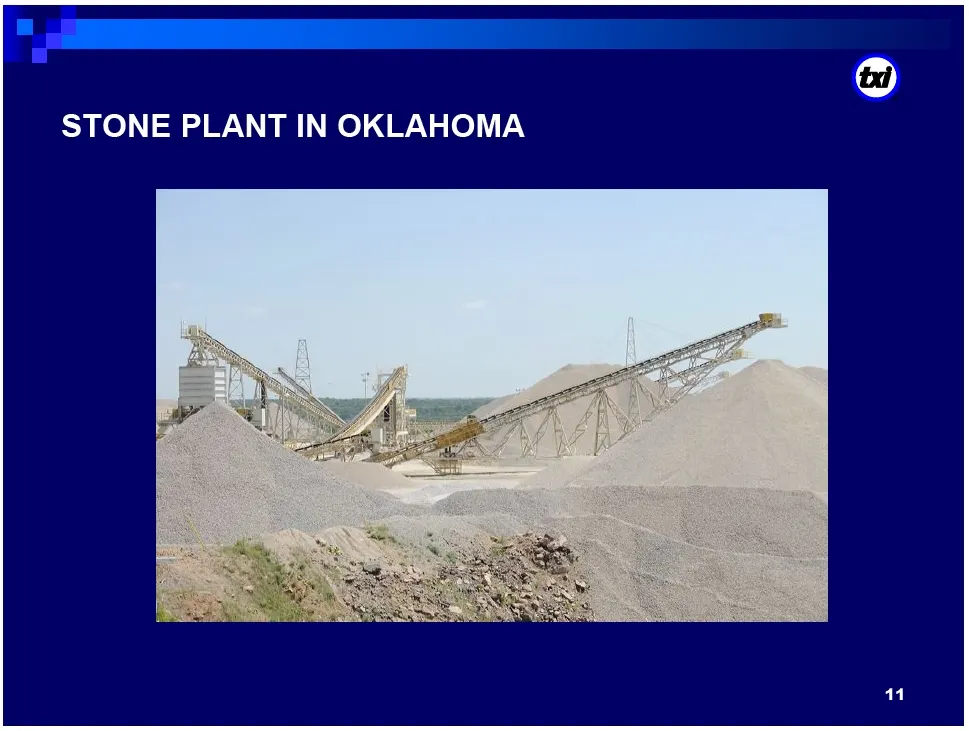
Slide 11: Stone Plant in Oklahoma
TT STONE PLANT IN OKLAHOMA
Slide 12: Drivers of Cement Demand
DRIVERS OF CEMENT DEMAND
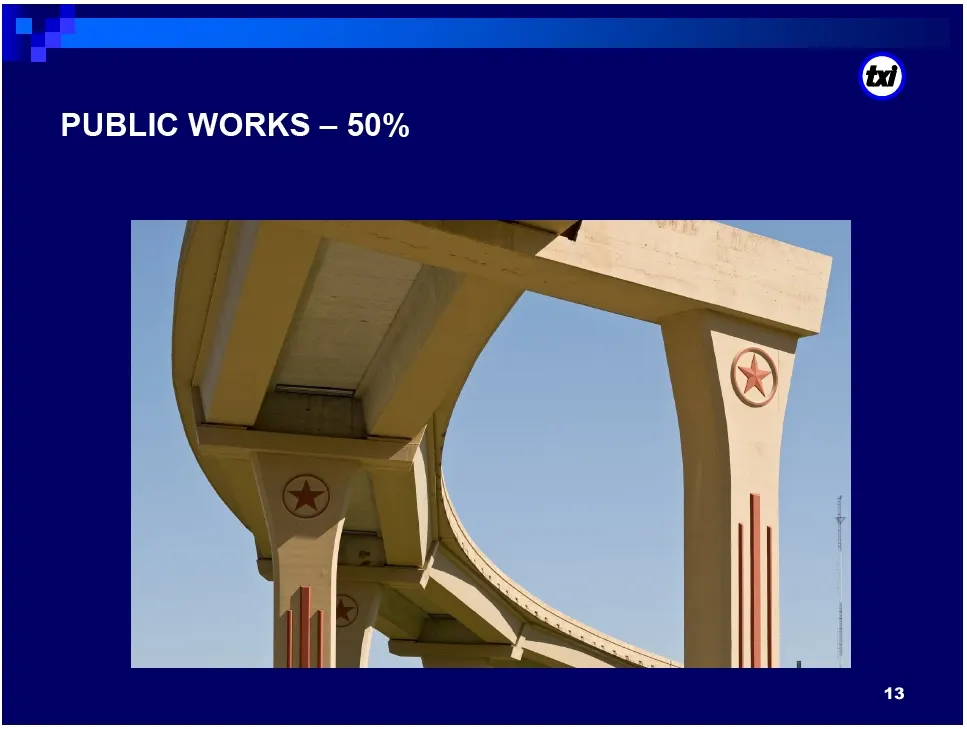
Slide 13: Public Works - 50%
© PUBLIC WORKS - 50% \. @ |
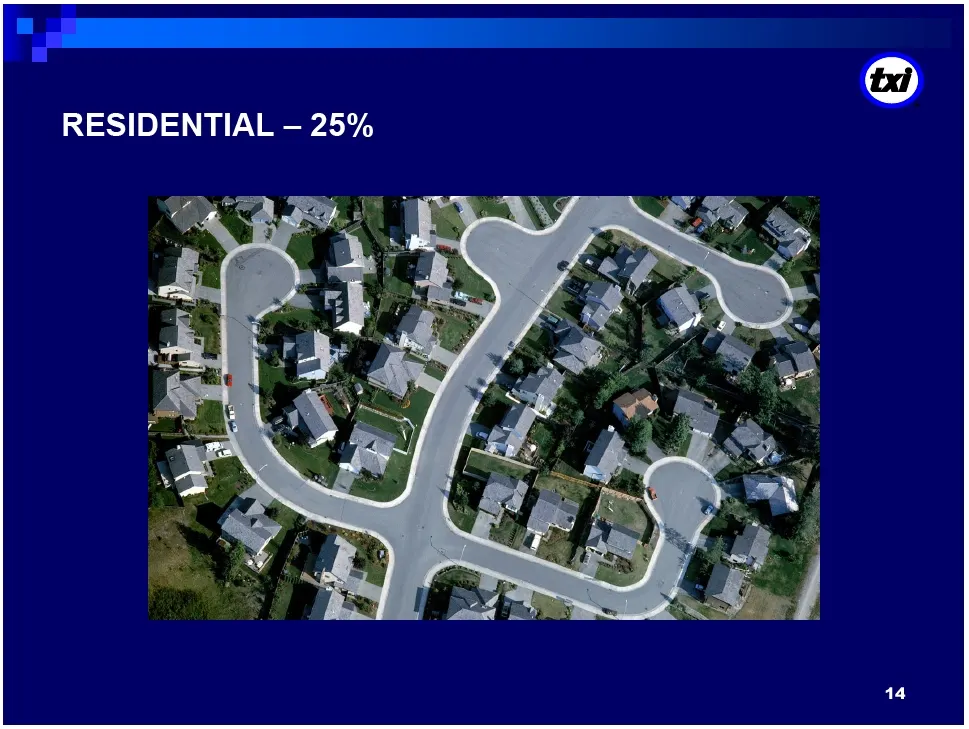
Slide 14: Residential - 25%
RESIDENTIAL — 25%
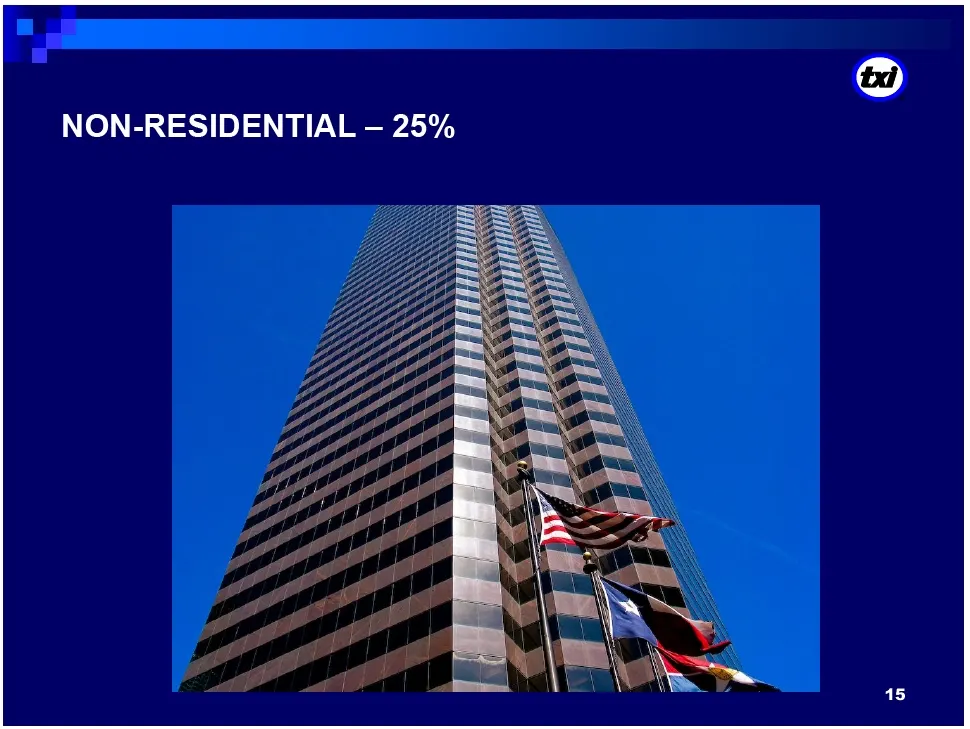
Slide 15: Non-Residential - 25%
NON-RESIDENTIAL — 25%

Slide 16: Favorable Industry Structure
© FAVORABLE INDUSTRY STRUCTURE
Slide 17: Favorable Industry Structure
TT FAVORABLE INDUSTRY STRUCTURE «#U. S. cement consumption has historically exceeded domestic production capacity
Slide 18: U.S. Cement Consumption and Production
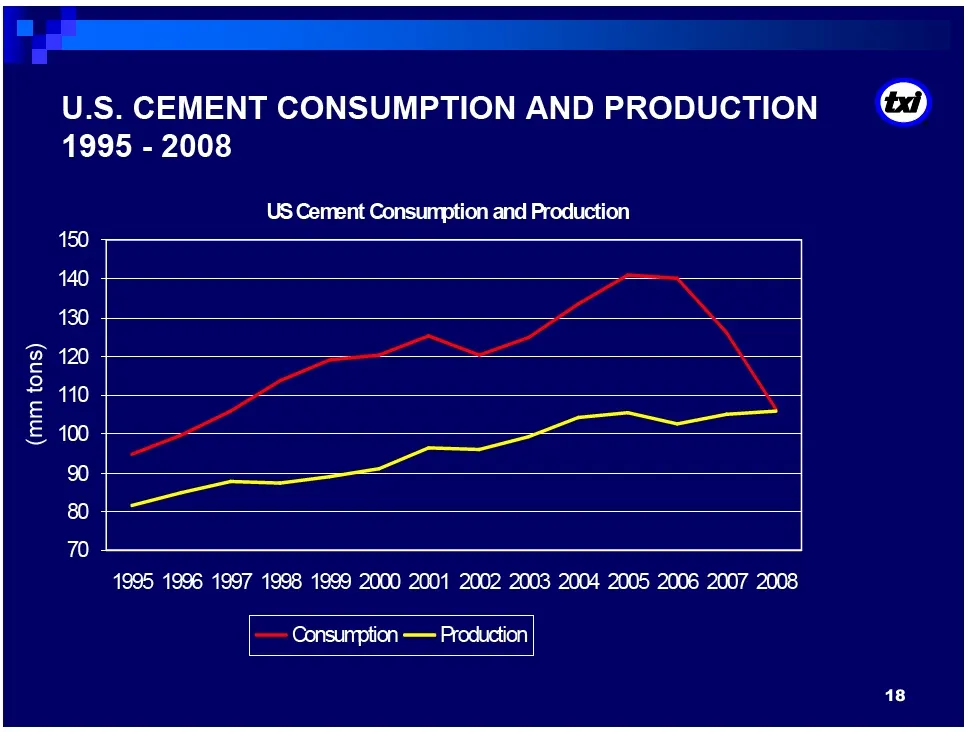
TT U.S. CEMENT CONSUMPTION AND PRODUCTION itz) 1995 - 2008 US Cement Consumption and Production 1995 1996 1997 1998 1999 2000 2001 2002 2003 2004 2005 2006 2007 2008 ~~ Consumption —— Production
Slide 19: Favorable Industry Structure
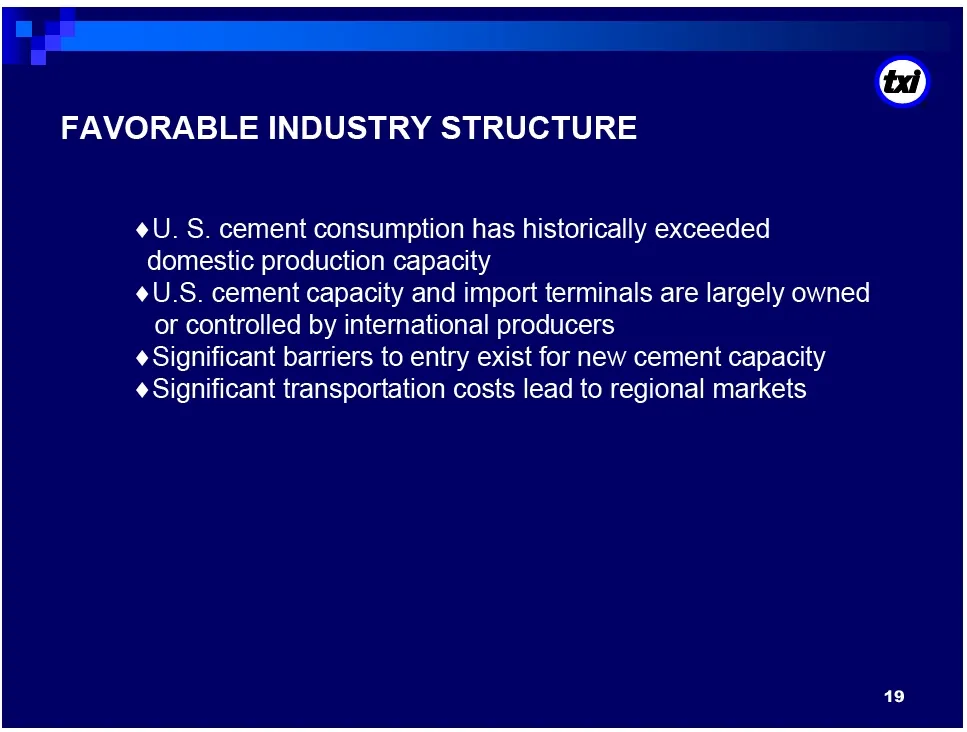
| FAVORABLE INDUSTRY STRUCTURE © «#U. S. cement consumption has historically exceeded domestic production capacity U.S. cement capacity and import terminals are largely owned or controlled by international producers ¢ Significant barriers to entry exist for new cement capacity ¢ Significant transpor

Slide 20: Texas and California: Attractive Long-Term Markets
TEXAS AND CALIFORNIA ATTRACTIVE LONG-TERM MARKETS
Slide 21: Texas and California: Attractive Long-Term Markets
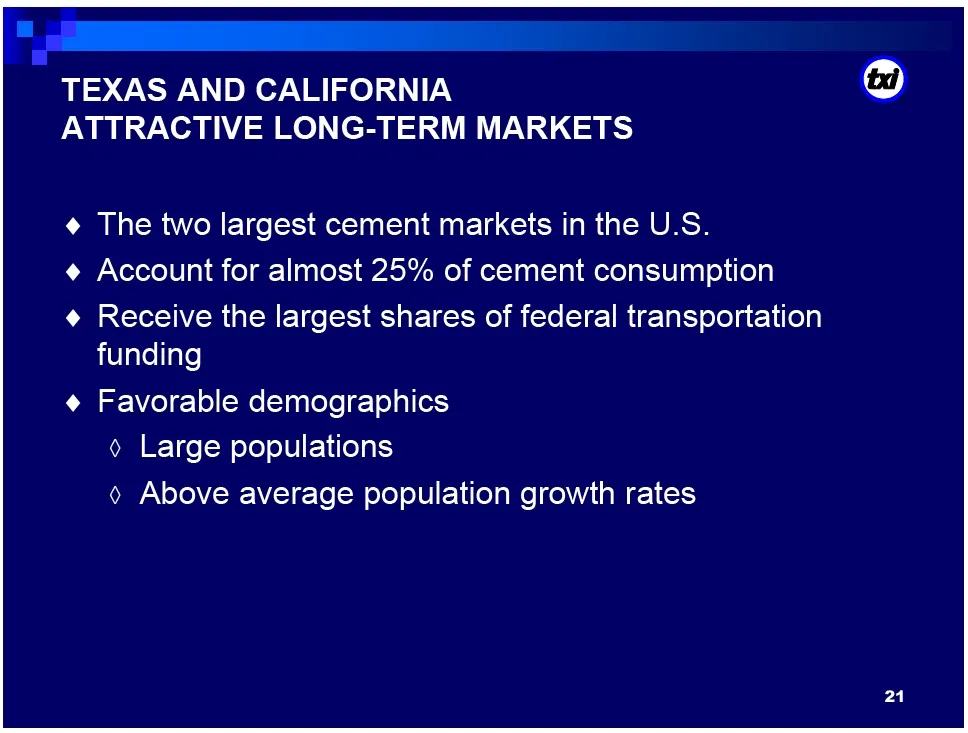
TT TEXAS AND CALIFORNIA ATTRACTIVE LONG-TERM MARKETS ¢ The two largest cement markets in the U.S. ¢ Account for almost 25% of cement consumption ¢@ Receive the largest shares of federal transportation funding ¢ Favorable demographics > Large populations > Above average population growth rates
Slide 22: Texas Cement Consumption and Capacity
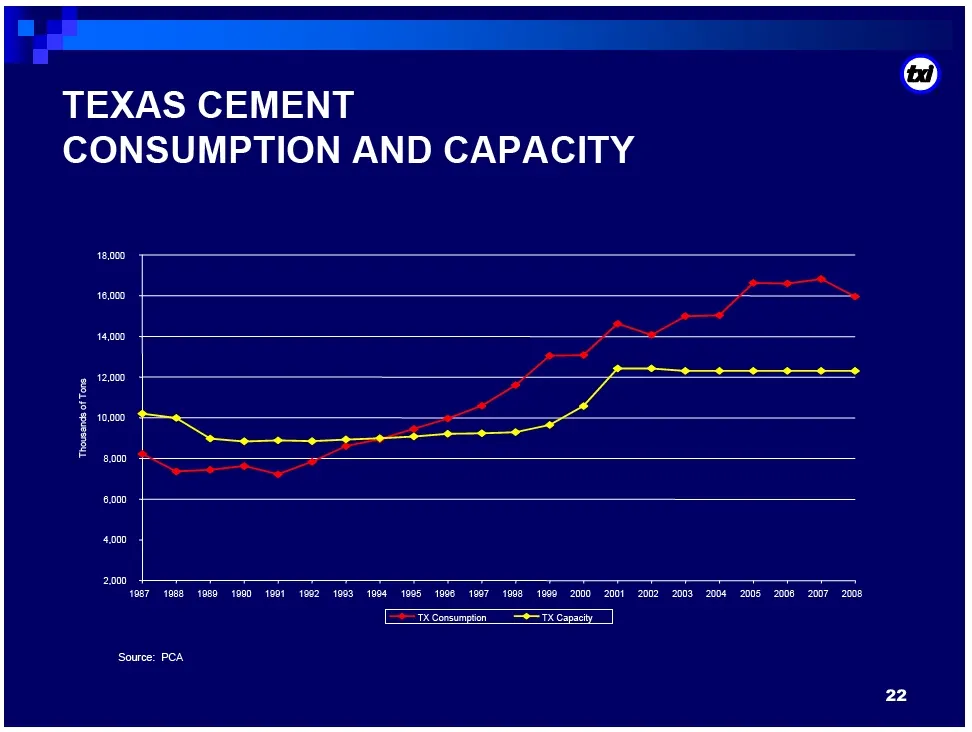
TEXAS CEMENT CONSUMPTION AND CAPACITY
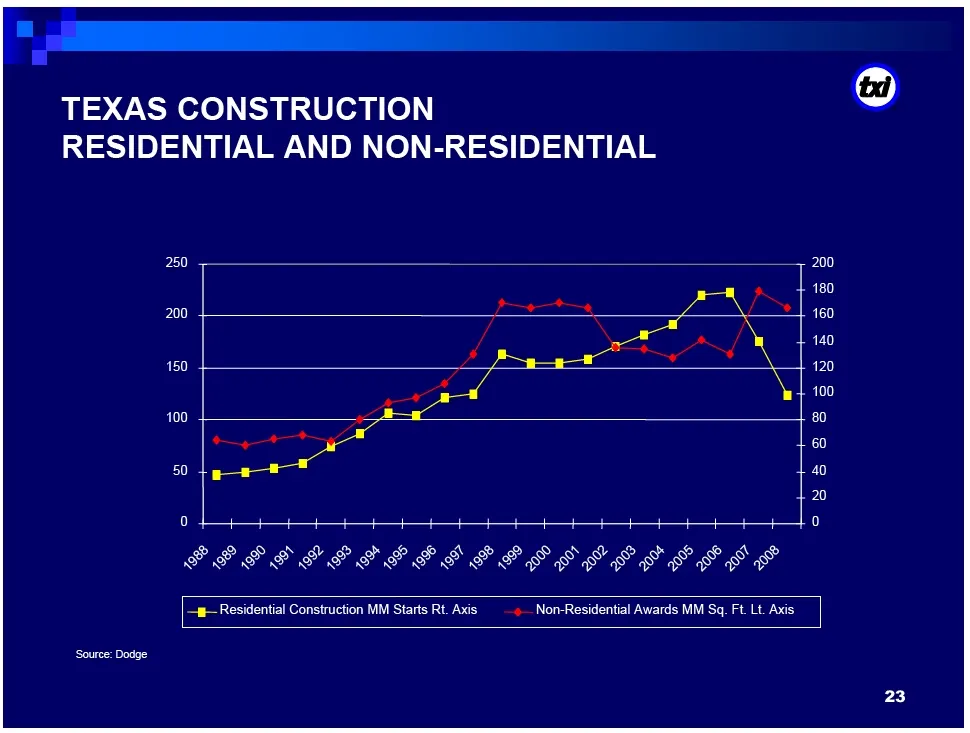
Slide 23: Texas Construction
TT TEXAS CONSTRUCTION RESIDENTIAL AND NON-RESIDENTIAL FE IFPI EP EES FESS ESE SSS —a- Residential Construction MM Starts Rt. Axis» Non-Residential Awards MM Sq. Ft. Lt. Axis
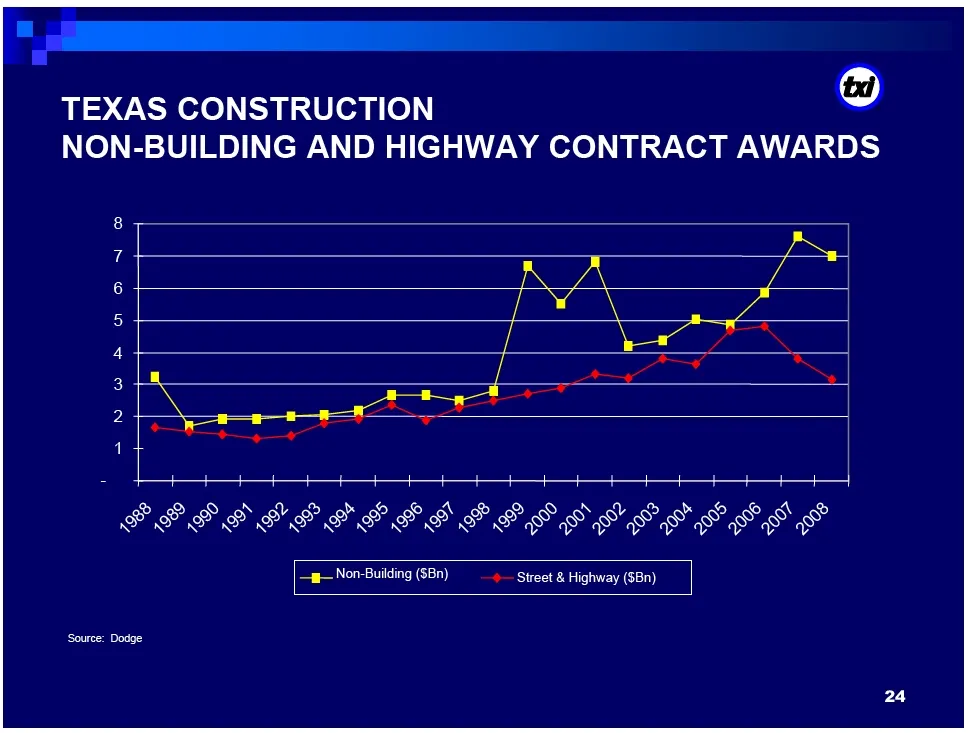
Slide 24: Texas Construction
TT TEXAS CONSTRUCTION tea] NON-BUILDING AND HIGHWAY CONTRACT AWARDS a KA [© i ————- PEEP IE IE EES SF ESS a Non-Building (Bn) + _ Street & Highway (SBn)
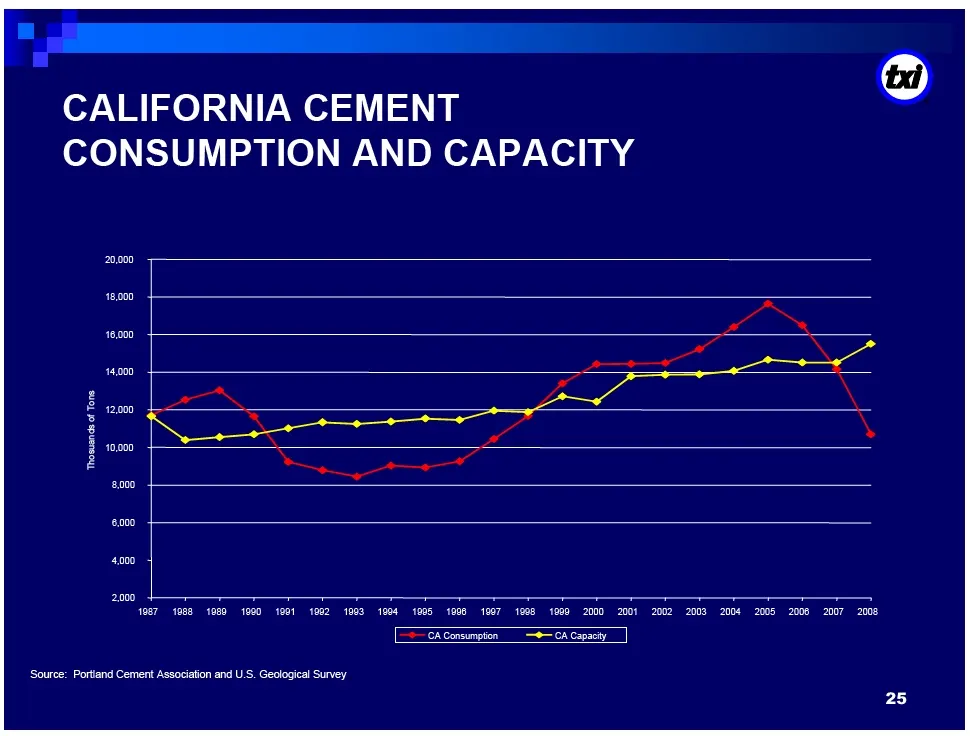
Slide 25: California Cement
TT CALIFORNIA CEMENT CONSUMPTION AND CAPACITY 00 067 1988 1089 1000 1001 1902 1002 1904 1905 roo 1007 1998 1000 2000 2001 2002 2003 2004 2005 2008 2007 2008, Source: Portland Cement Association and U.S. Geological Survey
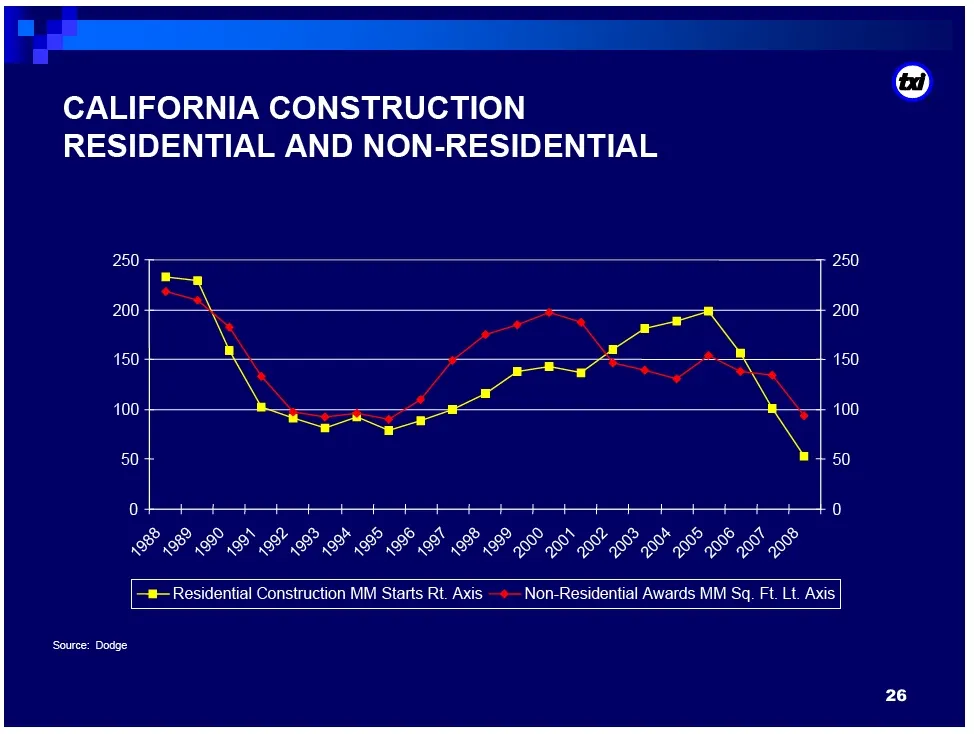
Slide 26: California Construction
CALIFORNIA CONSTRUCTION RESIDENTIAL AND NON-RESIDENTIAL ae — Do D2 ON DD © GC A FM OA DG Od © GCA EEESIEEFEEE SESS SES LESS —# Residential Construction MM Starts Rt. Axis —*— Non-Residential Awards MM Sq. Ft. Lt. Axis
Slide 27: California Construction
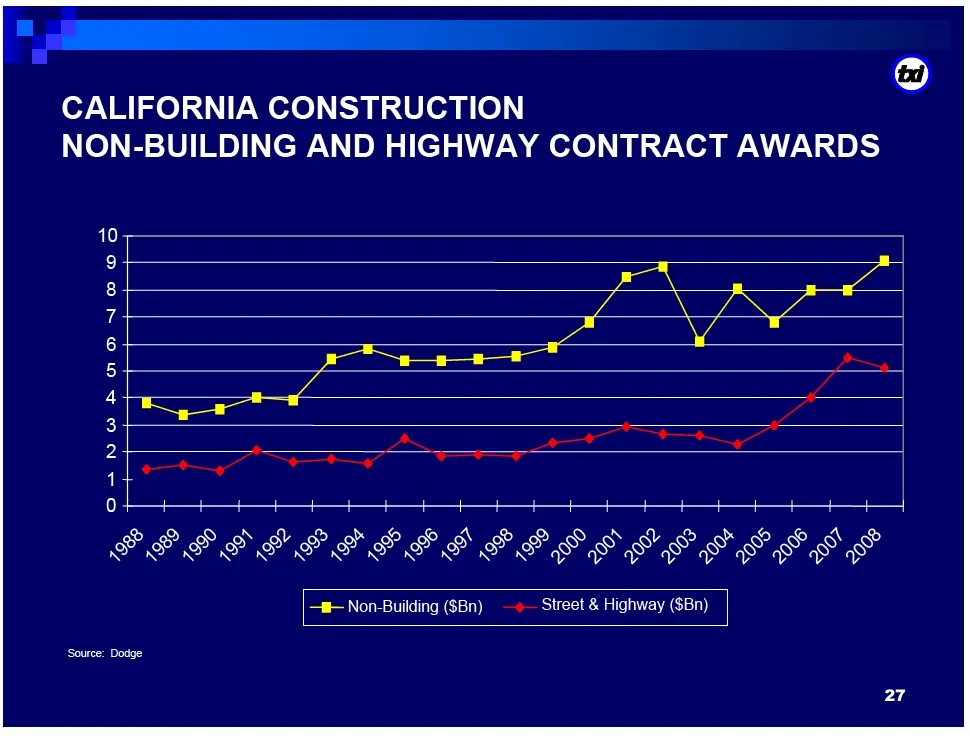
TT CALIFORNIA CONSTRUCTION NON-BUILDING AND HIGHWAY CONTRACT AWARDS ie) 9 8 7 6 5 4 3 2 1 ie) i FP SS KPI FES SFP MOS Sep Sie a Non-Building ($Bn) —»— Street & Highway ($Bn)
Slide 28: Texas Market - 1980, 2000 and 2020
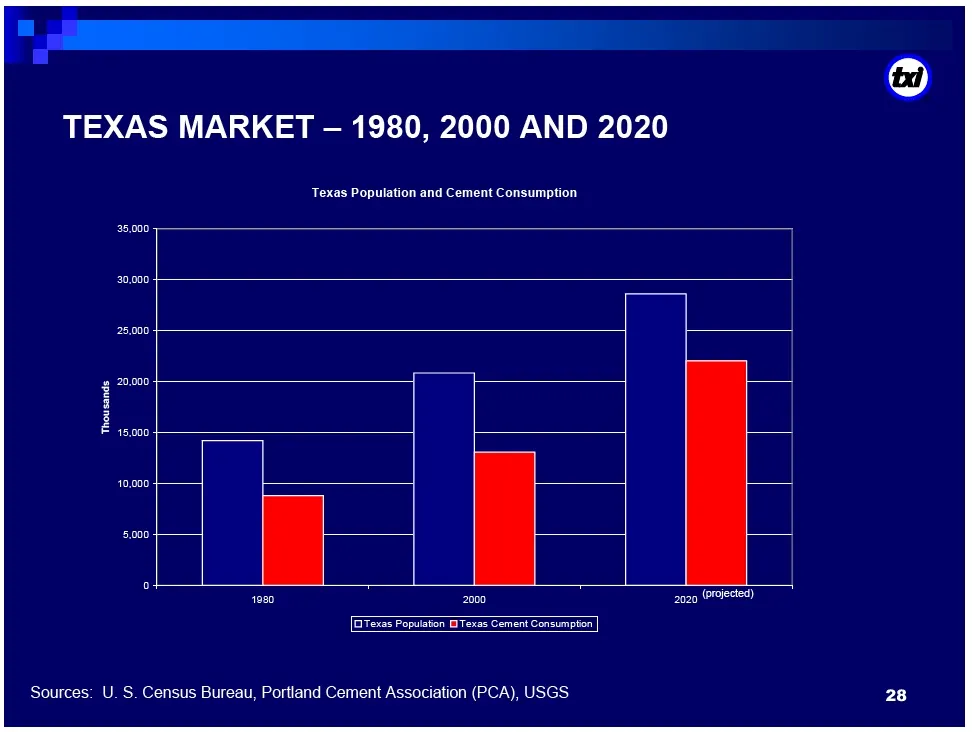
TT TEXAS MARKET -— 1980, 2000 AND 2020 Texas Population and Cement Consumption Pa 2o20 (Projected) [EiTexas Population BiTexas Gement Consumption Sources: U. S. Census Bureau, Portland Cement Association (PCA), USGS
Slide 29: California Market - 1980, 2000 and 2020
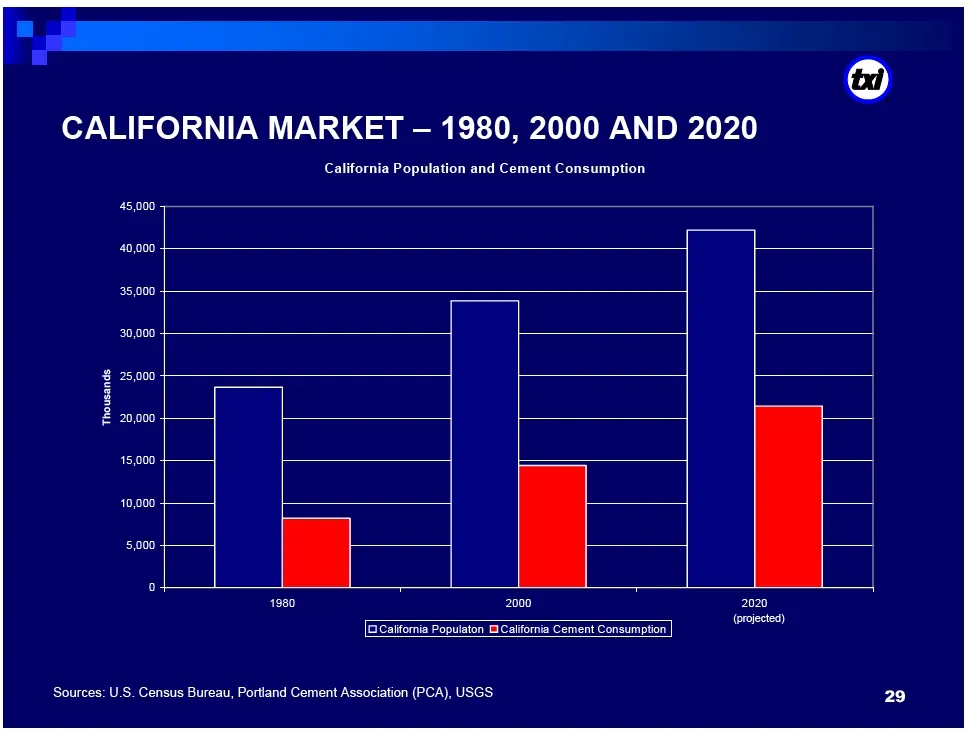
TT CALIFORNIA MARKET -— 1980, 2000 AND 2020 California Population and Cement Consumption Sources: U.S. Census Bureau, Portland Cement Association (PCA), USGS 2000 [E:Caifornia Populaton GiCalifornia Cement Consumption
Slide 30: Strong Competitive Position
STRONG COMPETITIVE POSITION
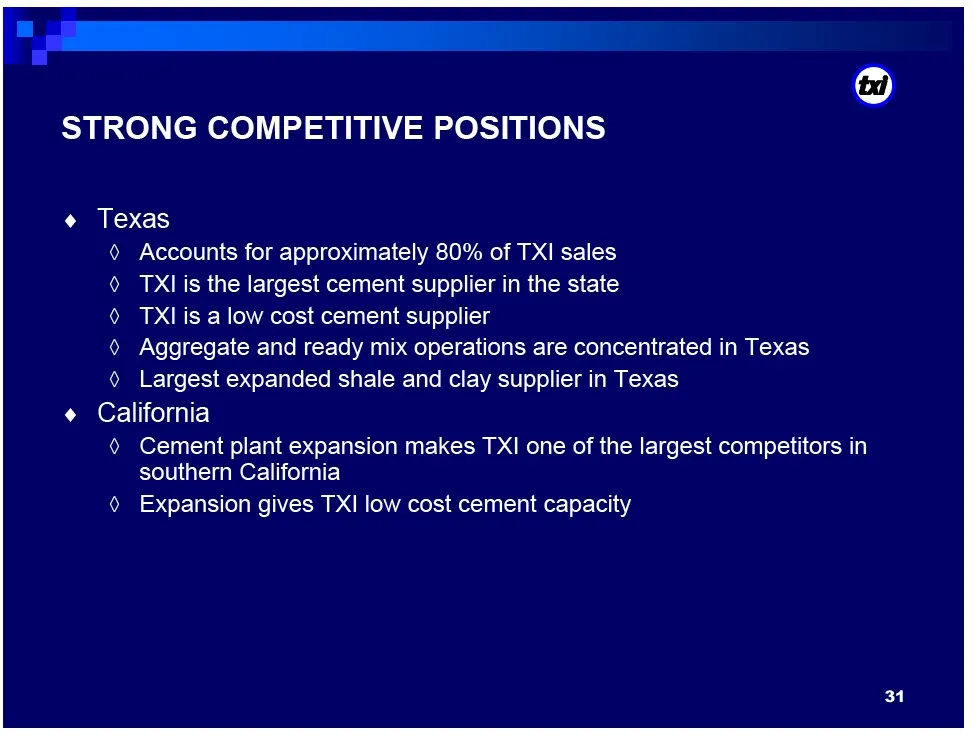
Slide 31: Strong Competitive Positions
TT STRONG COMPETITIVE POSITIONS « Texas Accounts for approximately 80% of TX! sales TXI is the largest cement supplier in the state TXI is a low cost cement supplier Aggregate and ready mix operations are concentrated in Texas Largest expanded shale and clay supplier in Texas ¢ California 0 Cement p
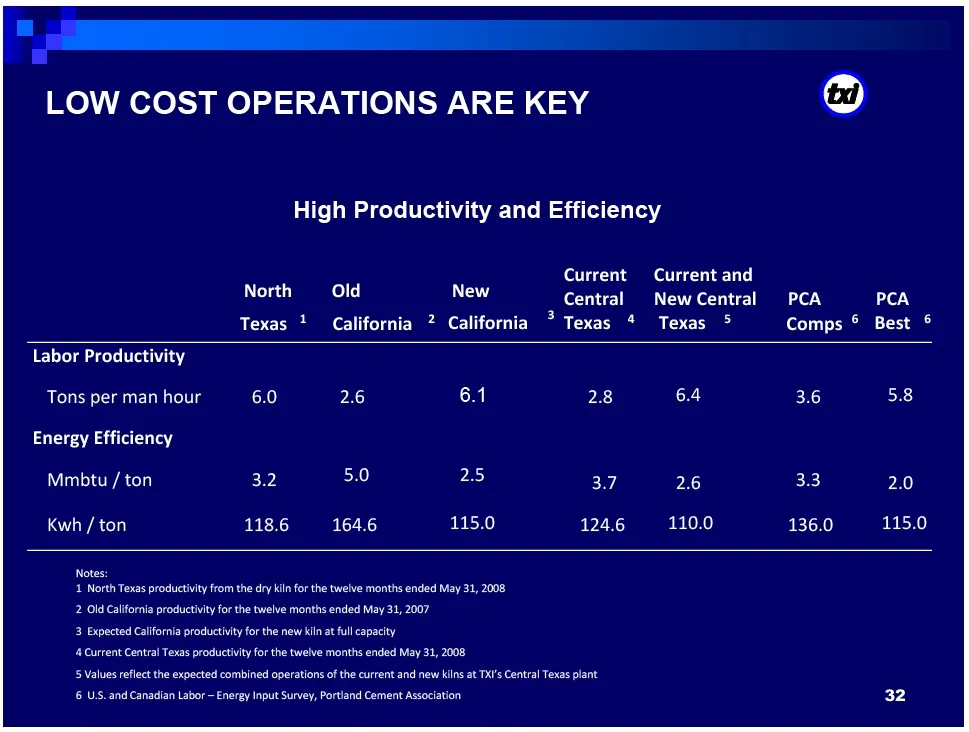
Slide 32: Low Cost Operations Are Key
TT LOW COST OPERATIONS ARE KEY (tx) High Productivity and Efficiency Current Current and Central NewCentral PCA PCA Texas 1 California ? California * Texas * Texas 5 Comps © Best © North Old New Labor Productivity Tons per man hour 6.0 7 6.1 Energy Efficiency Mmbtu / ton 3.2 5.0 25 3.7 RE 3.3 2.0 Kw
Slide 33: Cement Plant Expansions
CEMENT PLANT EXPANSIONS
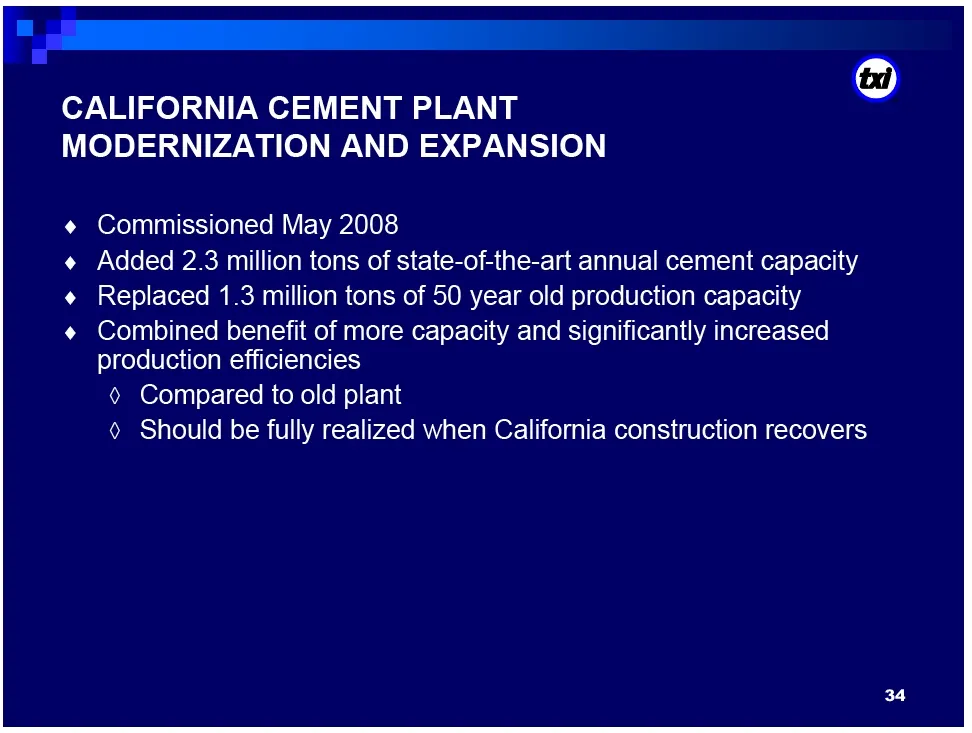
Slide 34: California Cement Plant
TT CALIFORNIA CEMENT PLANT MODERNIZATION AND EXPANSION @ Commissioned May 2008 Added 2.3 million tons of state-of-the-art annual cement capacity Replaced 1.3 million tons of 50 year old production capacity Combined benefit of more capacity and significantly increased production efficiencies © Compar
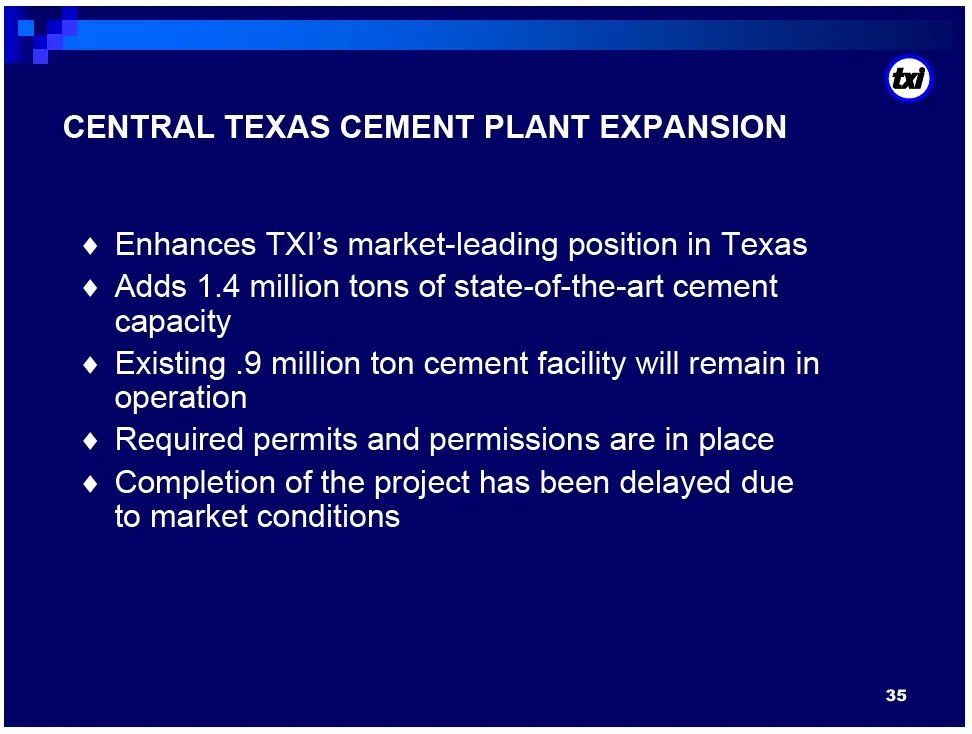
Slide 35: Central Texas Cement Plant Expansion
: CENTRAL TEXAS CEMENT PLANT EXPANSION ied] « Enhances TXI’s market-leading position in Texas « Adds 1.4 million tons of state-of-the-art cement capacity ¢ Existing .9 million ton cement facility will remain in operation «@ Required permits and permissions are in place ¢ Completion of the project ha
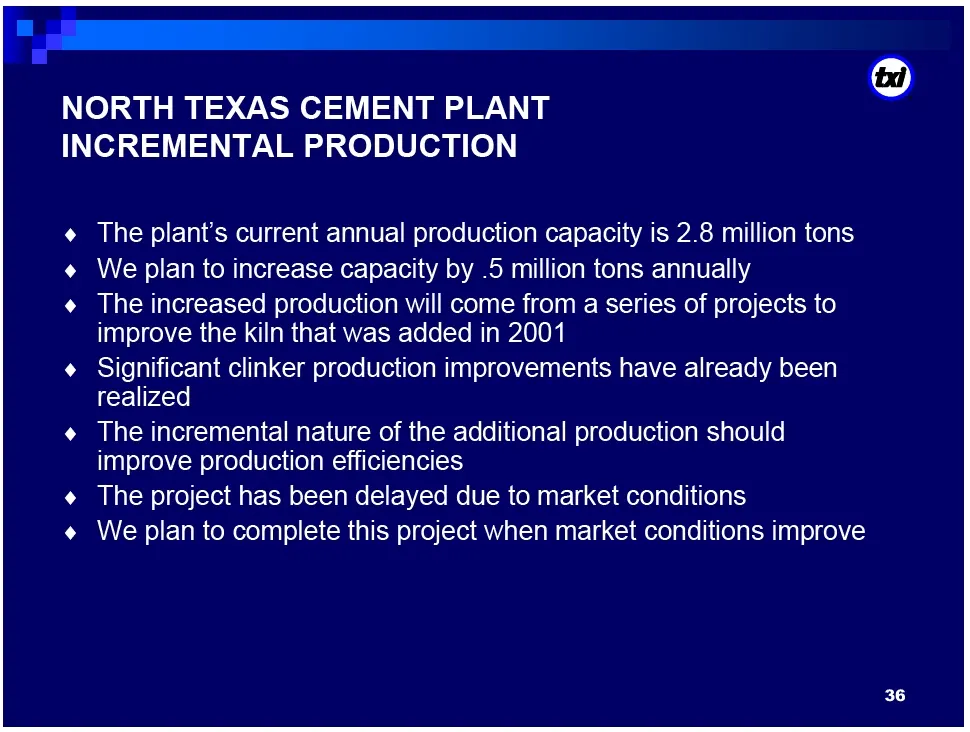
Slide 36: North Texas Cement Plant
TT NORTH TEXAS CEMENT PLANT @ INCREMENTAL PRODUCTION The plant’s current annual production capacity is 2.8 million tons « We plan to increase capacity by .5 million tons annually The increased production will come from a series of projects to improve the kiln that was added in 2001 Significant clink
Slide 37: Current Market Conditions
CURRENT MARKET CONDITIONS 37
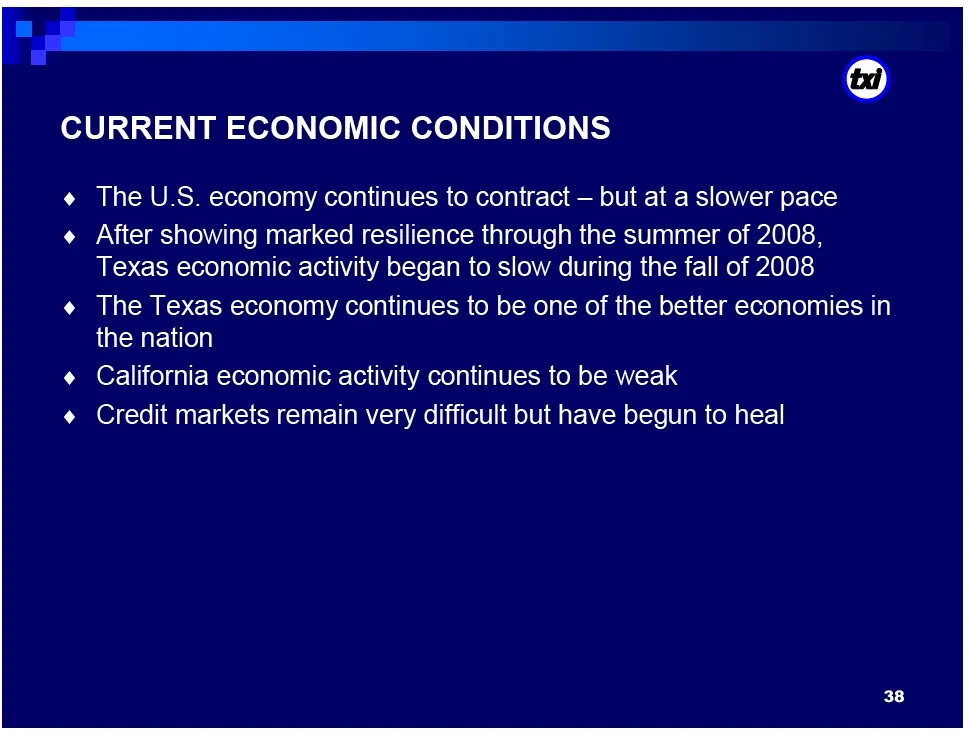
Slide 38: Current Economic Conditions
| CURRENT ECONOMIC CONDITIONS @ « The U.S. economy continues to contract — but at a slower pace « After showing marked resilience through the summer of 2008, Texas economic activity began to slow during the fall of 2008 « The Texas economy continues to be one of the better economies in the nation ¢
Slide 39: Infrastructure Development
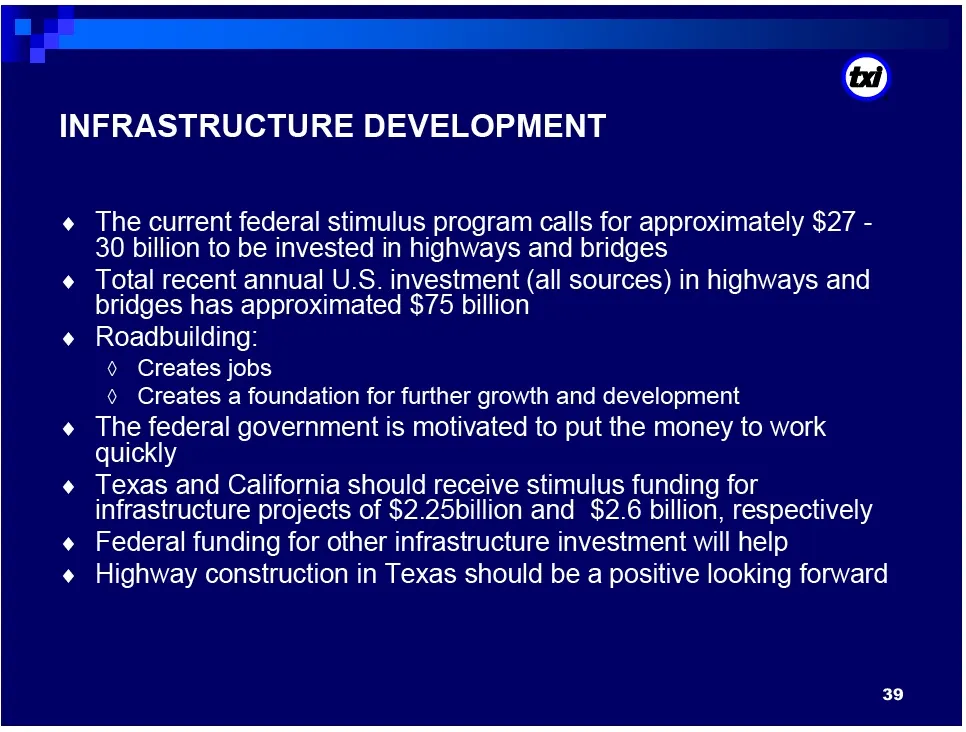
: INFRASTRUCTURE DEVELOPMENT ° ° oe @ The current federal stimulus program calls for approximately $27 - 30 billion to be invested in highways and bridges Total recent annual U.S. investment (all sources) in highways and bridges has approximated $75 billion Roadbuilding: © Creates jobs © Creates a f
Slide 40: Actions in a Challenging Environment
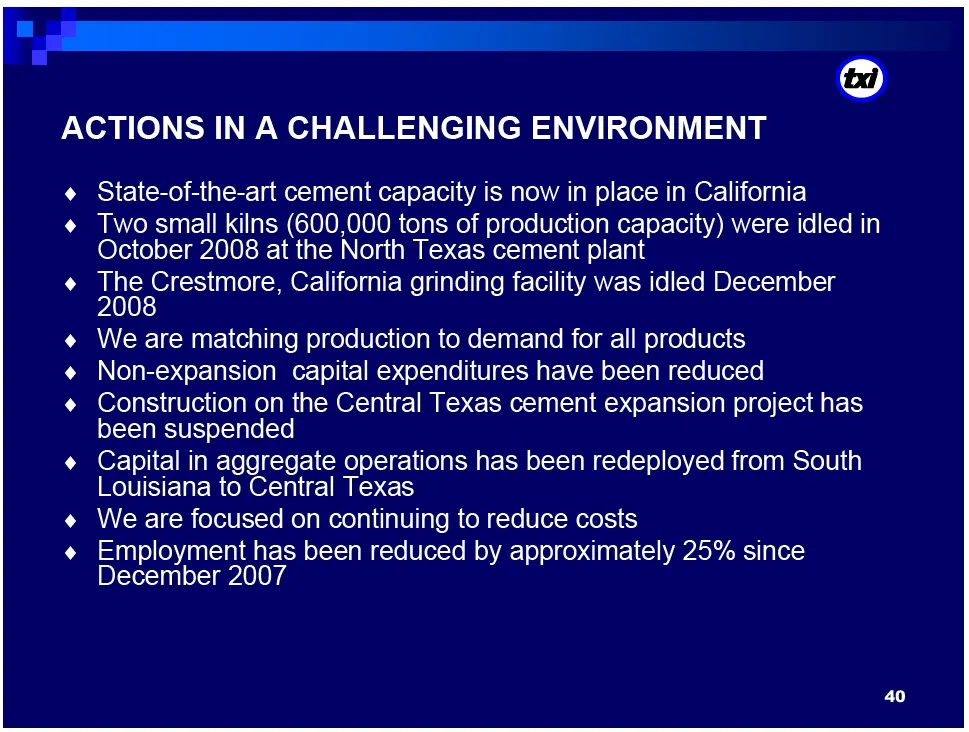
TT ACTIONS IN A CHALLENGING ENVIRONMENT © State-of-the-art cement capacity is now in place in California Two small kilns (600,000 tons of production capacity) were idled in October 2008 at the North Texas cement plant He Nils California grinding facility was idled December We are matching production
Slide 41: Focus on Liquidity
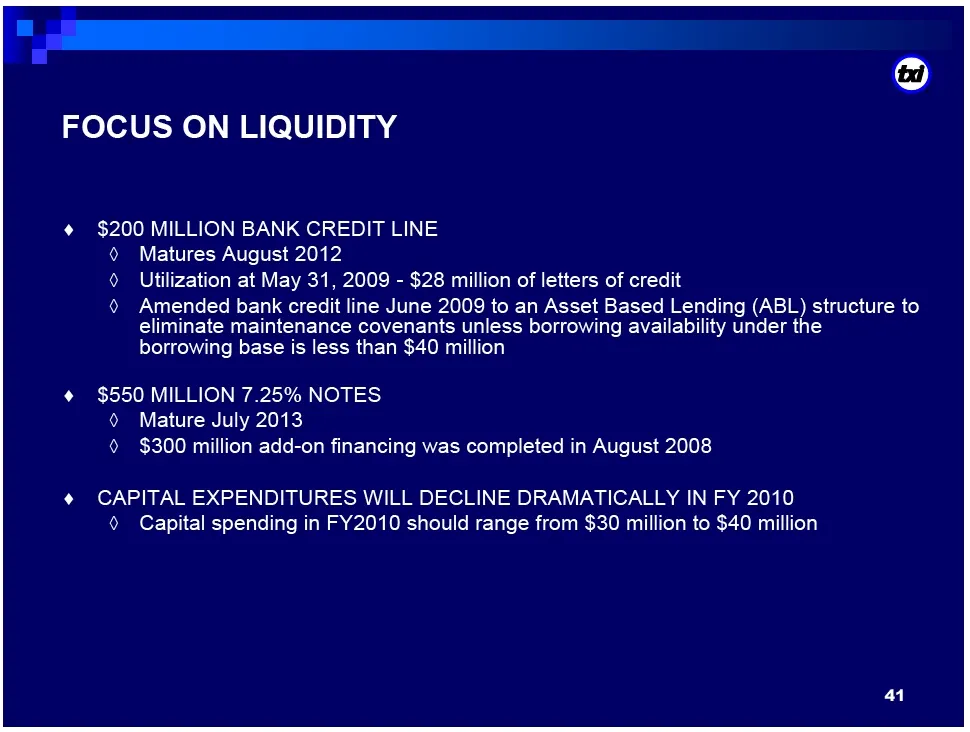
TT FOCUS ON LIQUIDITY ’ aa MILLION BANK CREDIT LINE Matures August 2012 } Utilization at May 31, 2009 - $28 million of letters of credit & Amended bank credit line June 2009 to an Asset Based Lending (ABL) structure to eliminate maintenance covenants unless borrowing availability under the borrowing

Slide 42: Earnings Potential and Strategy
EARNINGS POTENTIAL AND STRATEGY 42
Slide 43: Earnings Potential
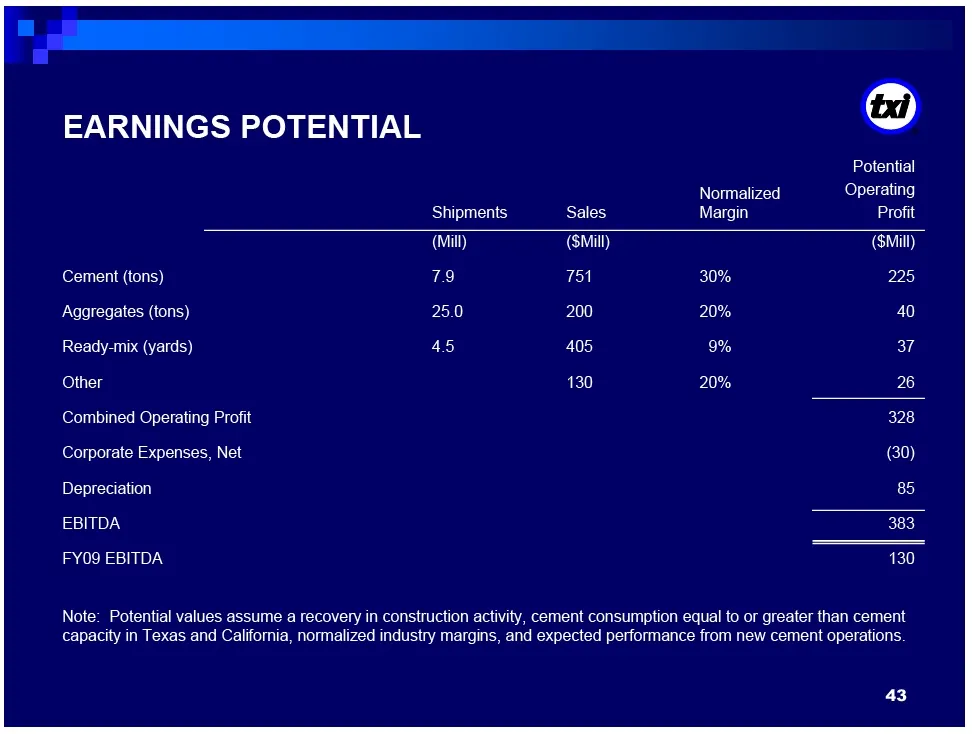
TT EARNINGS POTENTIAL Sales o Potential Normalized Operating Margin Profit Cement (tons) Aggregates (tons) Ready-mix (yards) Other Combined Operating Profit Corporate Expenses, Net Depreciation EBITDA FY09 EBITDA (Smill 751 200 405 (Smilly 225 40 37 26 328 85 383 130 Note: Potential values assume a
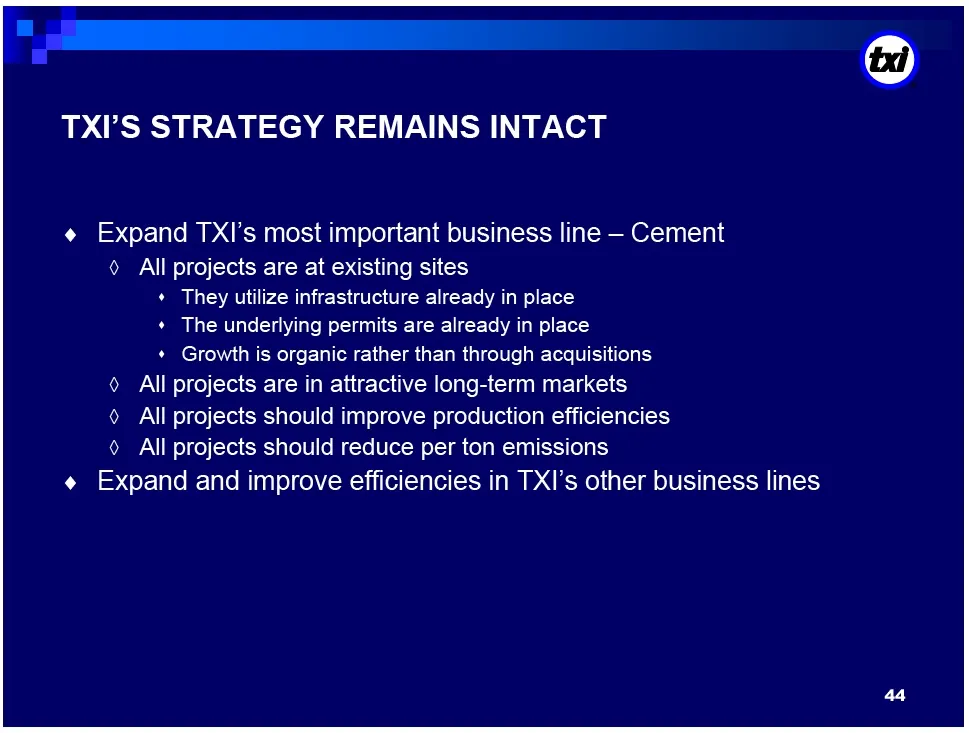
Slide 44: TXI's Strategy Remains Intact
TT TXI’S STRATEGY REMAINS INTACT « Expand TXI’s most important business line - Cement © All projects are at existing sites + They utilize infrastructure already in place + The underlying permits are already in place + Growth is organic rather than through acquisitions © All projects are in attractiv

Slide 45: Addendum - Reconciliation
ADDENDUM - RECONCILIATION EBITDA TO NET INCOME
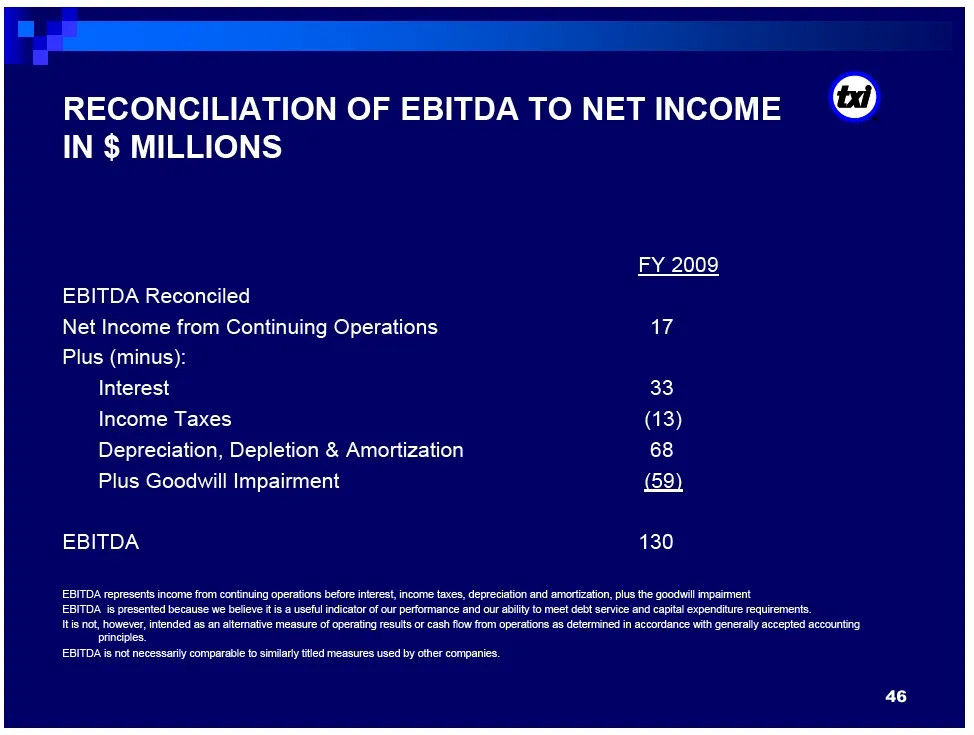
Slide 46: Reconciliation of EBITDA to Net Income
TT RECONCILIATION OF EBITDA TO NET INCOME {tai} IN $ MILLIONS FY 2009 EBITDA Reconciled Net Income from Continuing Operations 17 Plus (minus): Interest 33 Income Taxes (13) Depreciation, Depletion & Amortization 68 Plus Goodwill Impairment (9) EBITDA 130 EBITDA represents income from continuing oper
Slide 47: Hodges Capital Management Annual Investment Forum
HODGES CAPITAL MANAGEMENT 117 ANNUAL INVESTMENT FORUM DALLAS SEPTEMBER 2, 2009 47
Source: SEC EDGAR · DEFA14A filed Sep 2, 2009
More decks from Texas Industries Inc
 BB&T 8th Annual Commercial & Industrial Investor Conference (March 2014)26 slides · Mar 26, 2014
 Merger or Acquisition (January 2014)16 slides · Jan 28, 2014
 Stephens Conference 201337 slides · Nov 12, 2013
 Investor Presentation (March 2013)39 slides · Mar 5, 2013
 Investor Presentation (September 2012)33 slides · Sep 11, 2012
 Bank of America Merrill Lynch Leveraged Finance Conference 201133 slides · Dec 1, 2011