James River Coal — Macquarie Securities Coal and the City Conference 2005
17 slides from James River Coal's conference presentation, Oct 18, 2005
Slide 1: Macquarie Securities Coal and the City Conference
Macquarie Securities Coal and the City Conference Peter T. Socha Chairman Chief Executive Officer October 18, 2005
Slide 2: Forward-Looking Information
2 Forward -Looking Information Certain statements in this presentation, and other written or oral statements made by or on behalf of us, are “forward-looking statements” within the meaning of the federal securities laws. Statements regarding future events and developments and our future performance,
Slide 3: Investment Highlights
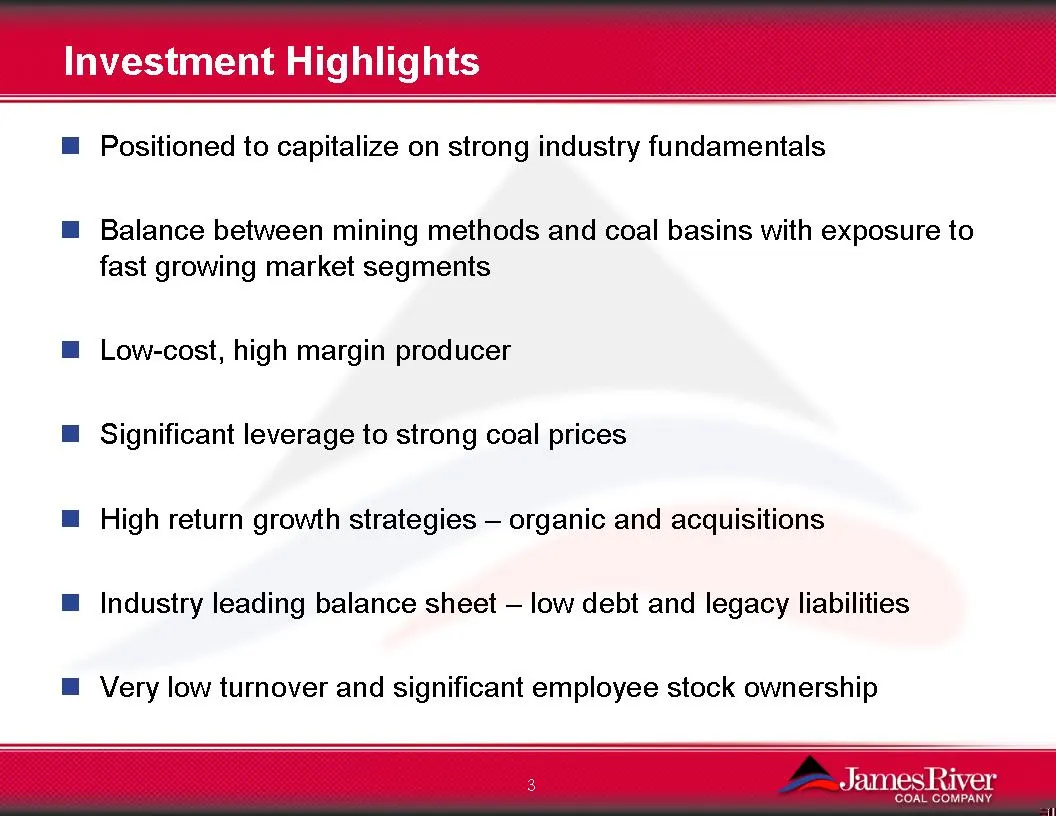
3 Investment Highlights Positioned to capitalize on strong industry fundamentals Balance between mining methods and coal basins with exposure to fast growing market segments Low-cost, high margin producer Significant leverage to strong coal prices High return growth strategies -organic and acquisiti
Slide 4: Growth: Thinner seams in Central Appalachia and Illinois Basin supply
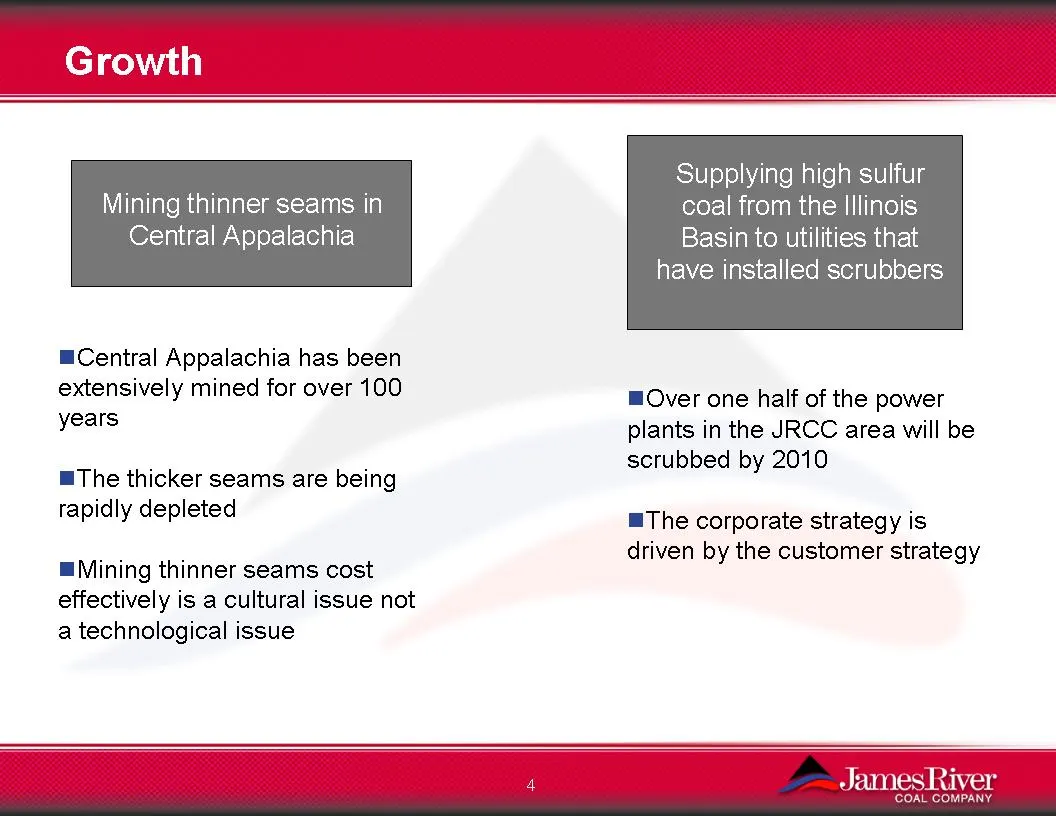
4 GrowthMining thinner seams in Central Appalachia Supplying high sulfur coal from the Illinois Basin to utilities that have installed scrubbers Central Appalachia has been extensively mined for over 100 years The thicker seams are being rapidly depleted Mining thinner seams cost effectively is a cu
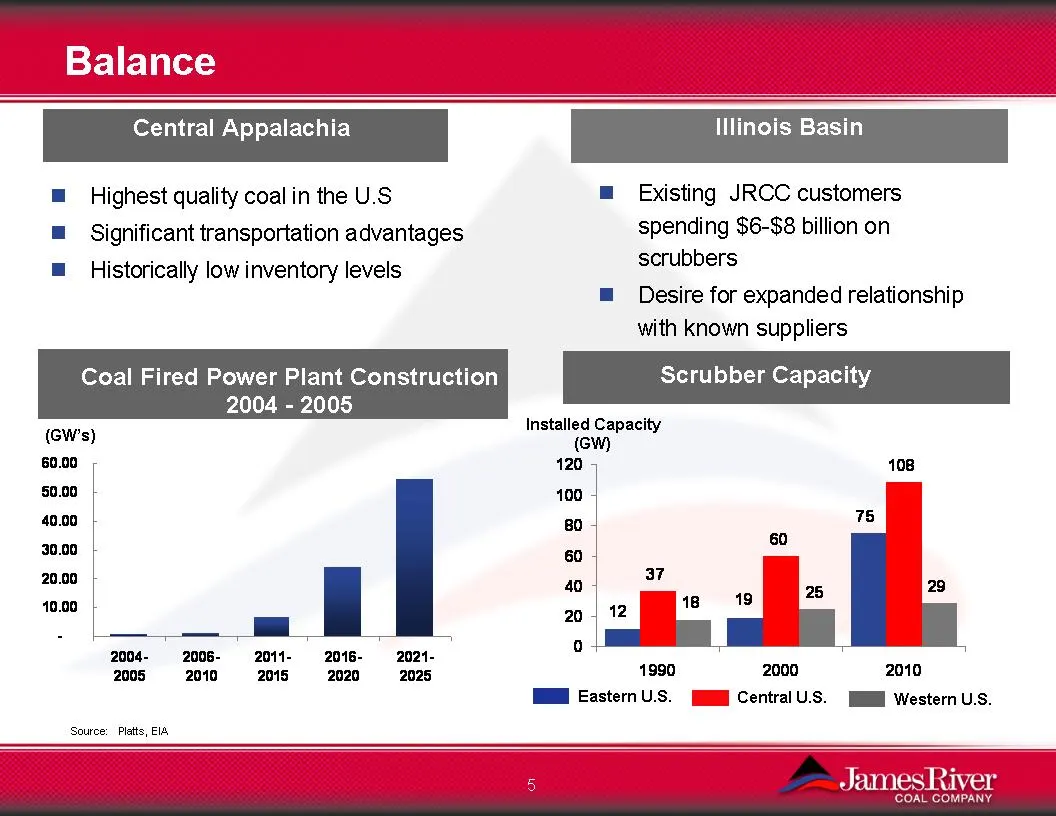
Slide 5: Coal-fired power plant construction and scrubber capacity
Source: Platts, EIA Coal Fired Power Plant Construction 2004 -2005 Balance Highest quality coal in the U.S Significant transportation advantages Historically low inventory levels Scrubber Capacity 19 75 12 108 60 37 18 25 29 0 20 40 60 80 100 120 1990 2000 2010Western U.S. Central U.S. Eastern U.S.
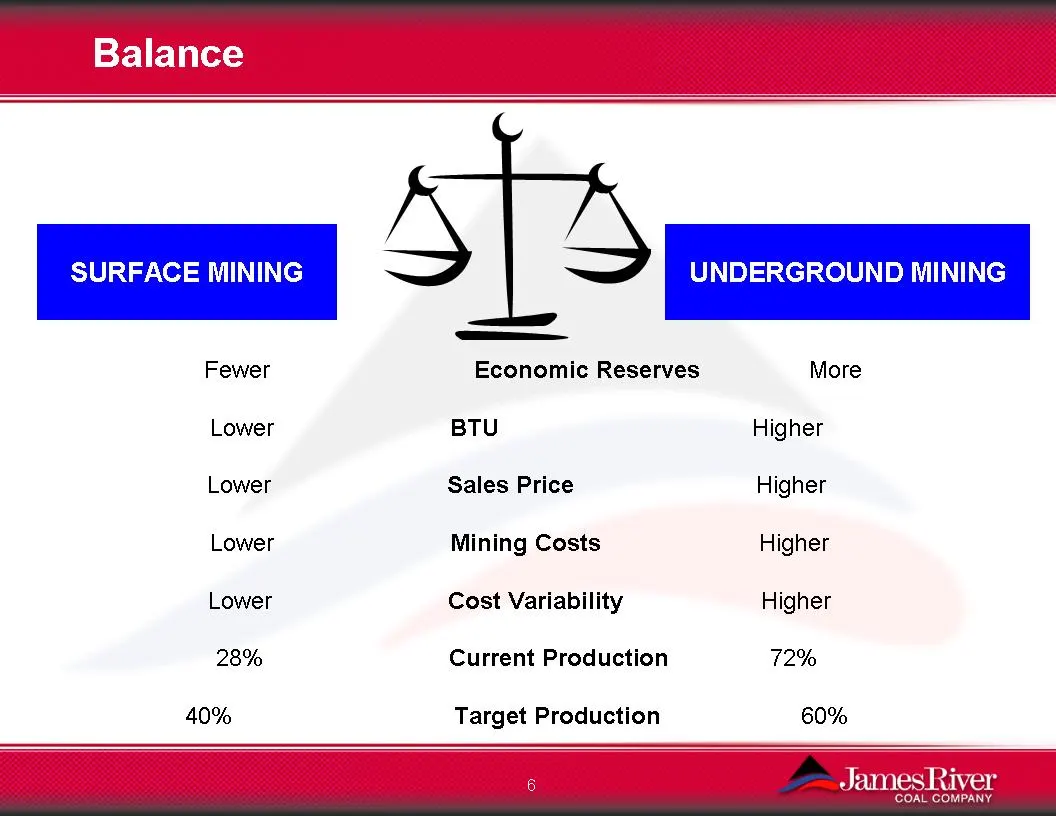
Slide 6: Balance: surface and underground mining mix
6 Balance Fewer Economic Reserves More Lower BTU Higher Lower Sales Price Higher Lower Mining Costs Higher Lower Cost Variability Higher 28% Current Production 72% 40% Target Production 60% SURFACE MINING UNDERGROUND MINING
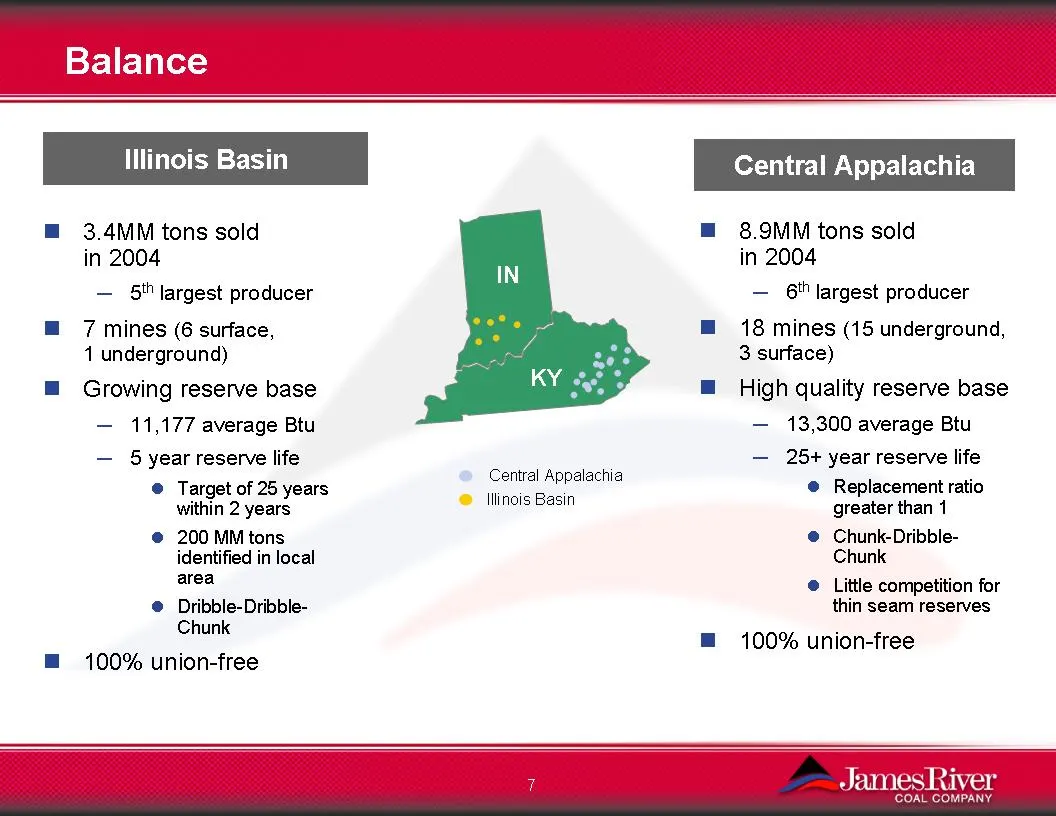
Slide 7: Central Appalachia and Illinois Basin operations
Central Appalachia Illinois Basin Balance 3.4MM tons sold in 2004─5 th largest producer 7 mines (6 surface, 1 underground) Growing reserve base─11,177 average Btu ─5 year reserve life Target of 25 years within 2 years 200 MM tons identified in local area Dribble-Dribble-Chunk 100% union-free8.9MM to
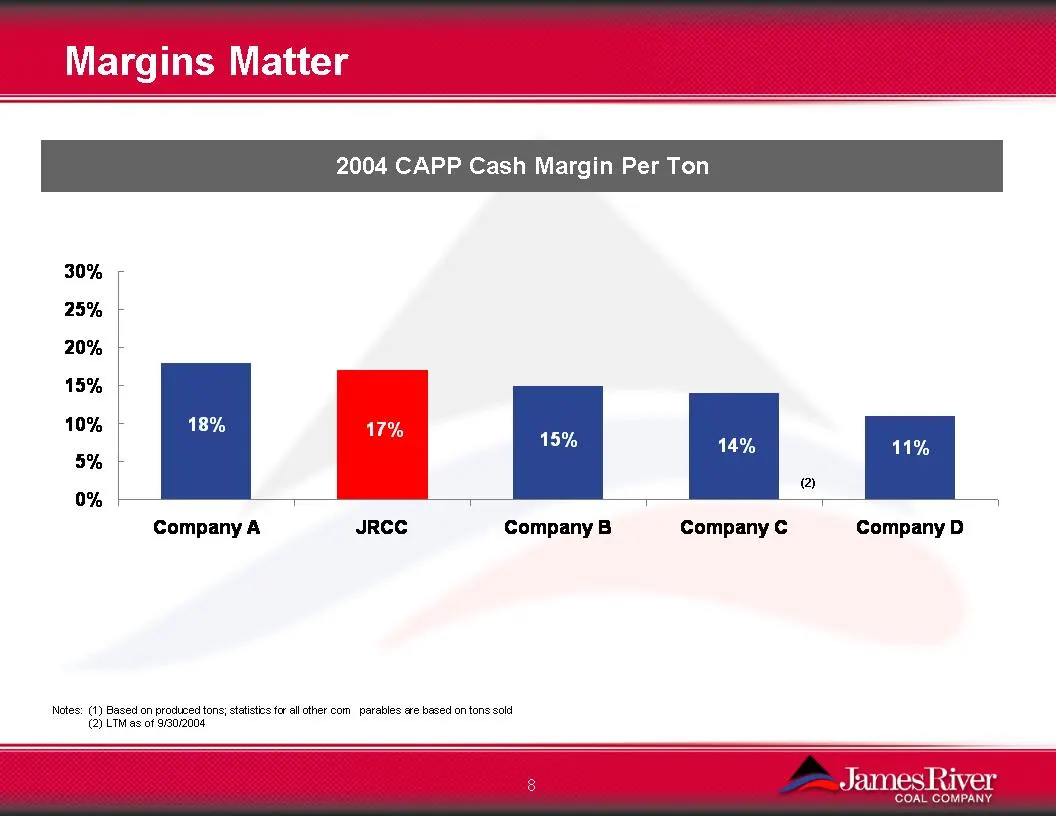
Slide 8: Margins Matter: 2004 CAPP cash margin per ton
17% 15% 14% 11% 18% 0% 5% 10% 15% 20% 25% 30% Company AJRCC Company B Company C Company D 2004 CAPP Cash Margin Per Ton Notes:(1) Based on produced tons; statistics for all other comparables are based on tons sold (2) LTM as of 9/30/2004 Margins Matter(2)
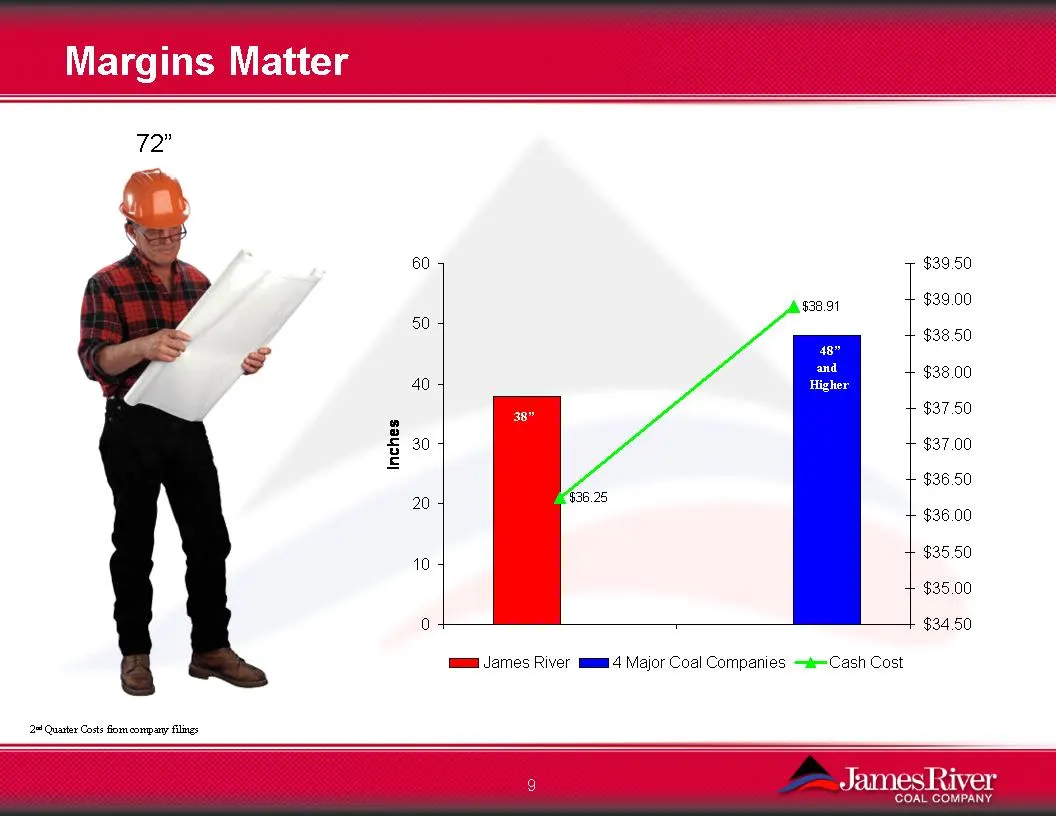
Slide 9: Margins Matter: cash cost versus major coal companies
$36.25 $38.91 0 10 20 30 40 50 60 Inches $34.50 $35.00 $35.50 $36.00 $36.50 $37.00 $37.50 $38.00 $38.50 $39.00 $39.50 James River 4 Major Coal Companies Cash Cost Margins Matter 72”2 nd Quarter Costs from company filings 38”48”and Higher
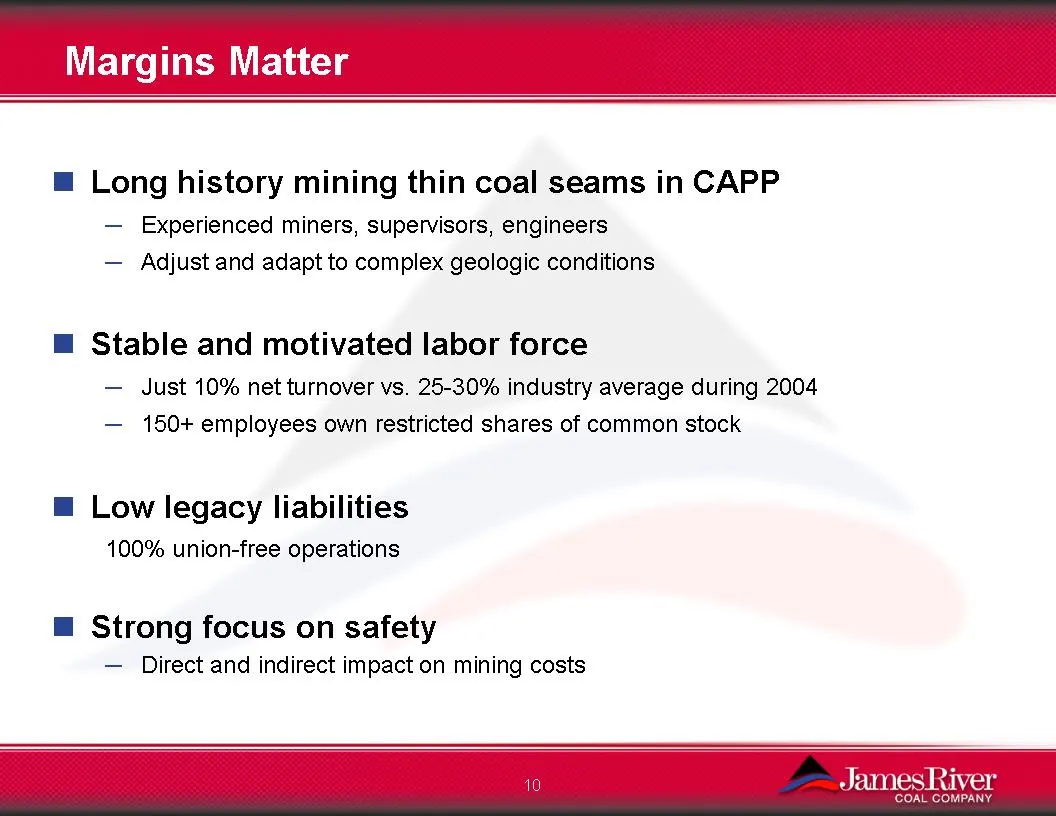
Slide 10: Margins Matter
10 Margins Matter Long history mining thin coal seams in CAPP ─ Experienced miners, supervisors, engineers ─ Adjust and adapt to complex geologic conditions Stable and motivated labor force ─ Just 10% net turnover vs. 25-30% industry average during 2004 ─150+ employees own restricted shares of commo
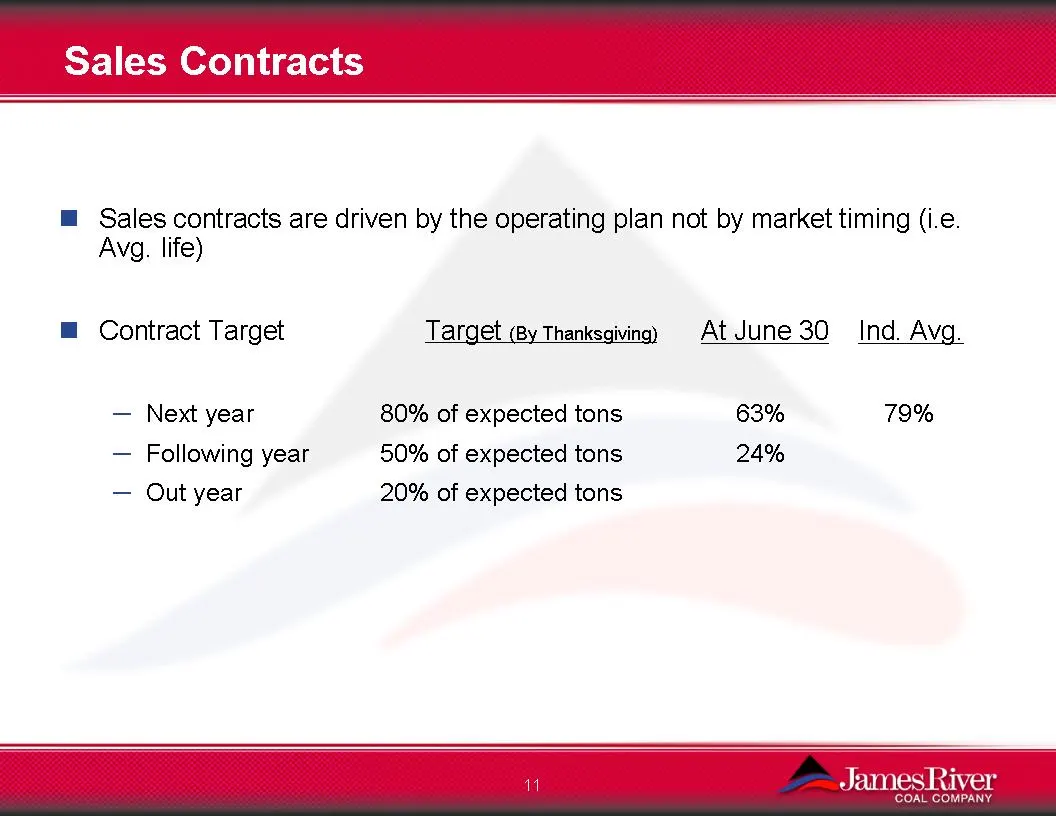
Slide 11: Sales Contracts
11 Sales Contracts Sales contracts are driven by the operating plan not by market timing (i.e. Avg. life) Contract Target Target (By Thanksgiving)At June 30Ind. Avg. ─ Next year 80% of expected tons 63% 79% ─ Following year 50% of expected tons 24%─Out year 20% of expected tons
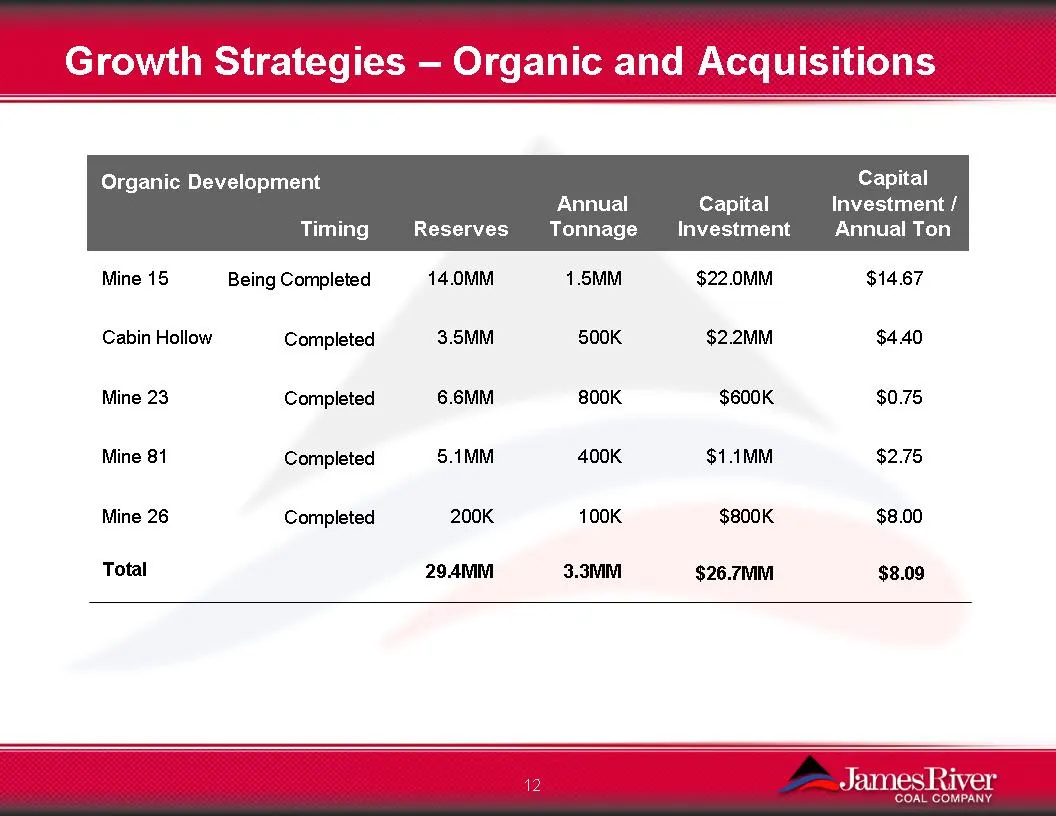
Slide 12: Growth Strategies - Organic and Acquisitions
12 Growth Strategies -Organic and Acquisitions Reserves Annual Tonnage Capital Investment Capital Investment /Annual Ton Mine 15 Cabin Hollow Mine 23 Mine 81 Mine 26 14.0MM 3.5MM 6.6MM 5.1MM 200K 1.5MM 500K 800K 400K 100K $22.0MM $2.2MM $600K $1.1MM $800K $14.67 $4.40 $0.75 $2.75 $8.00 Organic Devel
Slide 13: Organic Growth Strategies: Mine 15 Development
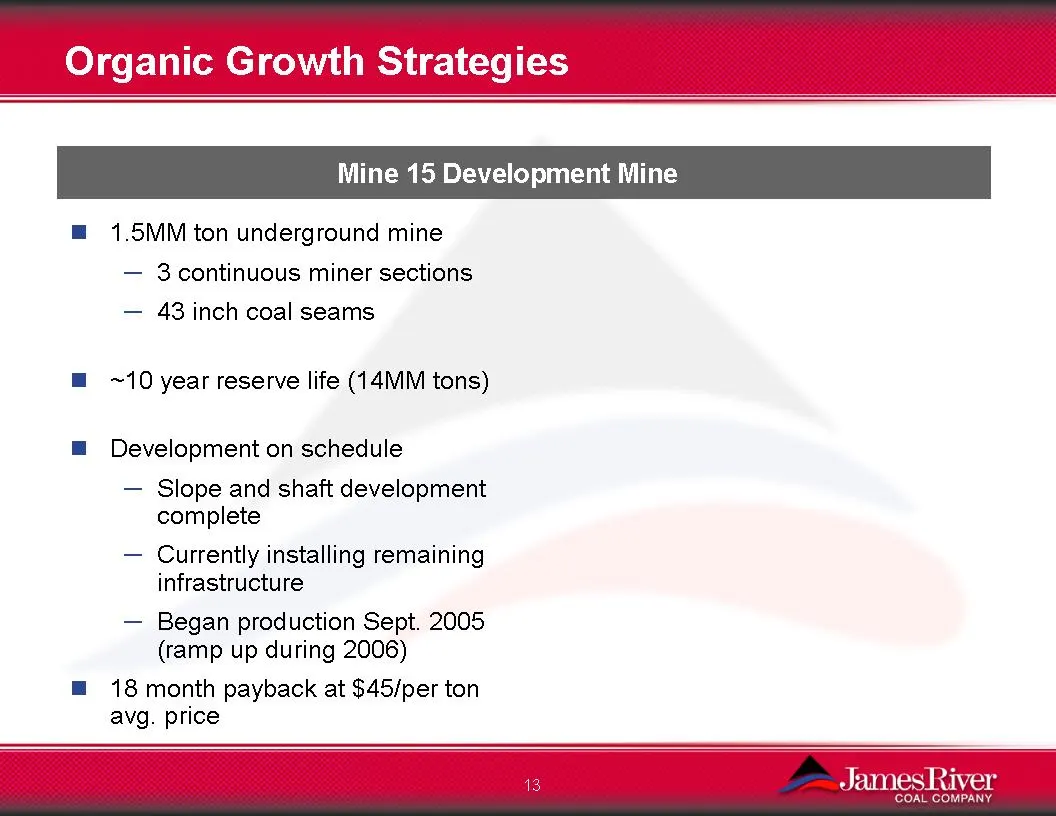
13 Organic Growth Strategies 1.5MM ton underground mine ─3 continuous miner sections─43 inch coal seams ~10 year reserve life (14MM tons)Development on schedule ─ Slope and shaft development complete ─Currently installing remaining infrastructure ─ Began production Sept. 2005 (ramp up during 2006) 1
Slide 14: Growth Strategies
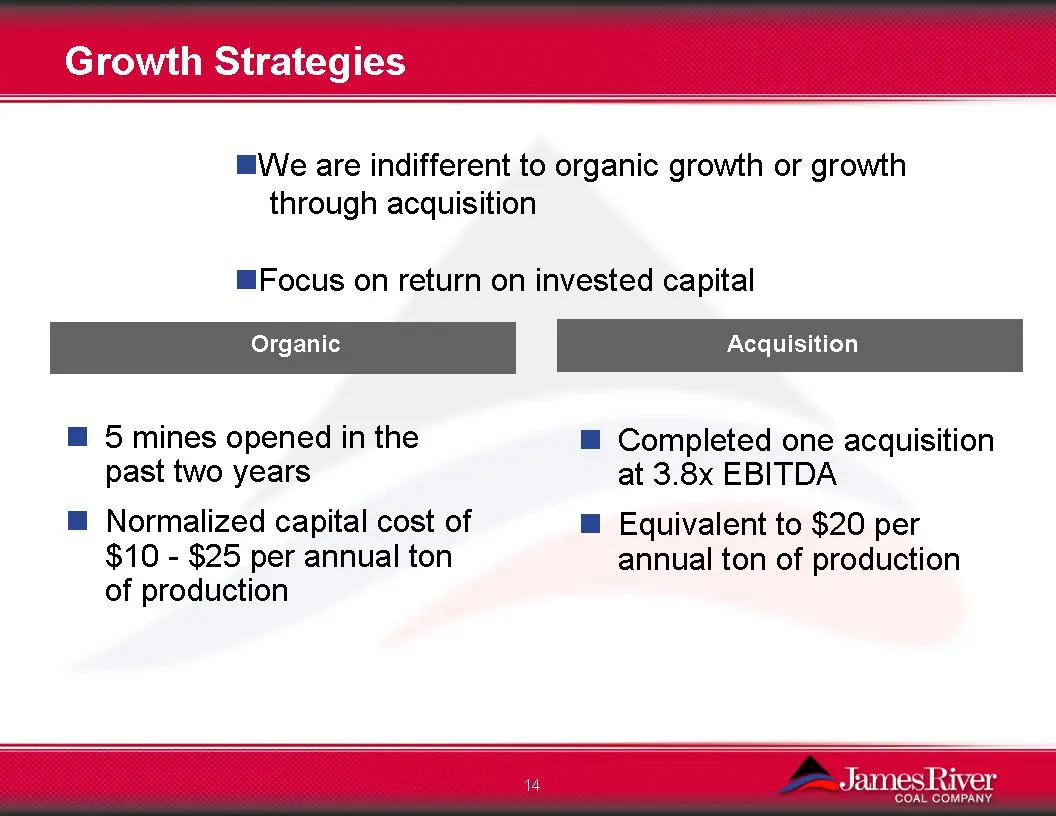
14 Growth Strategies 5 mines opened in the past two years Normalized capital cost of $10 -$25 per annual ton of production Completed one acquisition at 3.8x EBITDA Equivalent to $20 per annual ton of production Organic Acquisition We are indifferent to organic growth or growth through acquisition Fo
Slide 15: Organic Growth Strategies: CAPP Surface Mining
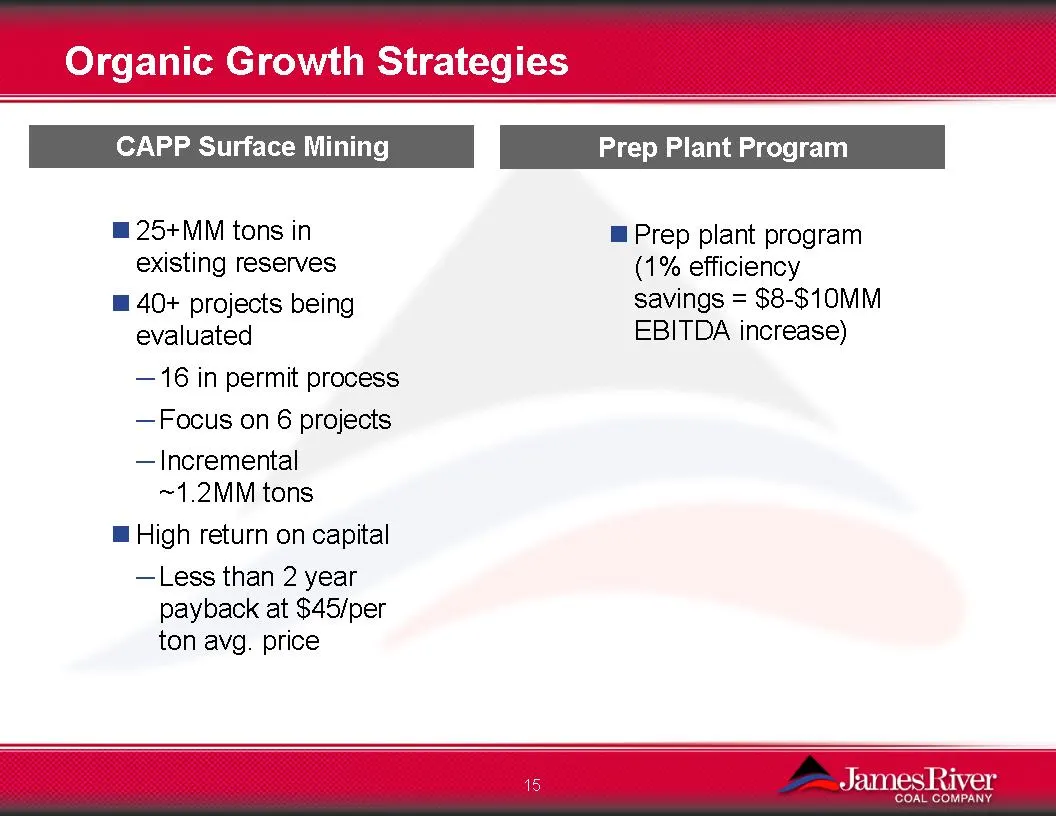
15Organic Growth Strategies CAPP Surface Mining25+MM tons in existing reserves40+ projects being evaluated─16 in permit process ─ Focus on 6 projects ─ Incremental ~1.2MM tons High return on capital ─ Less than 2 year payback at $45/per ton avg. price Prep plant program (1% efficiency savings = $8-$
Slide 16: Summary
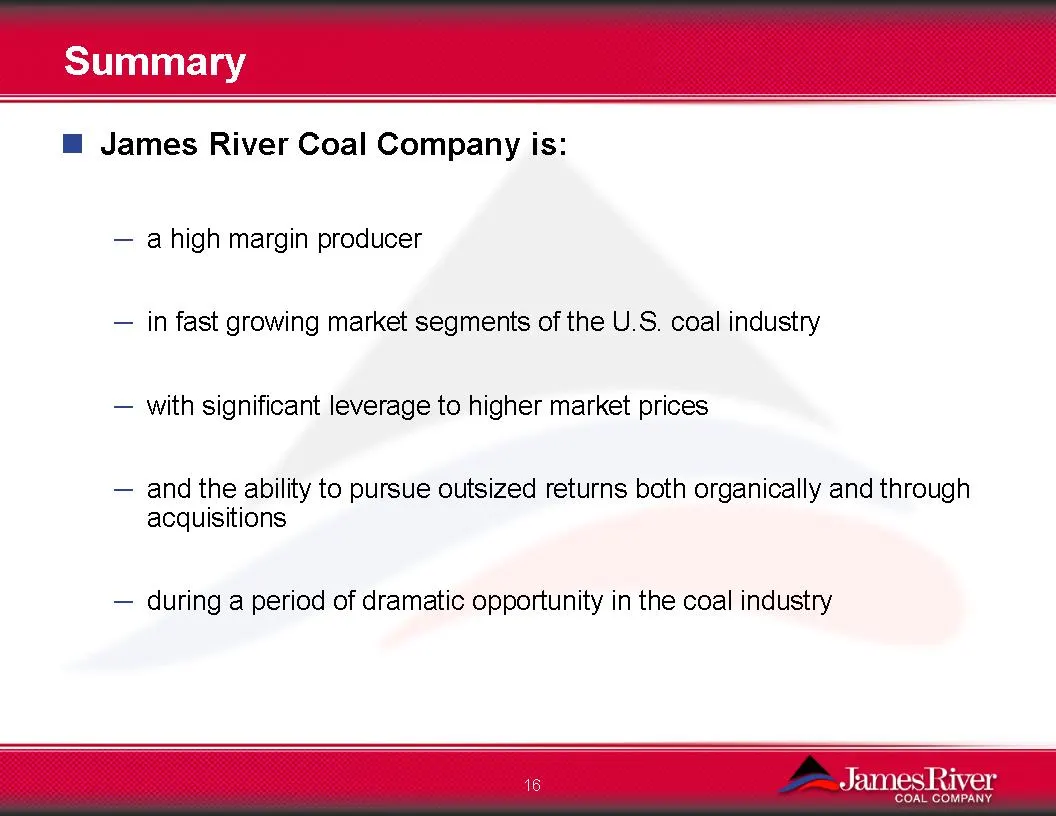
16 Summary James River Coal Company is: ─ a high margin producer ─ in fast growing market segments of the U.S. coal industry ─ with significant leverage to higher market prices ─ and the ability to pursue outsized returns both organically and through acquisitions ─ during a period of dramatic opport
Slide 17: James River Coal Company
James River Coal Company
Source: SEC EDGAR · 8-K filed Oct 18, 2005
More decks from James River Coal Company
 Corporate Update (November 2013)19 slides · Nov 7, 2013
 Q2 2013 Earnings Presentation20 slides · Aug 9, 2013
 Q1 2013 Earnings Presentation18 slides · May 1, 2013
 Corporate Update (March 2013)19 slides · Mar 7, 2013
 Corporate Update (November 2012)17 slides · Nov 7, 2012
 Q2 2012 Earnings Presentation19 slides · Aug 9, 2012