Plains Exploration & Production Company
Plains Exploration & Production — Tristone Capital Global Energy Forum May 2008
27 slides from Plains Exploration & Production's conference presentation, May 8, 2008
Slide 1: Tristone Capital Global Energy Forum May 2008
Tristone Capital Global Energy Forum May 2008 Tristone Capital Global Energy Forum May 2008 PXP PXP Exhibit 99.2

Slide 2

Slide 3

Slide 4

Slide 5: PXP is an independent oil and gas company
PXP is an independent oil and gas company primarily engaged in the activities of acquiring, developing, exploring and producing oil and gas in its core areas of operation: California, Rockies, Gulf Coast, Gulf of Mexico, Texas Panhandle, South Texas and the Permian Basin of the United States. PXP is

Slide 6: Forward-looking statements
2 Except for the historical information contained herein, the matters discussed in this presentation are “forward-looking statements” as defined by the Securities and Exchange Commission. These statements involve certain assumptions PXP made based on its experience and perception of historical trend

Slide 7: PXP Today: Strategic Enhancement of Asset Portfolio
3 Increased diversification into high quality basins Large inventory of cash producing and growth opportunities Improving unit economics and cost structure Lower risk more balanced asset base (1) Represents year end 2007 proved reserves adjusted for asset sales closed in February 2008 and the South
Slide 8: Valuation
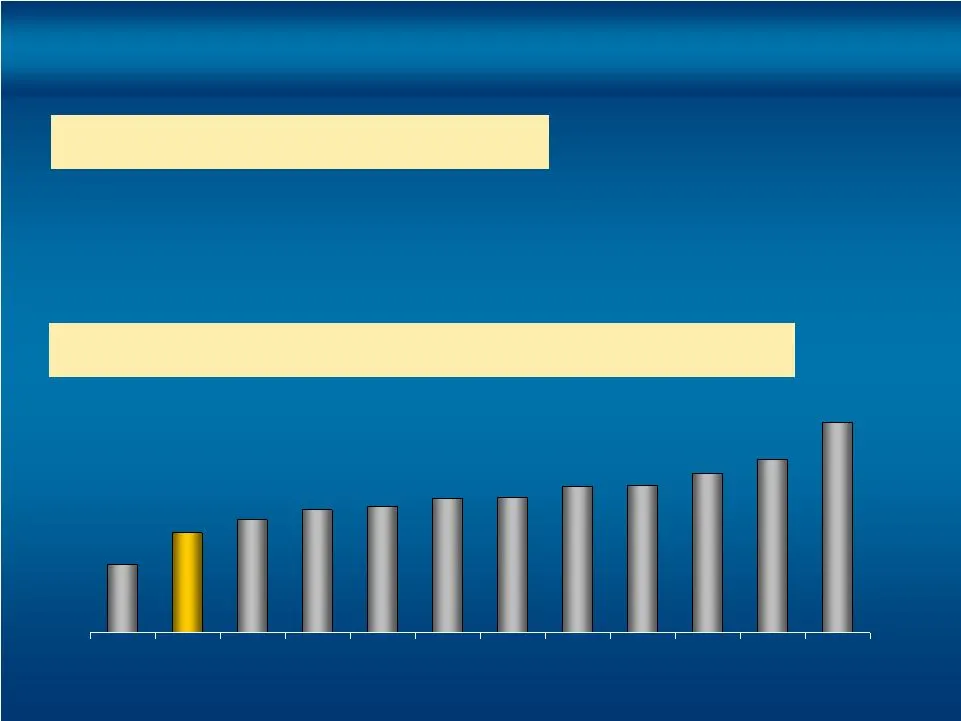
4 Sell-Side Consensus NAV = $83.30 / share $9.84 $14.51 $16.40 $17.72 $18.42 $19.52 $19.72 $21.30 $21.46 $23.14 $25.15 $30.53 PXD PXP APC NBL APA FST XTO COG NFX CHK EOG HK Source: Credit Suisse as of 5/01/08 PXP Valuation Enterprise Value/per BOE Proved Reserves Net Asset Valuation: 5-01-08

Slide 9: Consistent Value Creating Strategy
5 Grow production from development assets Maximize free cash flow generating assets Deliver upside growth via high-quality, high-impact projects Maintain financial flexibility Repurchase shares consistently After several years of strategically aligning our asset base PXP is well positioned to: PXP C
Slide 10: Accelerating Value
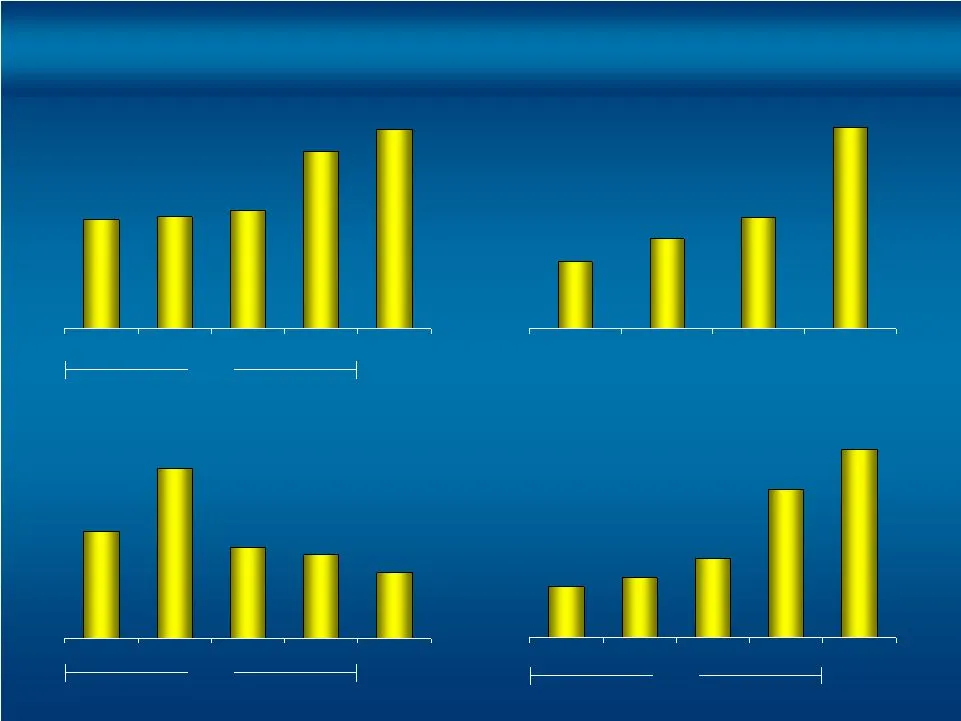
6 51.9 53.5 57.1 85.1 95.7 Q1 Q2 Q3 Q4 Q1 Production Thousand BOEPD $18.25 $19.26 $17.98 $17.85 $17.57 Q1 Q2 Q3 Q4 Q1 Production Costs $/BOE 2007 2008 2007 2008 83% 84% 85% 89% 2005 2006 2007 Q1 Oil Price Realization % NYMEX 2008 $94.6 $111.0 $146.0 $275.4 $350.2 Q1 Q2 Q3 Q4 Q1 Operating Cash Flow N

Slide 11: Accelerating Value
7 Vicksburg discovery announced Flatrock complex expanding 1st production in January Flatrock # 2 well tested at 114 MMCFED 2 additional successful wells announced 3 rigs currently running in the area Property acquisition closed April 2008 Consistent with value creating strategy Expanding strong ope
Slide 12: Proven Consistent Value Generator
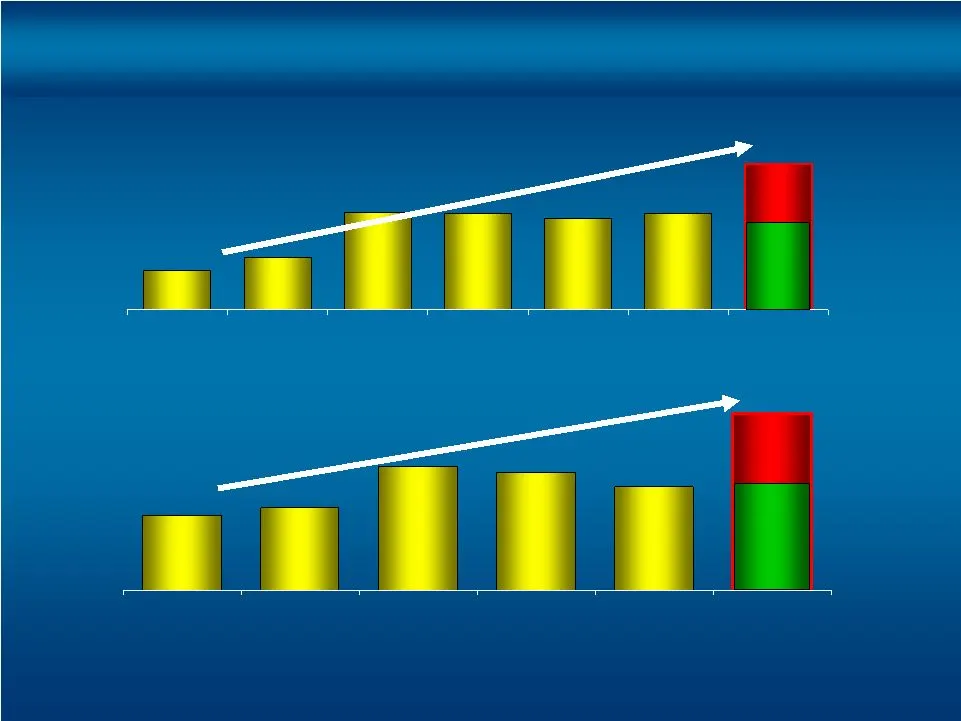
8 2002 2003 2004 2005 2006 2007 2008E 2002 2003 2004 2005 2006 2007 Production: 24% CAGR Proved Reserves: 19% CAGR 2008E production represents guidance mid-point. 2007 proved reserves represent year end 2007 proved reserves adjusted for asset sales closed in February 2008 and the South Texas propert

Slide 13: Improving Unit Economics
9 Production costs estimated to decrease $1.10 / BOE or 6% from 2007 G&A expenses (1) estimated to decrease $0.50 / BOE or 15% from 2007 Oil price realizations expected to increase to 88% of NYMEX or 4% greater than 2007 1 st QTR 2008 NYMEX pricing up versus FY 2007, oil up 35%, natural gas up 17% (
Slide 14: Lower Risk Capital Allocation
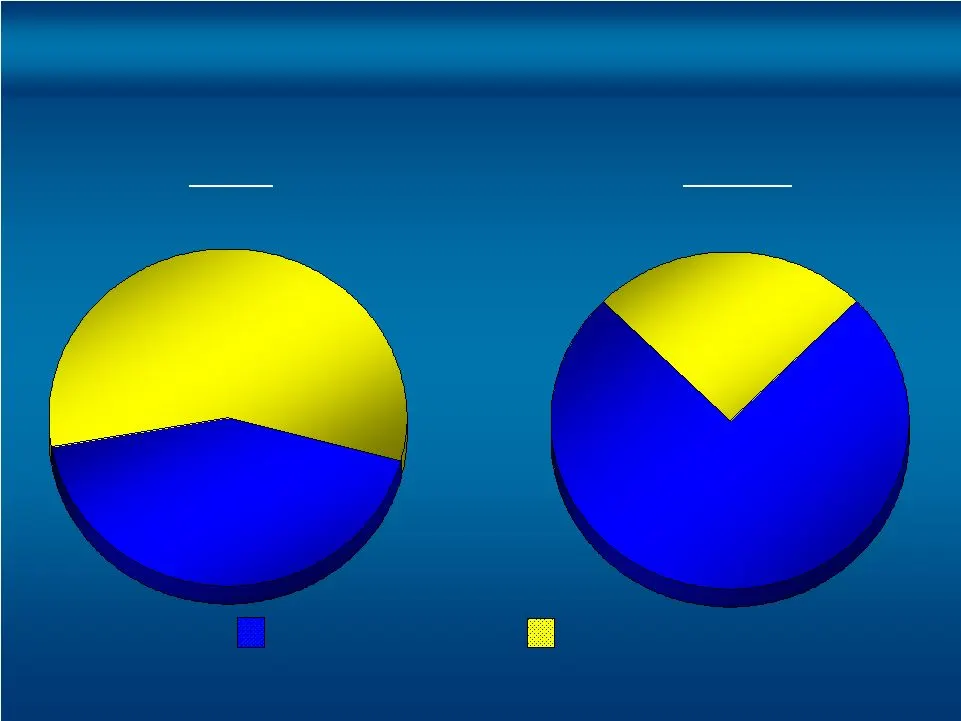
10 43% 2007 $820 million 2008E $1.15 billion 75% Development Capital Exploration Capital Capital Program PXP Lower Risk Capital Allocation 57% 25%
Slide 15
Slide 16
Slide 17: Rockies – Cash & Growth
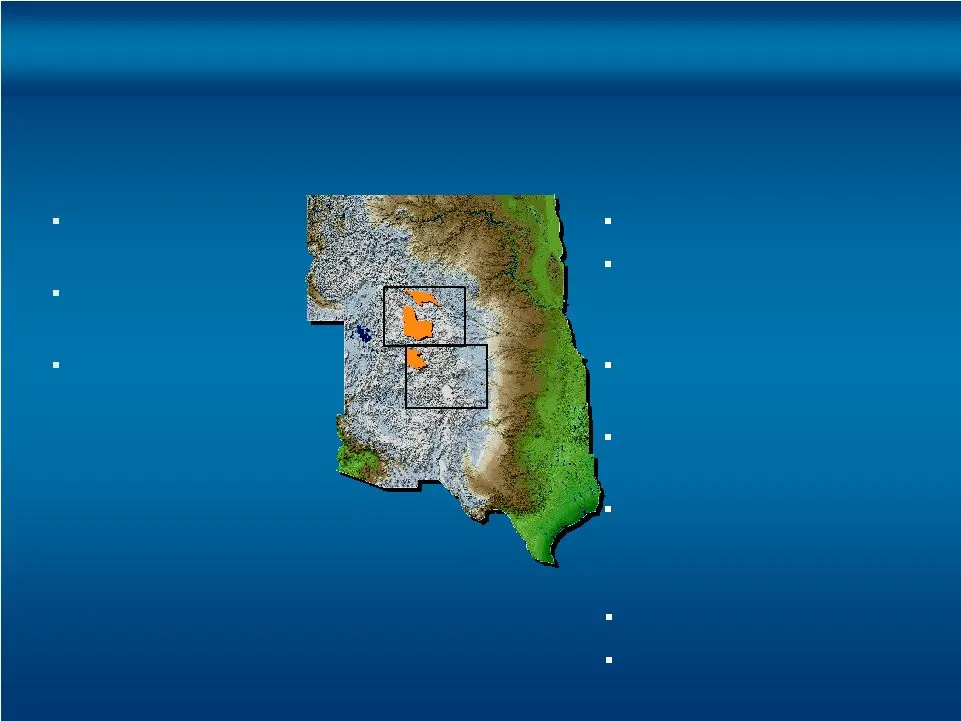
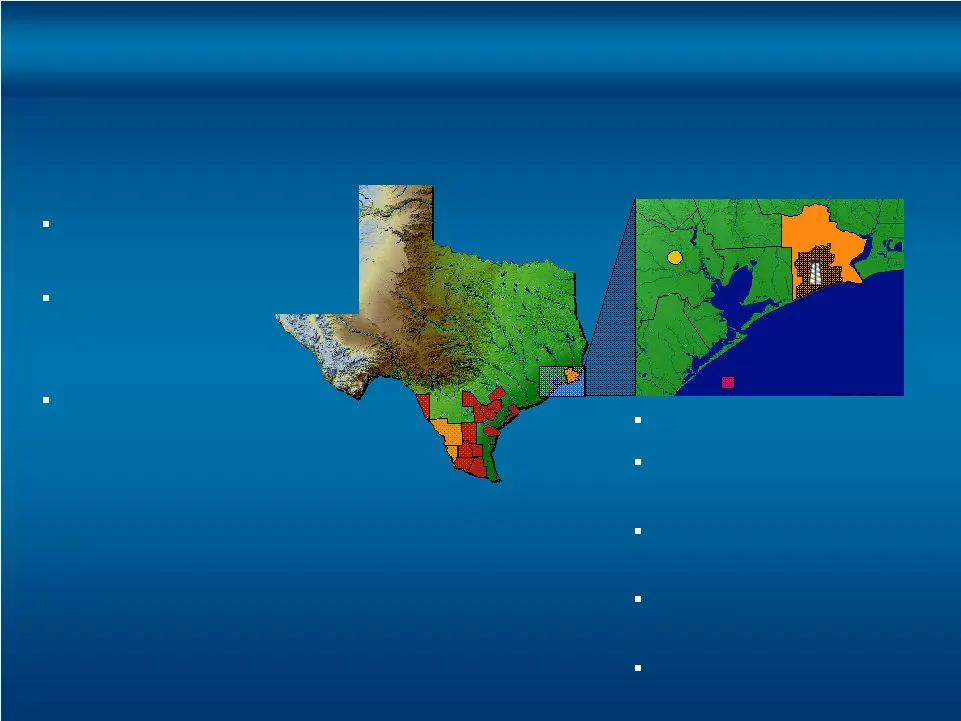
13 CASH 39 MMBOE net proved reserves 30 MMBOE net probable/possible 14% non-operated working interest GROWTH 60,000 acres 5,700 BOEPD net exit rate anticipated by year end 2008 44 MMBOE net proved reserves 116 MMBOE net probable/possible PXP is operator with 50% working interest Reserves: As of 12/3
Slide 18: Panhandle/Permian – Cash & Growth
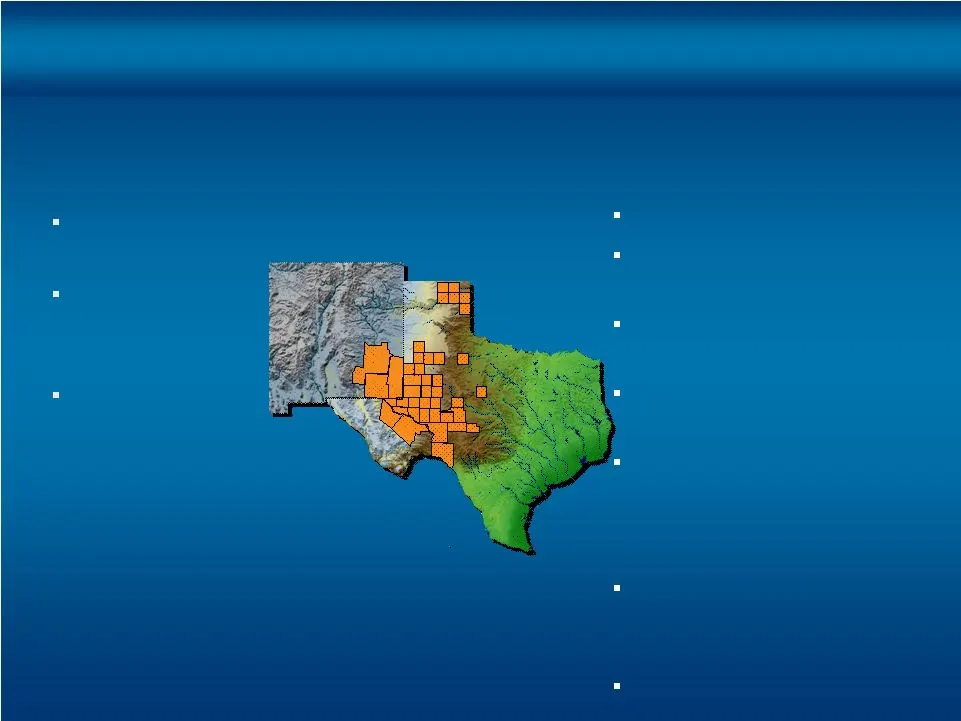
14 CASH 48 MMBOE net proved reserves 72 MMBOE net probable/ possible CO 2 enhanced recovery potential GROWTH 495,000 acres 715 square miles of 3D seismic 41 MMBOE net proved reserves 82 MMBOE net probable/possible Develop: Marvin Lake, Wheeler, & Courson Ranch, 20 to 25 wells planned in 2008 Explore
Slide 19
Slide 20: Gulf of Mexico – Cash & Growth
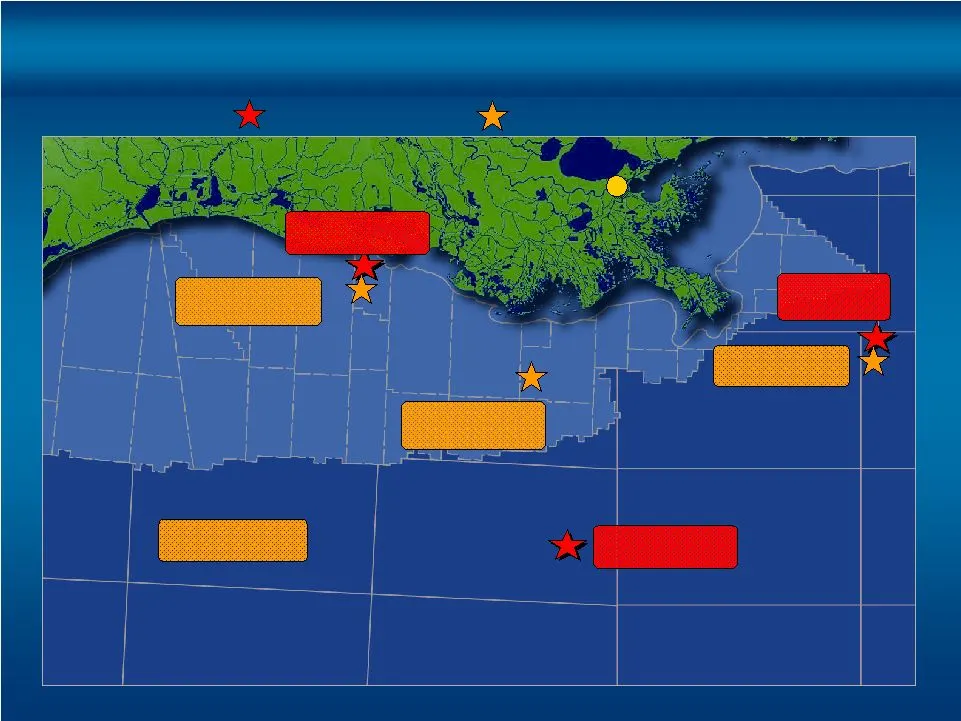
16 Discoveries New Orleans 2008+ Drilling PXP Gulf of Mexico – Cash & Growth Success Continues Discoveries Vicksburg Friesian 2008+ Drilling Vicksburg # 2 Flatrock 5 wells planned South Timbalier 168 Paleogene # 1 Flatrock Field
Slide 21: Upside Growth Drilling Catalysts
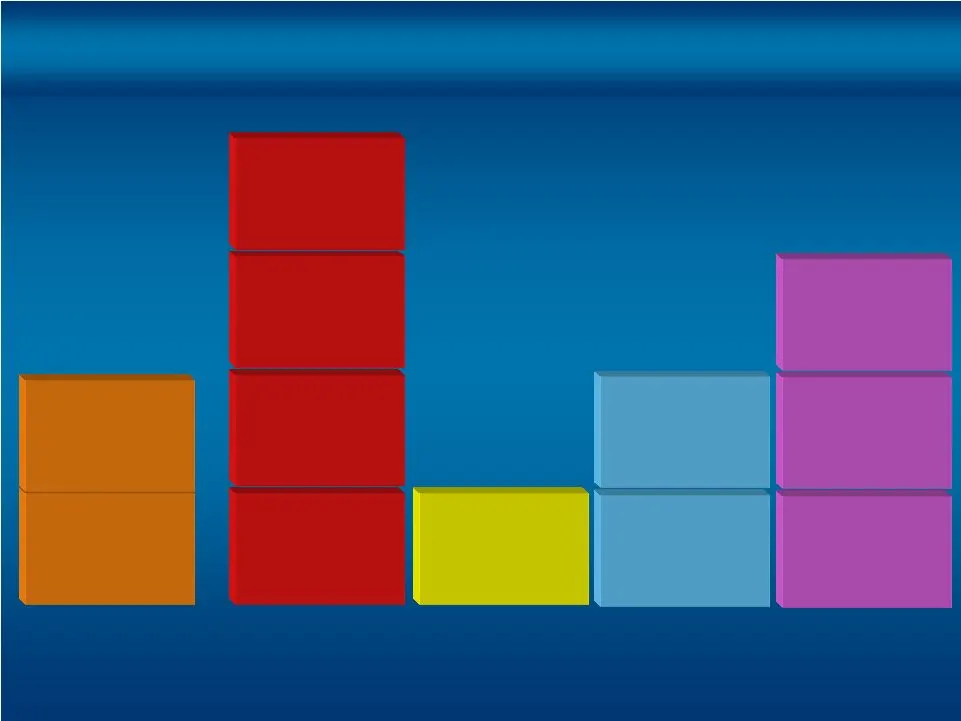
17 Paleogene # 1 Eagle Vietnam # 1 2008+ Flatrock # 6, # 7 T-Ridge 4Q08 600 MMBOE Proved 497 MMBOE 2P/3P Flatrock # 5 2Q08 3Q08 ~1.1 Billion BOE 3P Reserves Pro Forma Reserves (1) Flatrock # 3, # 4 Mound Point East # 1 South Timbalier 168 # 1 Vicksburg # 2 (1) Represents year end 2007 proved reserve

Slide 22: Upside Growth Catalysts
18 Strong Production Growth from Development Program Exploration Gulf of Mexico T-Ridge Eagle Vietnam California Real Estate – Montebello Share Repurchase PXP Upside Growth Catalysts – – – – “Accelerating Per Share Value”

Slide 23

Slide 24

Slide 25

Slide 26: PXP is an independent oil and gas company
19 PXP is an independent oil and gas company primarily engaged in the activities of acquiring, developing, exploring and producing oil and gas in its core areas of operation: California, Rockies, Gulf Coast, Gulf of Mexico, Texas Panhandle, South Texas and the Permian Basin of the United States. PXP

Slide 27: Operating cash flow reconciliation
20 7 0 0 2 Q 1 Q 2 Q 3 Q 4 Q1 ) s r a l l o d f o s n o i l l i m n i ( 284.8 $ 302.3 $ 144.5 $ 121.3 $ 20.0 $ 87.2 1.9 27.1 15.3 98.1 (21.8) (28.8) (25.6) (25.6) (23.5) 350.2 $ 275.4 $ 146.0 $ 111.0 $ 94.6 $ 2008 The following chart reconciles Net Cash Provided by Operating Activities (GAAP) to Ope
Source: SEC EDGAR · 8-K filed May 8, 2008
More decks from Plains Exploration & Production Company
 Global Metals, Mining & Steel Conference 201333 slides · May 14, 2013
 Q1 2013 Earnings Presentation46 slides · Apr 19, 2013
 Merger or Acquisition (February 2013)35 slides · Feb 25, 2013
 2013 Credit Suisse Energy Summit10 slides · Feb 5, 2013
 Merger or Acquisition (January 2013)30 slides · Jan 17, 2013
 Credit Suisse 2012 Energy Summit32 slides · Feb 7, 2012