Real Goods Solar — Investor Presentation (July 2014)
30 slides from Real Goods Solar's investor presentation, Jul 3, 2014
Slide 1: Corporate Presentation June 2014
Exhibit 99.2 Exhibit SERVING Corporate June NASDAQ: 2014 EX99_2 Presentation SOLAR RGSE SINCE 1978
Slide 2: Important Cautions Regarding Forward-Looking Statements
SERVING Important This Forward-looking its materially conditions, Securities 2© 2014 assumptions communication RGS Cautions and different SOLAR introduction Energy. Exchange and statements results Regarding SINCE expectations includes Allof Commission. Rights include, new 1978 may forward-looking Fo
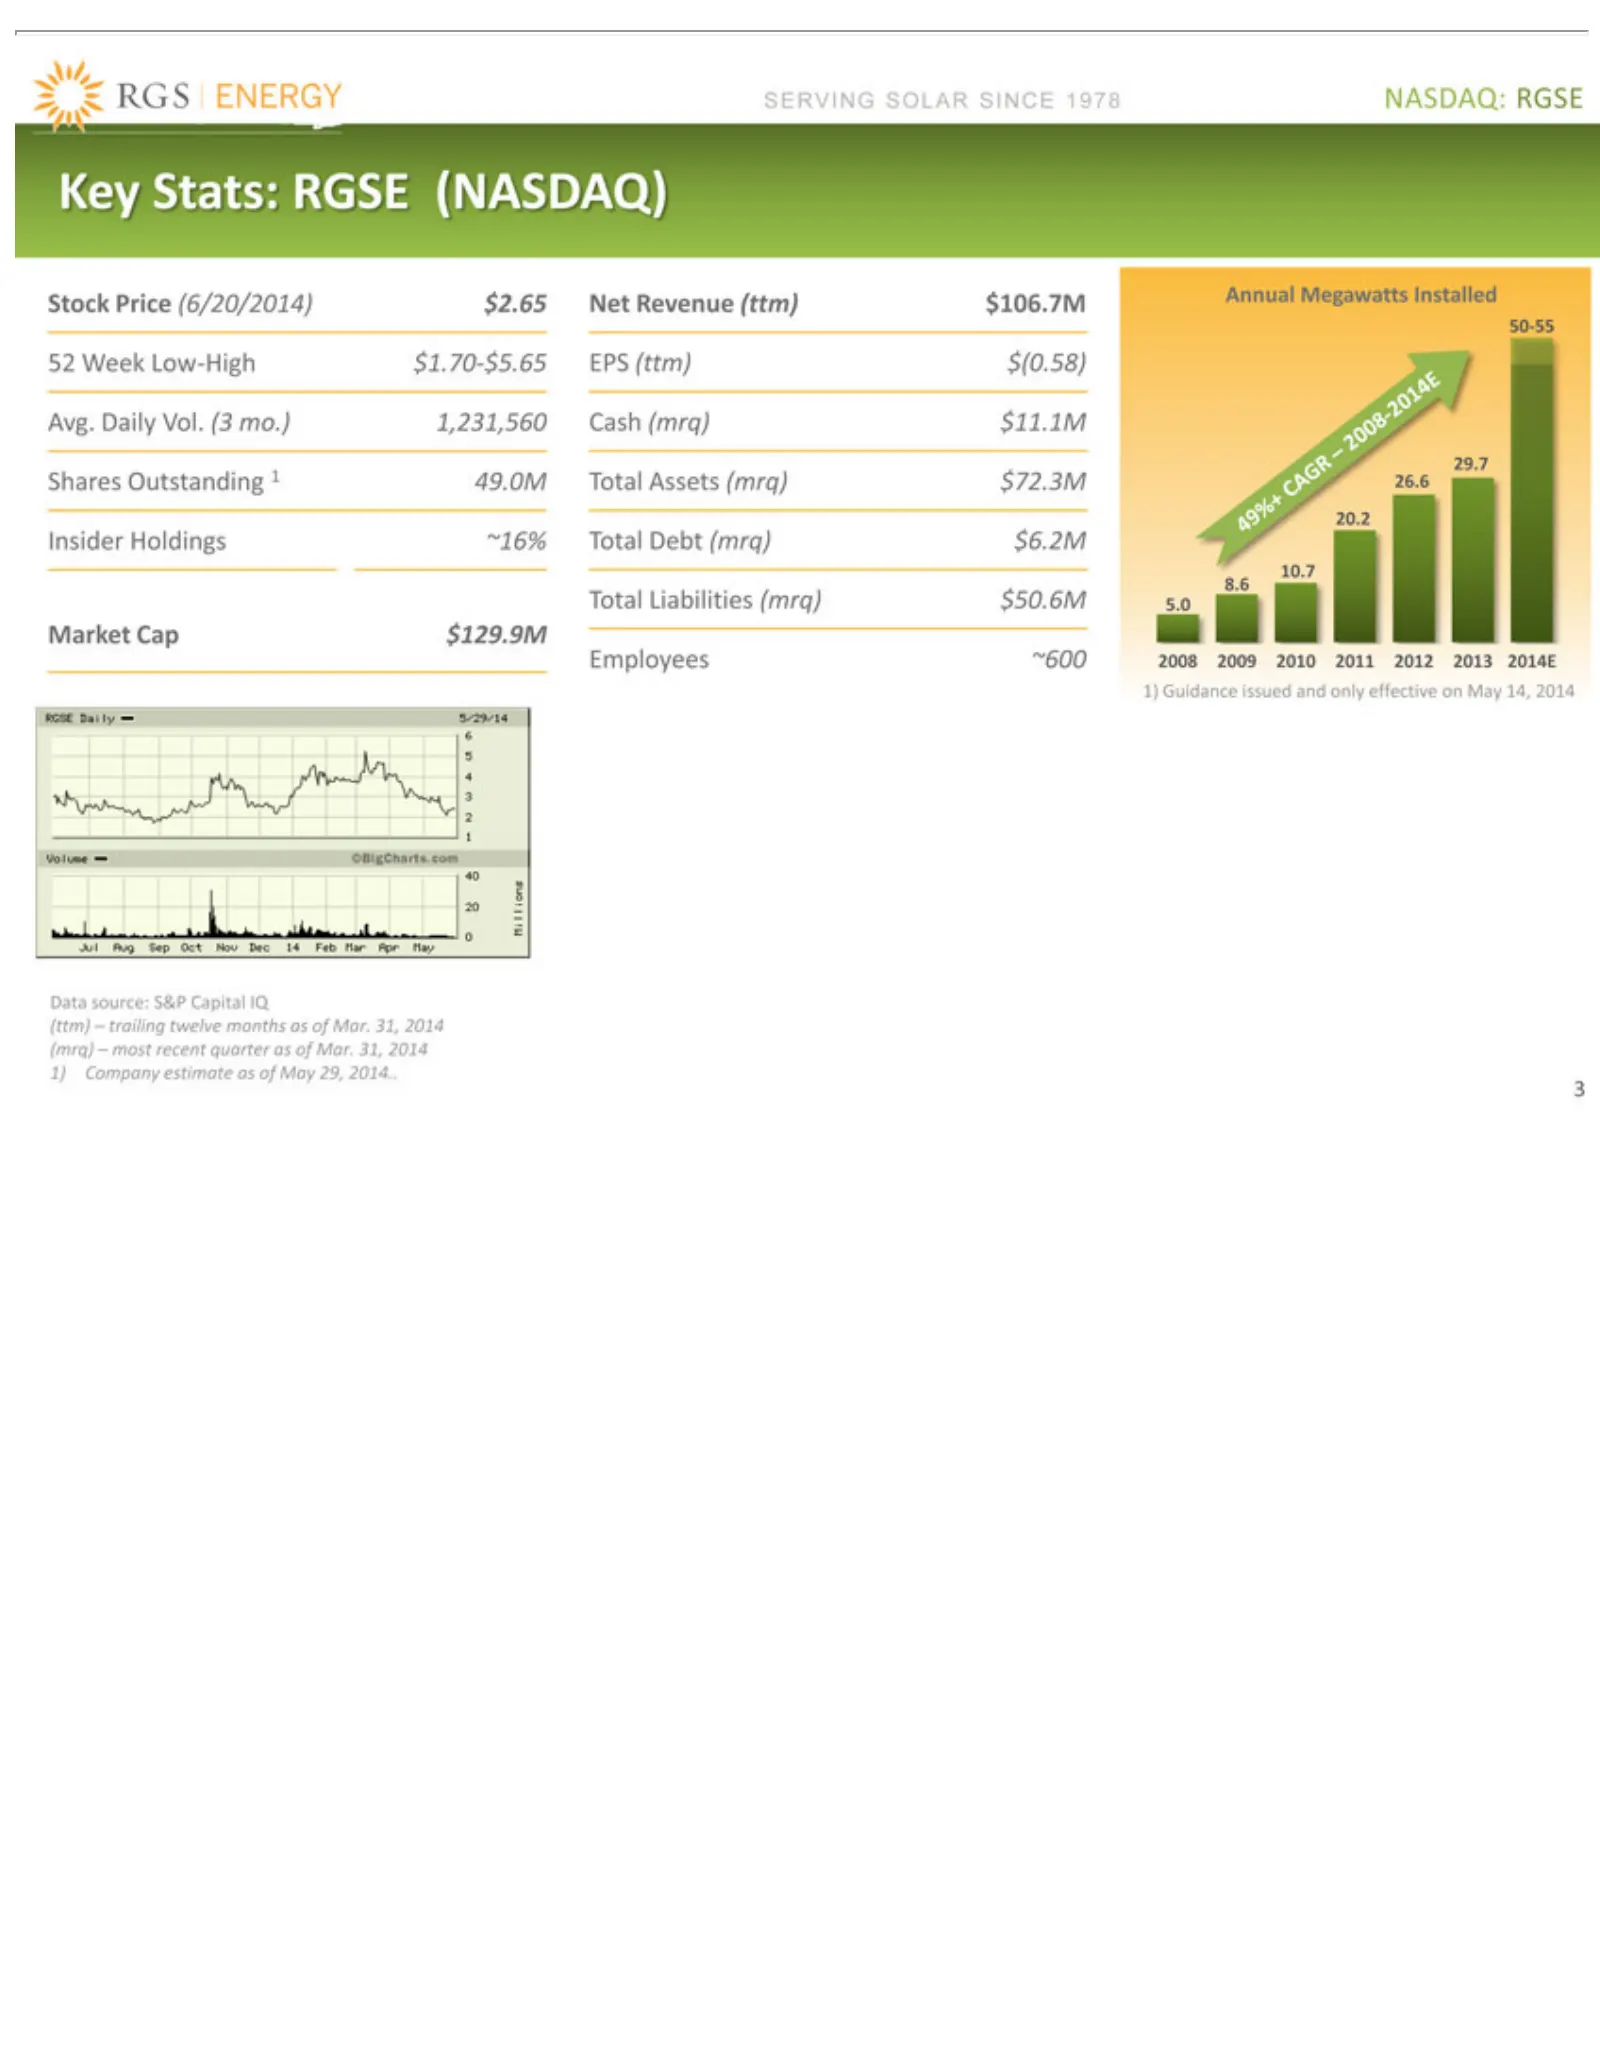
Slide 3: Key Stats
SERVING Key Stock 52 50-55 Avg. Shares Insider 8.6 Total Market Employees Data (ttm) 31) Guidance Company Week 49%+ Stats: source: Daily –Liabilities Price Outstanding trailing Holdings Cap Low-High CAGR-2008-2014E RGSE SOLAR Vol. ~600 (6/20/2014) $129.9M issued estimate S&Ptwelve (3 (mrq) ~16% 2008
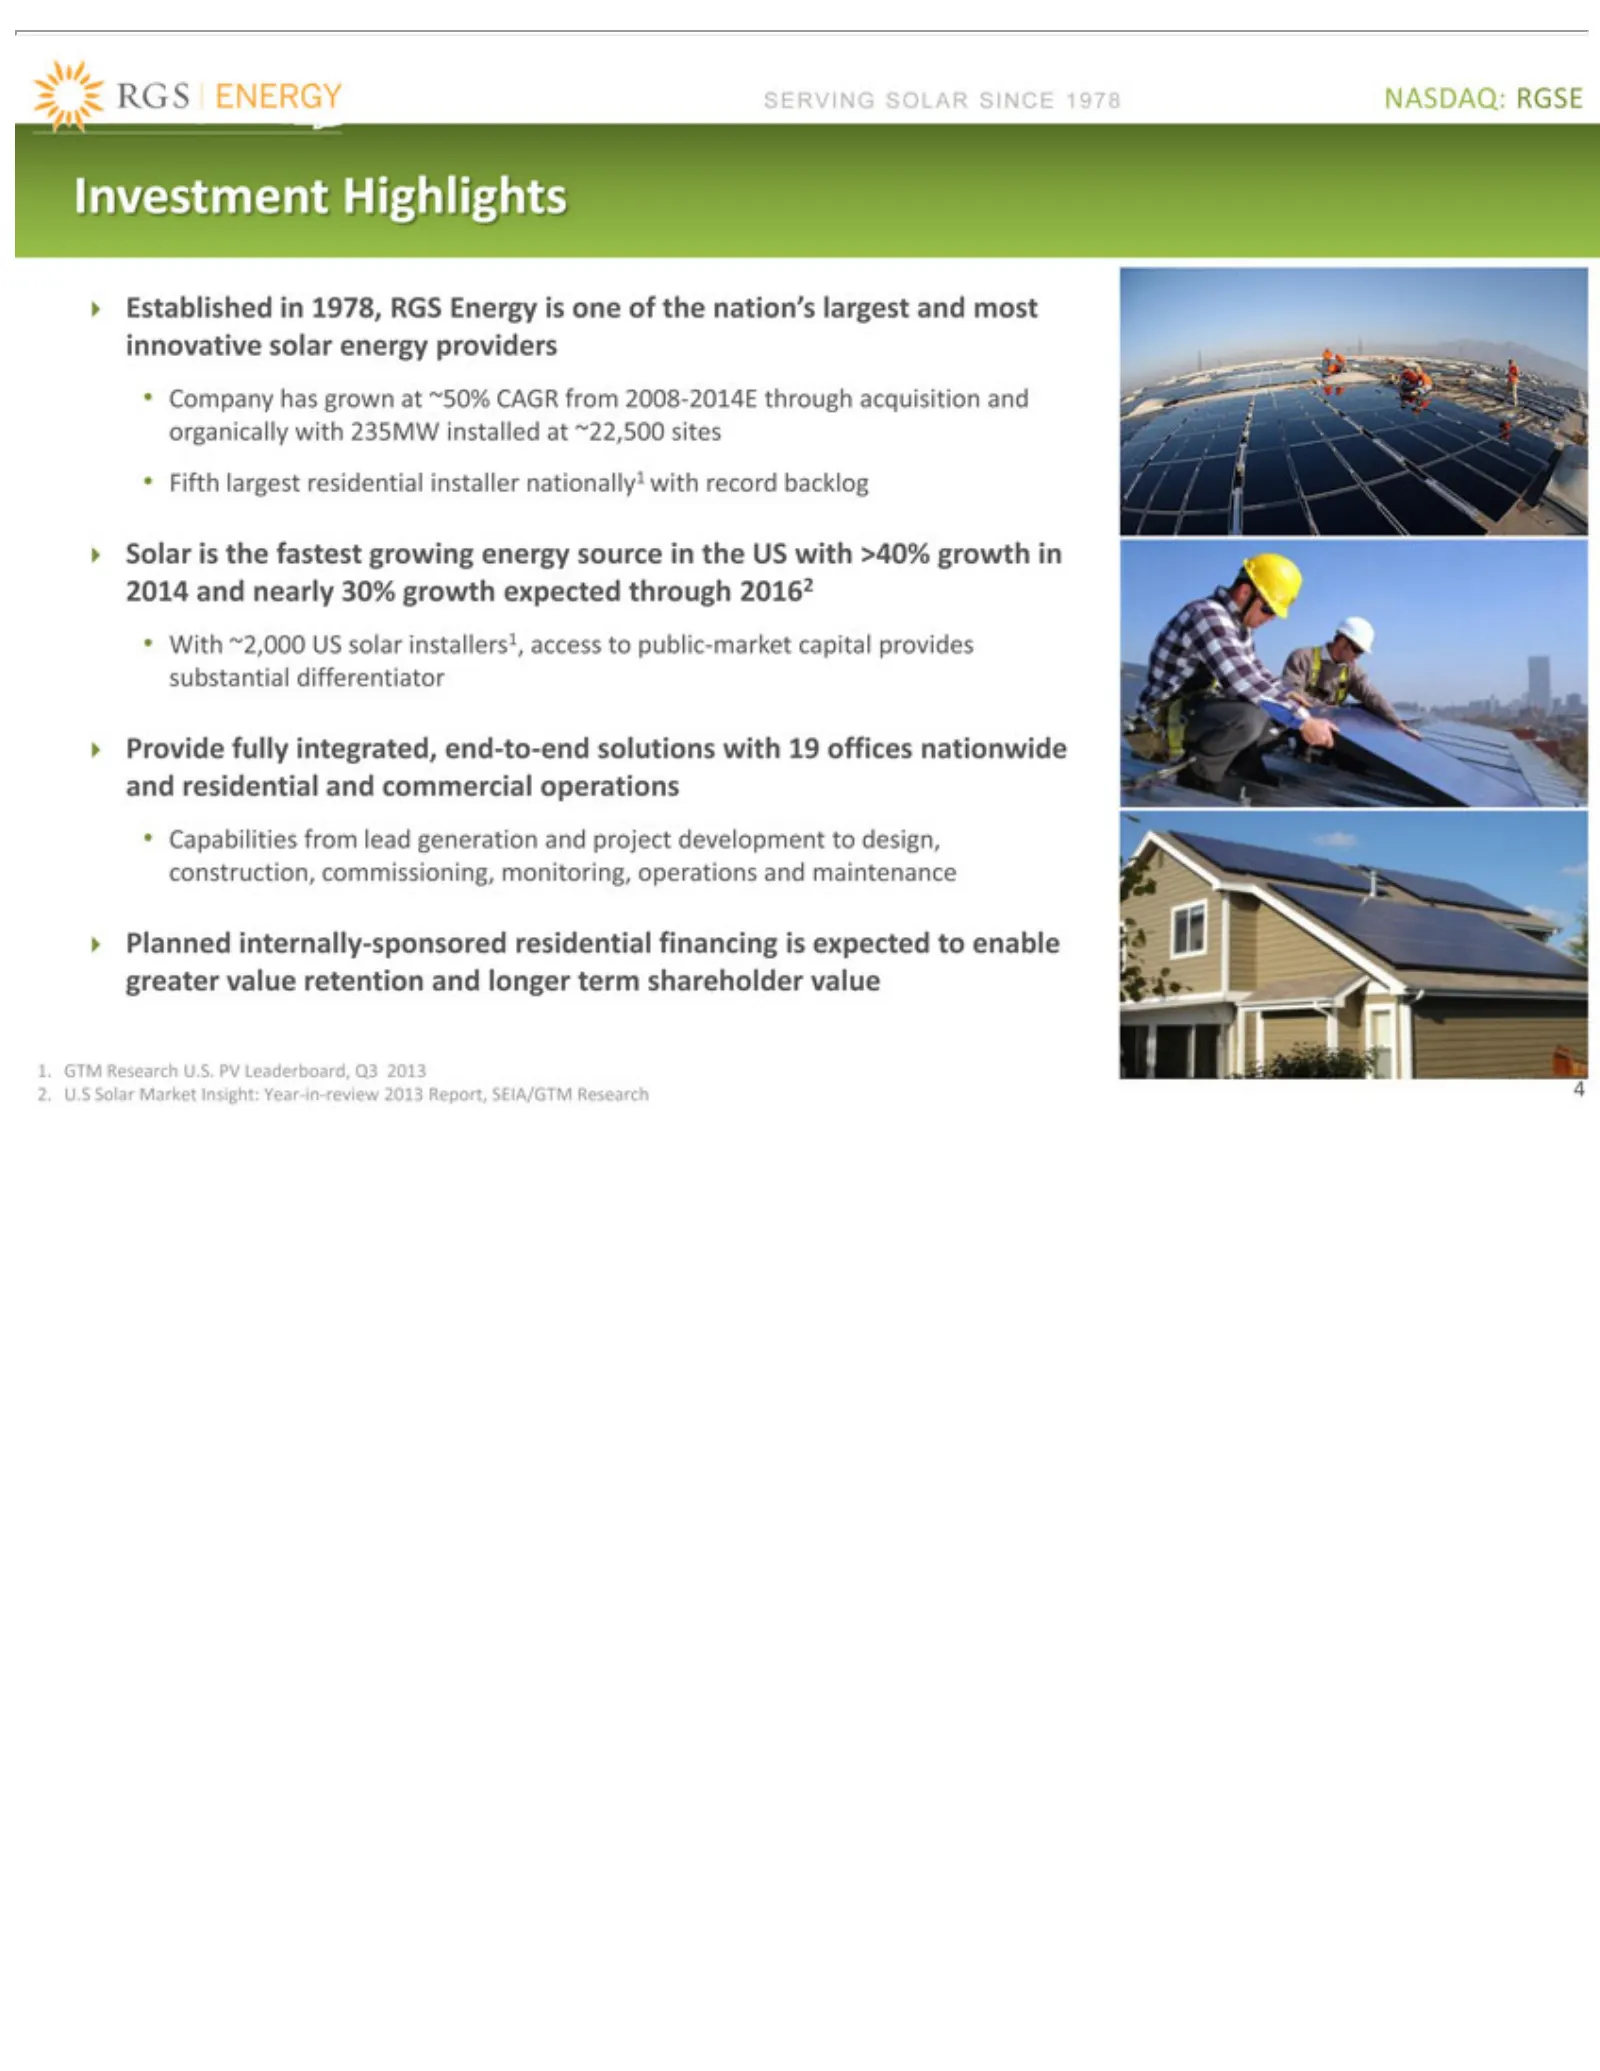
Slide 4: Investment Highlights
SERVING Investment Established Company Fifth Solar With Provide Capabilities Planned 1. 42. GTM U.S largest ~2,000 isSolar the fully internally-sponsored Research has SOLAR Highlights fastest in from residential Market US integrated, grown 1978, solar lead U.S. growing SINCE Insight: RGS atinstaller

Slide 5: Executive Management Team
SERVING Executive Kam Tony Timothy Dennis Manager REC United Manufacturing Industrial Joined management President Pitney 5Bachelor Mofid, Solar DiPaolo, Bowes the Technologies Lacey, Seamans, of of &Management company SOLAR and Global Arts Science Technology Systems Chief experience Restaurants Pres
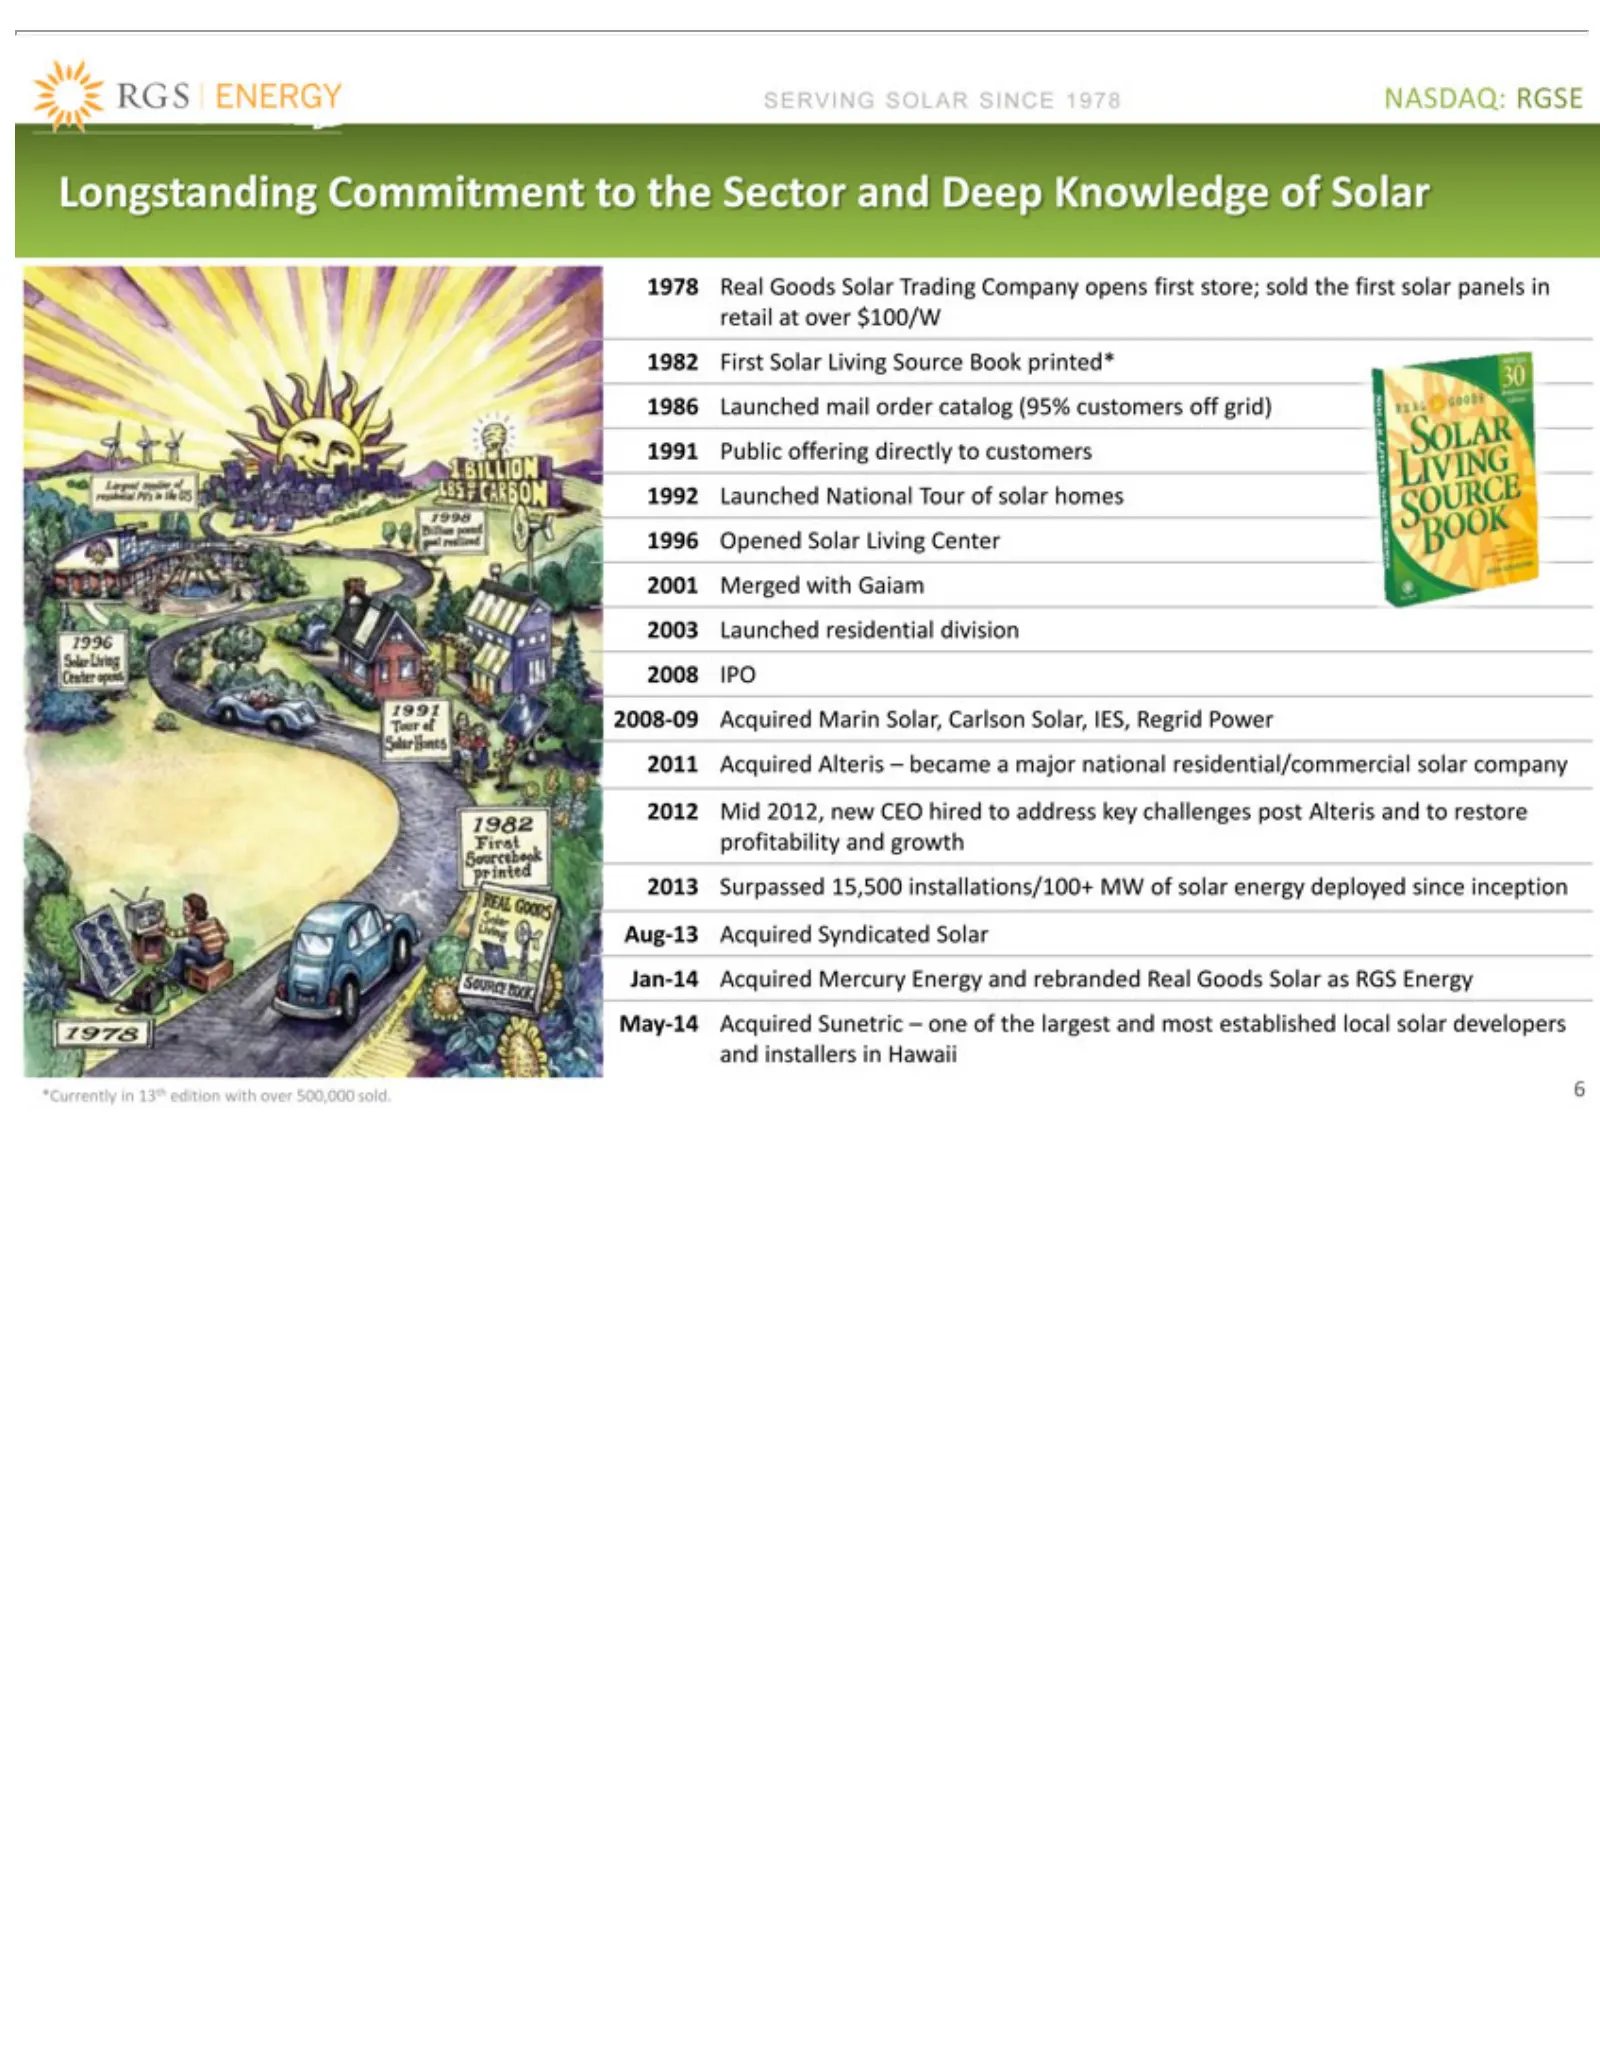
Slide 6: Longstanding Company History
SERVING Longstanding 1978 1982 1986 Gaiam 2008 2008-09 2011 2012 2013 May-14 6*Currently Acquired Real First Launched IPO Mid Surpassed 2003 Acquired Acquired 2012, Goods Solar SOLAR inLaunched 13th Commitment Alteris mail 15,500 new Living Solar Sunetric Marin edition SINCE order CEO –residential T
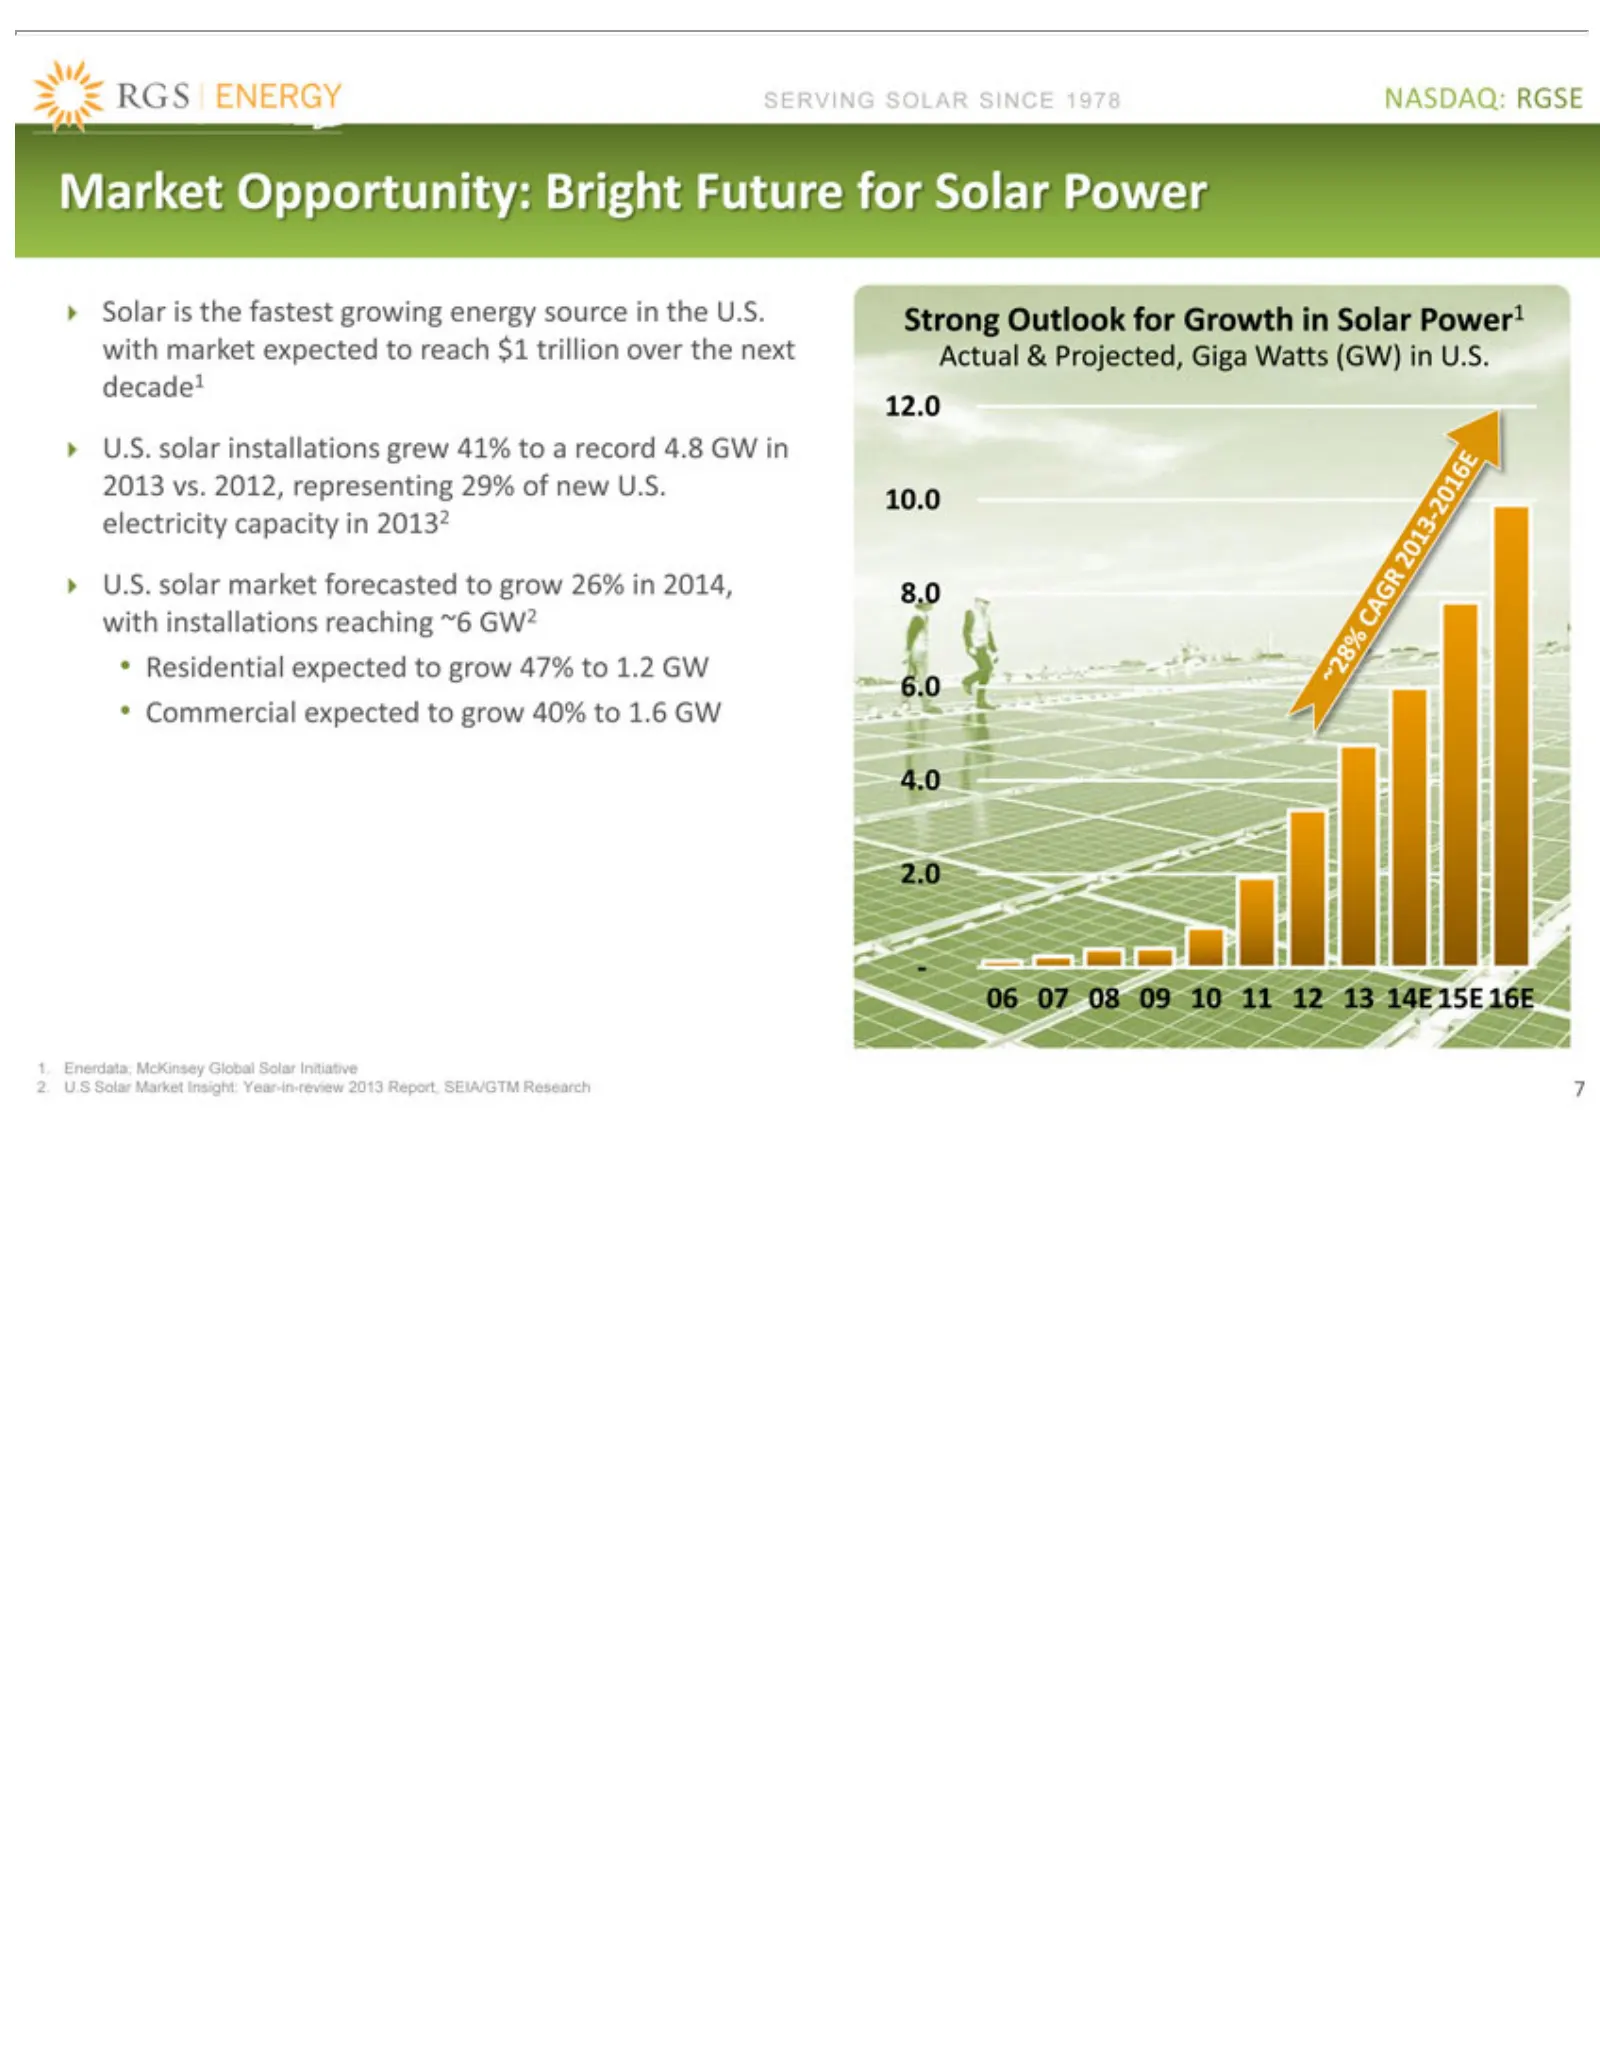
Slide 7: Solar Market Opportunity
SERVING Market Solar 212.0 U.S. Residential ~28% 6.0 0Commercial — 2.0 4.0 1. 72. 610.0 Enerdata; U.S 07solar is 08 CAGR electricity Solar Opportunity: the 09 installations market SOLAR expected fastest 10 McKinsey Market expected 2013-2016E 11capacity forecasted 12 growing SINCE Insight: to Bright
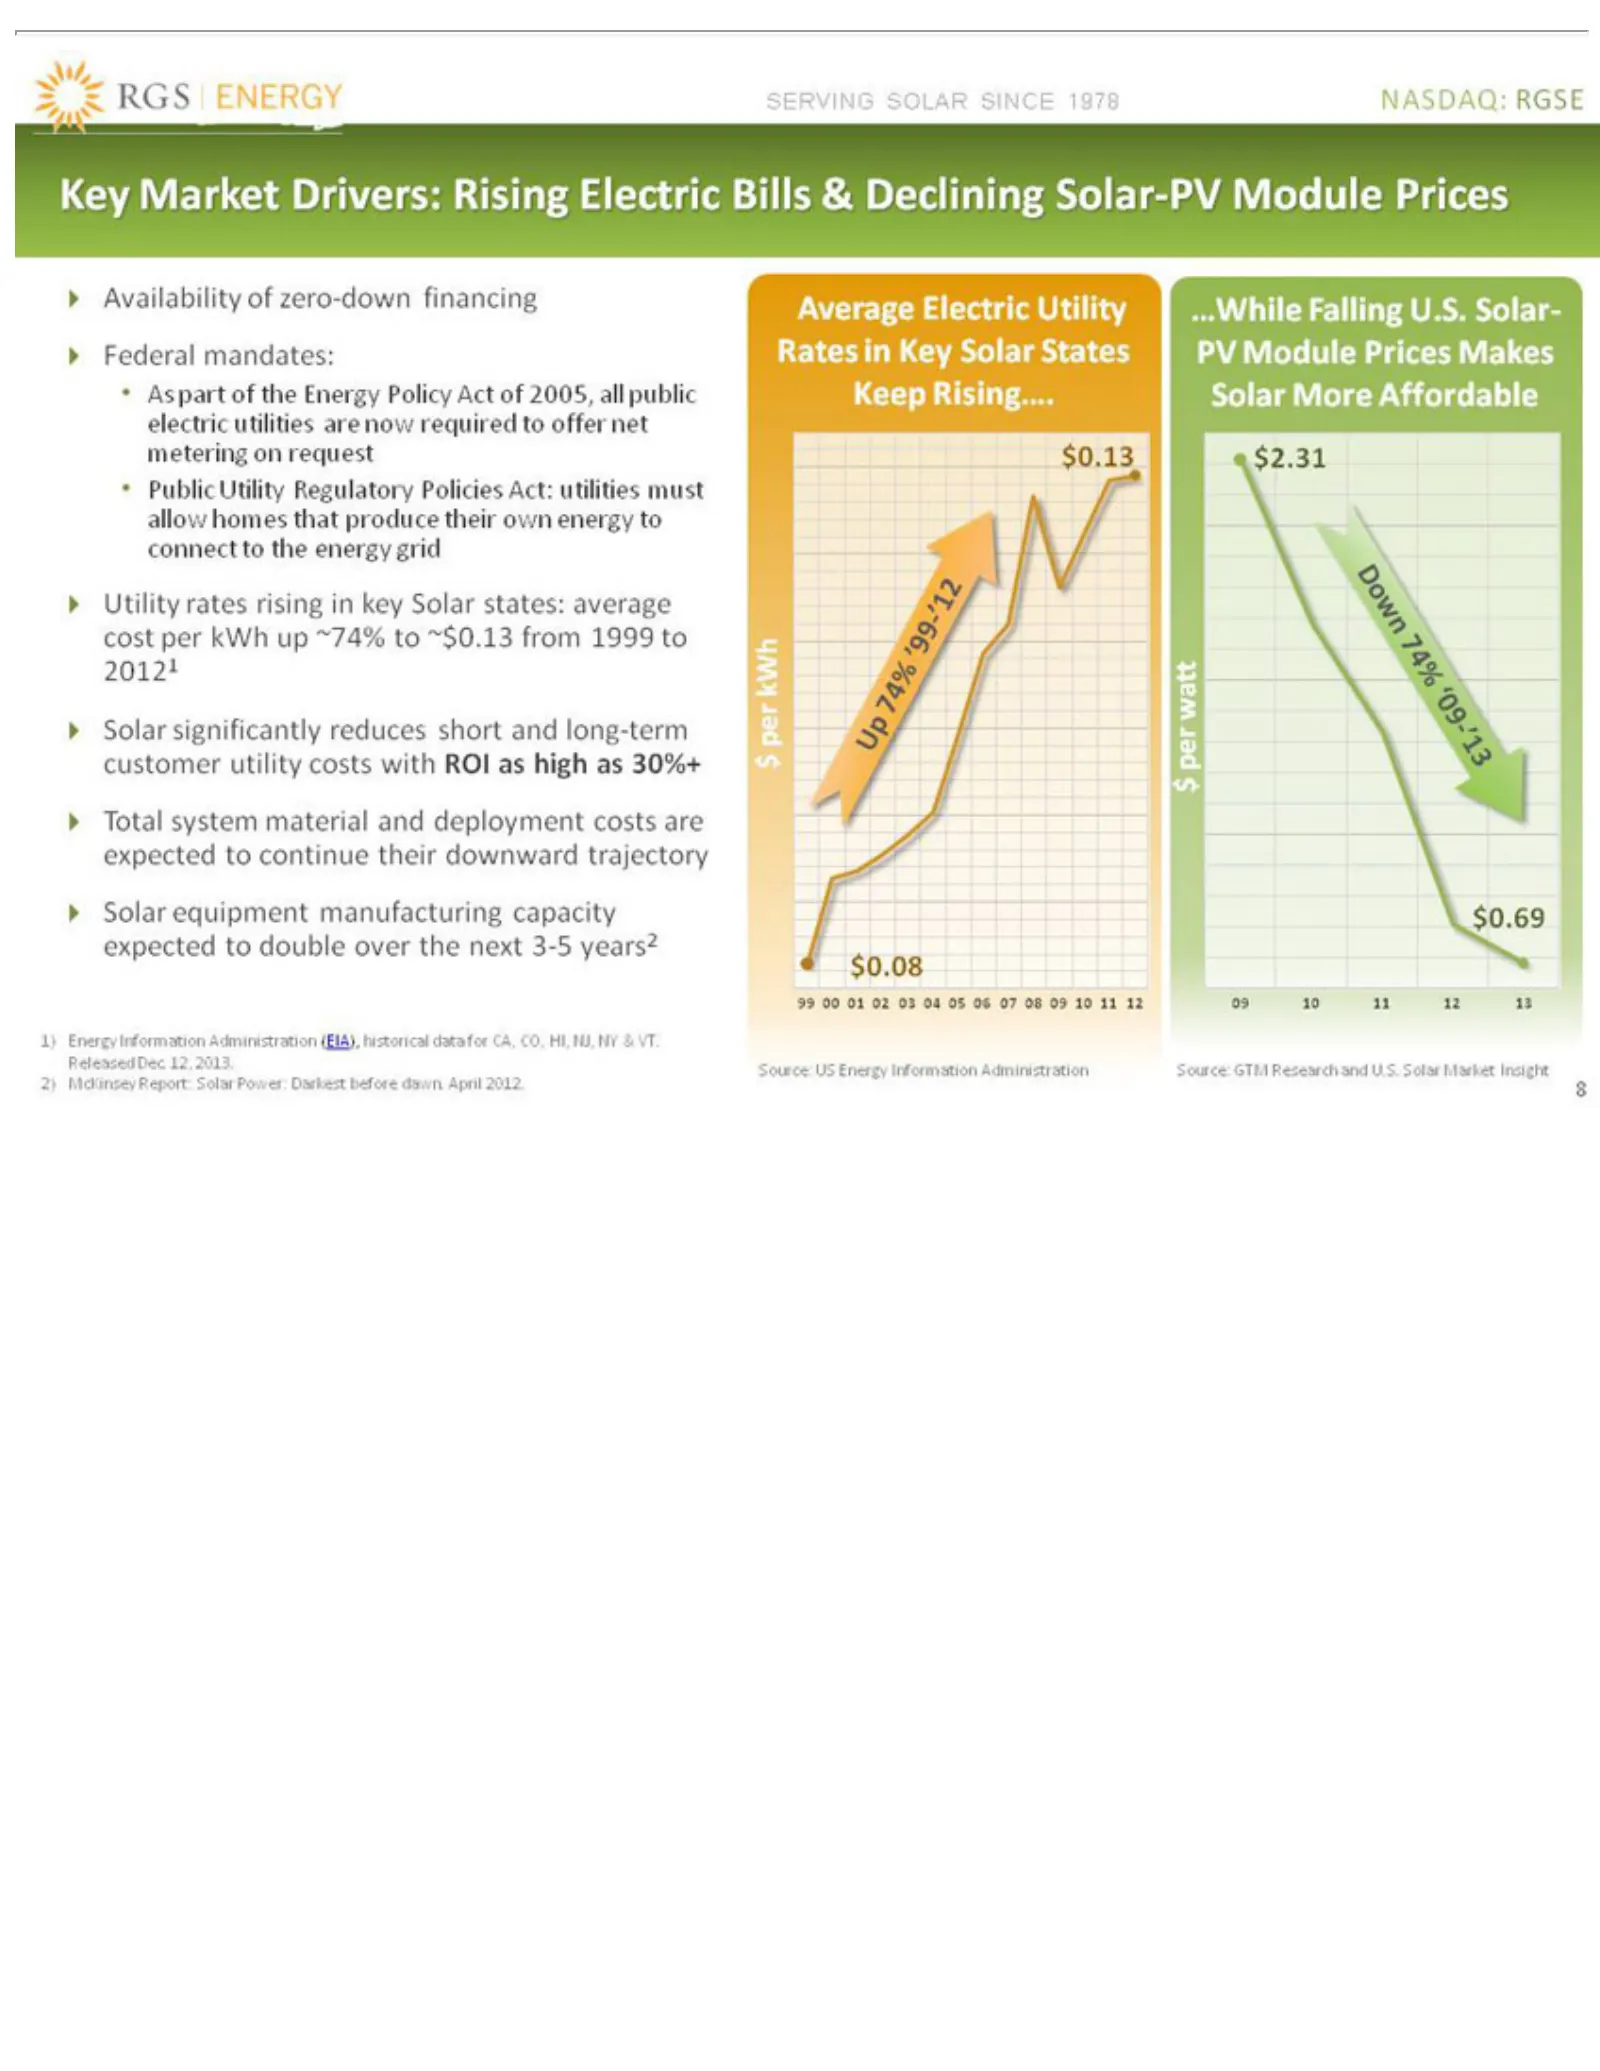
Slide 8: Key Solar Market Drivers
SERVING Key Availability As Public ?$2.31 99 $0.08 1) 82)Total Utility Solar Energy McKinsey 00 part Market 01 Utility system significantly equipment ofrates 02 Information the SOLAR of 03 Drivers: Report: Regulatory rising Energy material zero?down 04 05 manufacturing SINCE in reduces Rising Solar
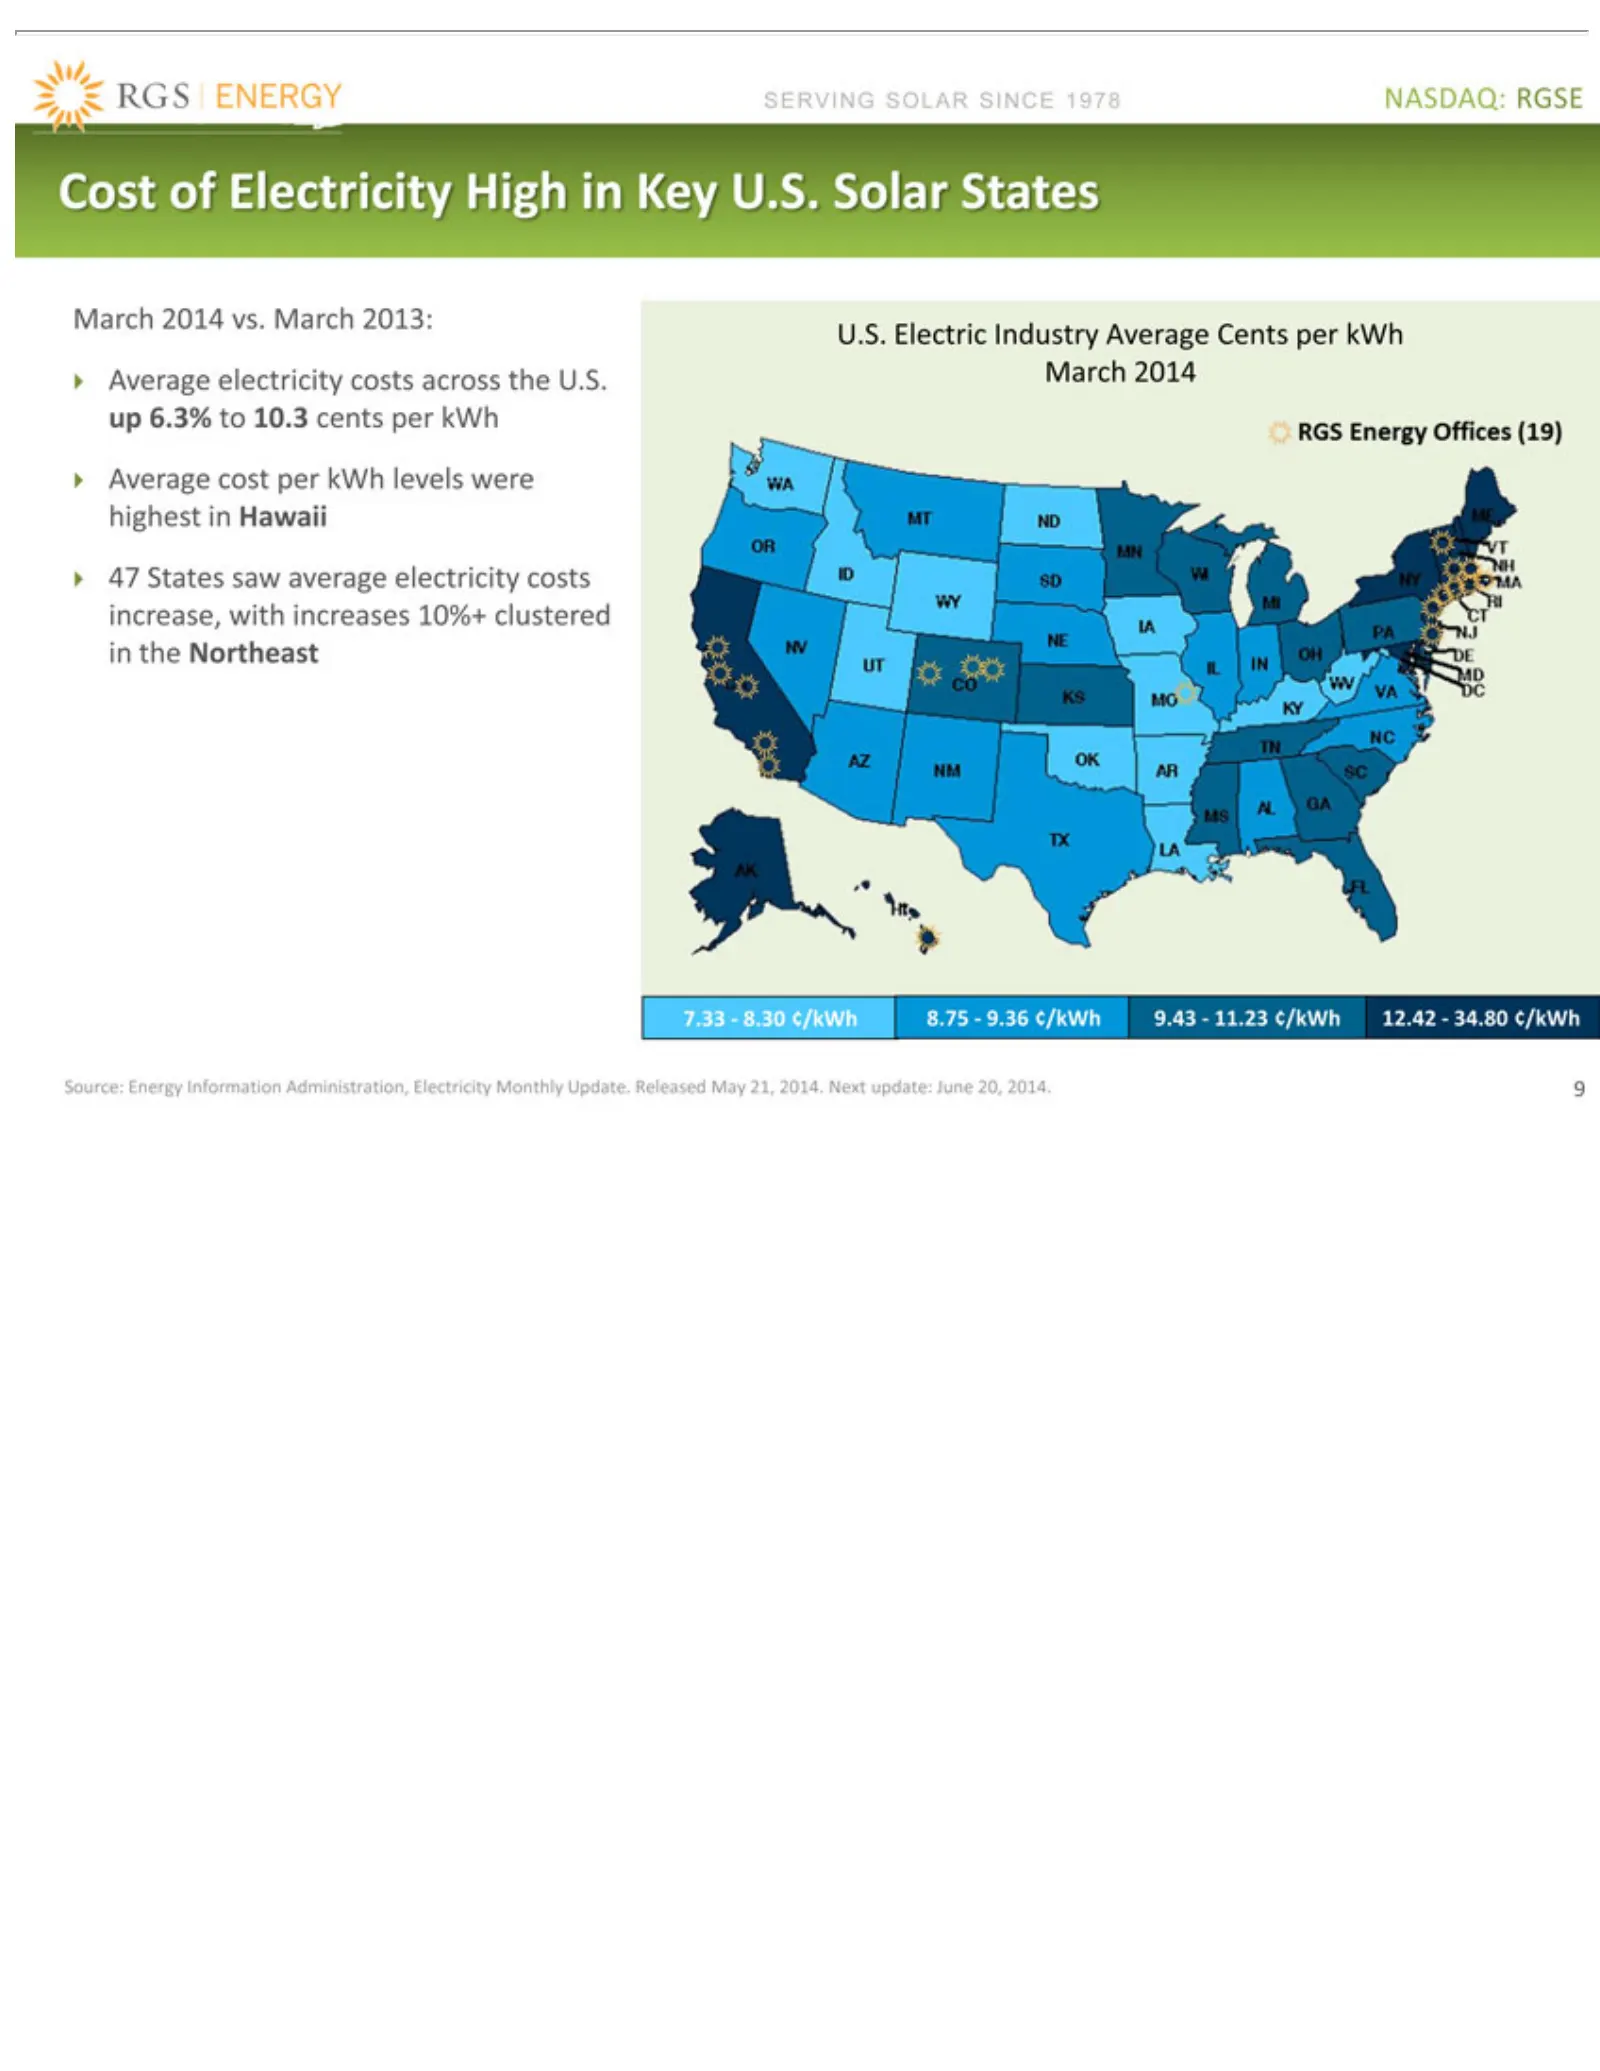
Slide 9: Cost of Electricity
SERVING Cost March U.S. Average 47 7.33—8.30 9Source: States Electric of2014 Electricity Energy cost saw SOLAR ¢/kWh vs. Industry per average Information March kWh High 8.75—9.36 SINCE Average electricity levels 2013: in Key 1978 Administration, were ¢/kWh Cents U.S. costs NASDAQ: highest Solar per
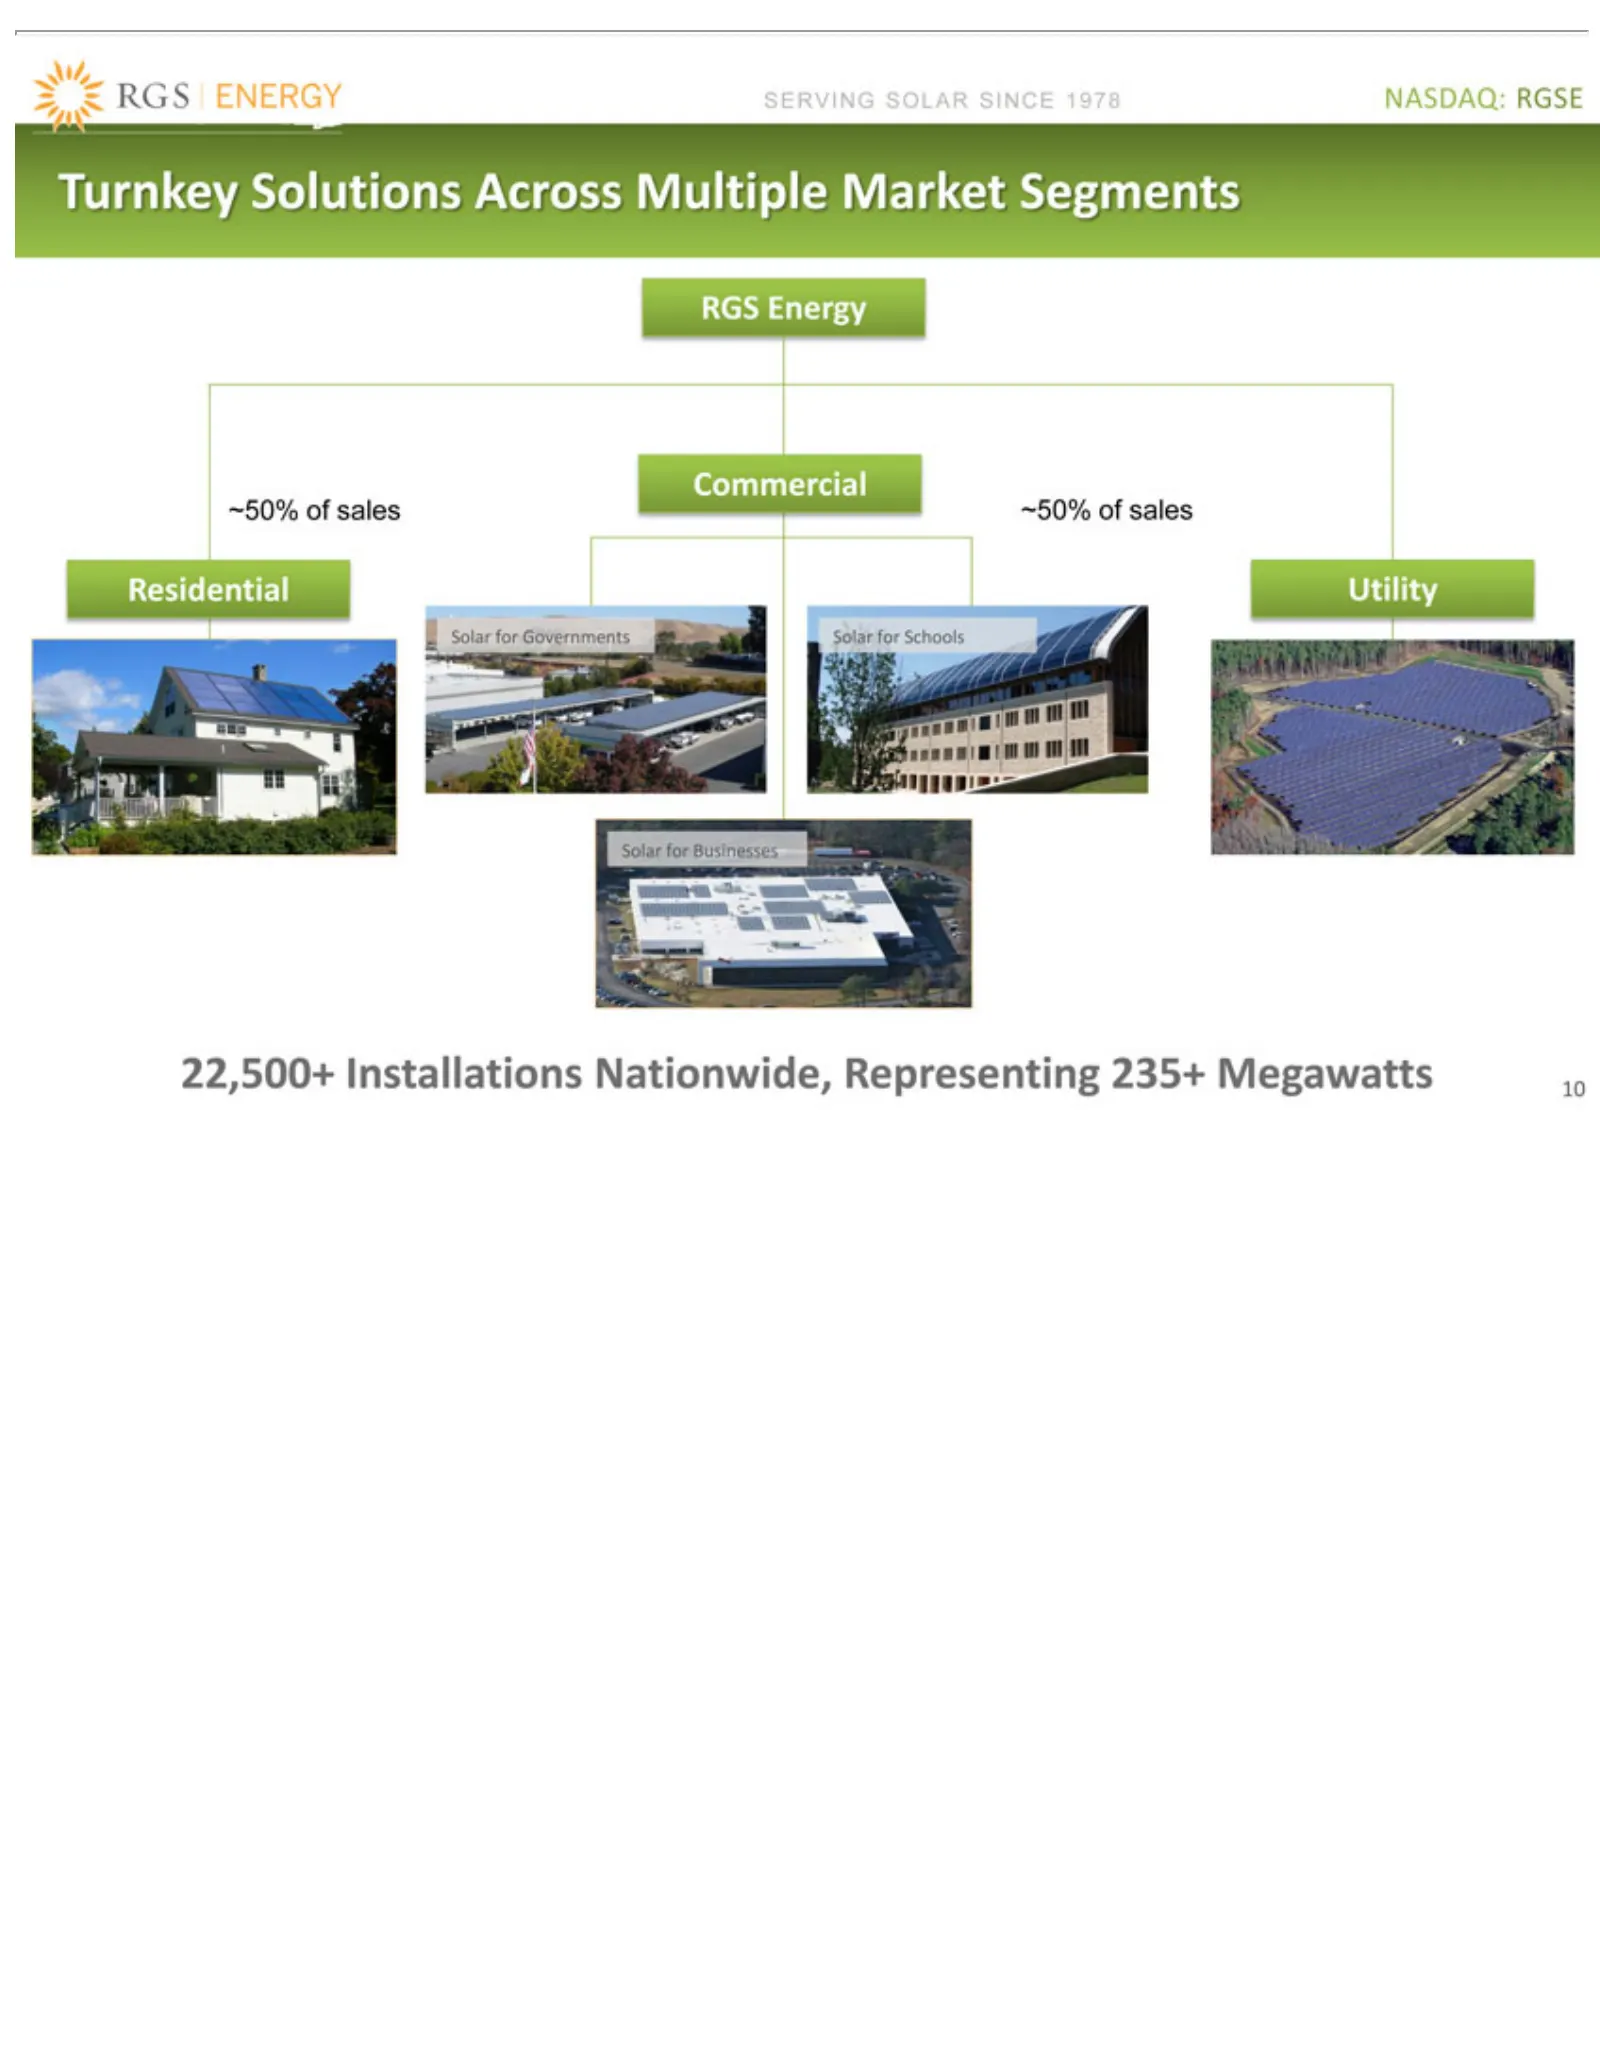
Slide 10: Turnkey Solar Energy Solutions
SERVING Turnkey RGS ~50% Residential Solar 22,500+ 10 Energy for of Installations Solutions sales Governments Businesses SOLAR Utility Commercial Across SINCE Nationwide, Solar Multiple ~50% 1978 for Schools NASDAQ: of Representing Market sales Segments RGSE 235+ Megawatts
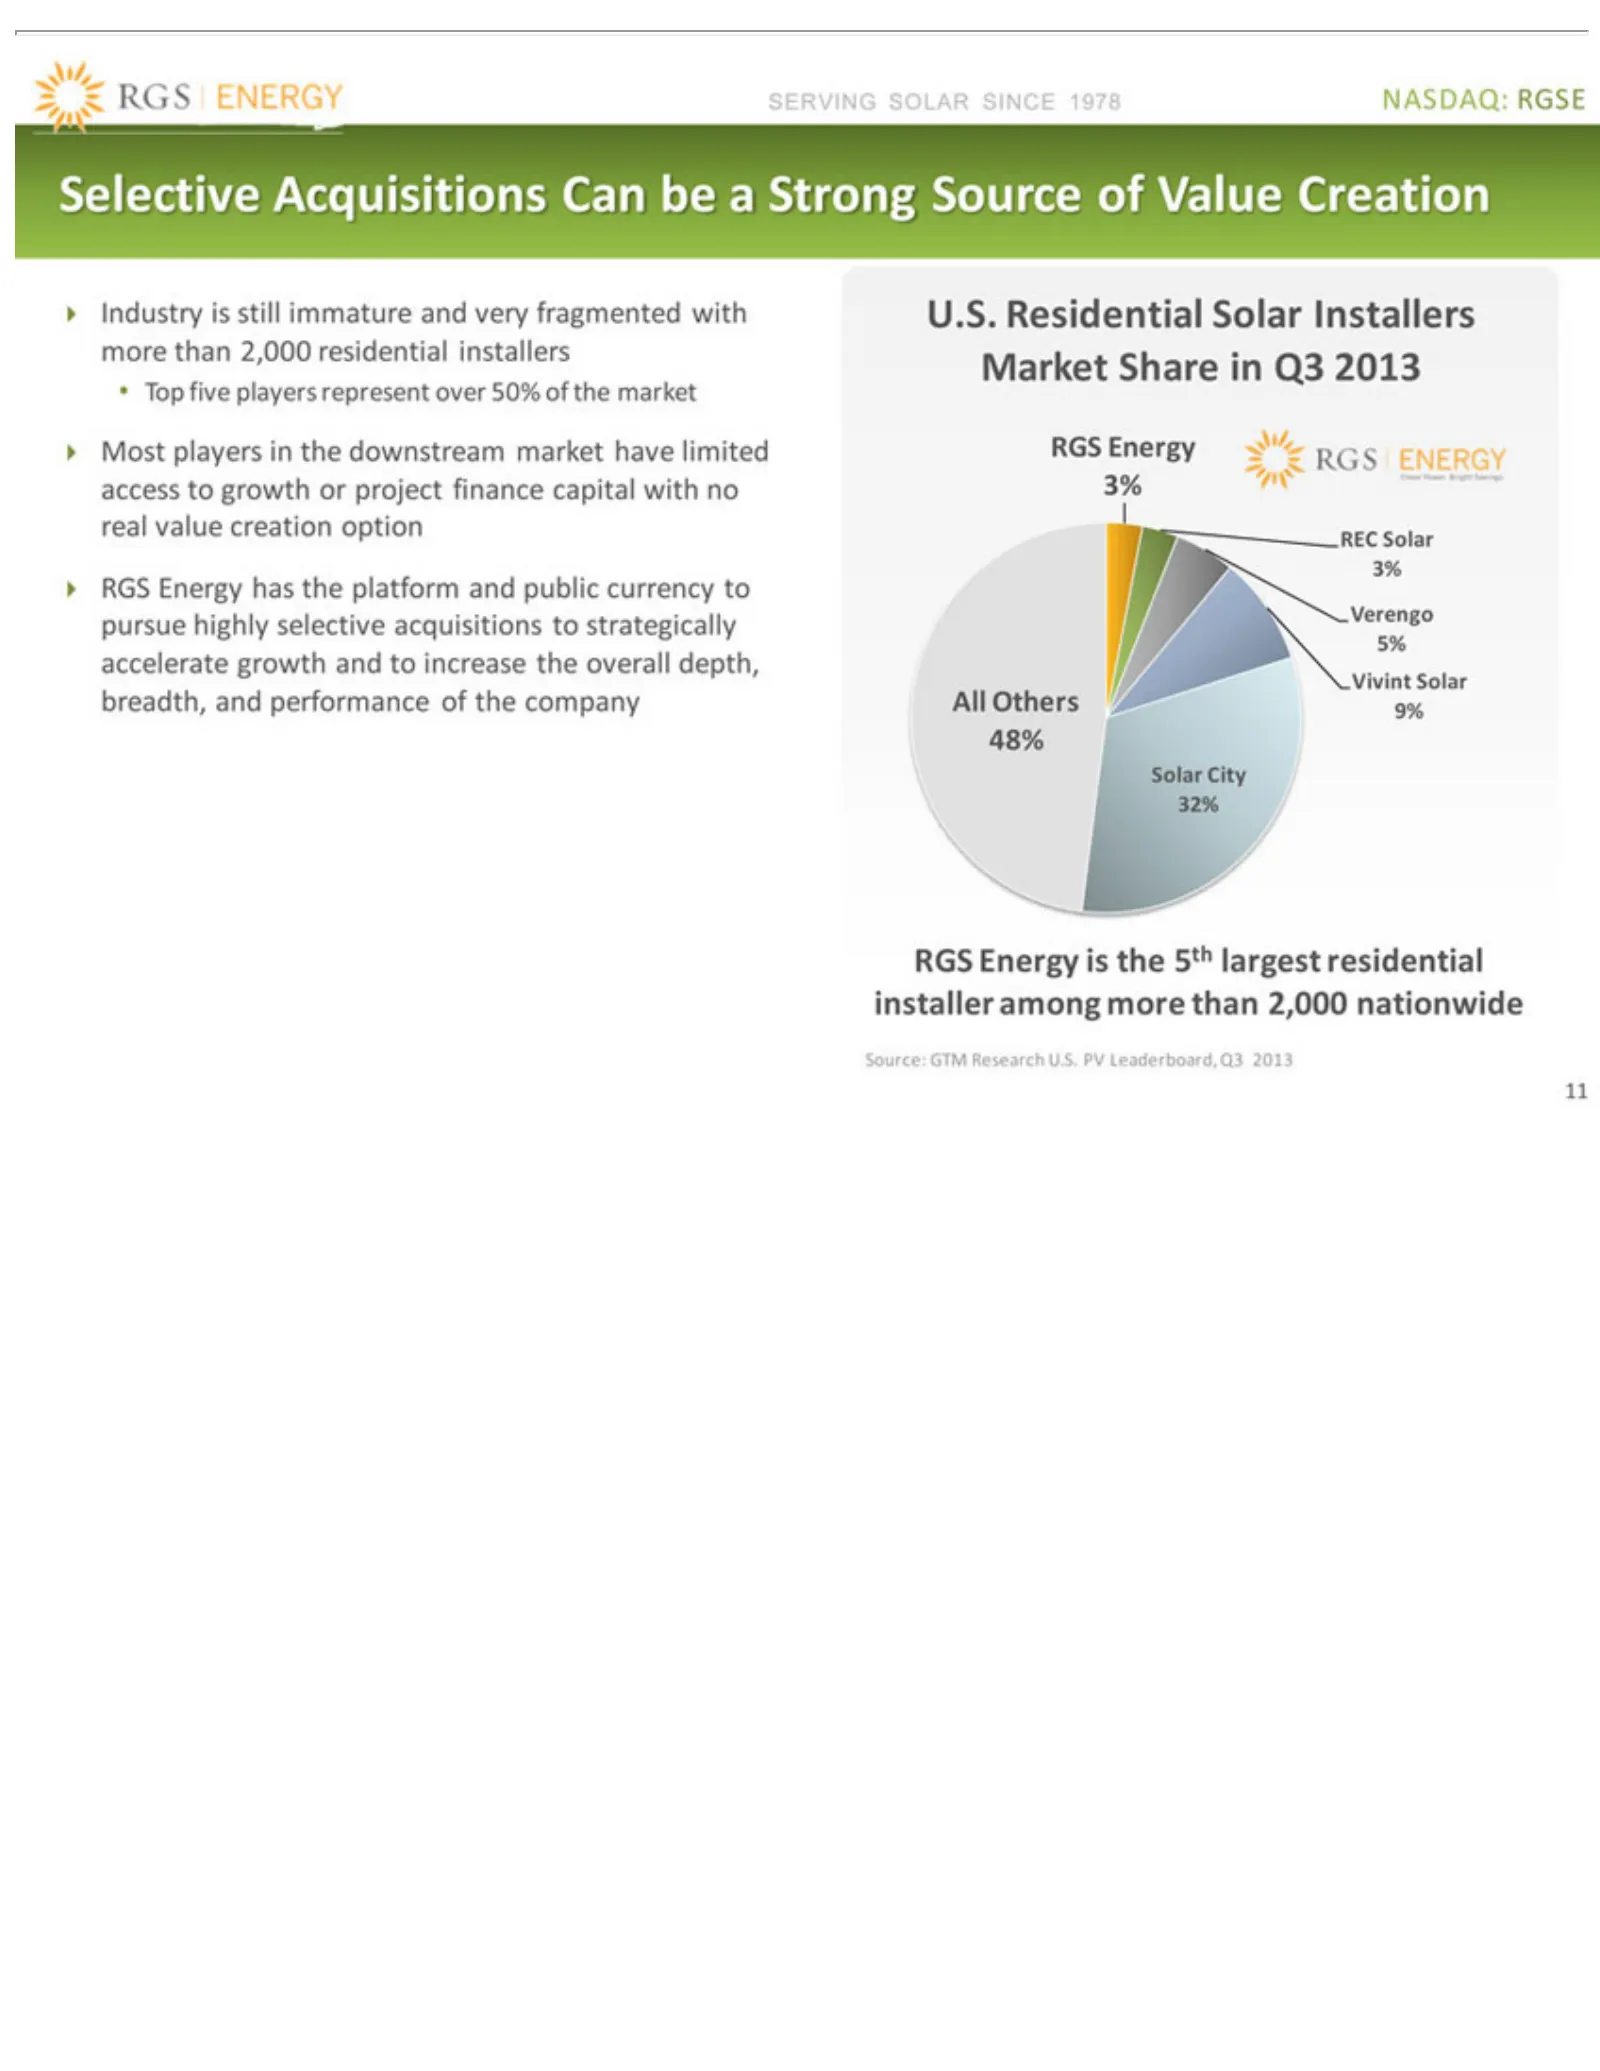
Slide 11: Selective Industry Acquisitions
SERVING Selective Industry Top Most access accelerate U.S. REC Verengo All Solar RGS Source: 11 Others five Residential Solar Energy players City toGTM 5% is players growth Acquisitions growth 32% 9% still SOLAR 3%Vivint 3% is inResearch 48% the immature the represent Solar orand 5th Solar downstrea
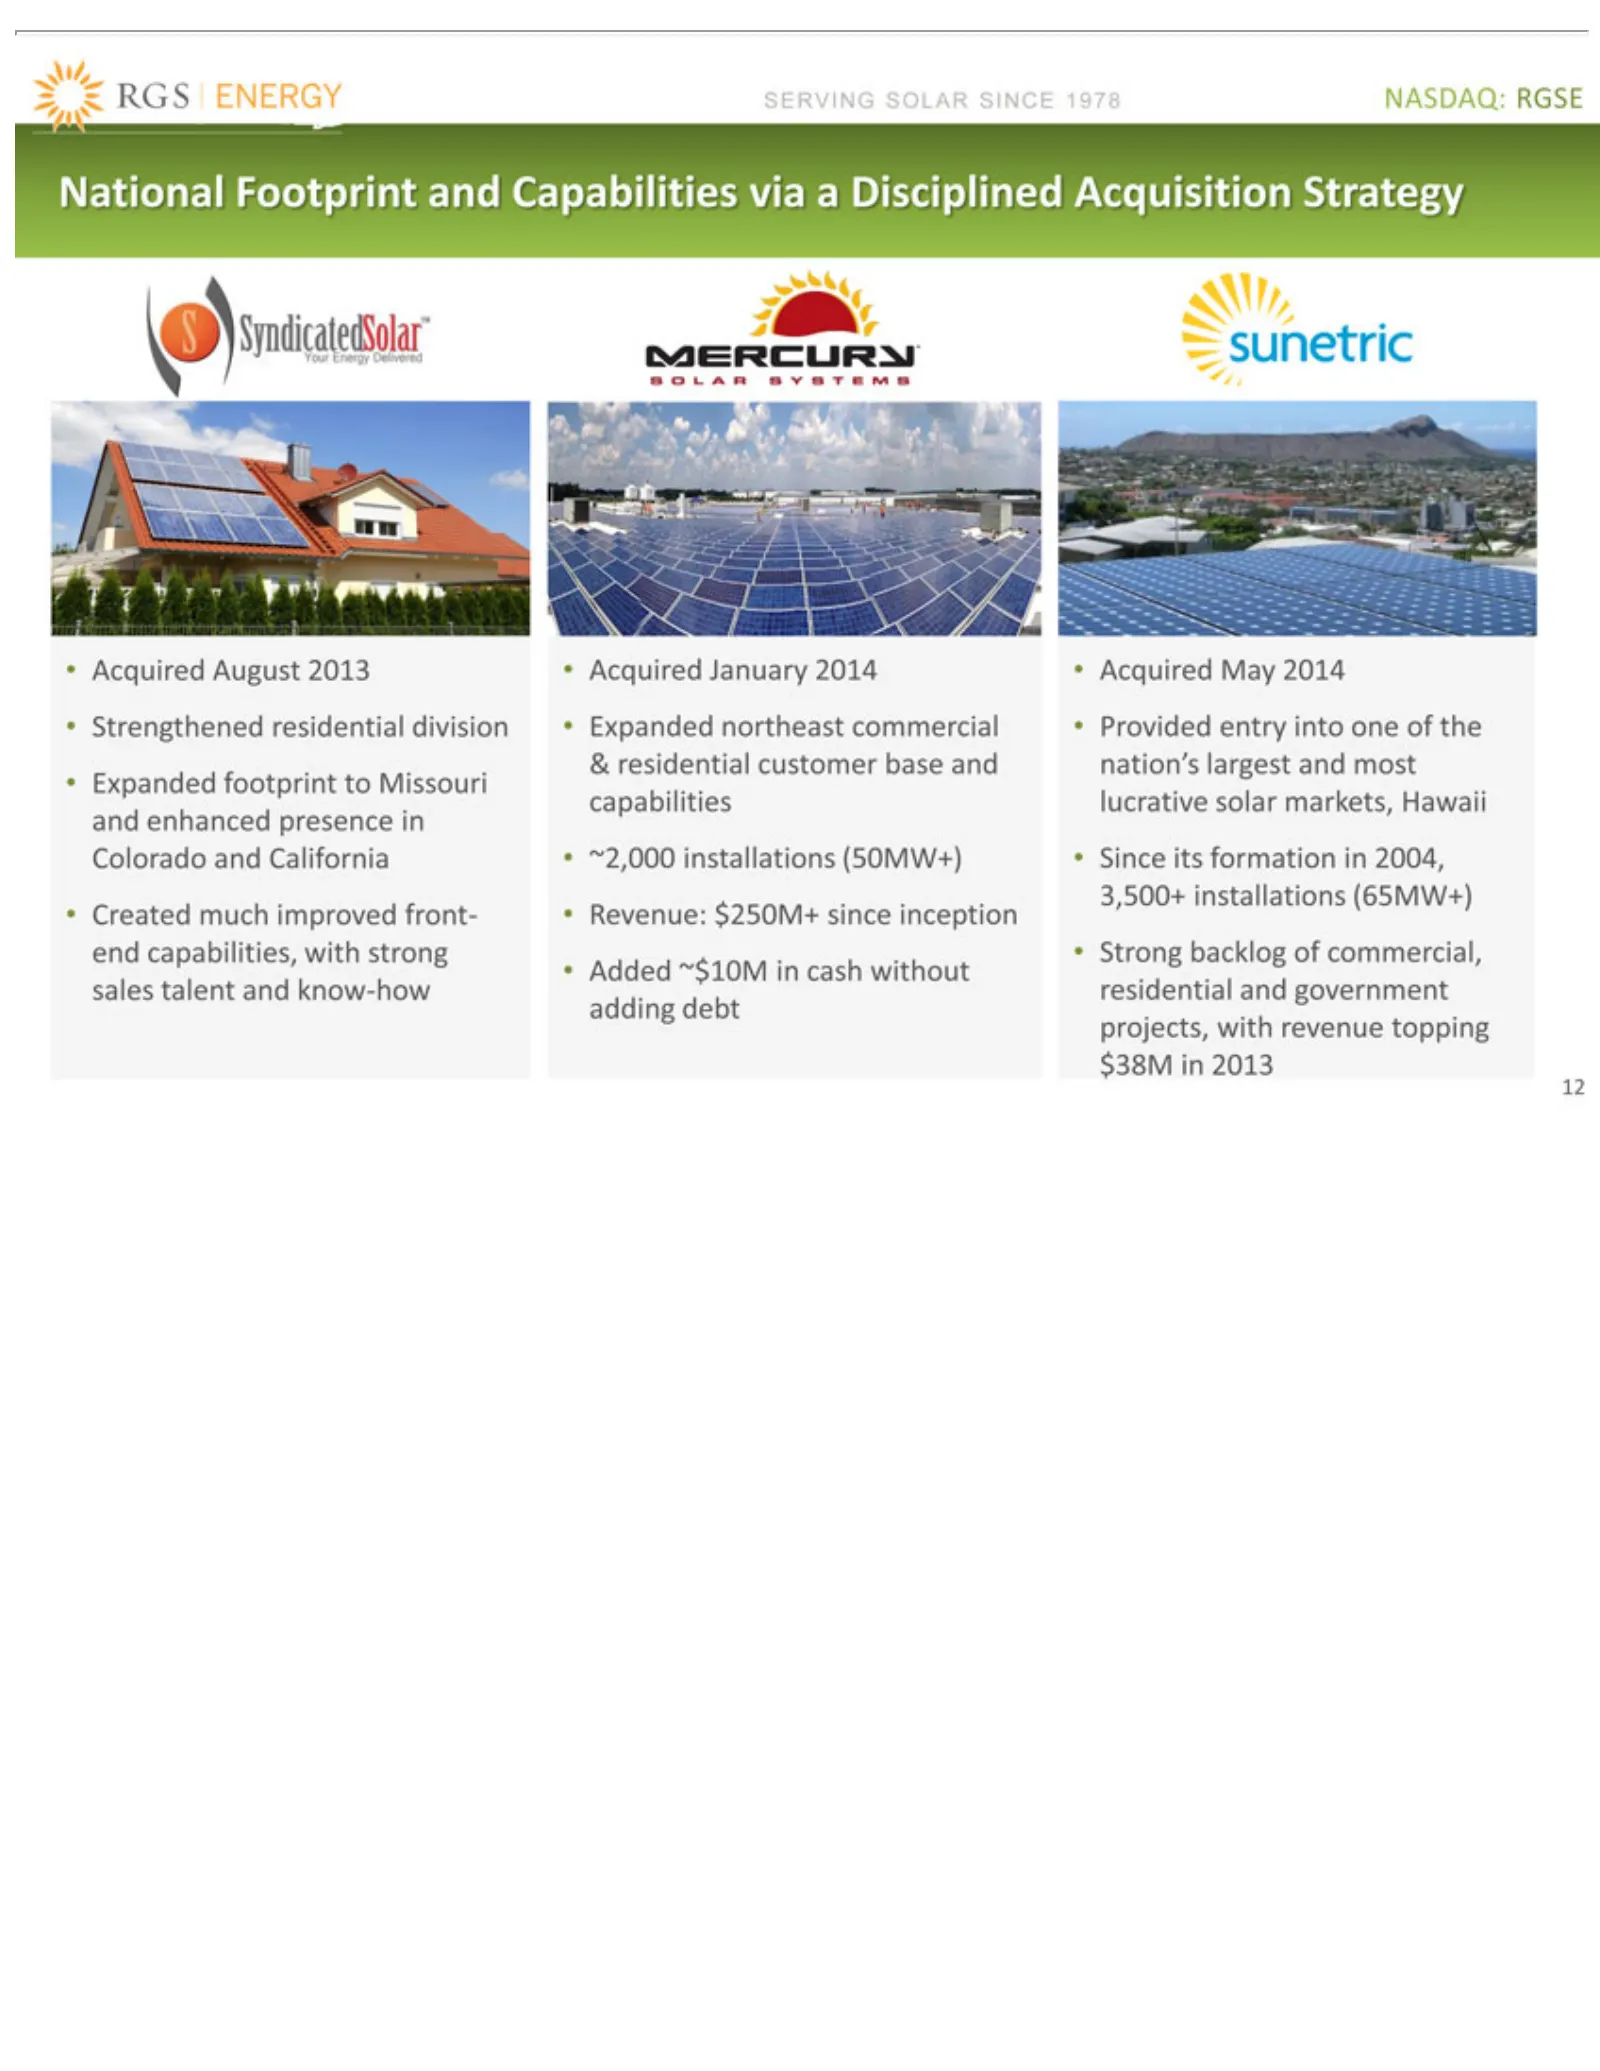
Slide 12: National Footprint and Disciplined Acquisition Strategy
SERVING National Strengthened Created Expanded ~2,000 Revenue: Added Acquired Provided Since Strong 12 its ~$10M backlog installations much formation Footprint entry August January May $250M+ footprint northeast SOLAR residential improved 2014 in into of2013 cash 2014 commercial, and since in one to
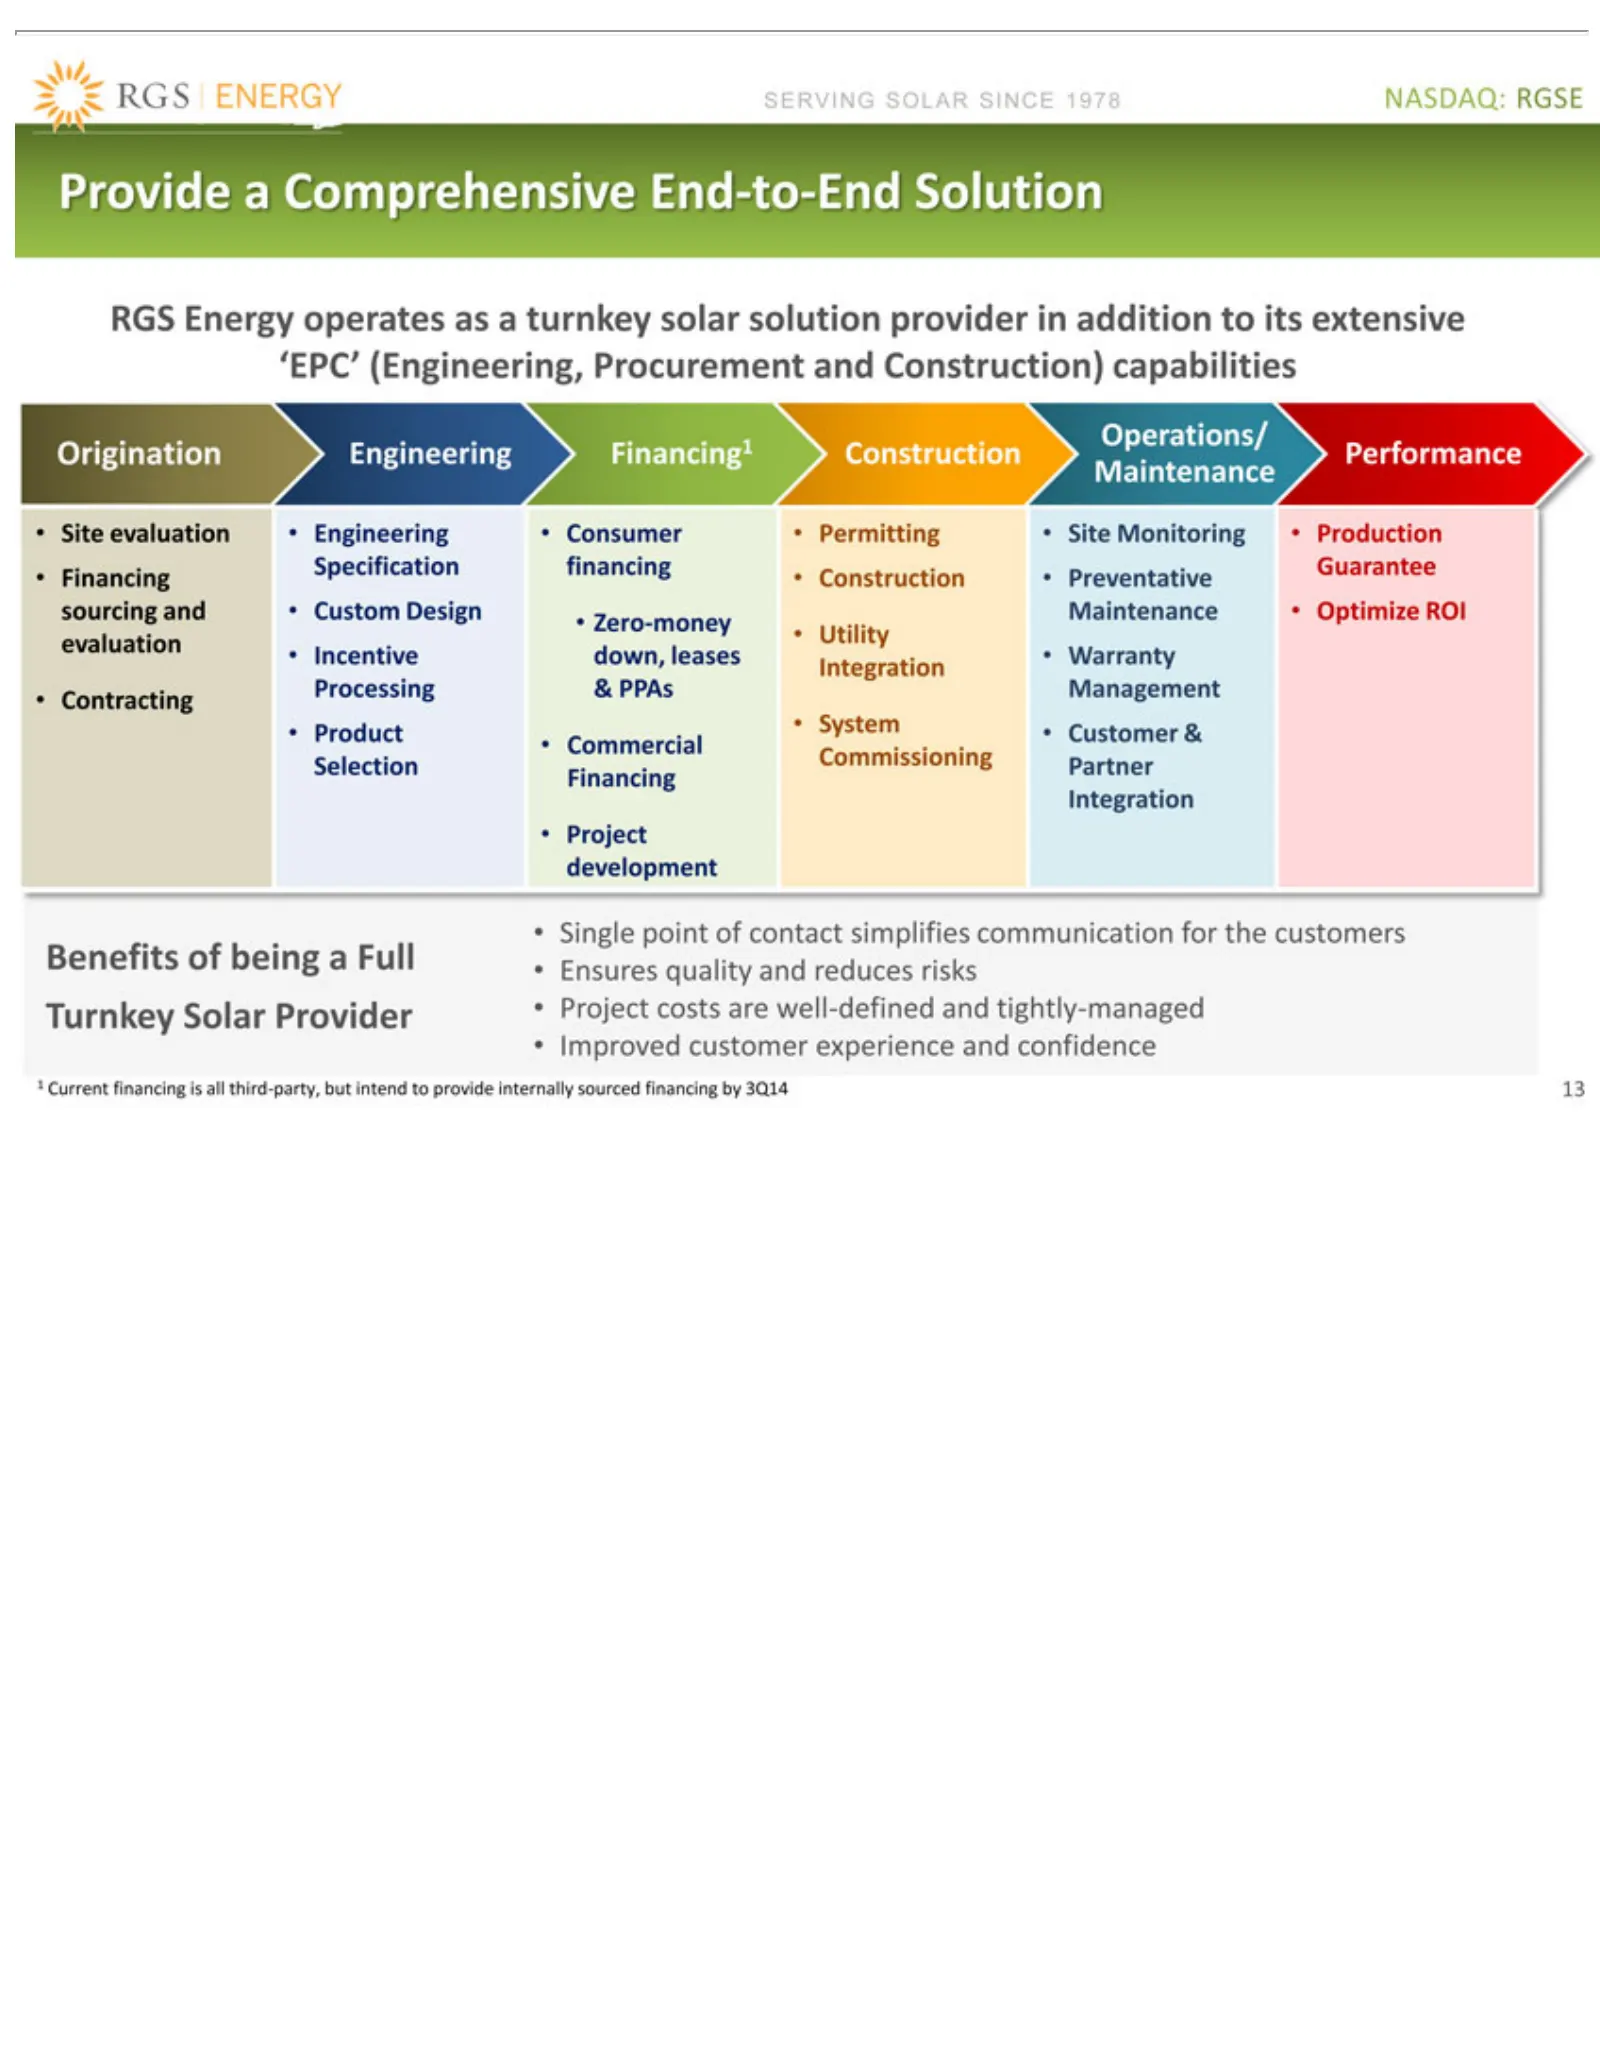
Slide 13: RGS Energy End-to-End Solution
SERVING Provide RGS ‘EPC’ Origination Site Financing Zero-money Incentive Processing Product Contracting Selection Project Single 1Improved 13Operations Current evaluation Energy (Engineering, point development a down, Commercial Commissioning Comprehensive financing customer Construction SOLAR & En
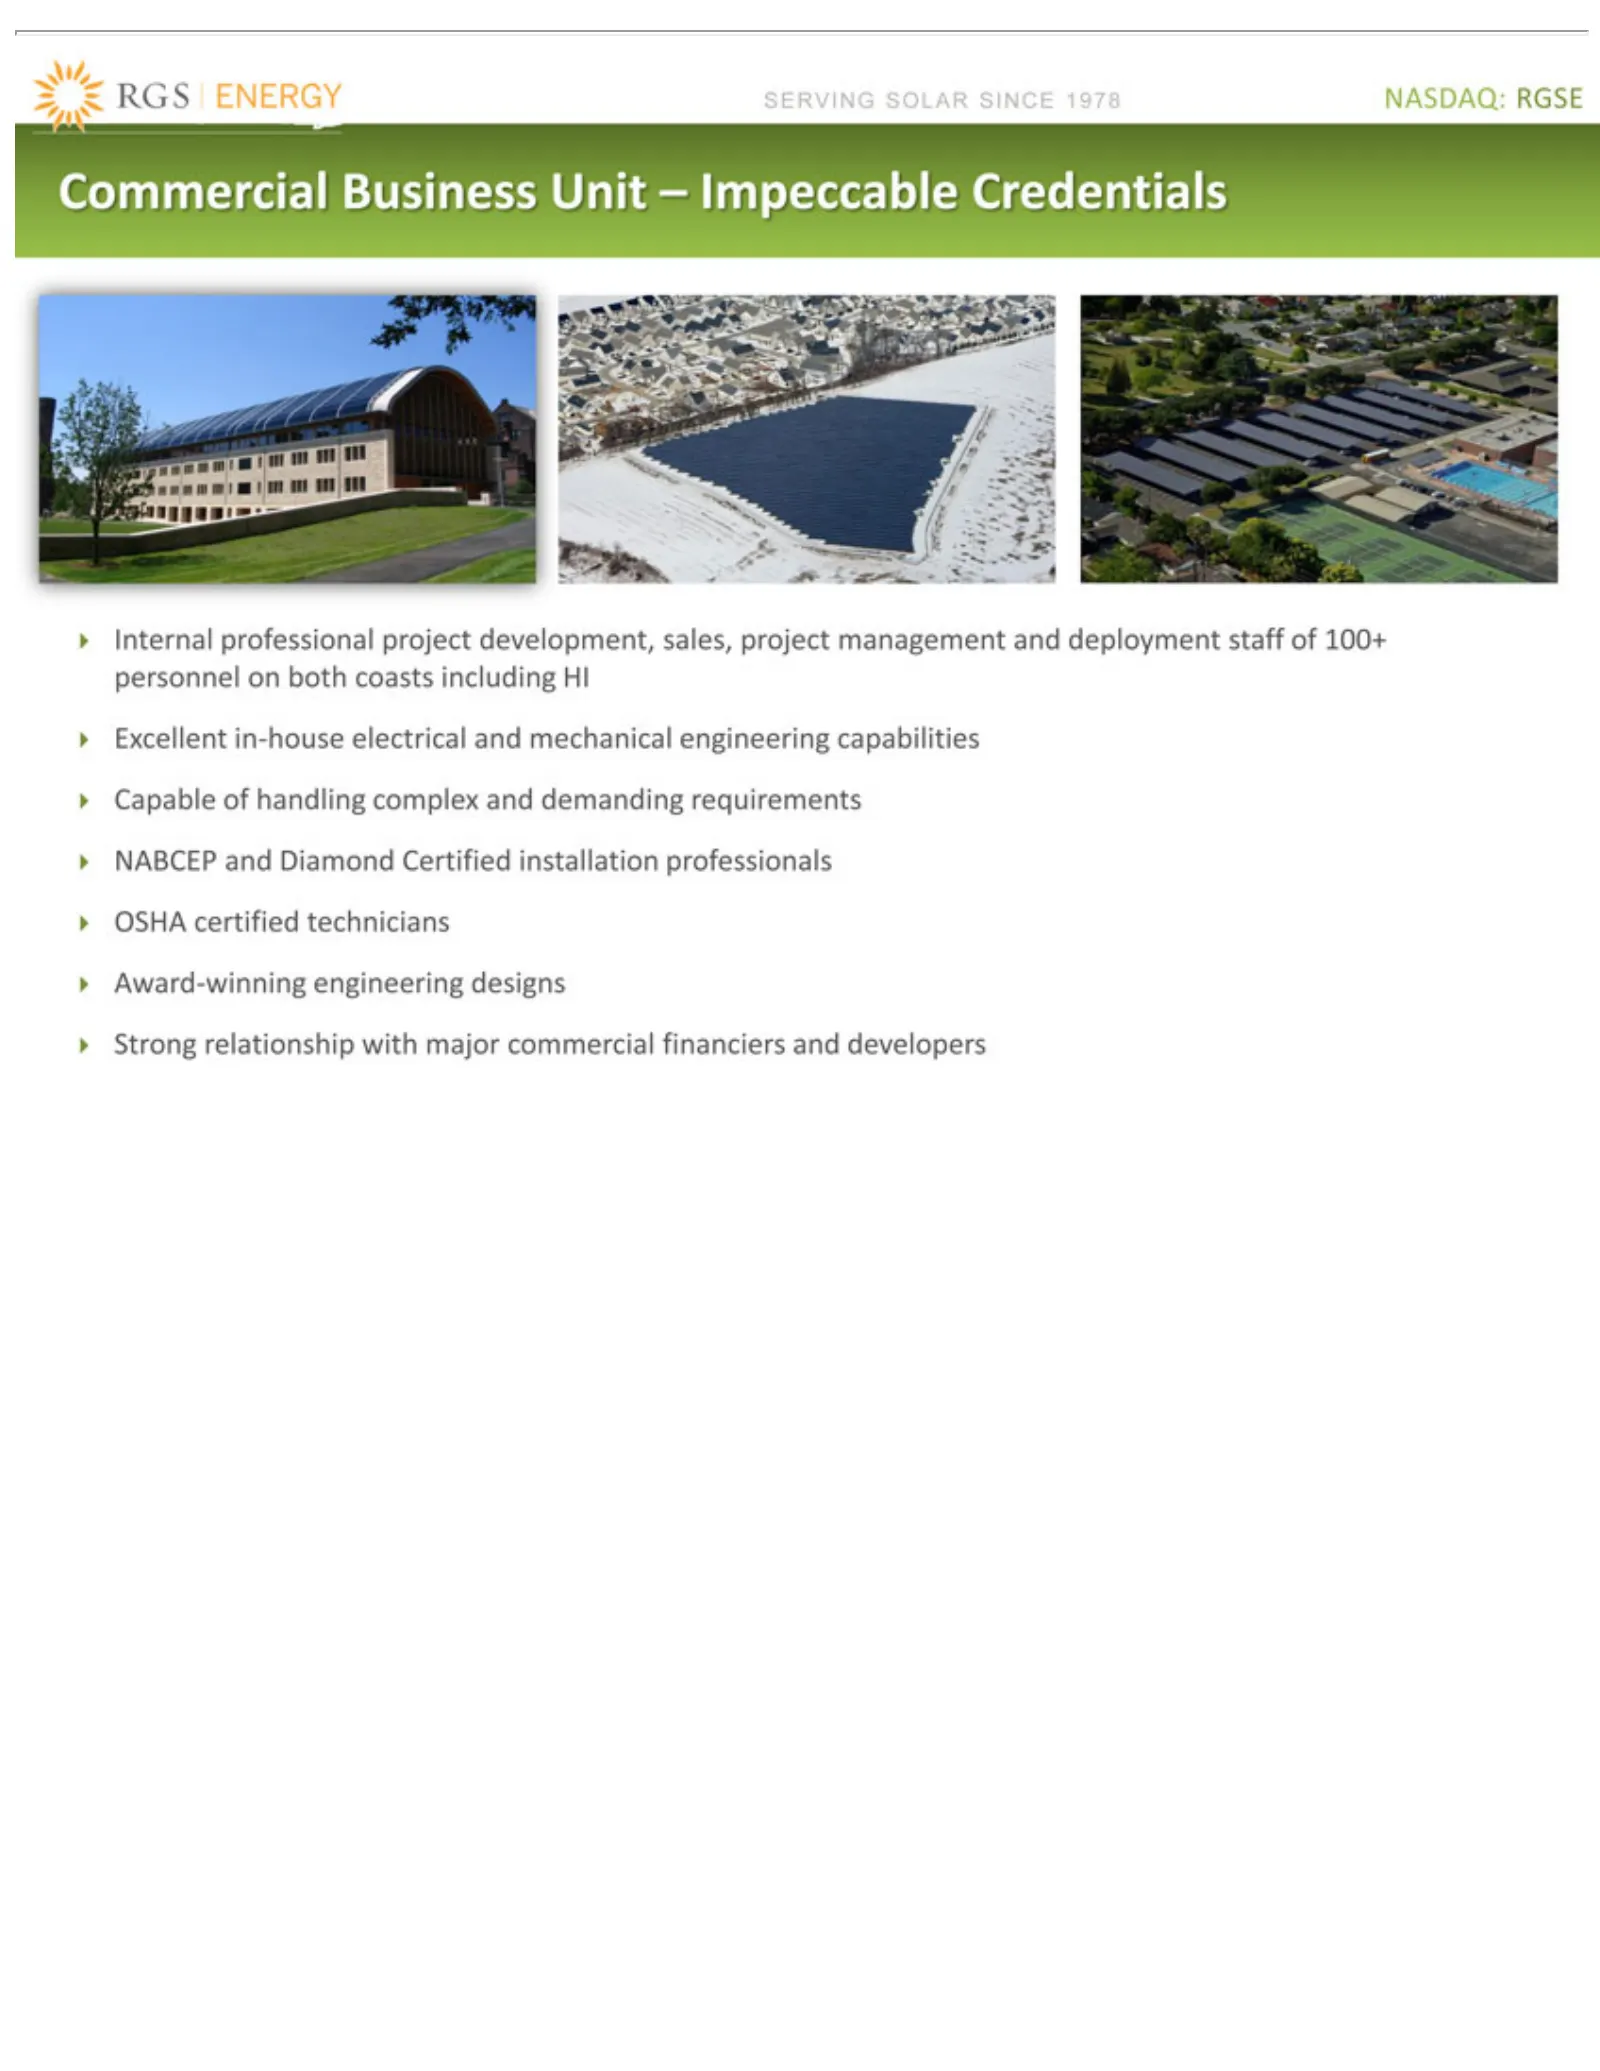
Slide 14: Commercial Business Unit Credentials
SERVING Commercial Internal Excellent technicians professional in-house SOLAR Award-winning Business electrical SINCE project Unit –1978 engineering development, and Impeccable mechanical NASDAQ: designs Credentials sales, RGSE engineering Strong projectrelationship management capabilitieswith Capab
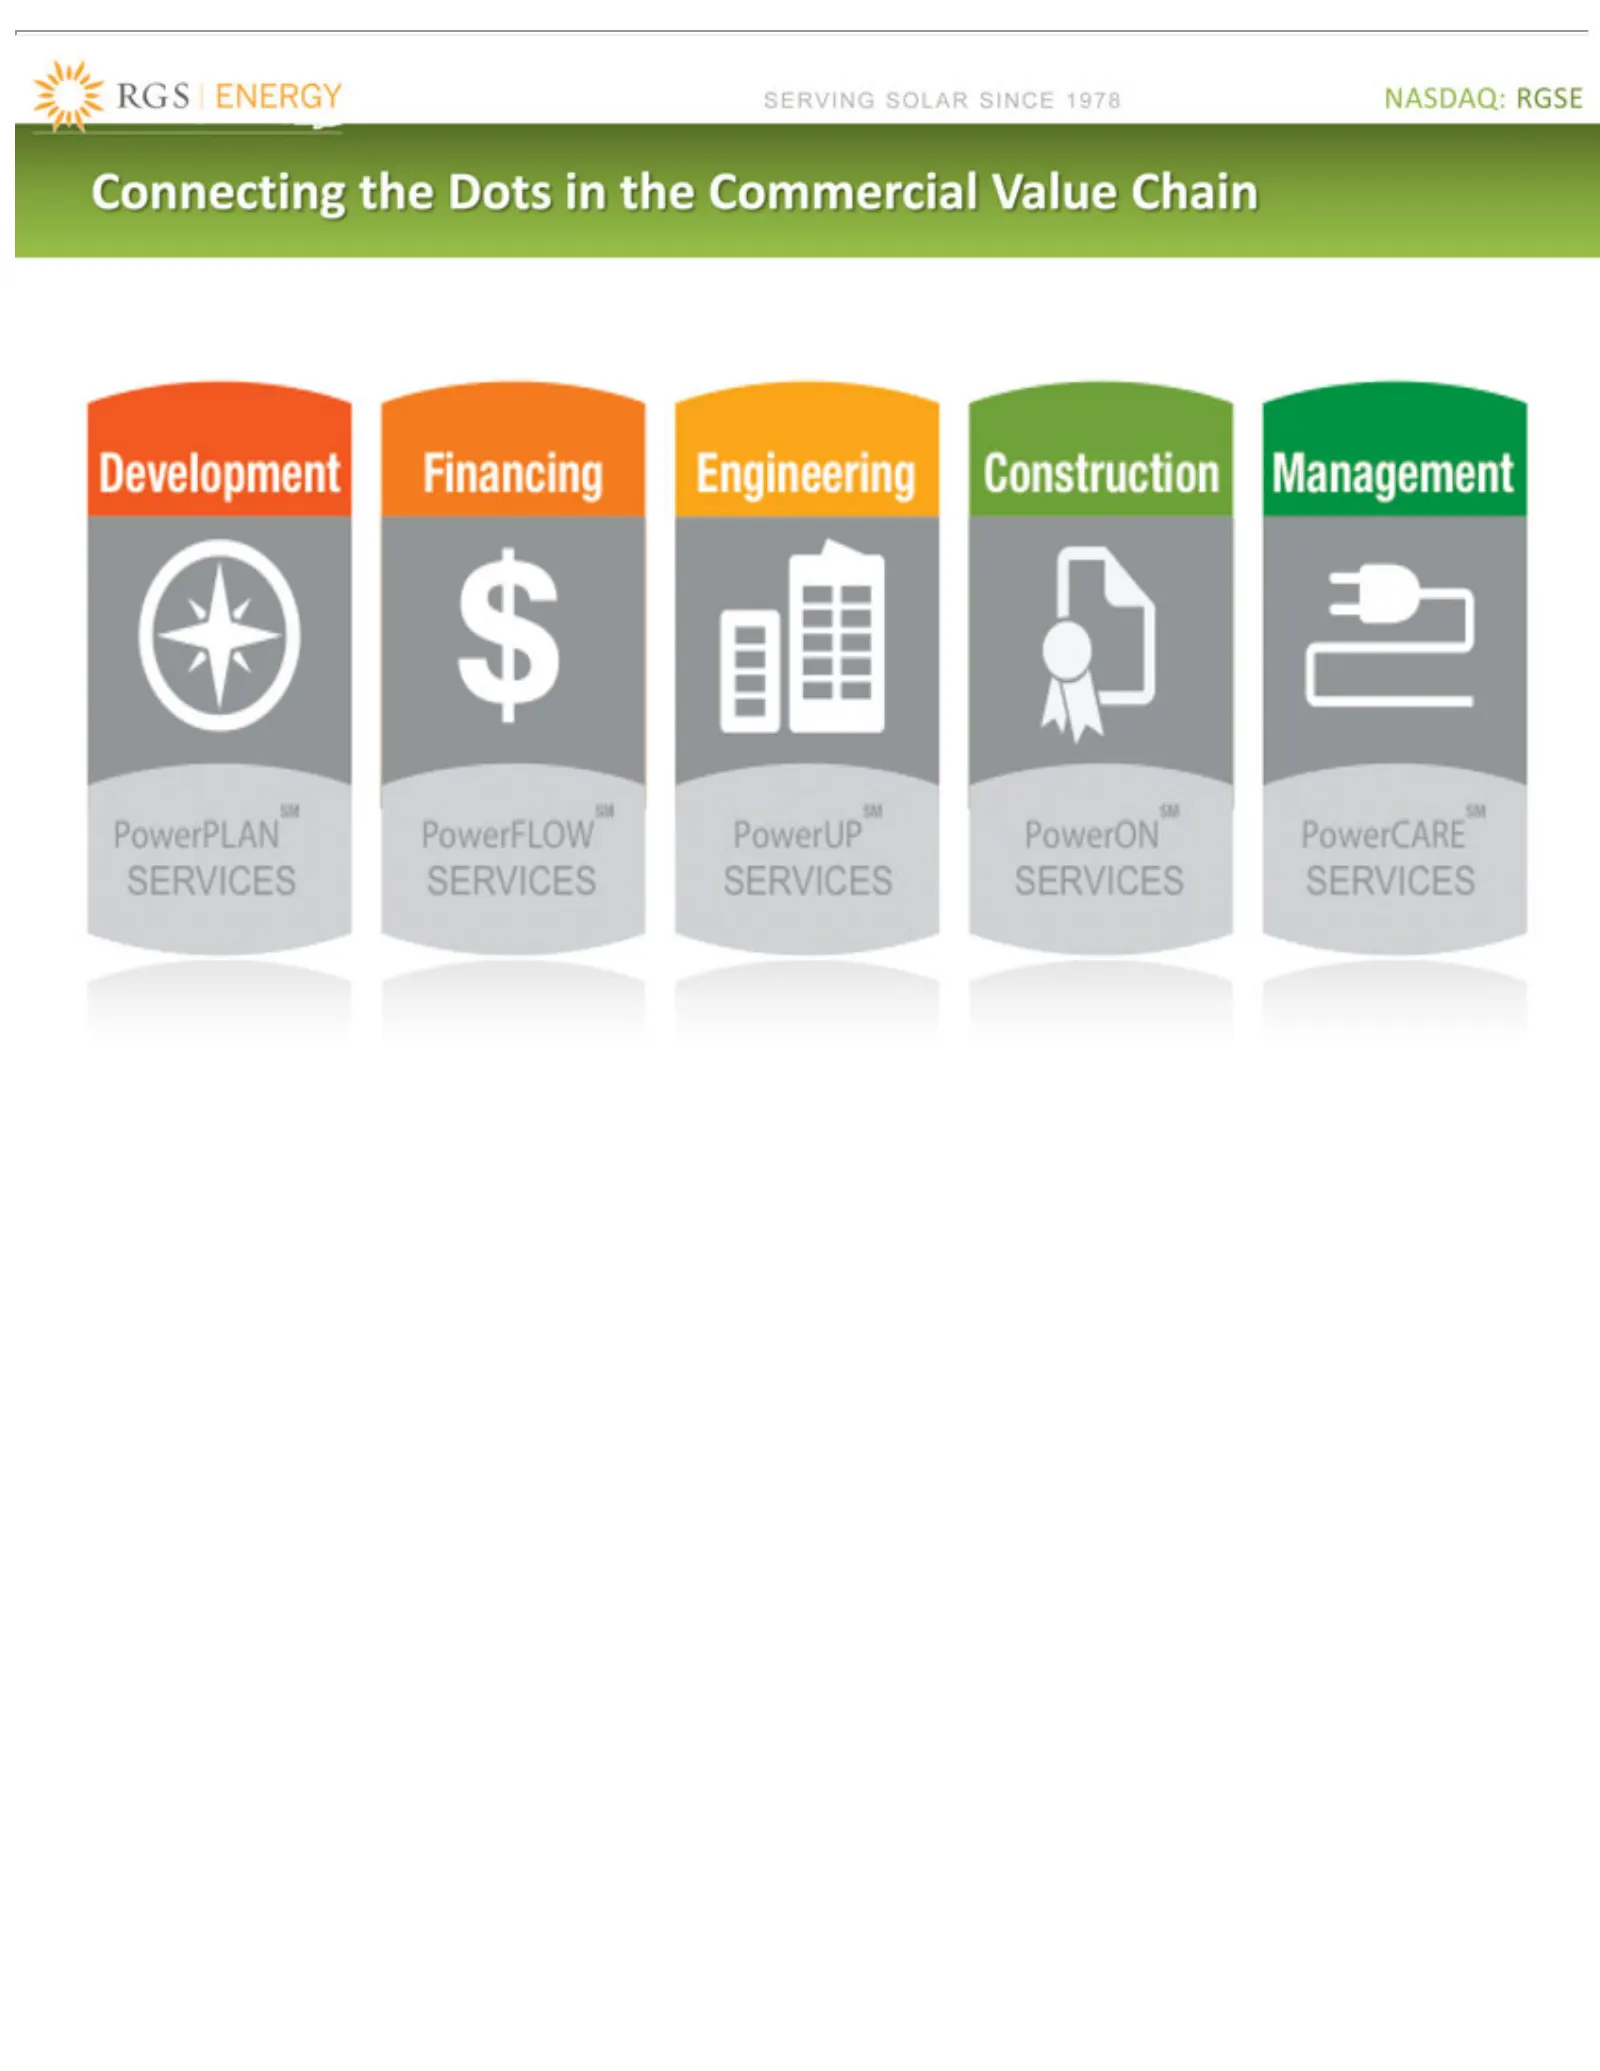
Slide 15: Connecting the Dots in the Commercial Value Chain
SERVING SOLAR Connecting the DotsSINCE in the Commercial 1978 NASDAQ: ValueRGSE Chain
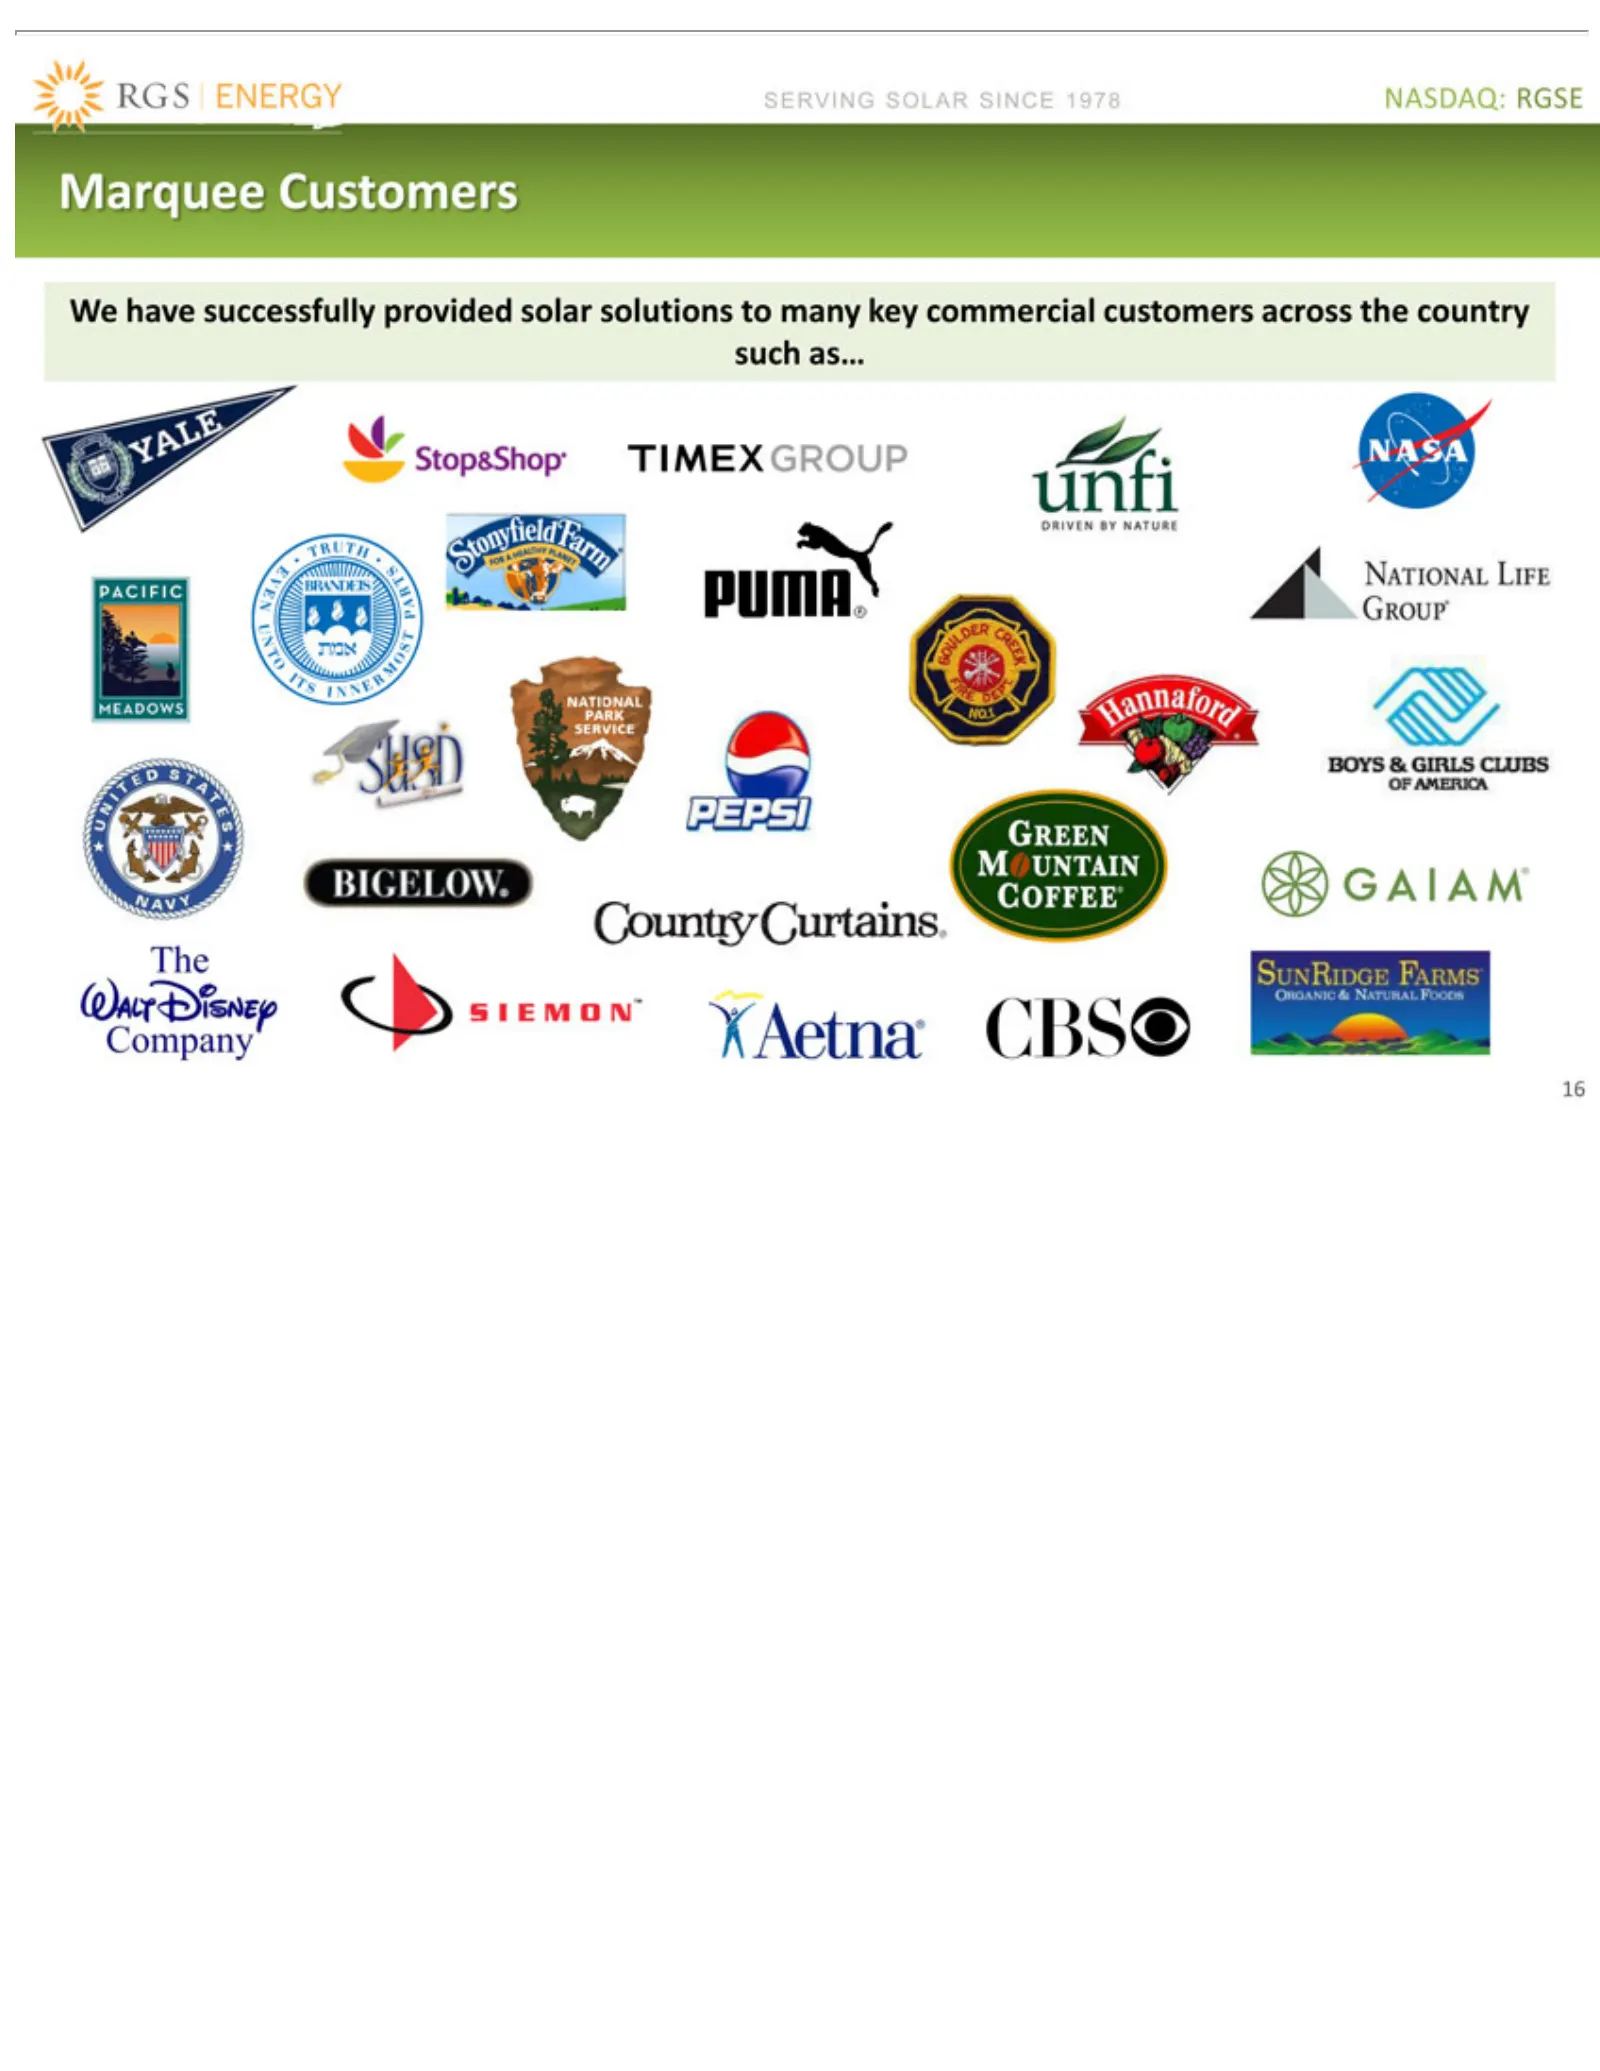
Slide 16: Marquee Customers
SERVING Marquee NASDAQ: We 16 have successfully Customers SOLAR RGSE SINCE provided 1978solar solutions to many key commercial customers across the country such as…
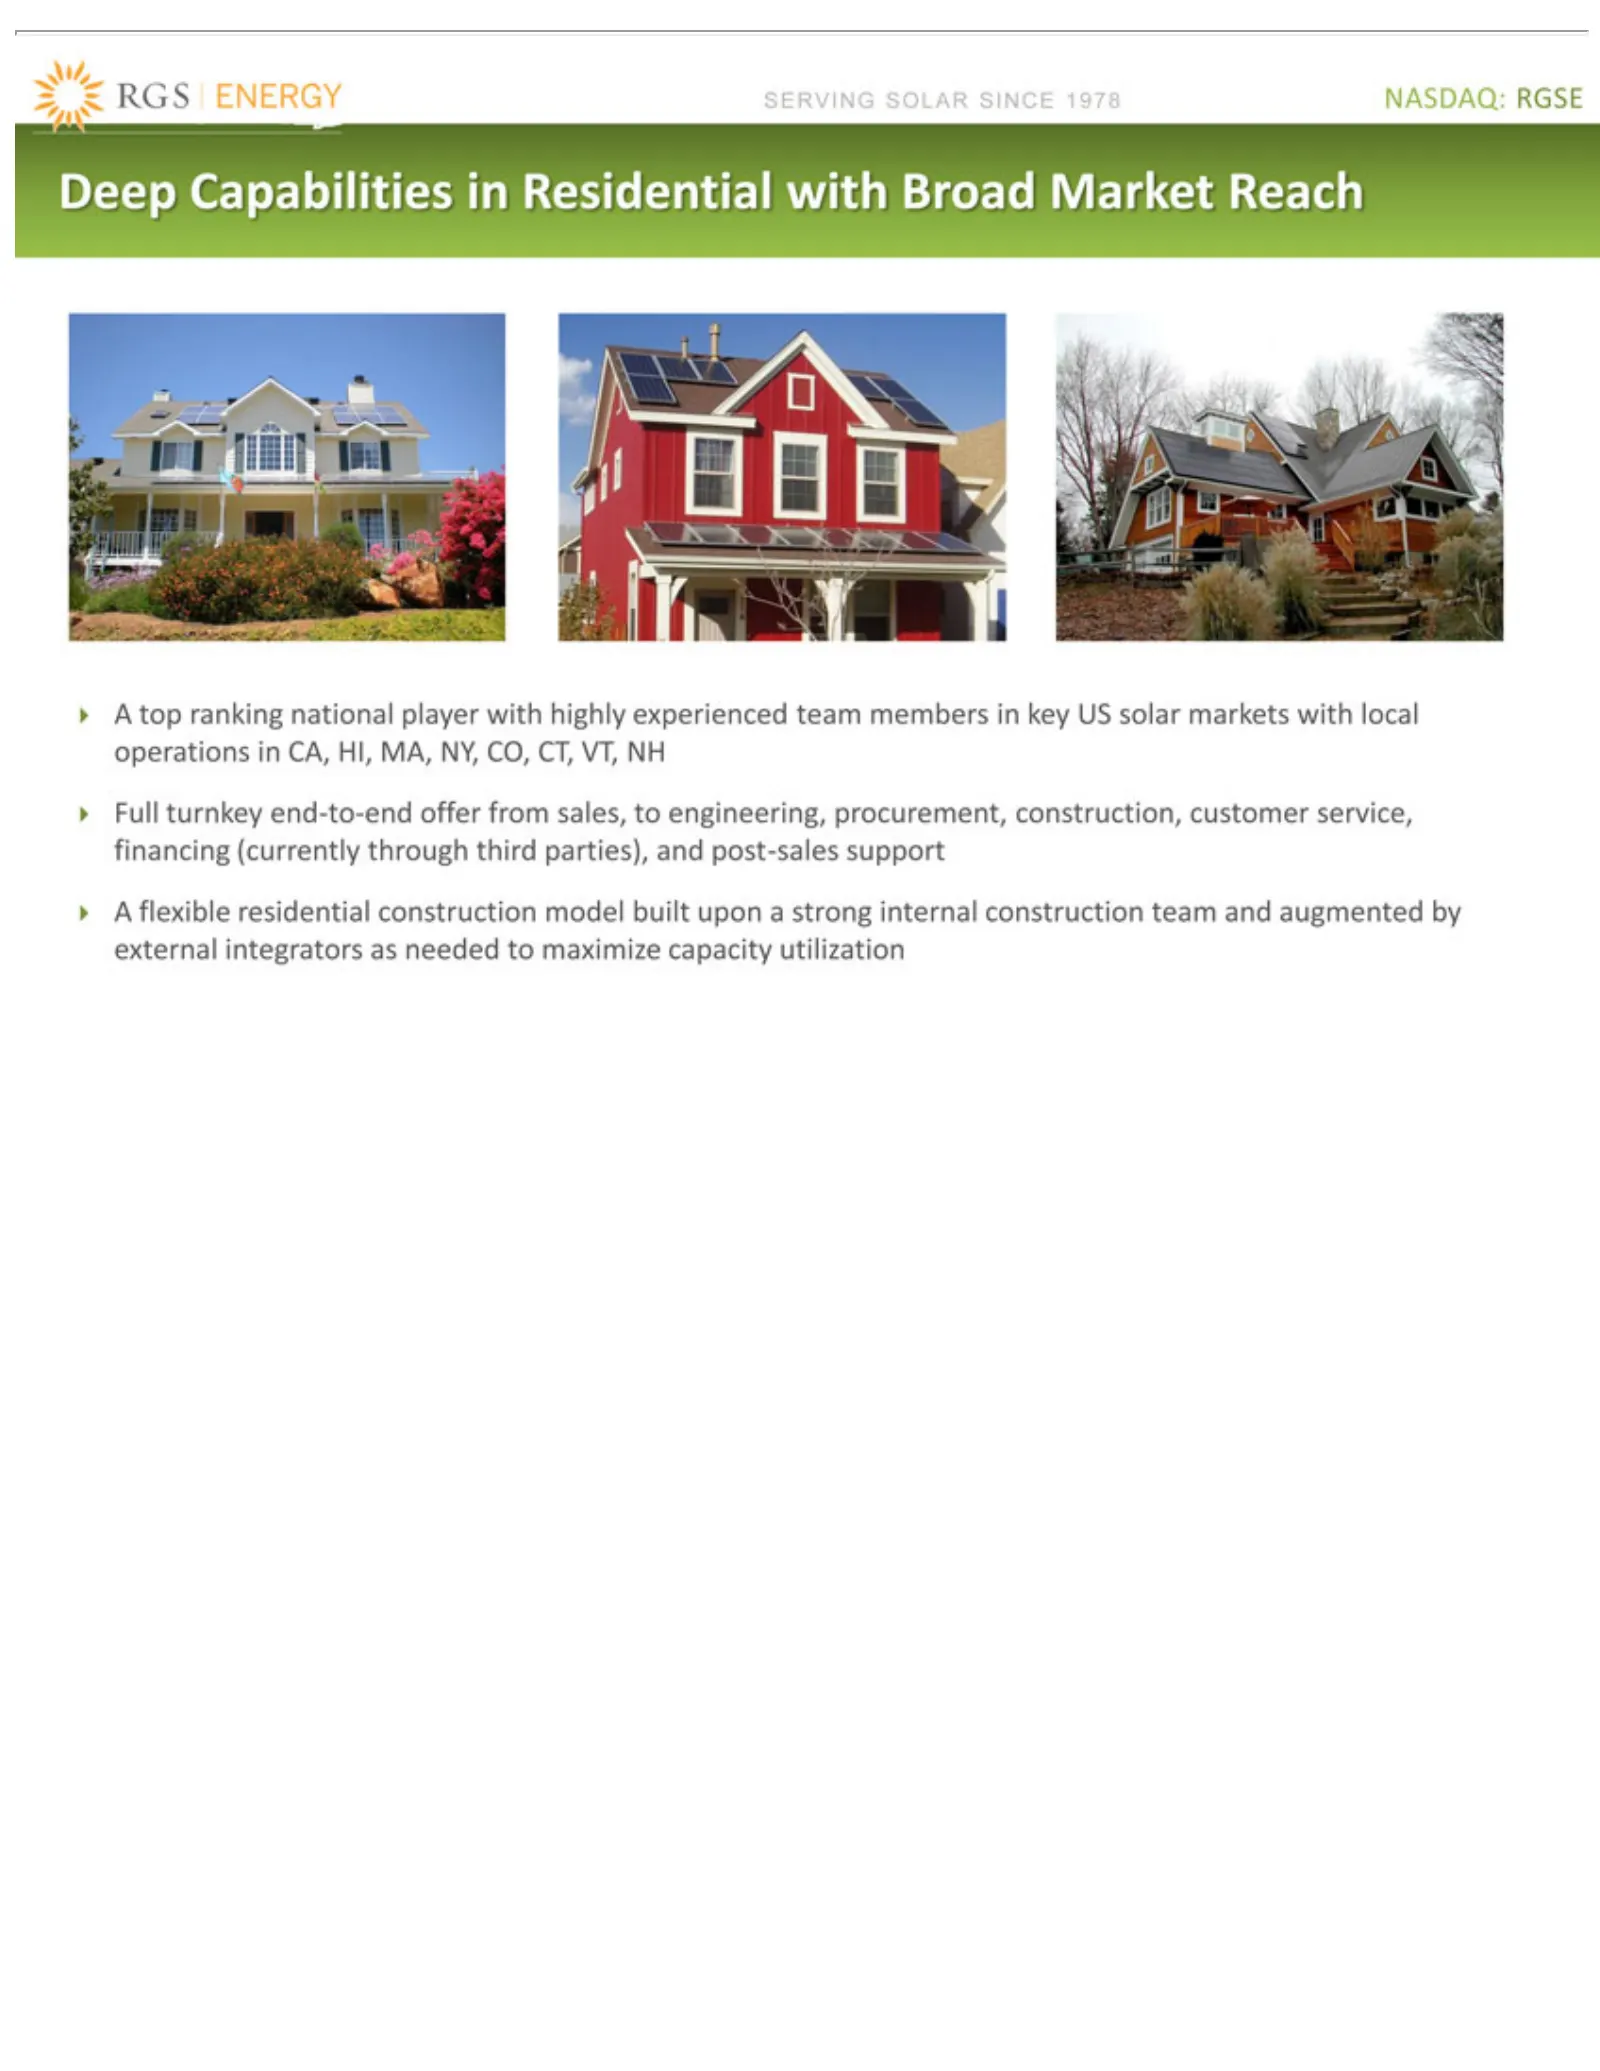
Slide 17: Deep Residential Capabilities
NASDAQ: SERVING Deep ?Full ?A topturnkey flexible Capabilities ranking SOLAR residential RGSE end-to-end national inSINCE Residential construction player offer 1978 from with with model highly sales, Broadto built experienced Market engineering, uponReach a strong team procurement, members internal
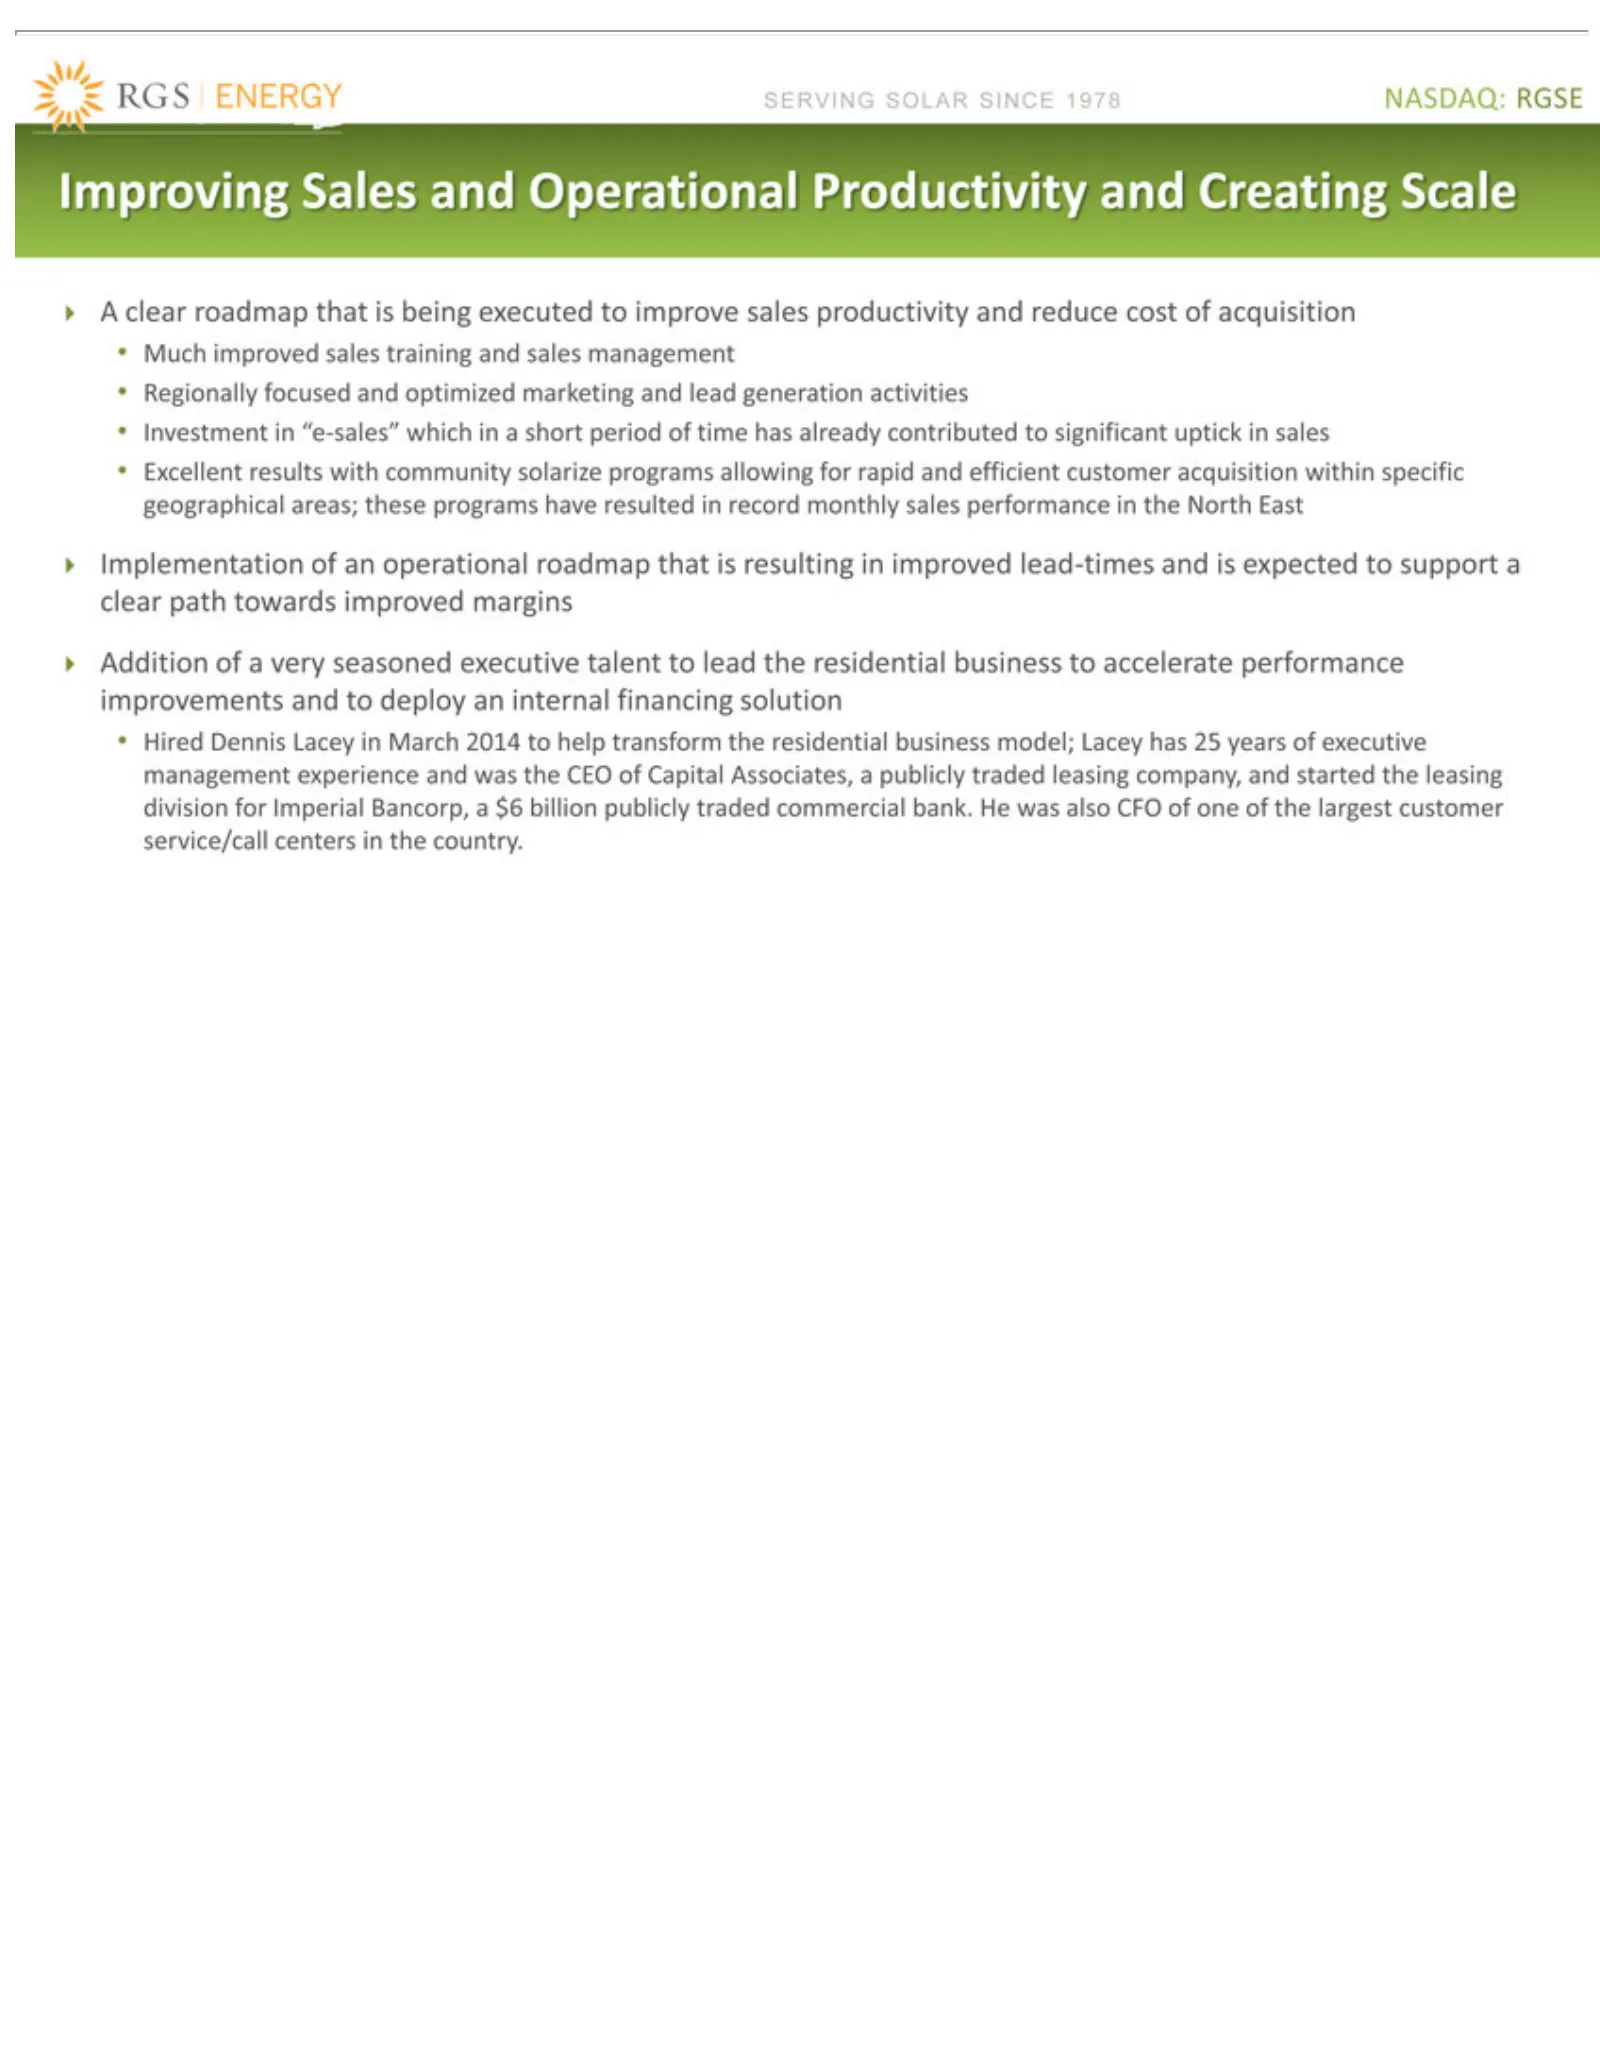
Slide 18: Improving Residential Results
NASDAQ: SERVING Improving ?A Much Regionally Investment Excellent in ?Implementation ?Addition Hired company, the clear North Dennis improved roadmap results and of Sales SOLAR focused in RGSE East aLacey “e-sales” started very sales and with of that and SINCE seasoned an in Operational the training
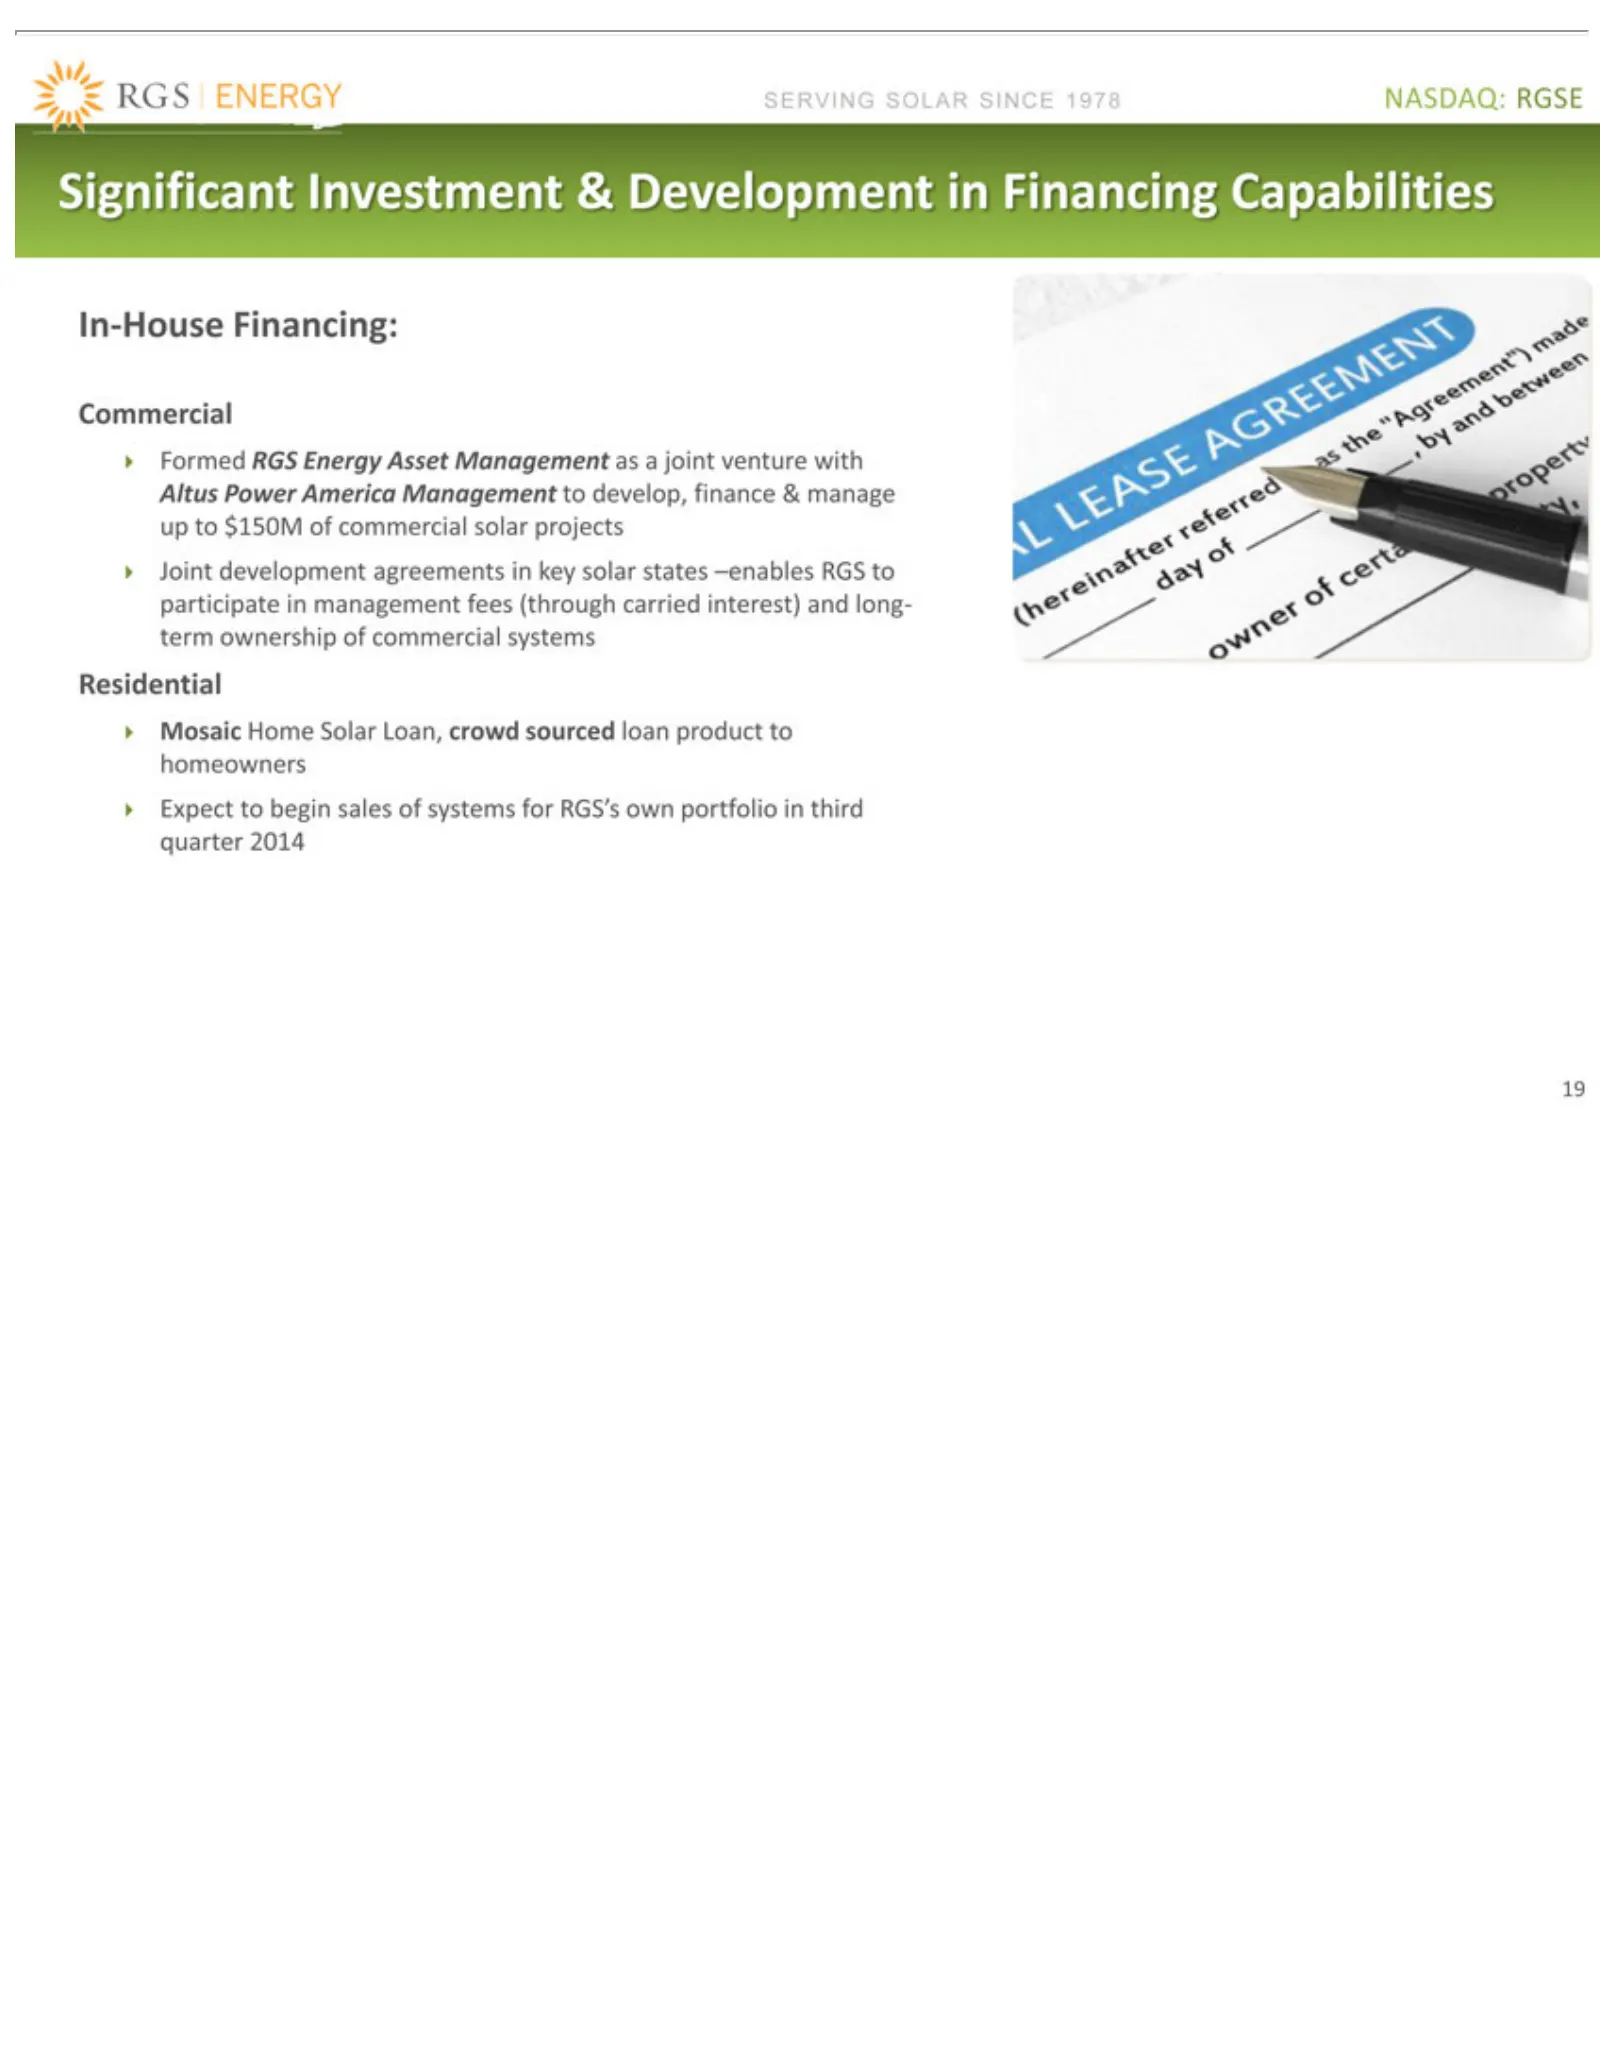
Slide 19: In-House Financing Capabilities
NASDAQ: SERVING In-House ?Formed Commercial ?Joint ?Mosaic Residential ?Expect Significant 19 development to Home RGS Financing: begin SOLAR Investment RGSE Energy Solar sales SINCE agreements Loan, Asset of & systems Development 1978 crowd Management infor key sourced RGS’s solar in as Financing lo
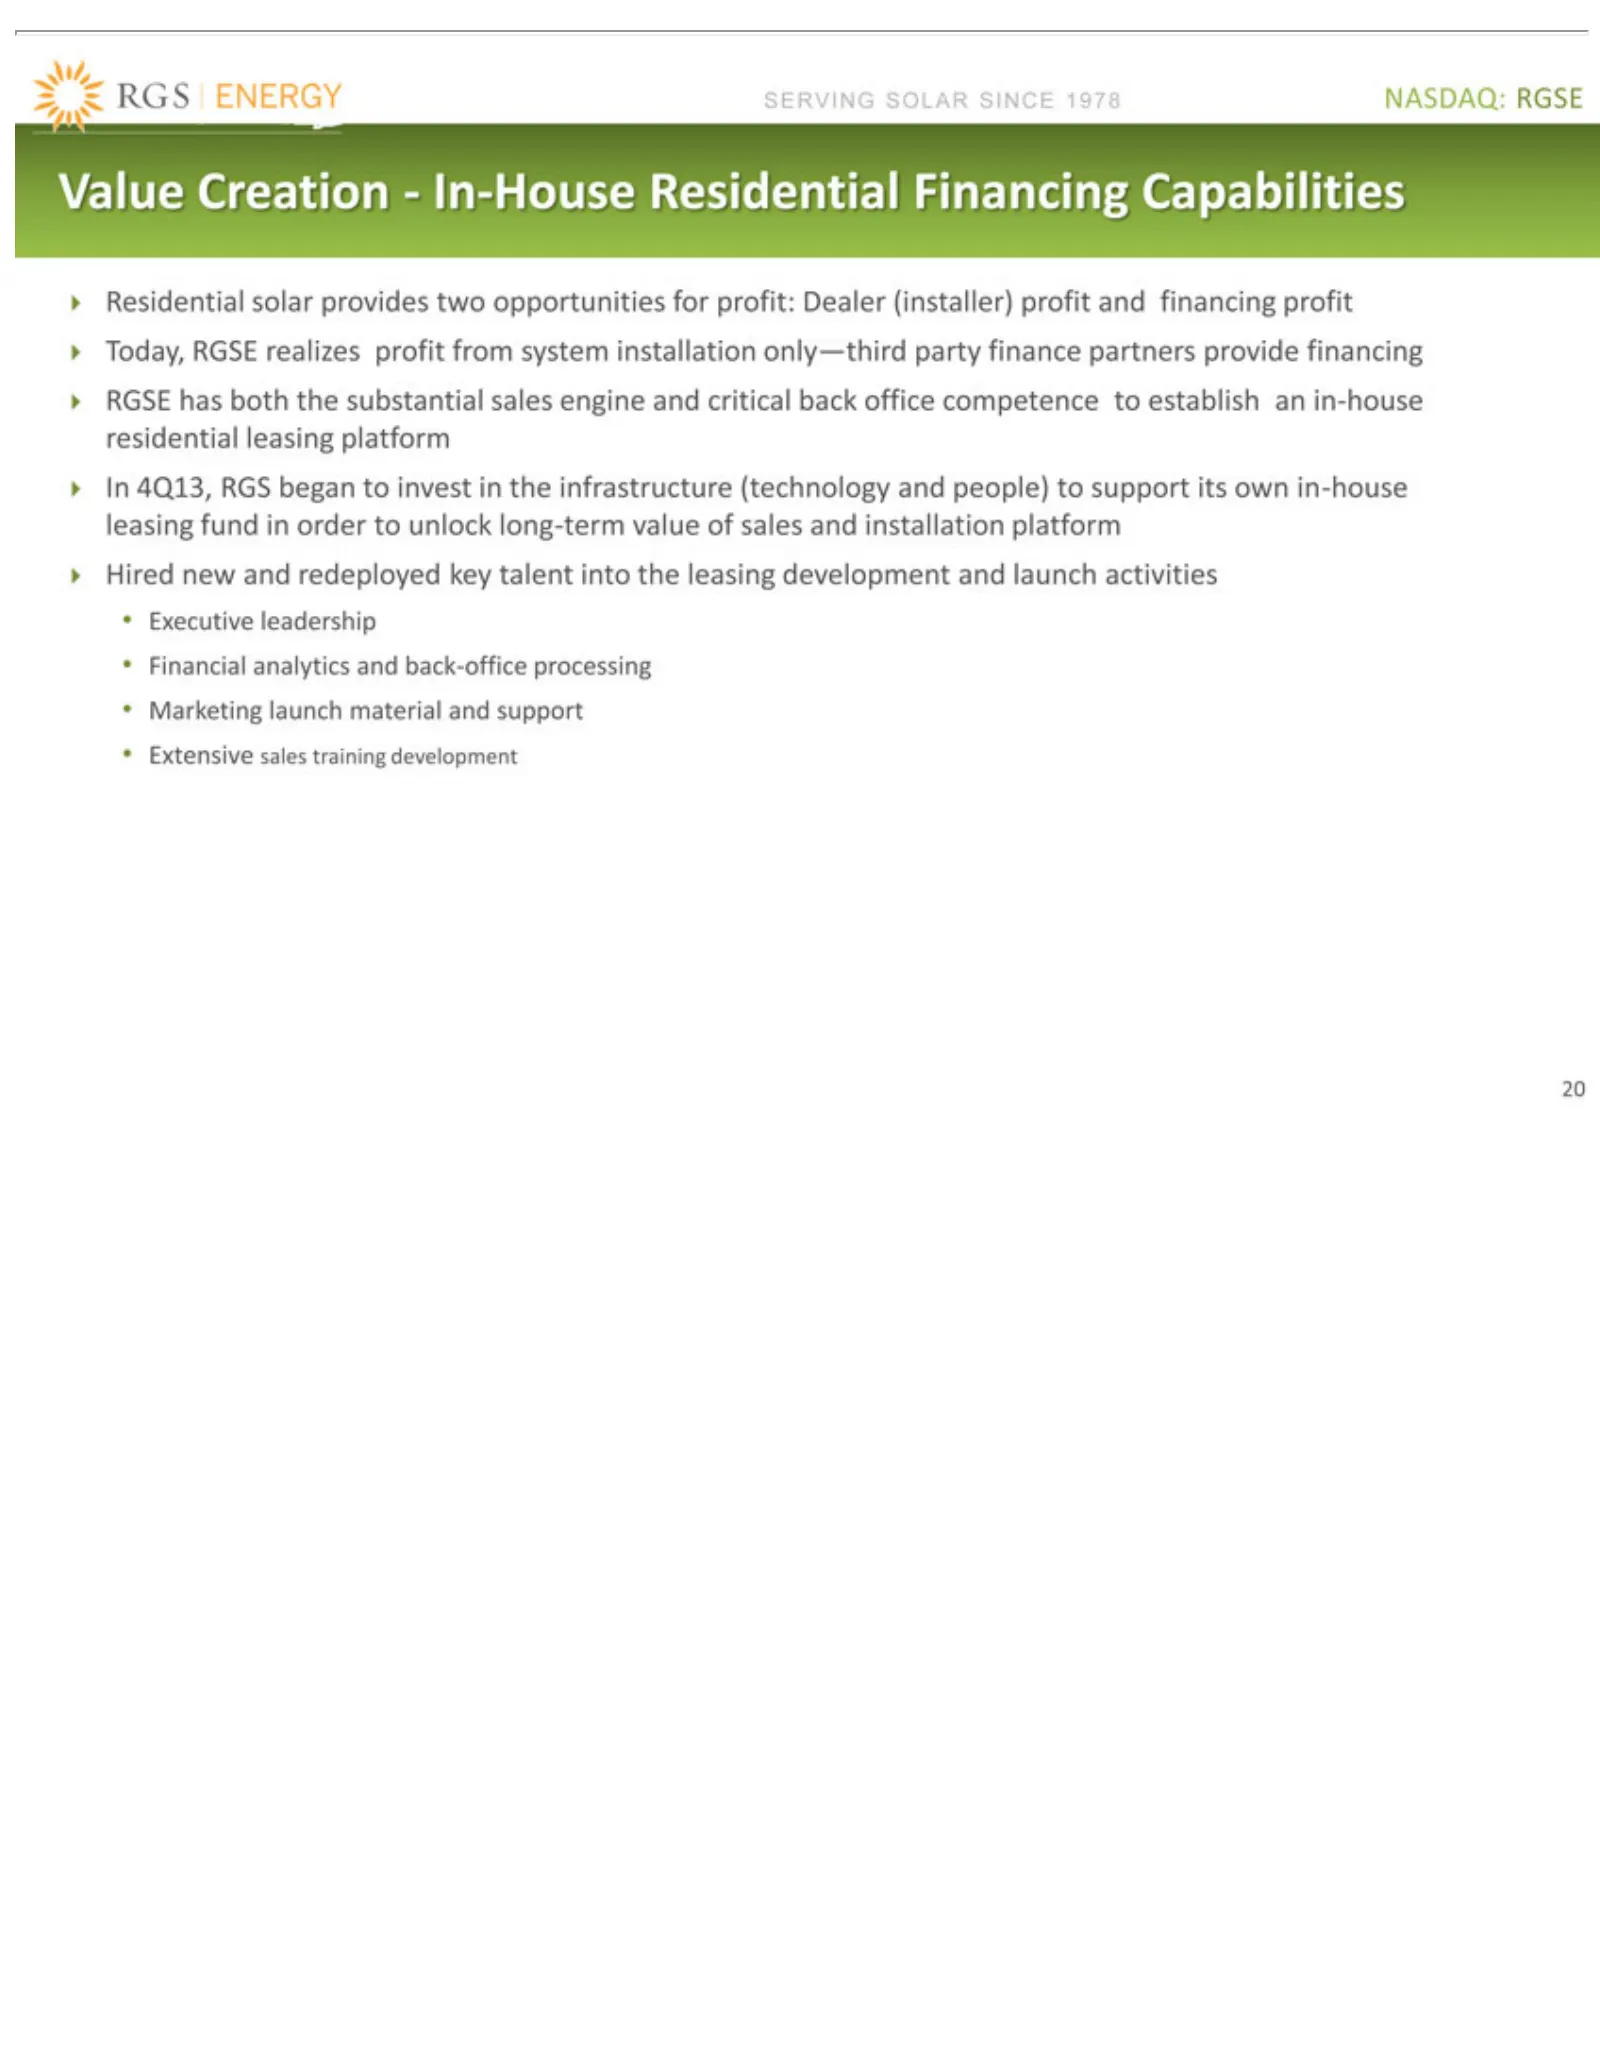
Slide 20: Residential Financing Value Creation
NASDAQ: SERVING ?Residential ?Today, ?RGSE ?In ?Hired Executive Financial Marketing Extensive Value 20 4Q13, Creation—In-House new has RGSE analytics sales leadership RGS launch SOLAR RGSE both and solar realizes training began redeployed the material provides and SINCE substantial toback-office pro
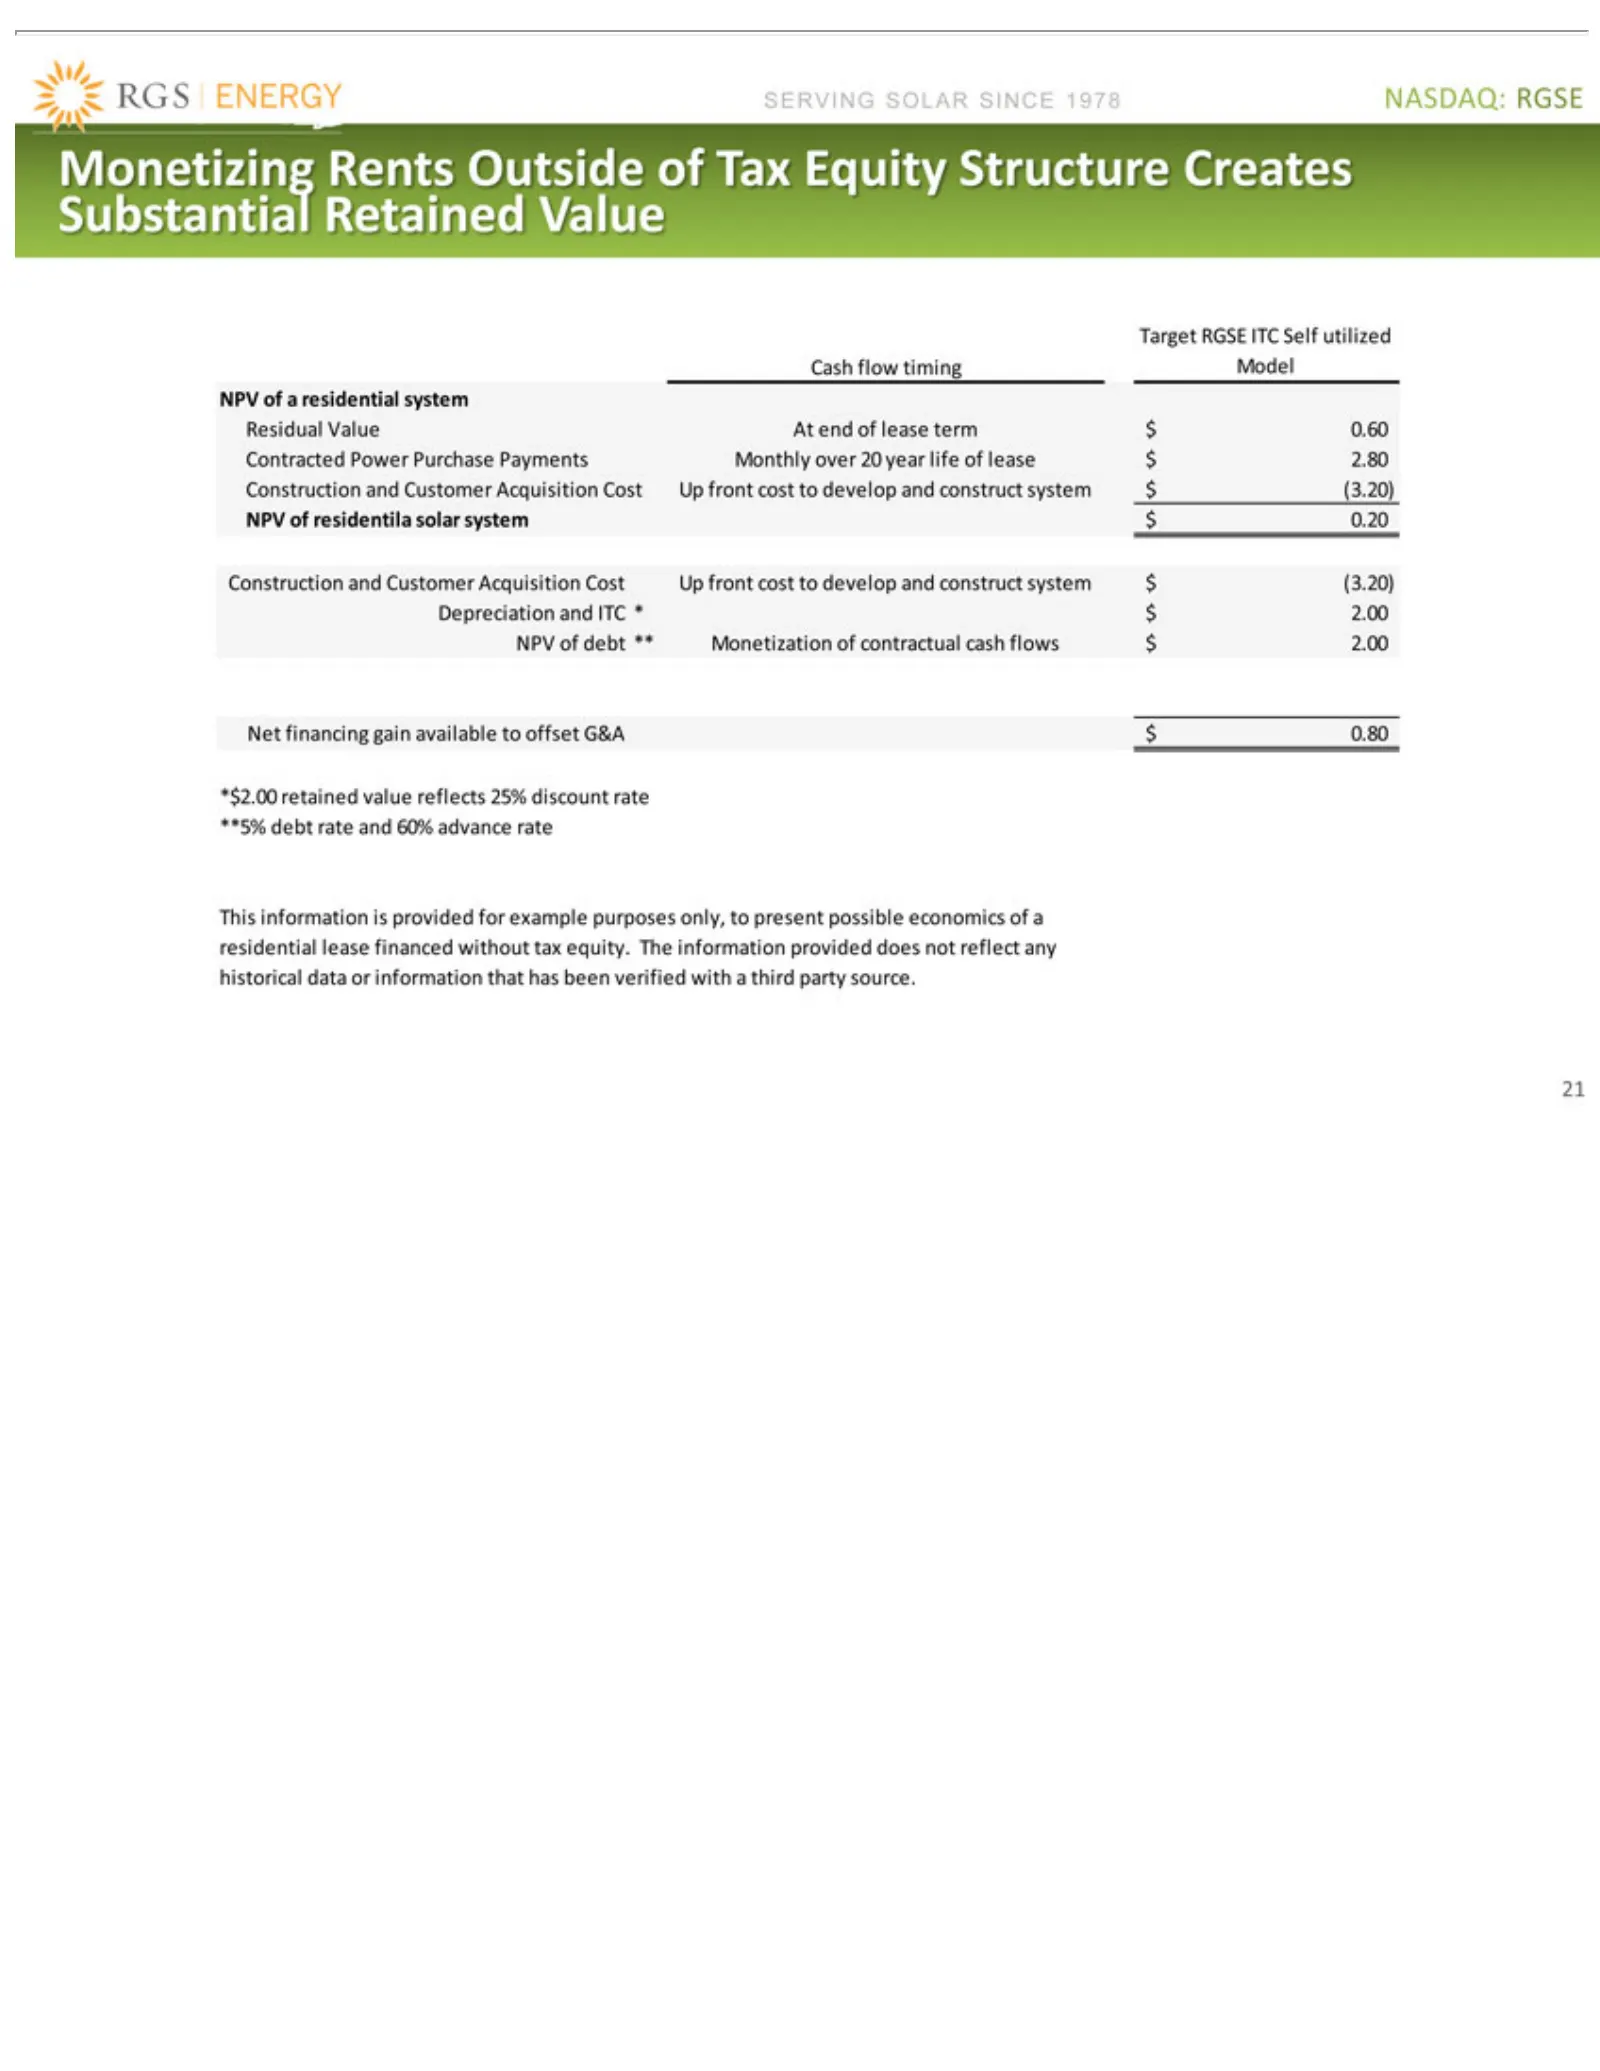
Slide 21: Monetizing Residential Solar Leases
NASDAQ: SERVING Monetizing Target Residual system NPV Construction Net *$2.00 This information 21 financing information ofRGSE retained $residentila aValue (3.20) residential SOLAR RGSE Rents that and ITC gain At value has is Customer Outside Self end available solar provided SINCE been system refle
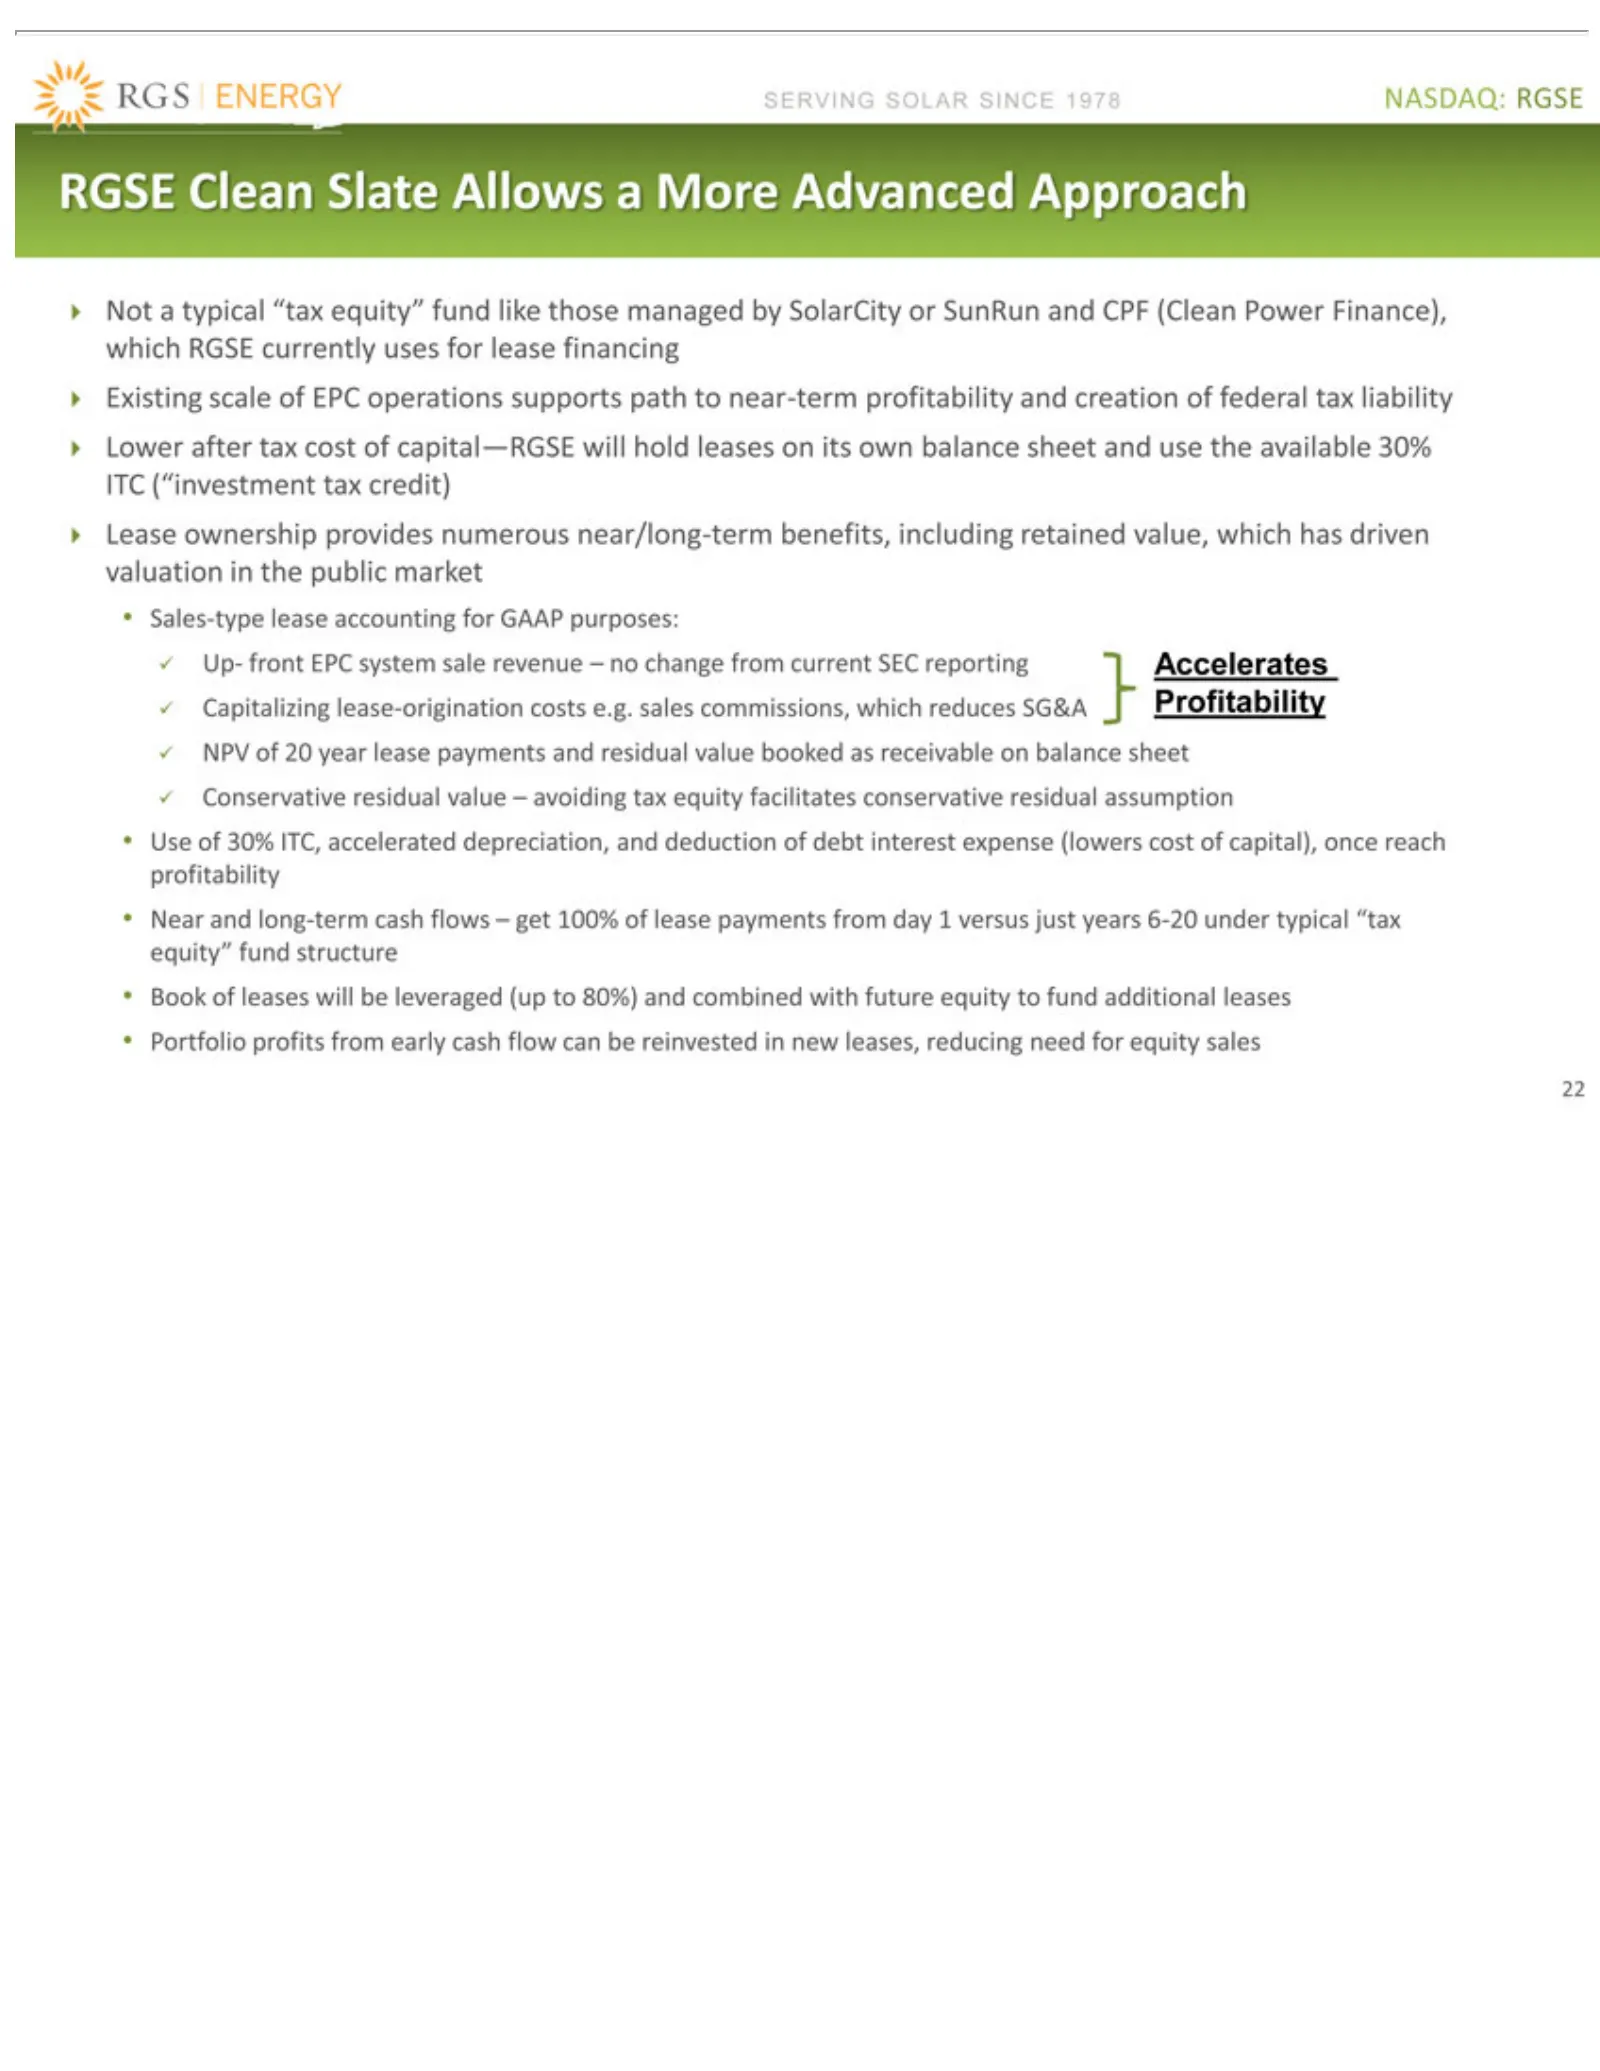
Slide 22: Residential Lease Approach
NASDAQ: SERVING ?Not ?Existing ?Lower ?Lease Sales-type ?Up- ?Capitalizing ?NPV ?Conservative Use Near Book Portfolio RGSE 22 ofand afront of of Clean typical 30% ownership after leases 20 profits long-term scale lease EPC SOLAR RGSE ITC, year tax Slate lease-origination “tax residual will of system
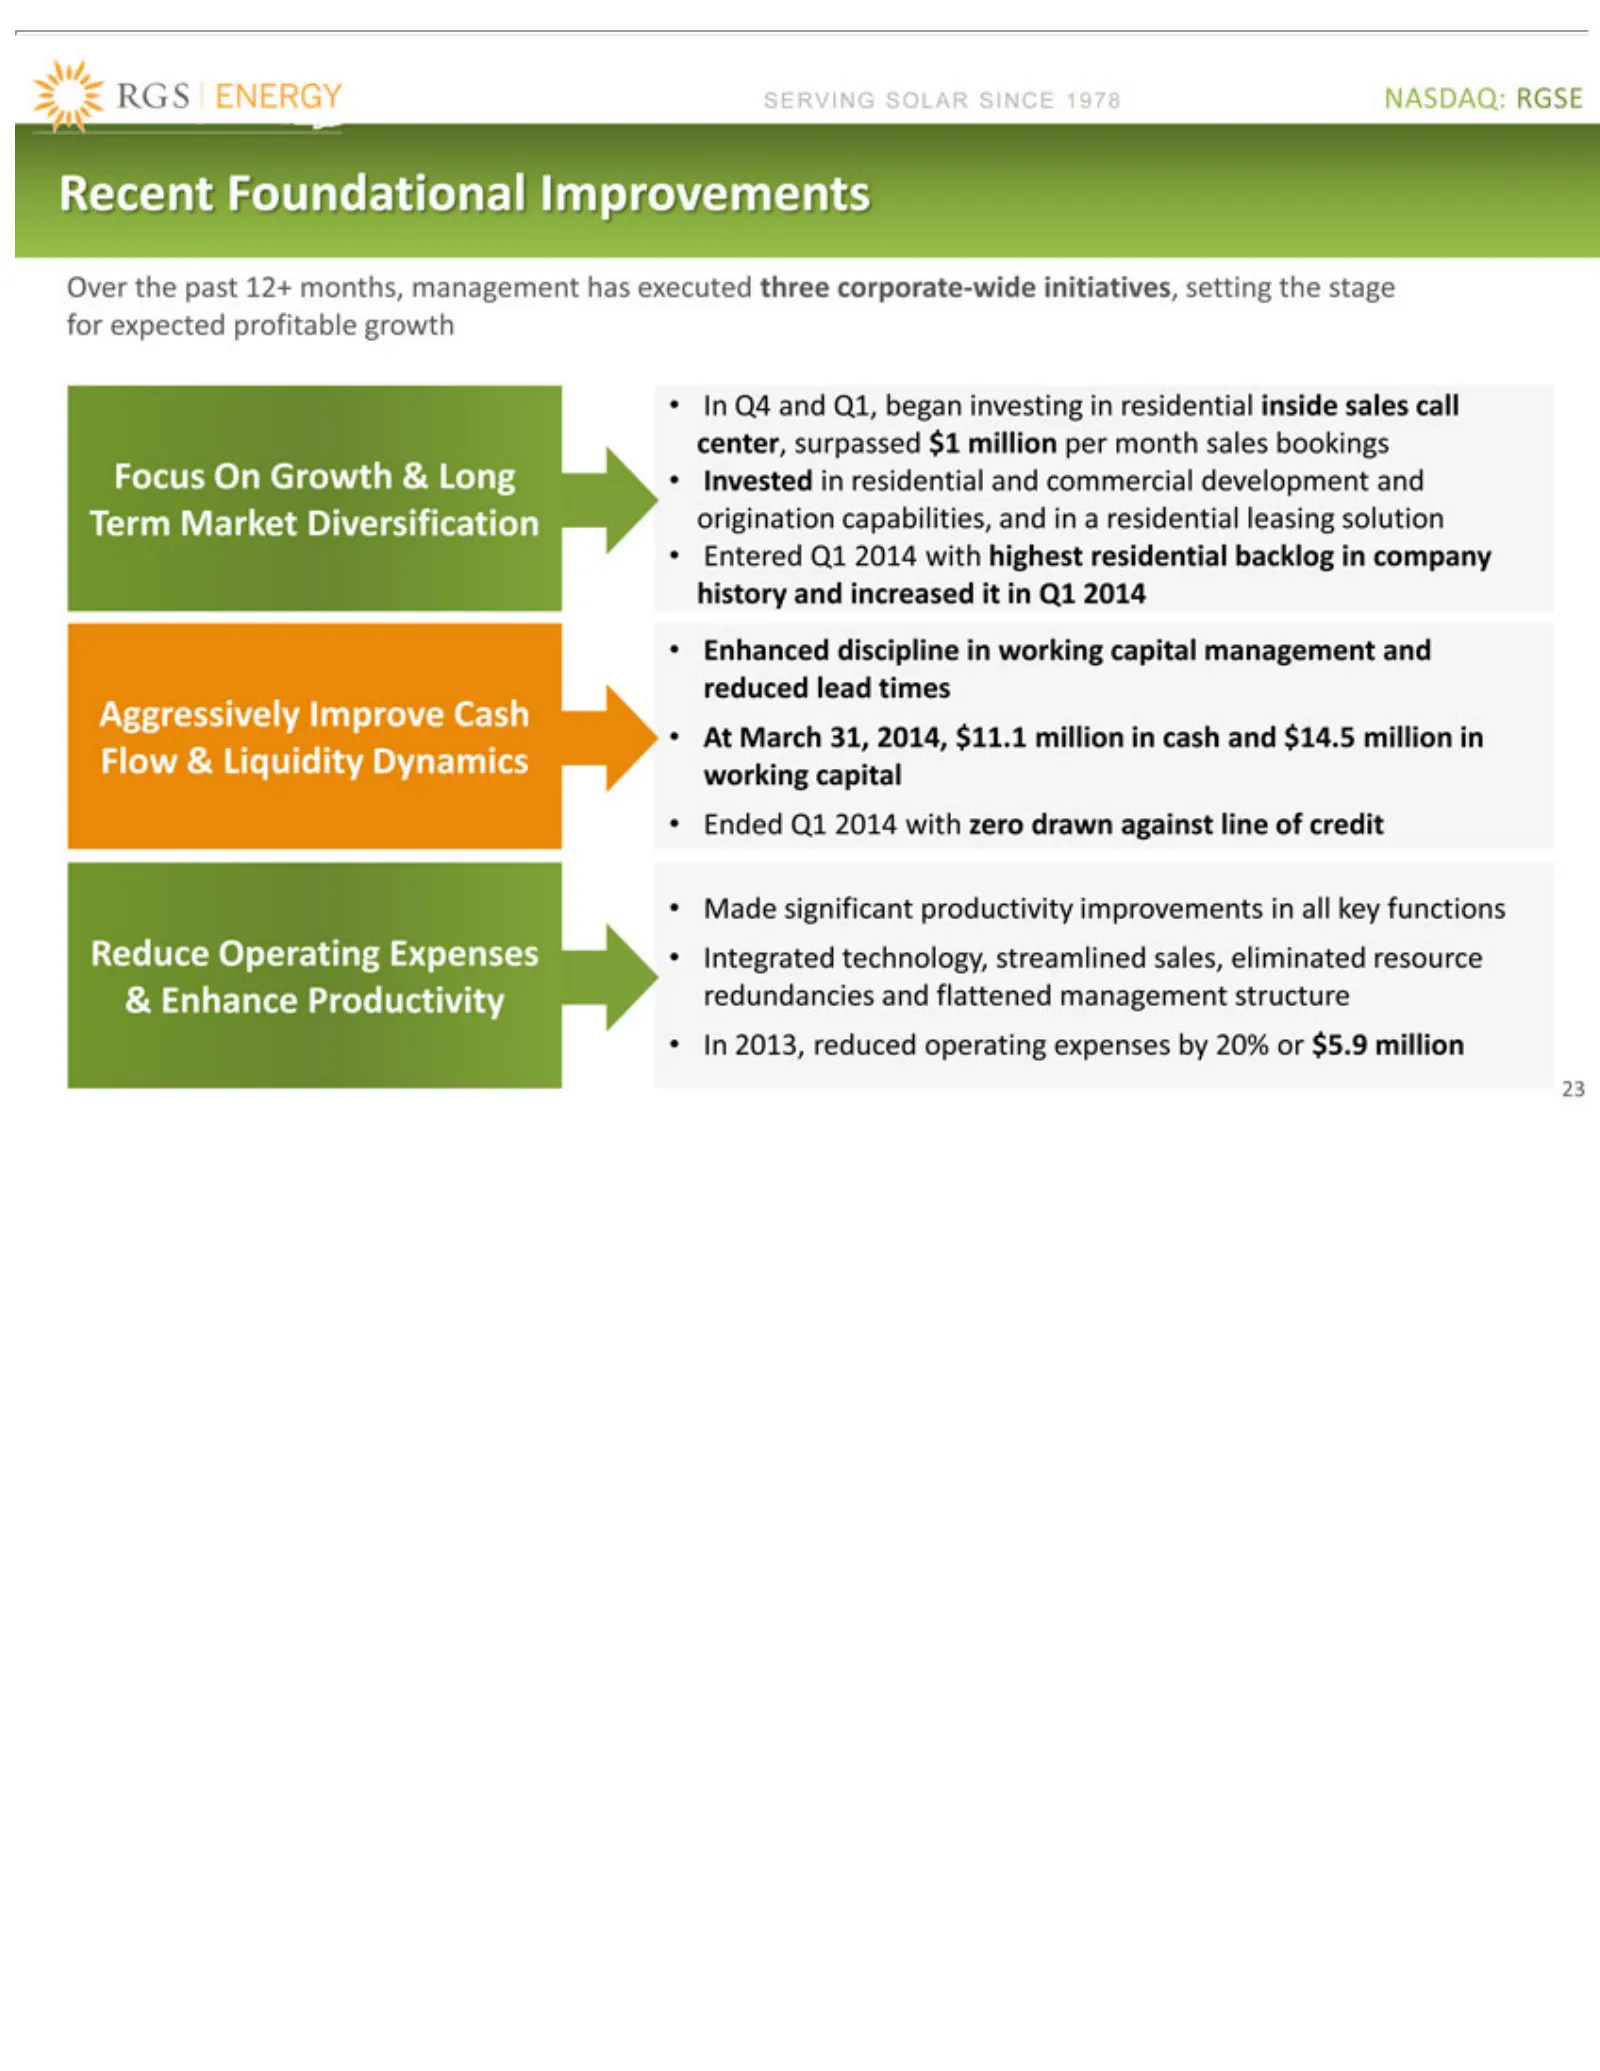
Slide 23: Recent Operating Improvements
NASDAQ: SERVING Invested Entered Recent Over Enhanced At Ended Made Integrated In Focus Aggressively Reduce 23 Q4 2013, March the significant and On Q1 Foundational Operating Q1 reduced in past 31, Growth discipline Q1, 2014 technology, SOLAR residential RGSE 2014 Improve 12+ 2014, began with operat
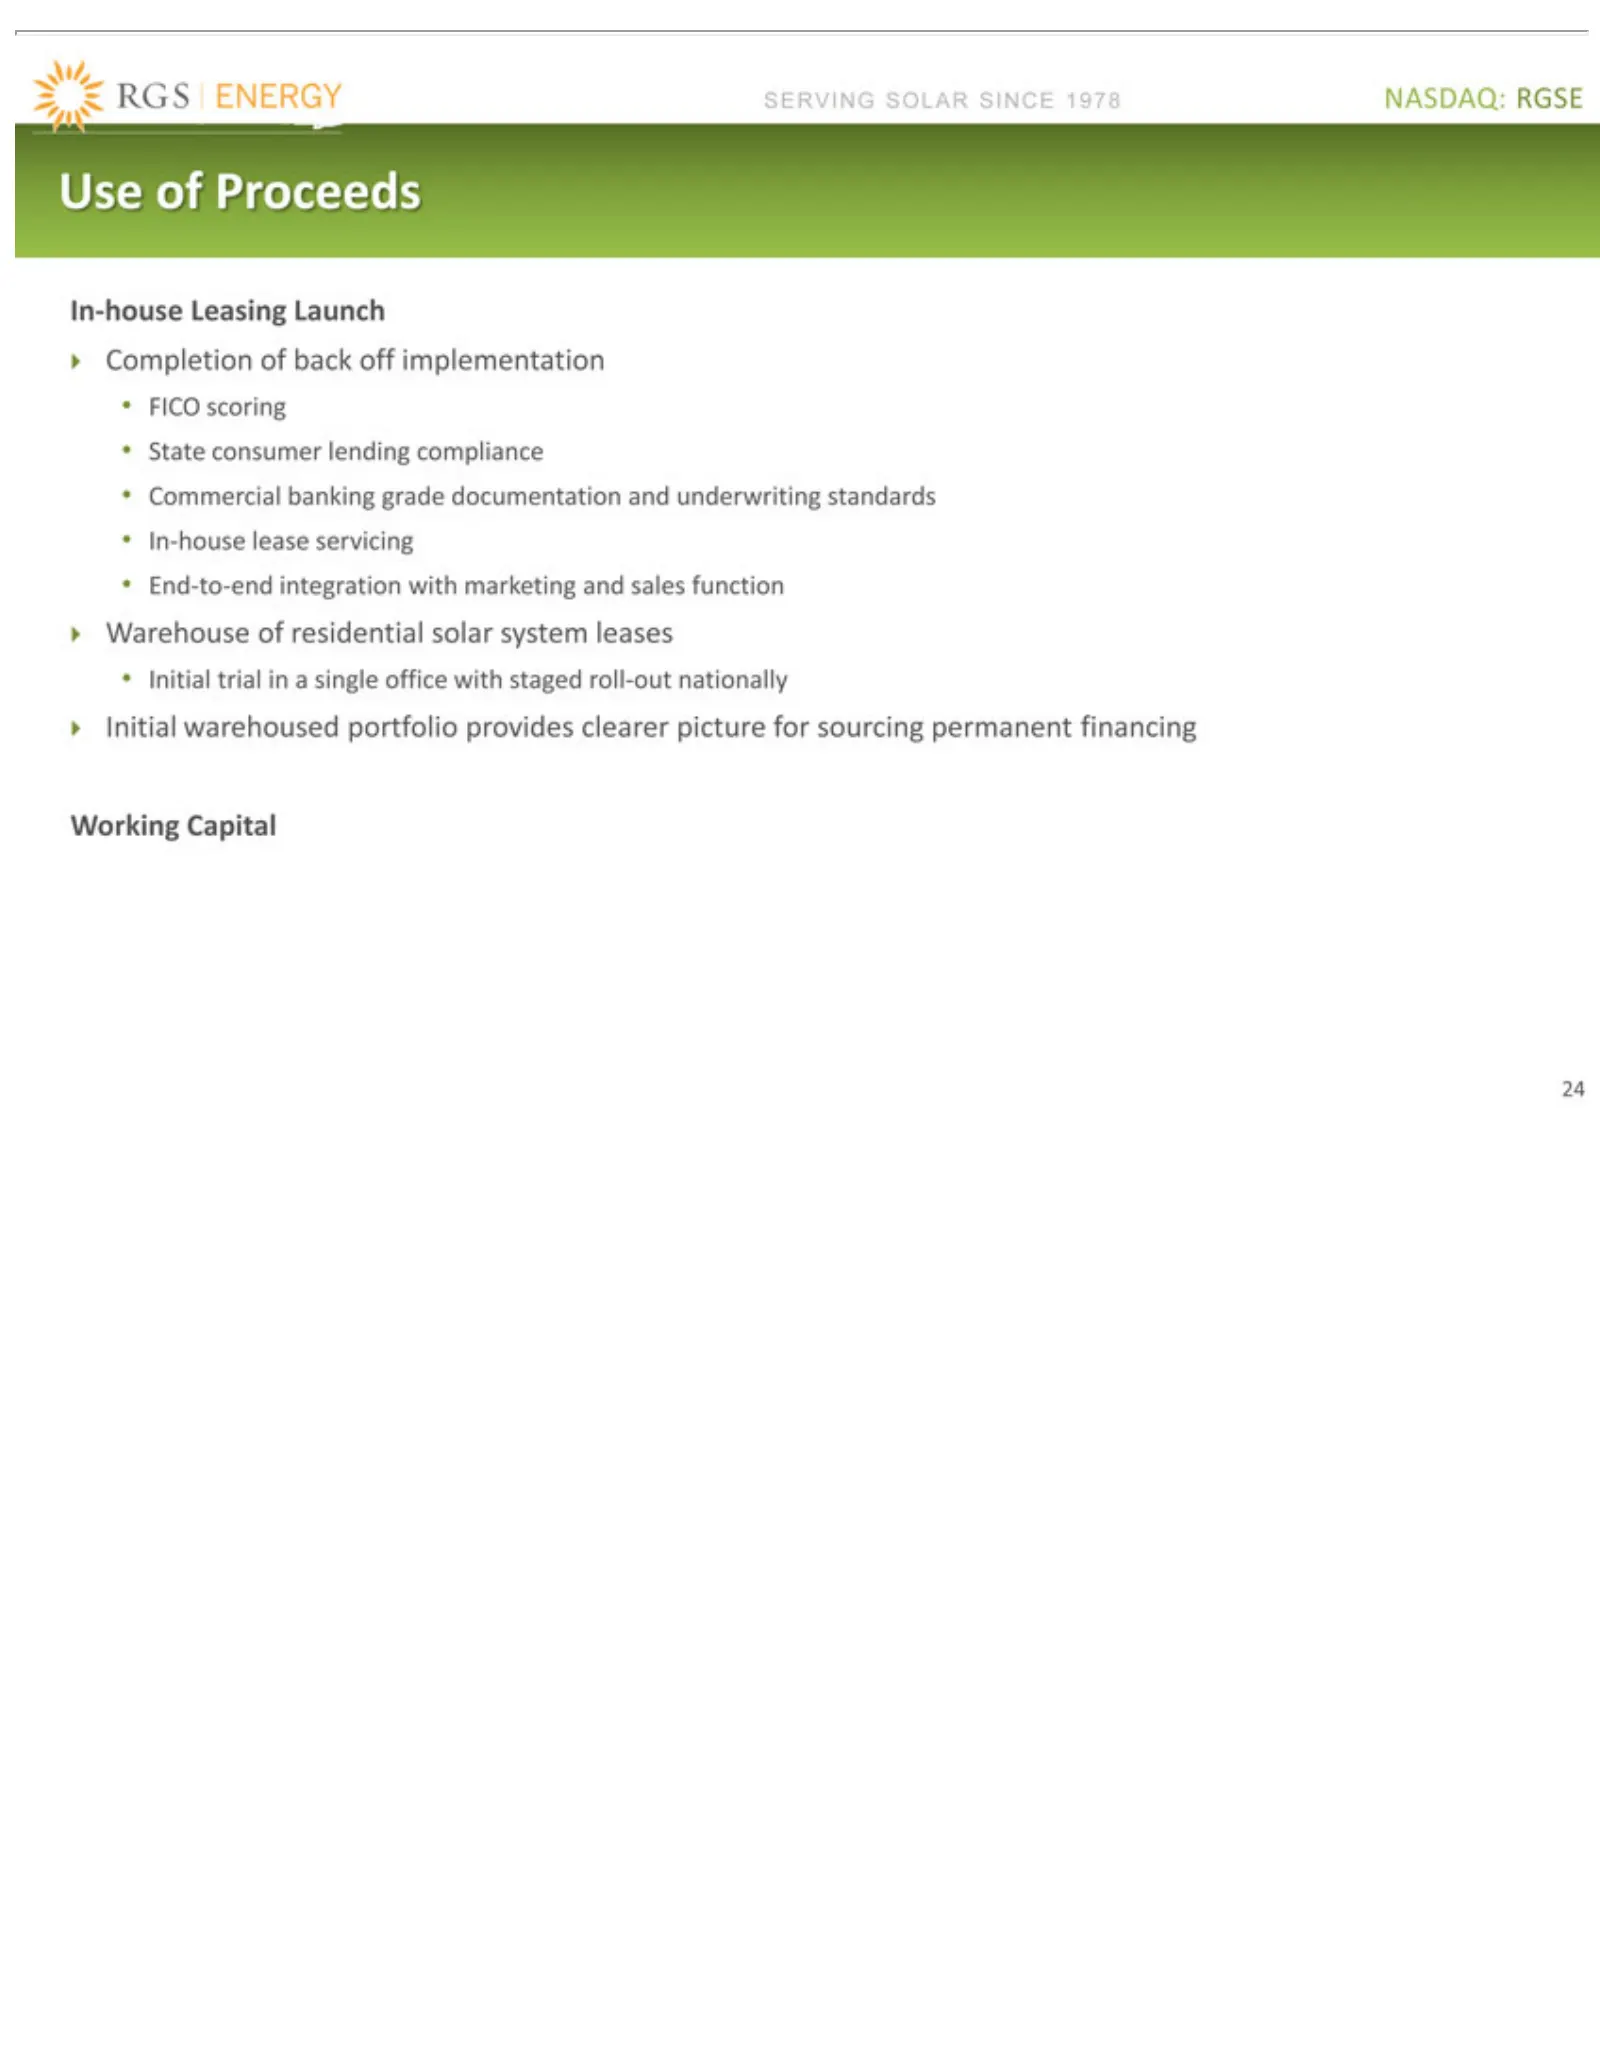
Slide 24: Use of Proceeds
NASDAQ: SERVING Use ?Completion FICO State Commercial In-house End-to-end ?Warehouse Initial ?Initial Working 24 ofconsumer scoring trial Proceeds warehoused Capital Leasing lease in SOLAR RGSE integration of banking of aservicing residential single lending back Launch SINCE portfolio off grade offi
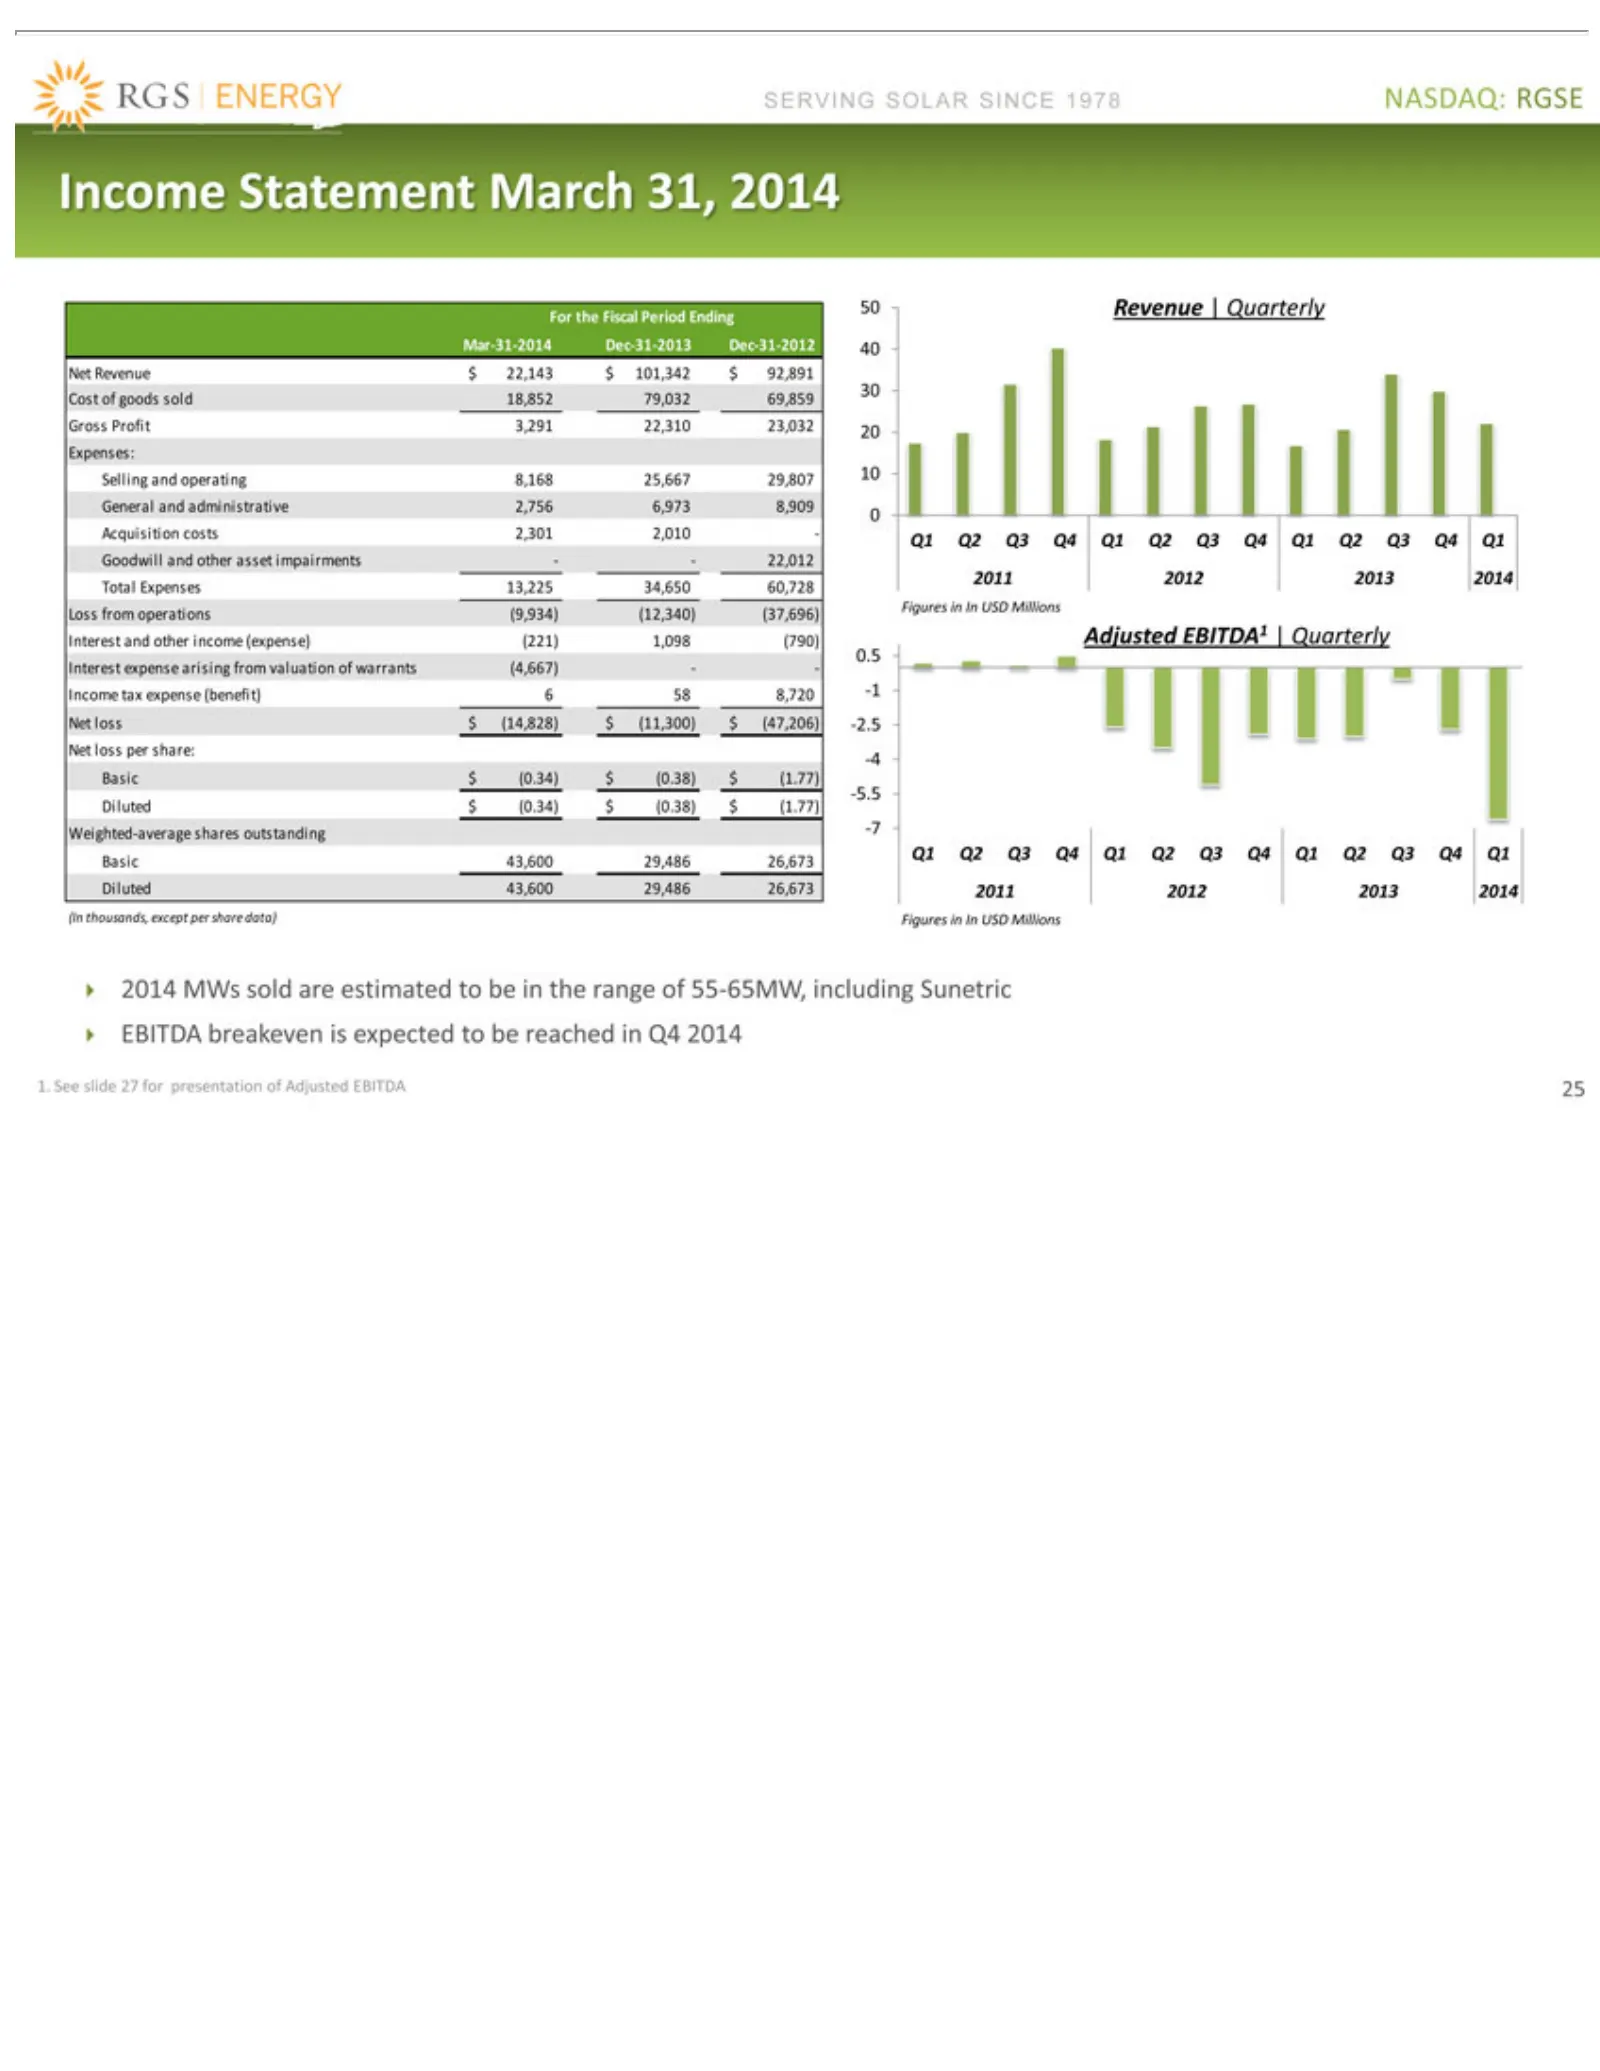
Slide 25: Income Statement and Adjusted EBITDA
NASDAQ: SERVING Income For Mar-31-2014 Net 6,973 $(expense) (In 50 40 Adjusted 0.5 Q1 2011 Figures 2014 1. 25 (0.38) See Revenue 30 thousands, Q2 -1 the Revenue 2012 MWs 8,909 20 -2.5 slide Q3 Fiscal Statement in $10 EBITDA1 (221) (1.77) In -4 Q4 2013 SOLAR RGSE sold 27 Acquisition |0USD $Quarterly
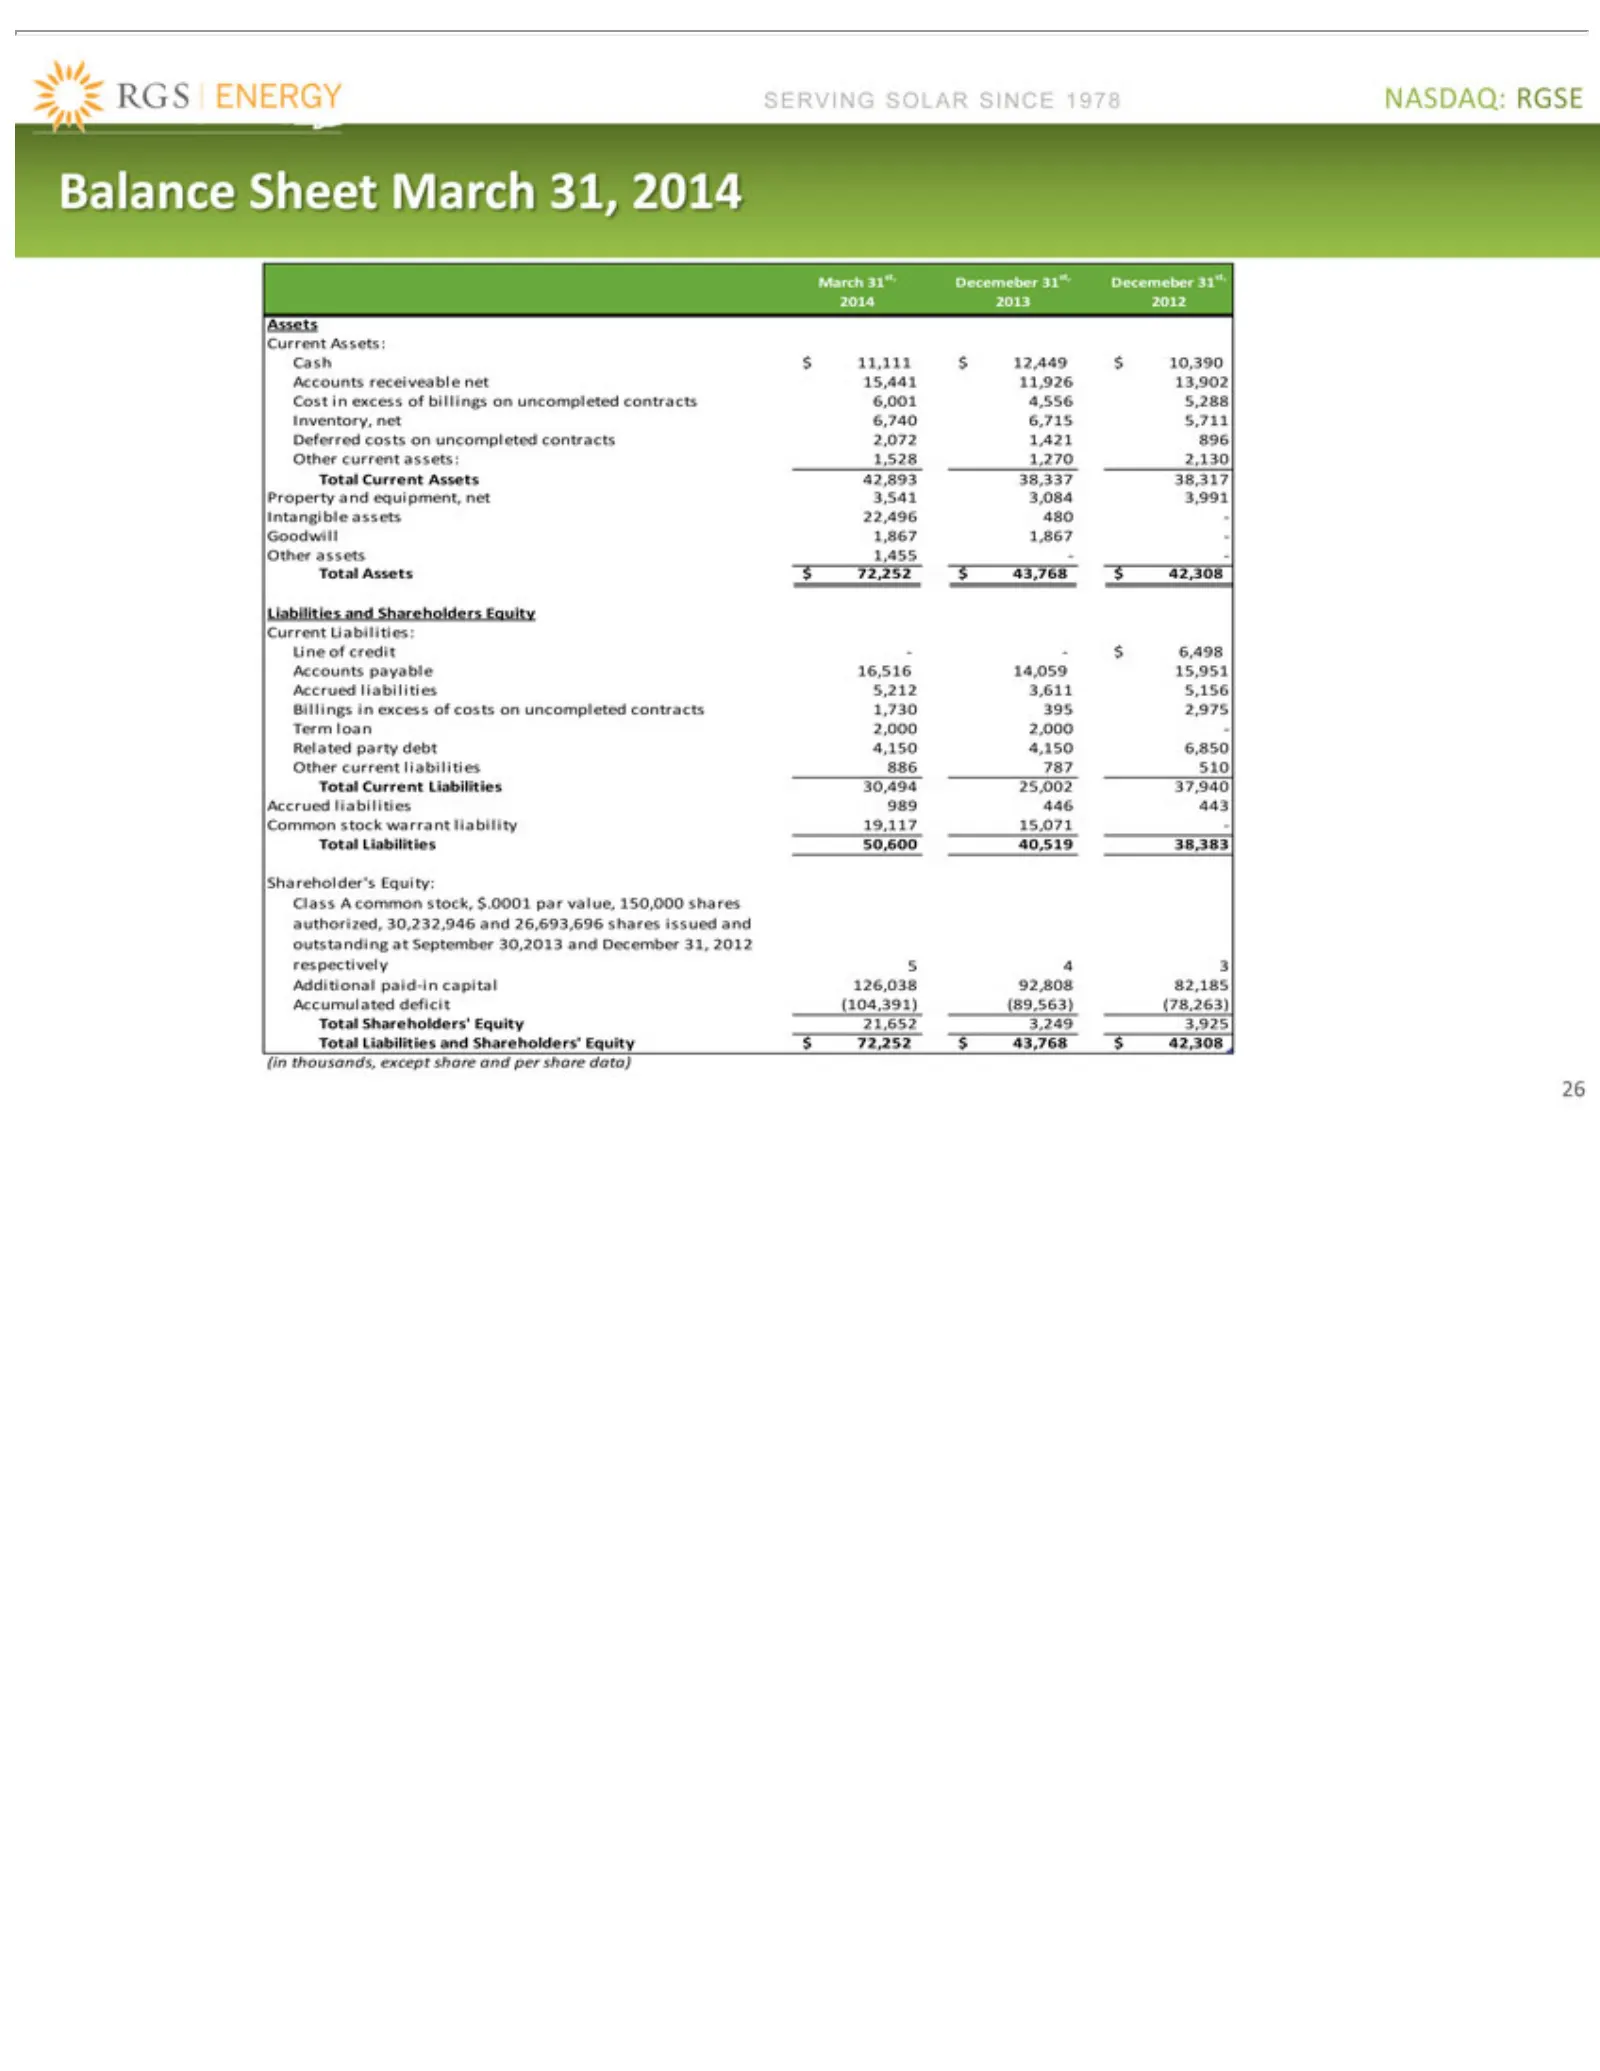
Slide 26: Balance Sheet
NASDAQ: SERVING Balance March Assets Cash uncompleted Liabilities Current Line party Shareholder’s Class paid-in Total (in 26 thousands, of Assets $Shareholders’ Current Liabilities debt A31st, 11,111 capital credit Assets: common Liabilities: Sheet 4,150 and SOLAR RGSE Decemeber $contracts Assets L
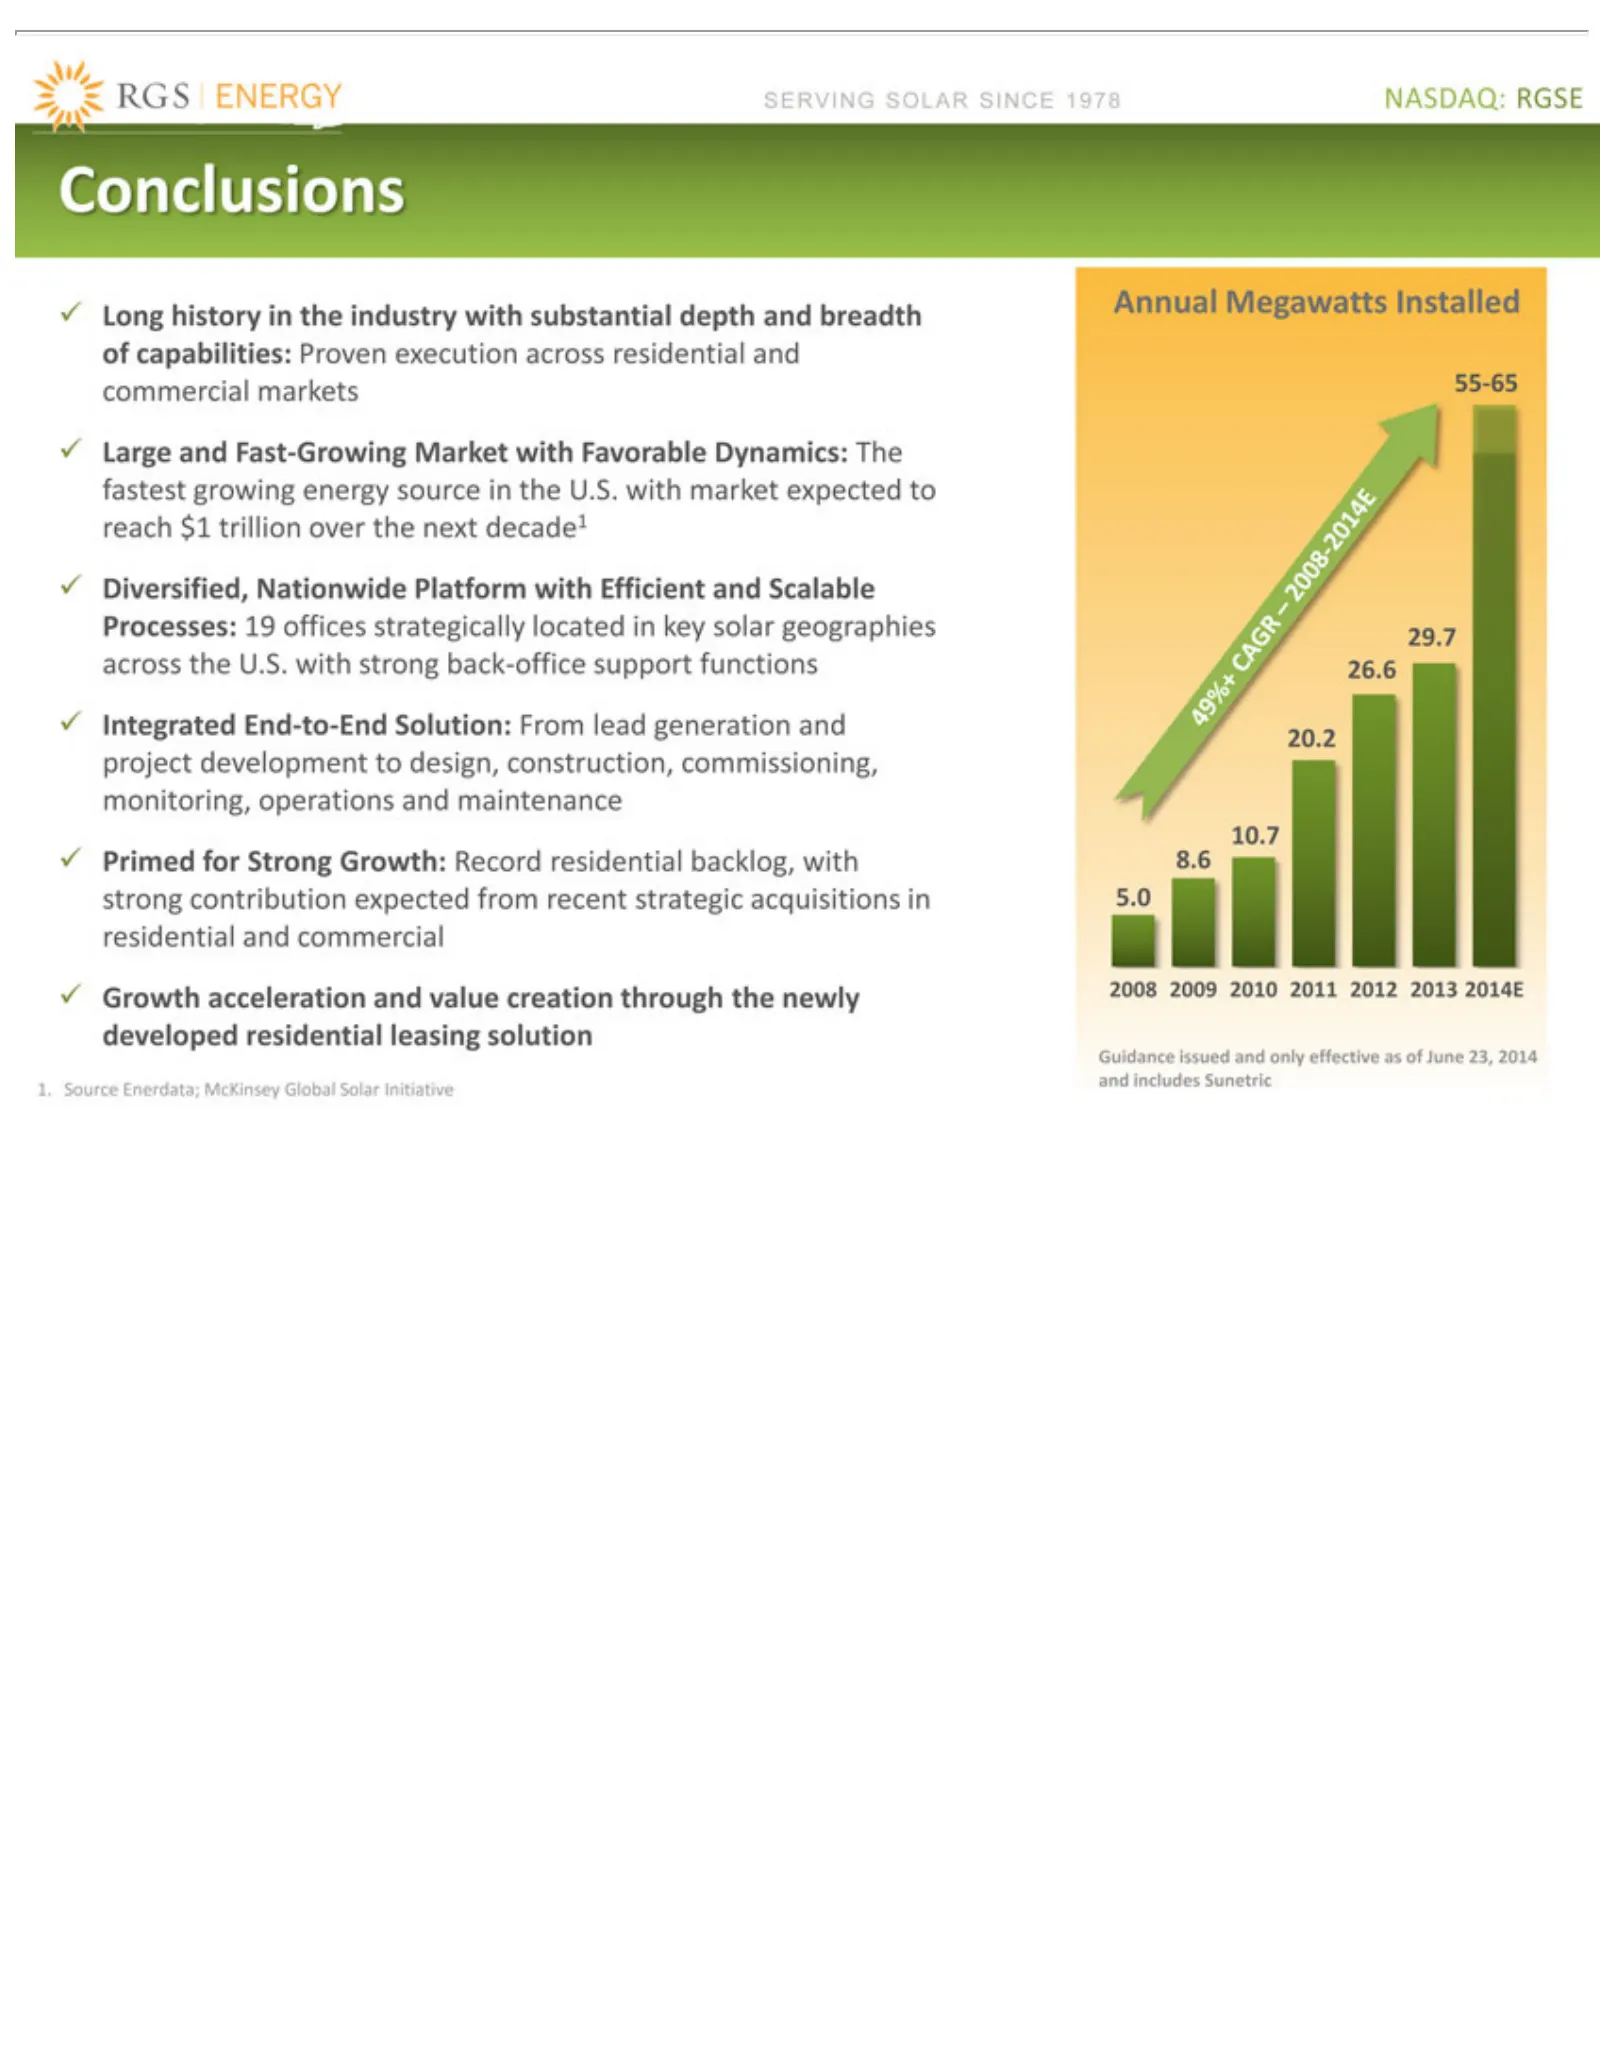
Slide 27: Conclusions
NASDAQ: SERVING Conclusions ?Long ?Large ?Diversified, ?Integrated ?Primed ?Growth 1.Source 49%+ Annual 2014E 2013 2012 2011 2010 2009 2008 55-65 29.7 26.6 20.2 10.7 8.6 5.0 Guidance CAGR-2008-2014E history and Megawatts for acceleration Enerdata; issued SOLAR RGSE Fast-Growing End-to-End Strong Nat
Slide 28: Appendix
SERVING SOLAR NASDAQ: 28 Appendix RGSE SINCE 1978
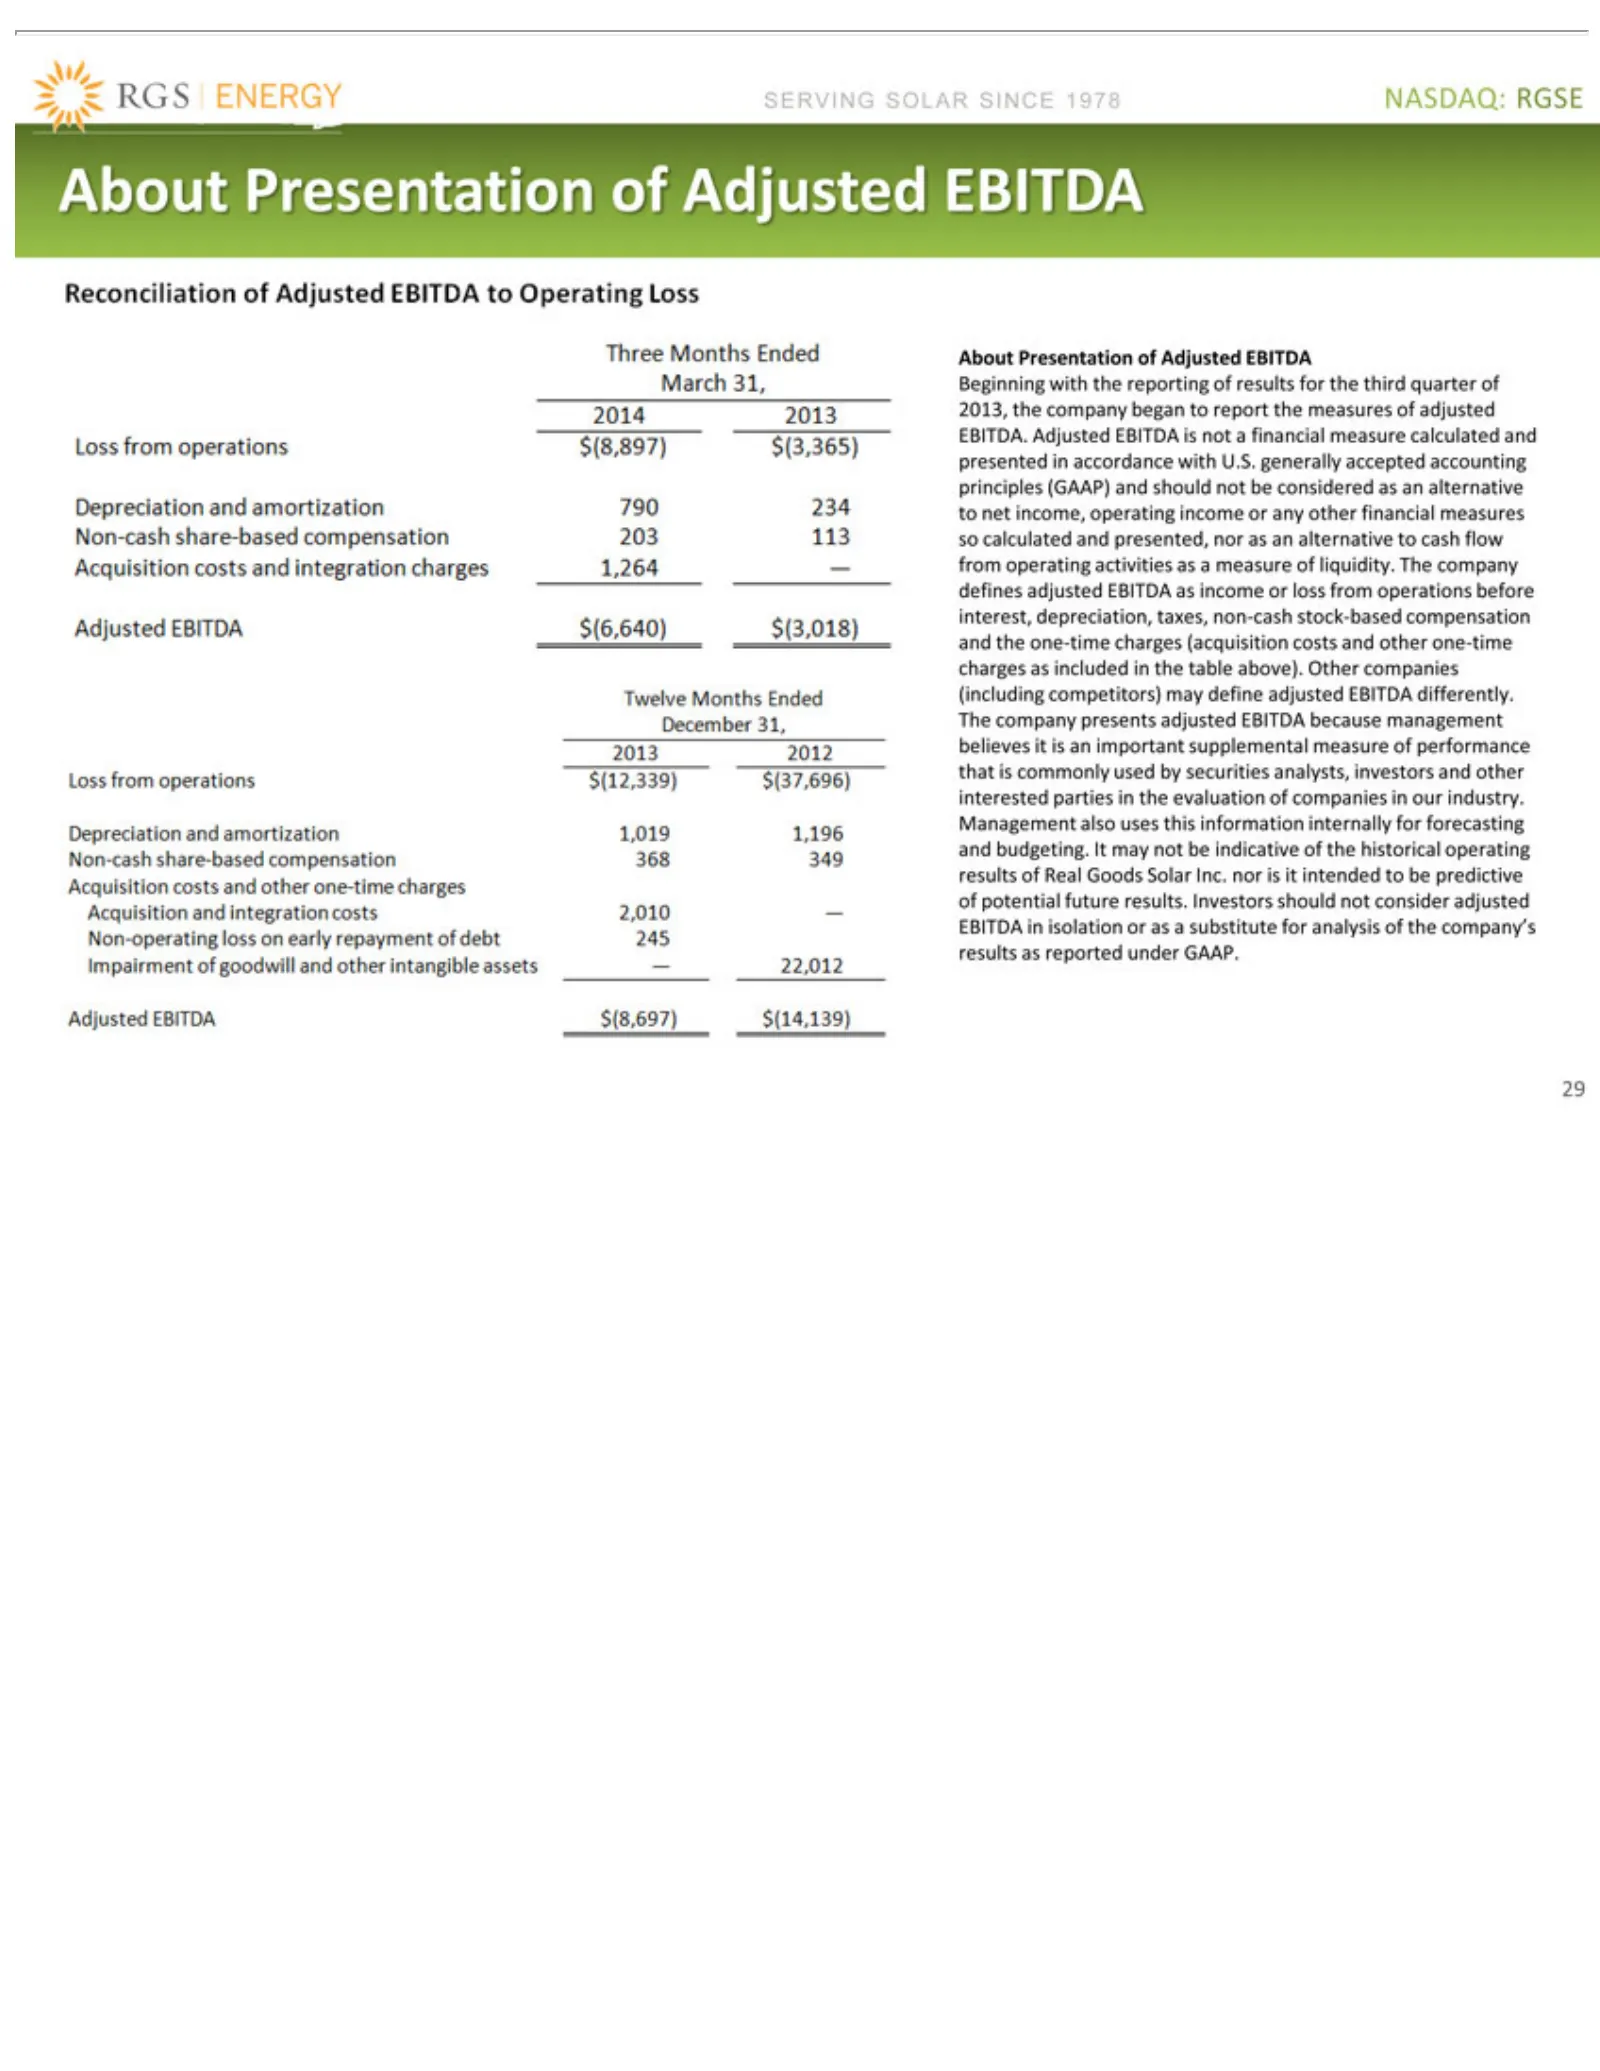
Slide 29: About Non-GAAP Financial Measures
NASDAQ: SERVING About financial other operations (including commonly amay 29 substitute not financial Presentation be measure competitors) before SOLAR used indicative RGSE for measures analysis byinterest, calculated securities of SINCE of Adjusted may of the sodepreciation, the calculated 1978 his
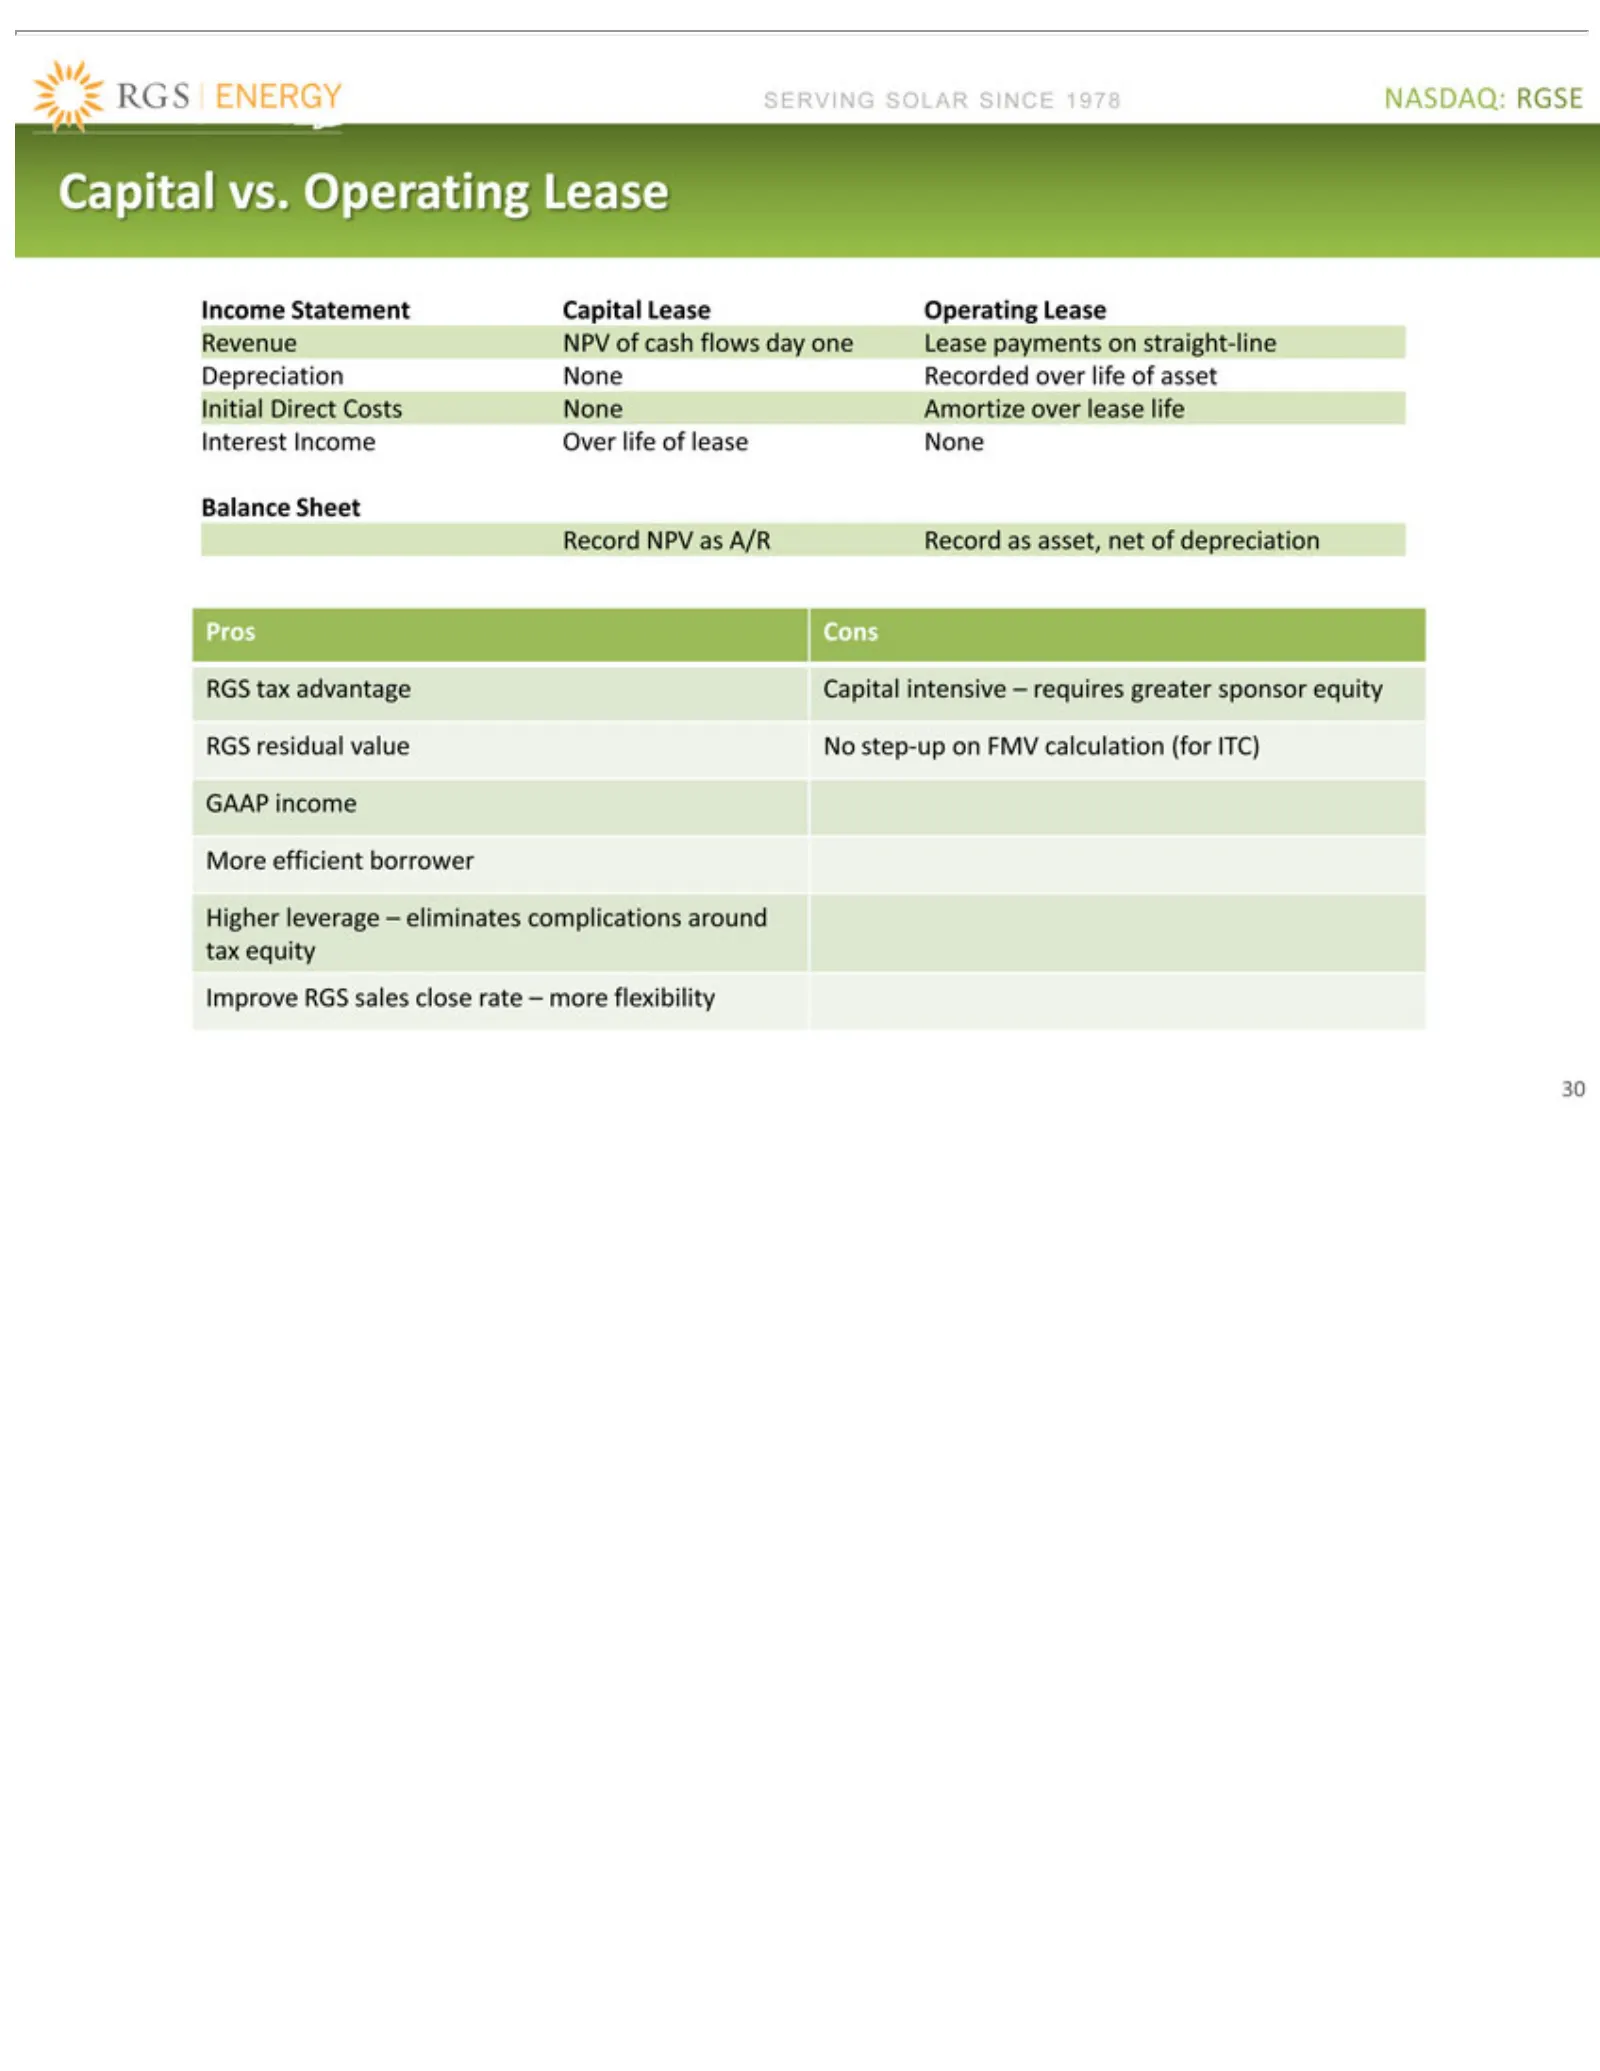
Slide 30: Income Statement and Lease Accounting Comparison
NASDAQ: SERVING Income Operating NPV Revenue Lease Recorded Depreciation Initial Amortize Interest Over Balance None Record Cons Pros Capital RGS No GAAP More Higher Improve 30 step-up tax residual of life efficient payments Direct income leverage NPV as vs. Lease intensive Statement Income cash She
Source: SEC EDGAR · 8-K filed Jul 3, 2014
More decks from Real Goods Solar Inc
 NIBA NY Conference November 201915 slides · November 2019
 Reg A Offering (November 2019)18 slides · November 2019
 Investor Presentation (September 2019)17 slides · Sep 5, 2019
 Investor Presentation (May 2019)12 slides · May 15, 2019
 Investor Presentation (October 2018)17 slides · Oct 1, 2018
 Investor Presentation (September 2018)17 slides · Sep 12, 2018