Rand Logistics — BB&T Capital Markets Transportation Conference 2011
19 slides from Rand Logistics's conference presentation, Feb 17, 2011
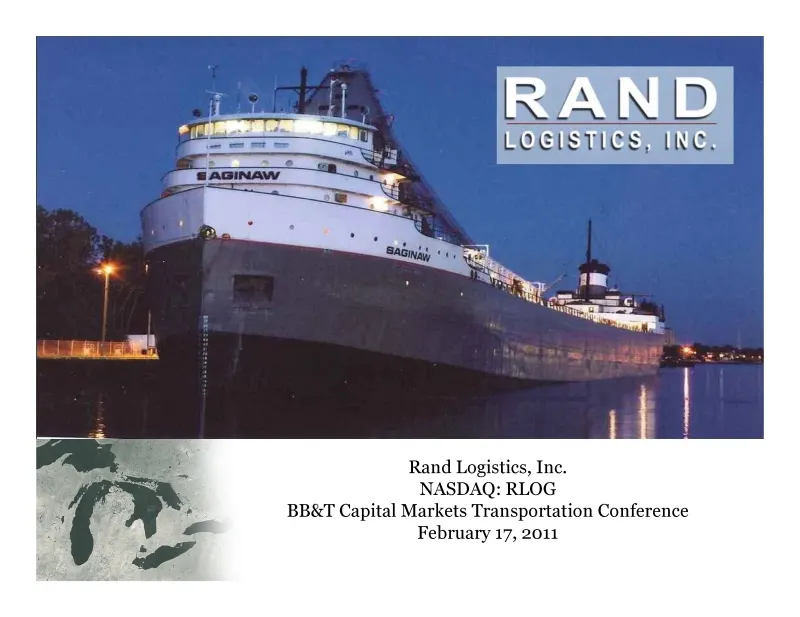
Slide 1: Rand Logistics, Inc.
Rand Logistics, Inc. NASDAQ: RLOG BB&T Capital Markets Transportation Conference February 17, 2011
Slide 2: Forward-looking statements
This presentation contains forward-looking statements. For all forward-looking statements, we claim the protection of the Safe Harbor for Forward-Looking Statements contained in the Private Securities Litigation Reform Act of 1995. Forward-looking statements are inherently subject to risks and uncer
Slide 3: Introduction
Introduction « Laurence S. Levy, Chairman & Chief Executive Officer Chairman of Hyde Park Holdings, an investment firm specializing in private equity investments since 1986 History of acquiring and building businesses, primarily in the logistics and infrastructure markets + Edward Levy, President 9
Slide 4: Company Overview
Company Overview + Leading provider of dry bulk commodities freight shipping services throughout the Great Lakes * Over 95% of business under long-term contract insulates from any significant pricing pressure = High barriers to entry + Increasing market share, due to cost-efficient operating model,
Slide 5: Favorable Asset Mix
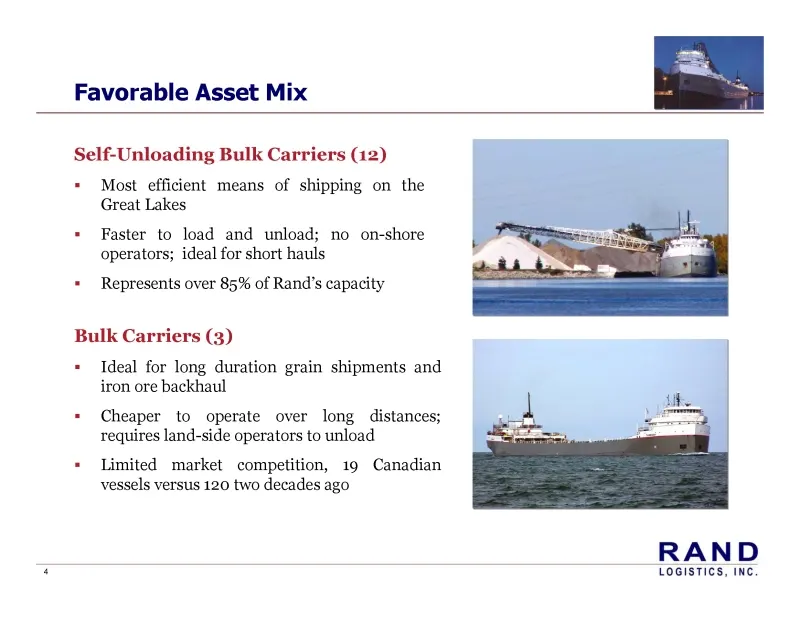
Favorable Asset Mix Self-Unloading Bulk Carriers (12) + Most efficient means of shipping on the Great Lakes + Faster to load and unload; no on-shore operators; ideal for short hauls + Represents over 85% of Rand’s capacity Bulk Carriers (3) + Ideal for long duration grain shipments and iron ore back
Slide 6: High Barriers to Entry
High Barriers to Entry = Jones Act Limits competition to domestically constructed vessels and local operators = Jones Act Compliant New Builds Not Economically Feasible Current freight rates and construction costs do not justify investment Last self-propelled Great Lakes vessel built 20 years ago Fr
Slide 7: Favorable Market Demand Imbalance
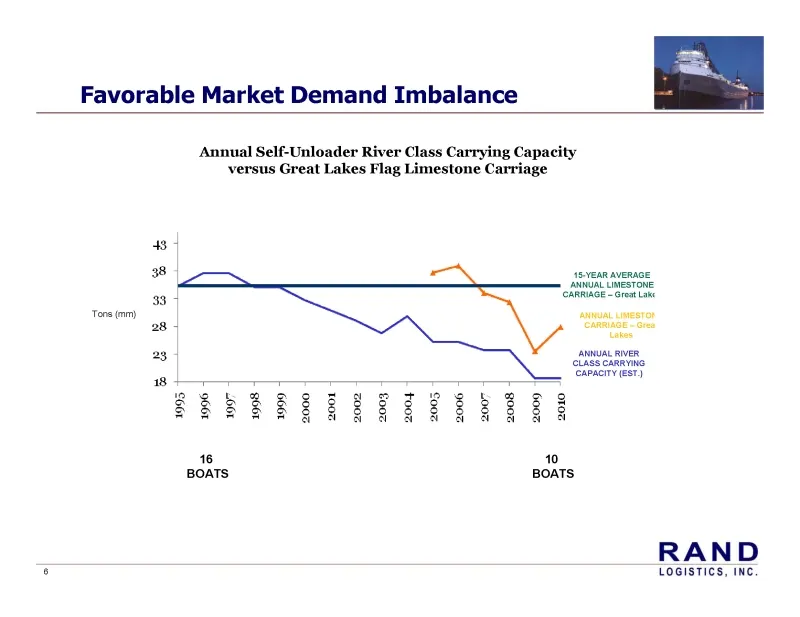
Favorable Market Demand Imbalance Annual Self-Unloader River Class Carrying Capacity versus Great Lakes Flag Limestone Carriage s! 38 {S-YEAR AVERAGE af eee eas a papal 28 oes 3 nese 1995 1996 1997 1998, 1999 2000 2001 2002 2003 2004 2005 2006 2007 2008 2009 2010 16 10 BOATS BOATS RAND LOGISTICS, IN
Slide 8: Leading Self-Unloader Market Share
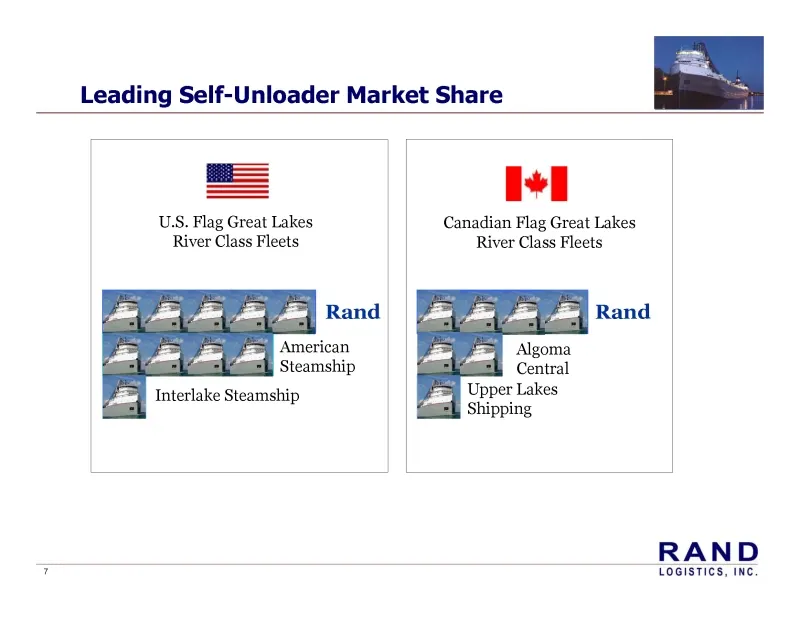
Leading Self-Unloader Market Share USS. Flag Great Lakes River Class Fleets FF american AE AE AE ah Steamship i+] Canadian Flag Great Lakes River Class Fleets Upper Lakes Shipping RAND LOGISTICS, INC
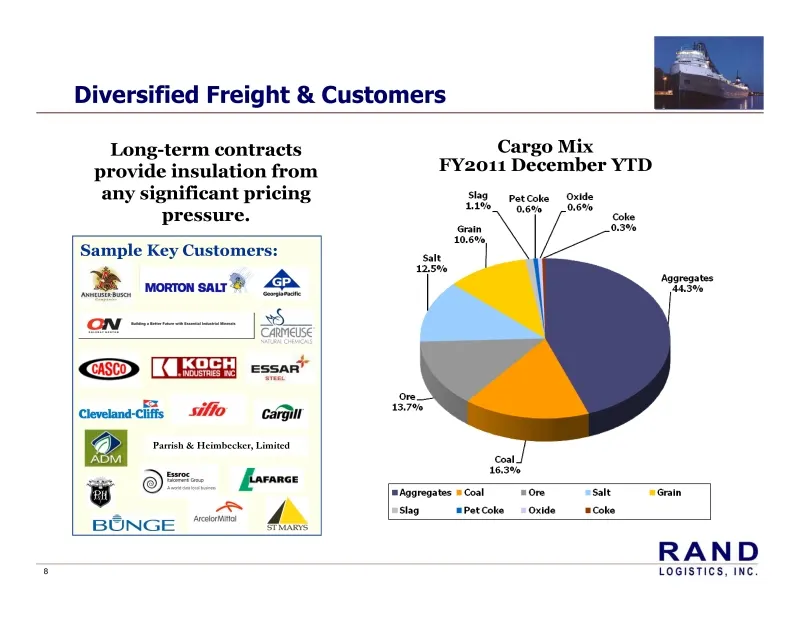
Slide 9: Diversified Freight & Customers
Diversified Freight & Customers Long-term contracts Cargo Mix provide insulation from FY2011 December YTD any significant pricing Sieg petcohe Orde 2% "Og 0.5% pressure. Coke Grain 03% 10.8% Sample Key Customers: moron sarr® 4 ‘ree ON = GSD EGE escent Clevelana-chits Mo carr Parrish & Heimbecker, Li
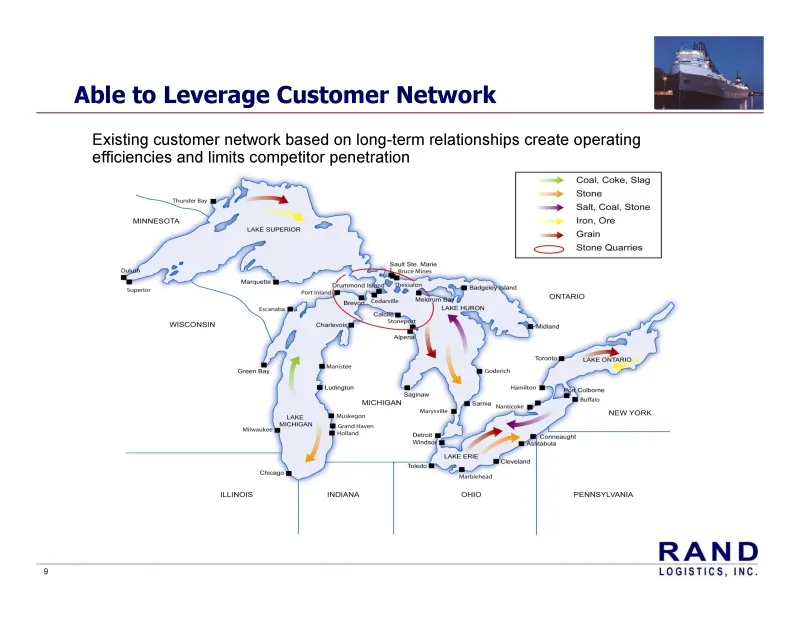
Slide 10: Able to Leverage Customer Network
Able to Leverage Customer Network Existing customer network based on long-term relationships create operating efficiencies and limits competitor penetration coat. Cove, Sieg > stone > Salt, Coat, stone > ron, Ore > Gain Stone Quarries RAND Logistics, INC.
Slide 11: Financial Review
Financial Review
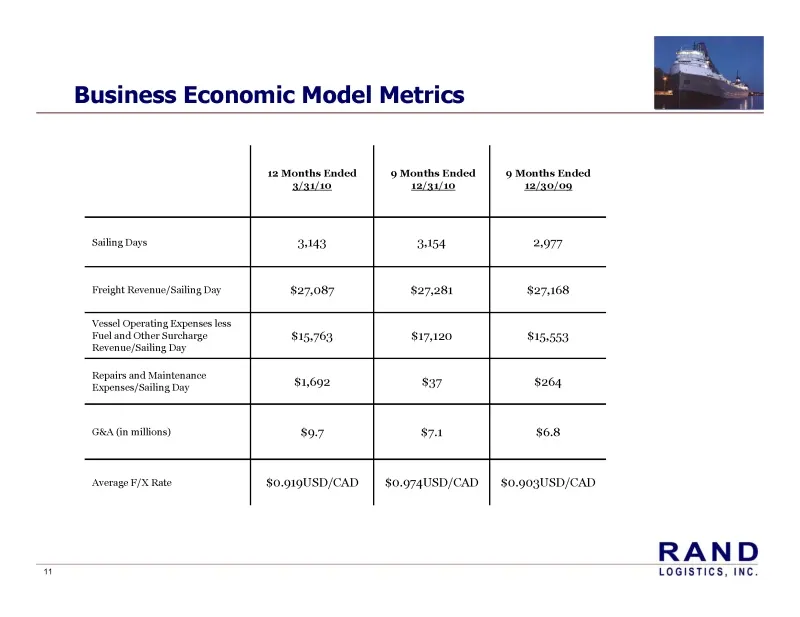
Slide 12: Business Economic Model Metrics
Business Economic Model Metrics 142 Months Ended ‘9 Months Ended ‘s/silio 12/30/00 Sailing Days 3143 354 2.077 roight Revenne/Sailing Day $27,087 $27,281 $27,168 ‘Vessel Operating Expenses less Fuel and Other Surcharge 815,763 $17,120 815,553 Revenue/Sailing Day Repairs and Maintenance $1,602 $37 $2
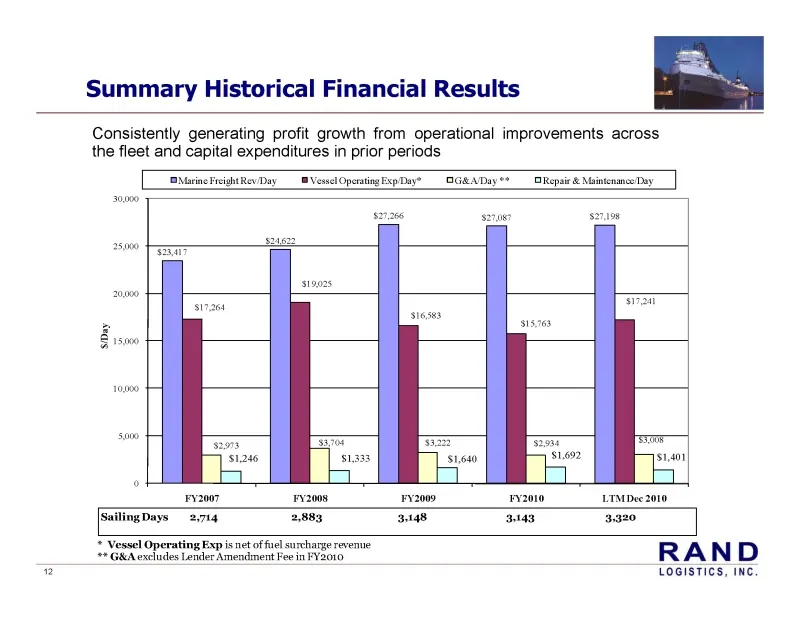
Slide 13: Summary Historical Financial Results
Summary Historical Financial Results @ Consistently generating profit growth from operational improvements across the fleet and capital expenditures in prior periods ‘BhirncFsighiRevDay Vou Opanting pay? GRAD)" __ORepar & Naicnmes ay sree sonst sme 20100 sinaee aH 16388 2 sian Ei s000 10900 00 = ri]
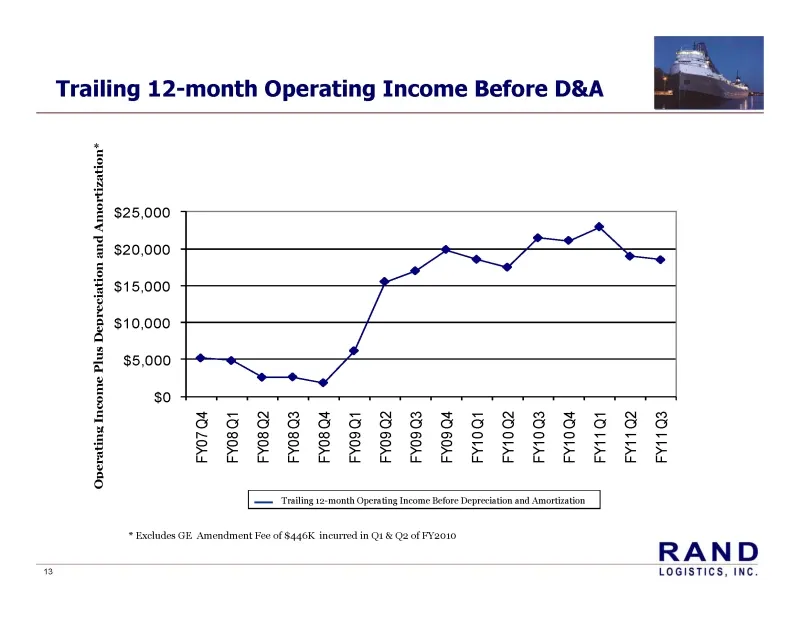
Slide 14: Trailing 12 Month Operating Income Before D&A
4 3 2 Ej a B ing 3 3 3 ao & ° 3 2 A] [=4 5 a = 5 a 8 3 ® & cy 6 z e 5 k E 25,000 5 825, 3 = $20,000 g g st5000 g 810.000 4 ss00 [> 4 £ 5 $0 7 S$S5S8S8S6S5S8S5ESEES 4 ssssesgsgssgeeee2er t EEC EEE EEEEEE é — Trllng 12 month Operating Income Hefore Depreciation and Amortization + Hxcludes GE Amendment
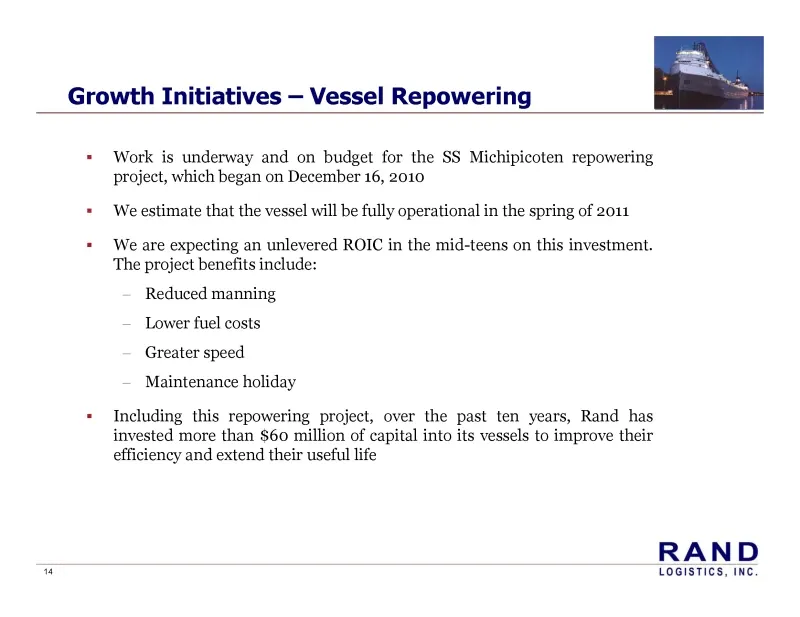
Slide 15: Growth Initiatives — Vessel Repowering
Growth Initiatives — Vessel Repowering Work is underway and on budget for the S$ Michipicoten repowering project, which began on December 16, 2010 We estimate that the vessel will be fully operational in the spring of 2011 We are expecting an unlevered ROIC in the mid-teens on this investment. The p
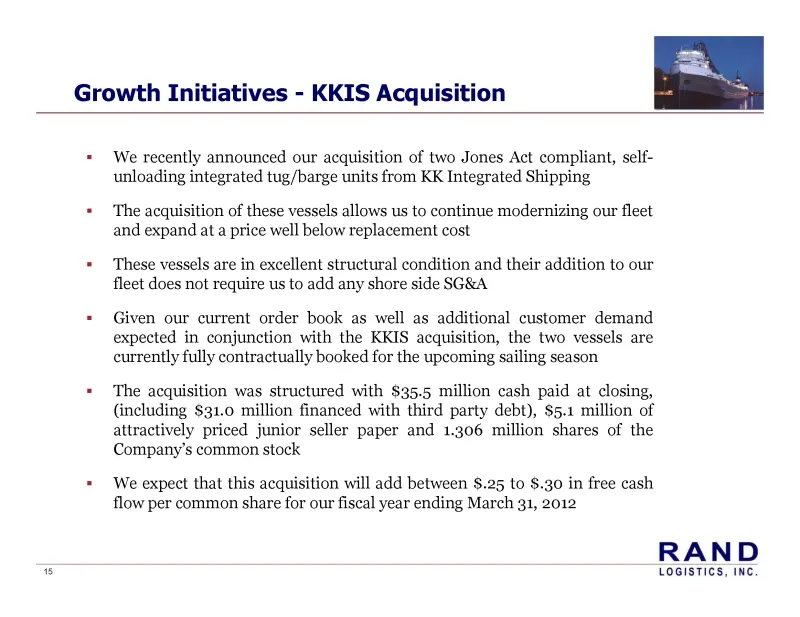
Slide 16: Growth Initiatives - KKIS Acquisition
Growth Initiatives - KKIS Acquisition © + We recently announced our acquisition of two Jones Act compliant, self- unloading integrated tug/barge units from KK Integrated Shipping « The acquisition of these vessels allows us to continue modernizing our fleet and expand at a price well below replaceme
Slide 17: Fiscal Year 2012 Earnings Outlook
Fiscal Year 2012 Earnings Outlook 6 + The highly strategic KKIS acquisition and our vessel repowering will allow us to optimize the utilization of our entire fleet and better serve the needs of our customer network + Projecting that operating income plus depreciation and amortization will be between
Slide 18: FY 2012 Projections
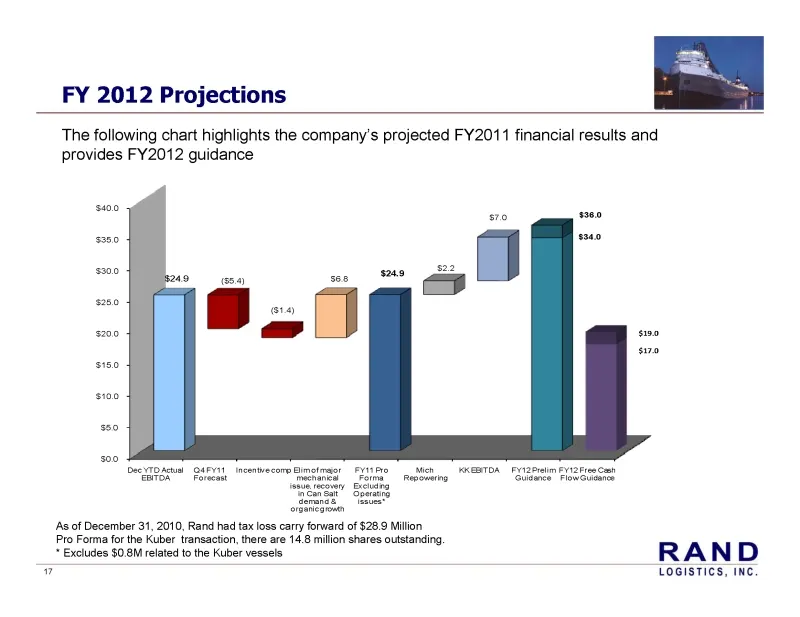
FY 2012 Projections The following chart highlights the company's projected FY2011 financial results and provides FY2012 guidance ‘As of December 31, 2010, Rand had tax loss carry forward of $28.9 Milion Pro Forma for the Kuber transaction, there are 14.8 milion shares outstanding * Excludes $0 6M re
Slide 19: Capital Structure
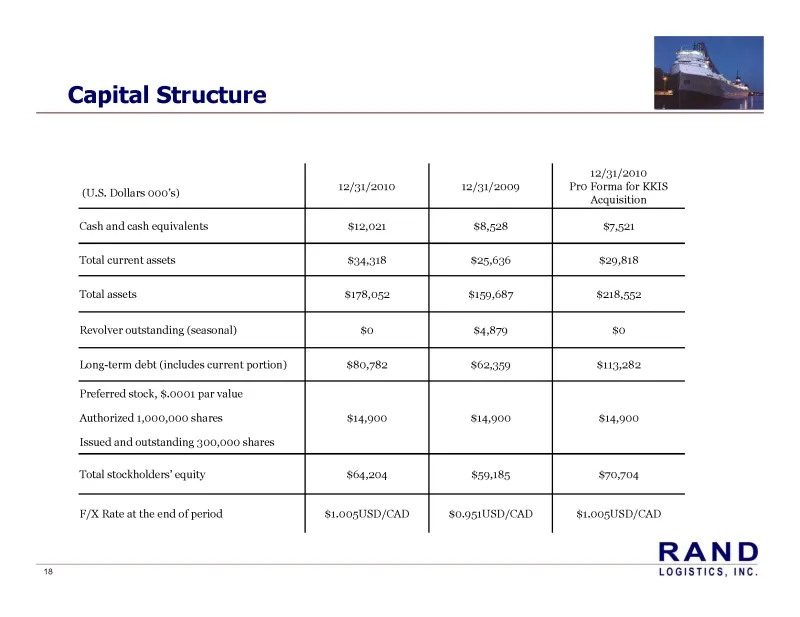
Capital Structure we 12/31/2010 (US. Dollars 00's) 12/31/2010 2/31/2009 ro Forma for KKIS Acquisition Cash and cash equivalents $12,028 $8,528 $7521 ‘Total current assets $34,318 $25,636 $20,818 Total assets 178,052 $159,687 s218,552 Revolver outstanding (seasonal) 80 $4,879 80 Long-term debt (inclu
Source: SEC EDGAR · 8-K filed Feb 17, 2011
More decks from Rand Logistics Inc
 Q1 FY2016 Earnings Presentation16 slides · Aug 7, 2015
 FY2015 Earnings Presentation15 slides · Jun 11, 2015
 Q3 FY2015 Earnings Presentation20 slides · Feb 10, 2015
 Q3 FY2015 Earnings Presentation18 slides · Feb 5, 2015
 Q2 FY2015 Earnings Presentation19 slides · Nov 6, 2014
 Proxy Contest (September 2014)35 slides · Sep 8, 2014