Altra Industrial Motion — Q4 2018 Earnings Presentation
15 slides from Altra Industrial Motion's earnings presentation, Feb 21, 2019
Slide 1: Fourth-Quarter 2018 Results
Fourth-Quarter 2018 Results February 21, 2019 Exhibit 99.2
Slide 2: Q4 2018 Conference Call Details
Q4 2018 Conference Call Details Live Webcast February 21, 2019 10:00 AM ET Dial In Number 877-407-8293 Domestic 201-689-8349 International Webcast at www.altramotion.com Replay Through March 7, 2019 877-660-6853 Domestic 201-612-7415 International Conference ID: # 13687178 Webcast Replay at www.altr
Slide 3: Safe Harbor Statement
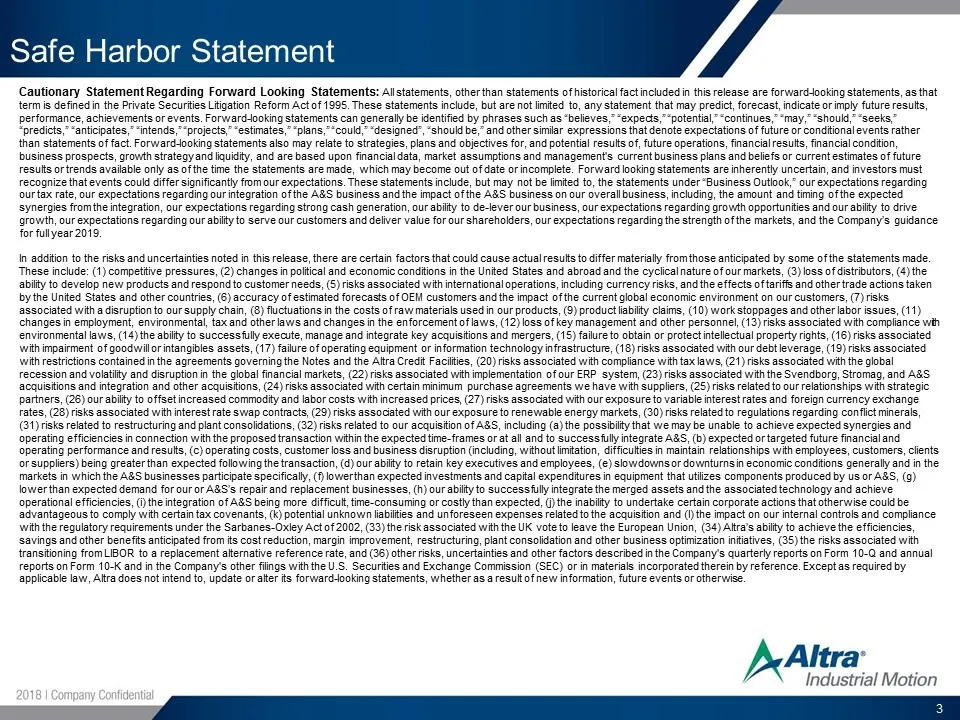
Safe Harbor Statement Cautionary Statement Regarding Forward Looking Statements: All statements, other than statements of historical fact included in this release are forward-looking statements, as that term is defined in the Private Securities Litigation Reform Act of 1995. These statements include
Slide 4: Agenda and Speakers
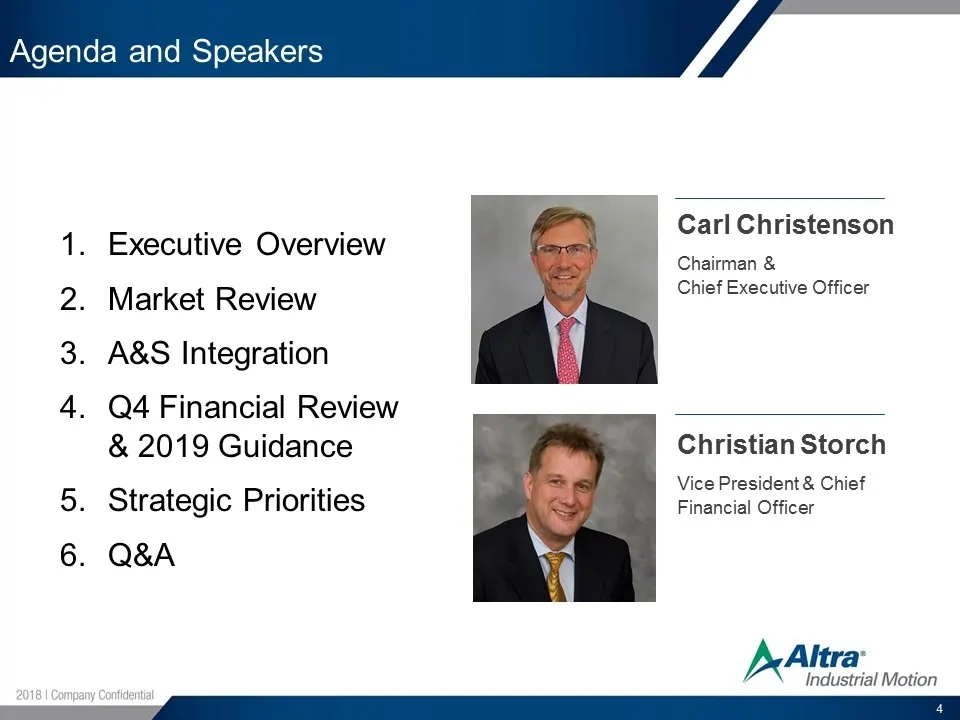
Agenda and Speakers Executive Overview Market Review A&S Integration Q4 Financial Review & 2019 Guidance Strategic Priorities Q&A Carl Christenson Chairman & Chief Executive Officer Christian Storch Vice President & Chief Financial Officer
Slide 5: 2018: A Transformational Year - Q4 2018 Financial Highlights
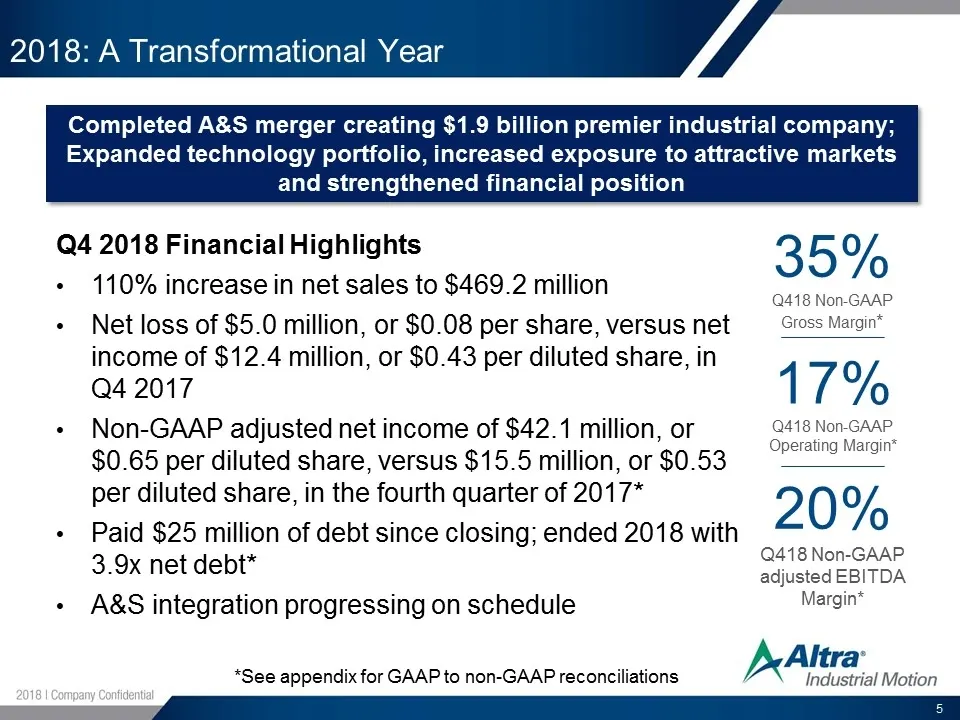
2018: A Transformational Year Q4 2018 Financial Highlights 110% increase in net sales to $469.2 million Net loss of $5.0 million, or $0.08 per share, versus net income of $12.4 million, or $0.43 per diluted share, in Q4 2017 Non-GAAP adjusted net income of $42.1 million, or $0.65 per diluted share,
Slide 6: A&S Integration Advancing Exceptionally Well
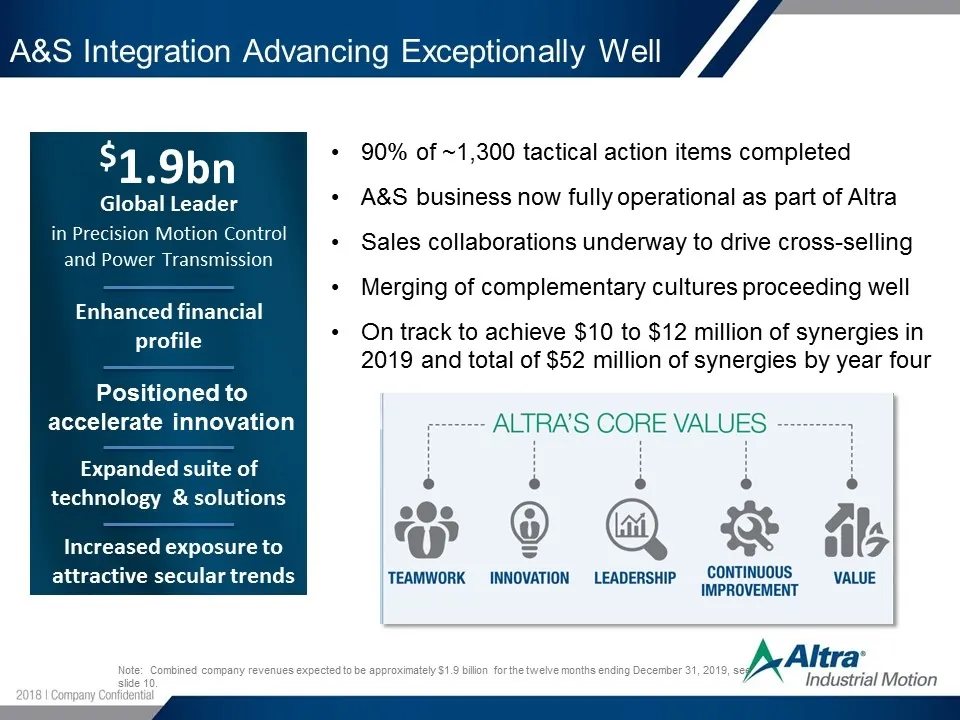
A&S Integration Advancing Exceptionally Well $1.9bn Enhanced financial profile Global Leader in Precision Motion Control and Power Transmission Expanded suite of technology & solutions Positioned to accelerate innovation Increased exposure to attractive secular trends 90% of ~1,300 tactical action i
Slide 7: Fourth-Quarter Key End-Market Drivers
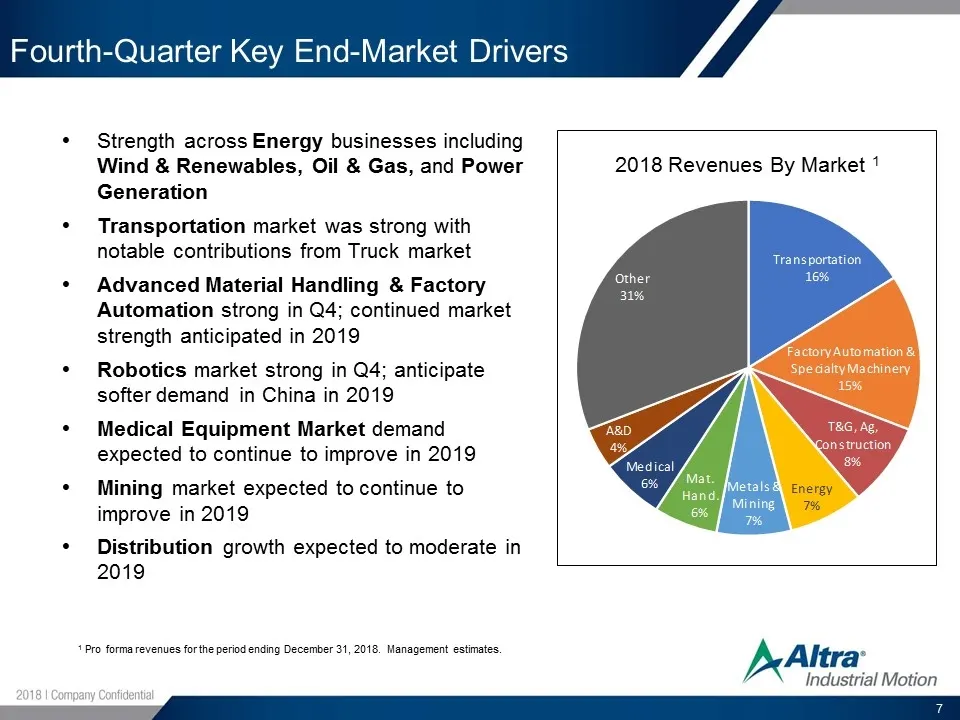
Fourth-Quarter Key End-Market Drivers Strength across Energy businesses including Wind & Renewables, Oil & Gas, and Power Generation Transportation market was strong with notable contributions from Truck market Advanced Material Handling & Factory Automation strong in Q4; continued market strength a
Slide 8: Q4 2018 Financial Highlights
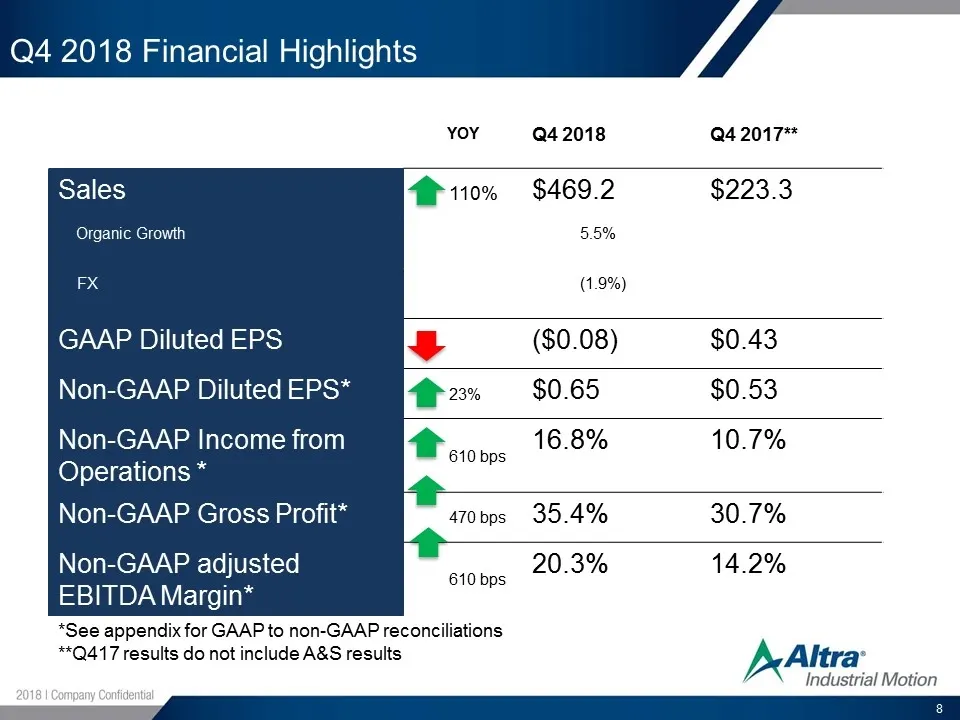
Q4 2018 Financial Highlights YOY Q4 2018 Q4 2017** Sales 110% $469.2 $223.3 Organic Growth 5.5% FX (1.9%) GAAP Diluted EPS ($0.08) $0.43 Non-GAAP Diluted EPS* 23% $0.65 $0.53 Non-GAAP Income from Operations * 610 bps 16.8% 10.7% Non-GAAP Gross Profit* 470 bps 35.4% 30.7% Non-GAAP adjusted EBITDA Mar
Slide 9: Balance Sheet Highlights
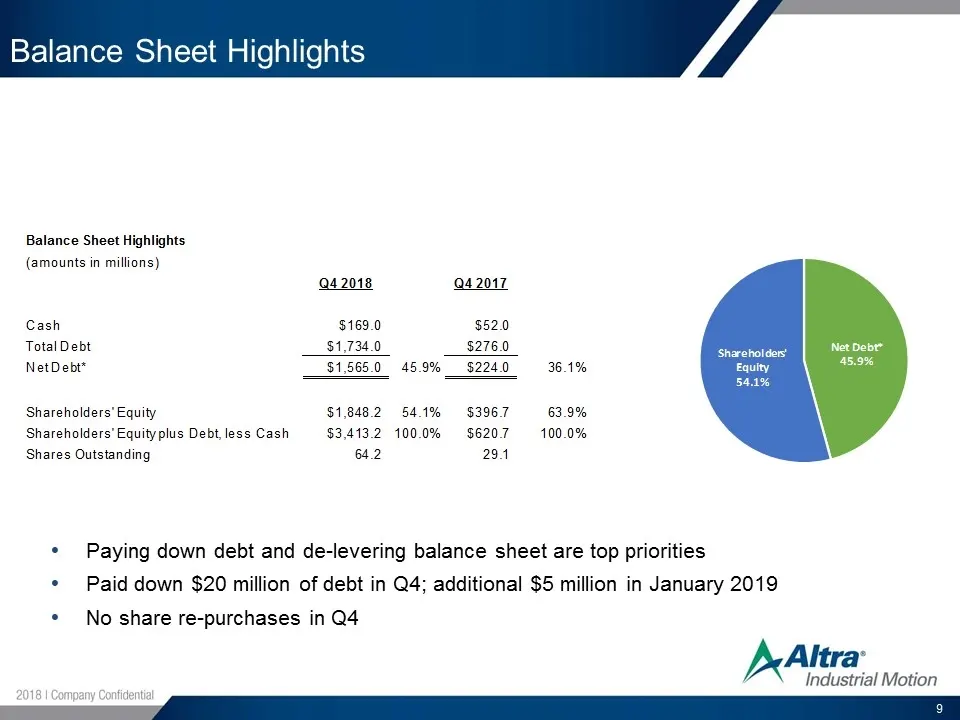
Balance Sheet Highlights Paying down debt and de-levering balance sheet are top priorities Paid down $20 million of debt in Q4; additional $5 million in January 2019 No share re-purchases in Q4 Balance Sheet Highlights (amounts in millions) Cash Total Debt Net Debt* Shareholders’ Equity Shareholders
Slide 10: 2019 Guidance: Continued Sales and Earnings Growth
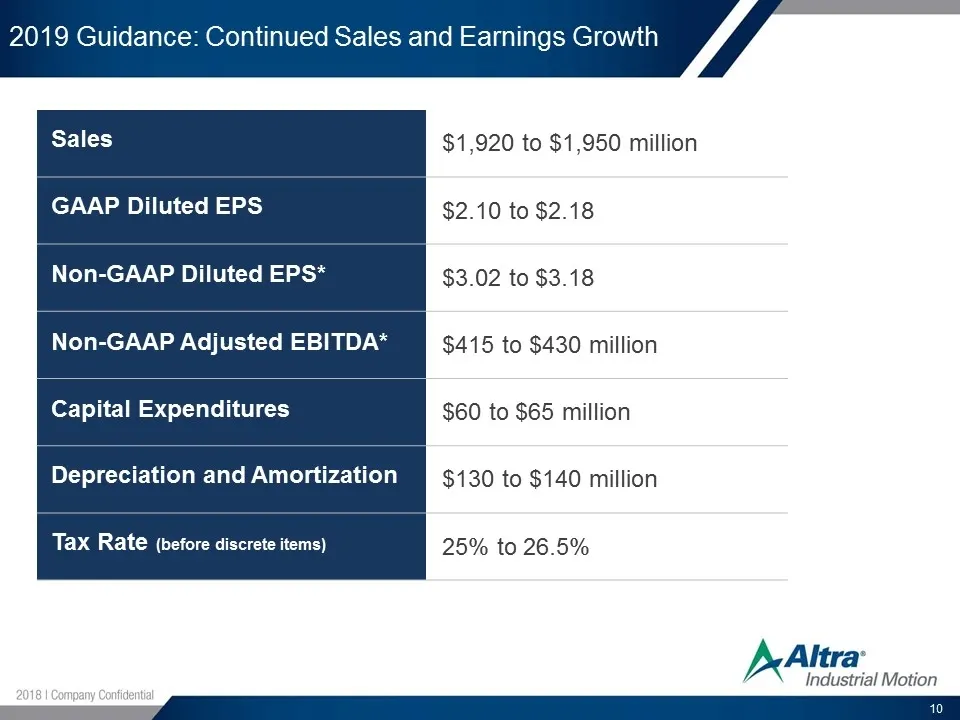
2019 Guidance: Continued Sales and Earnings Growth Sales $1,920 to $1,950 million GAAP Diluted EPS $2.10 to $2.18 Non-GAAP Diluted EPS* $3.02 to $3.18 Non-GAAP Adjusted EBITDA* $415 to $430 million Capital Expenditures $60 to $65 million Depreciation and Amortization $130 to $140 million Tax Rate (b
Slide 11: Strategic Priorities
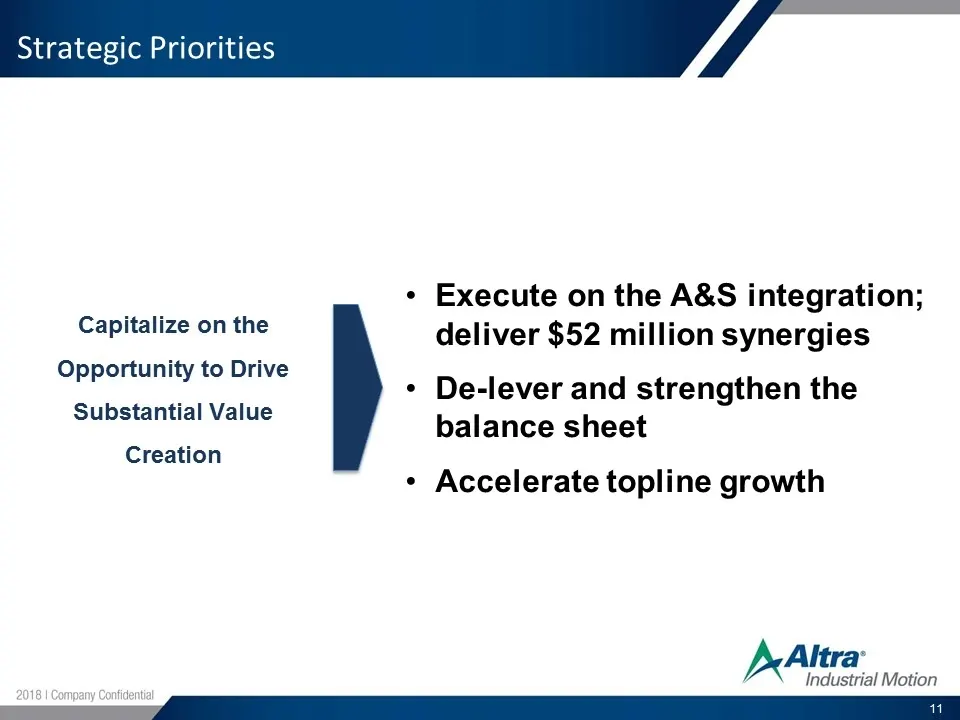
Strategic Priorities Capitalize on the Opportunity to Drive Substantial Value Creation Execute on the A&S integration; deliver $52 million synergies De-lever and strengthen the balance sheet Accelerate topline growth
Slide 12: Discussion of Non-GAAP Measures
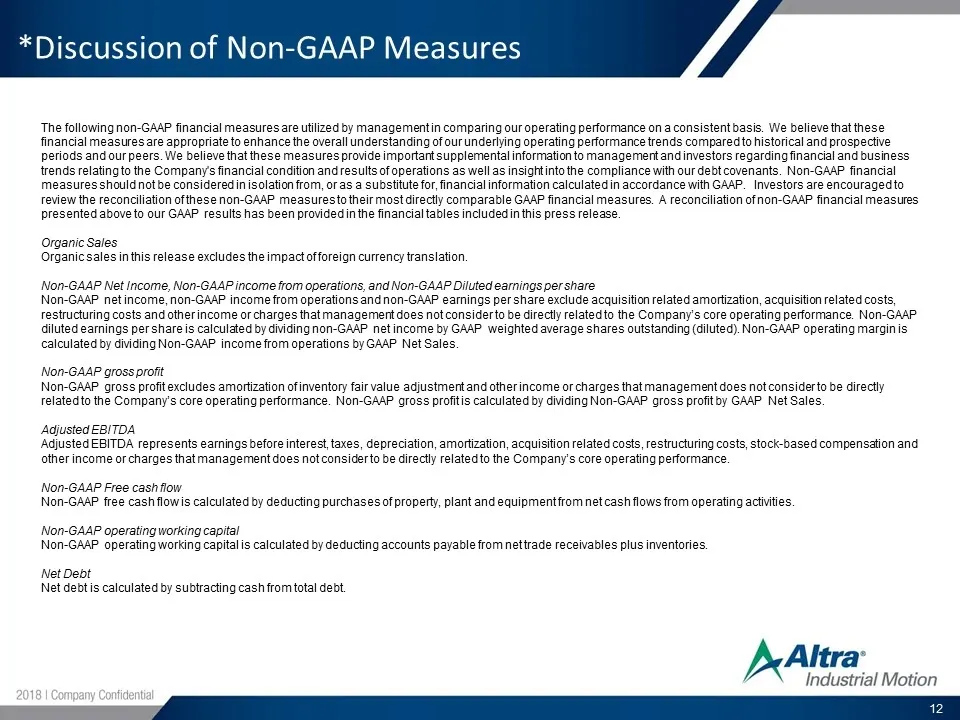
*Discussion of Non-GAAP Measures The following non-GAAP financial measures are utilized by management in comparing our operating performance on a consistent basis. We believe that these financial measures are appropriate to enhance the overall understanding of our underlying operating performance tr
Slide 13: Appendix Non-GAAP Measures
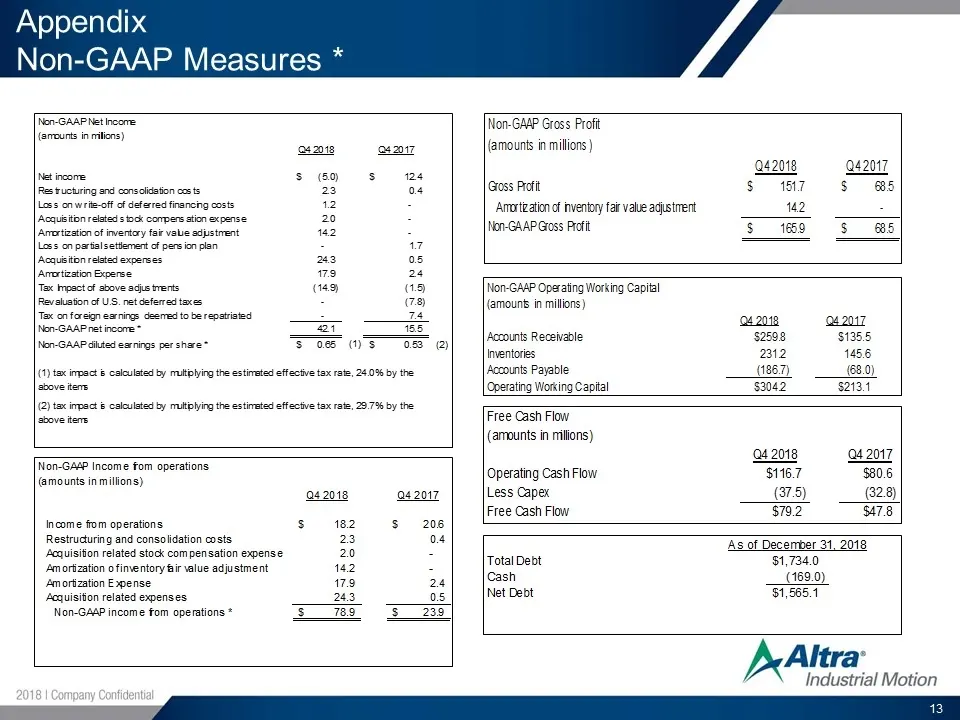
Appendix Non-GAAP Measures * .Non-GAAP Net Income (amounts in millions) !$ 2018 2017 Net income Restructuring and consolidation costs Loss on write-off of deferred financing costs Acquisition related stock compensation expense Amortization of inventory fair value adjustment Loss on partial settle4me
Slide 14: Appendix Non-GAAP Measures: 2019 Guidance Reconciliation
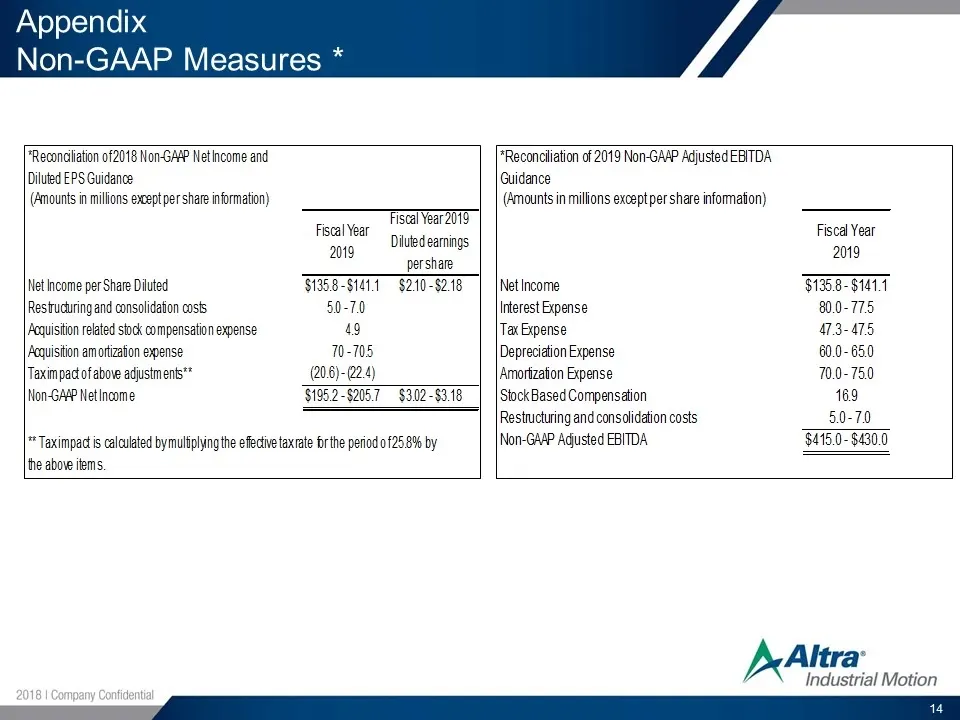
Appendix Non-GAAP Measures * * Reconciliation of 2018 Non-GAAP Net Income and Diluted Eps Guidance (Amounts in millions except per share information) Net Income per Share diluted Restructuring and consolidation costs Acquisition related stock compensation expense amortization expense Taximpact of ab
Slide 15: Appendix Non-GAAP Adjusted EBITDA Reconciliation
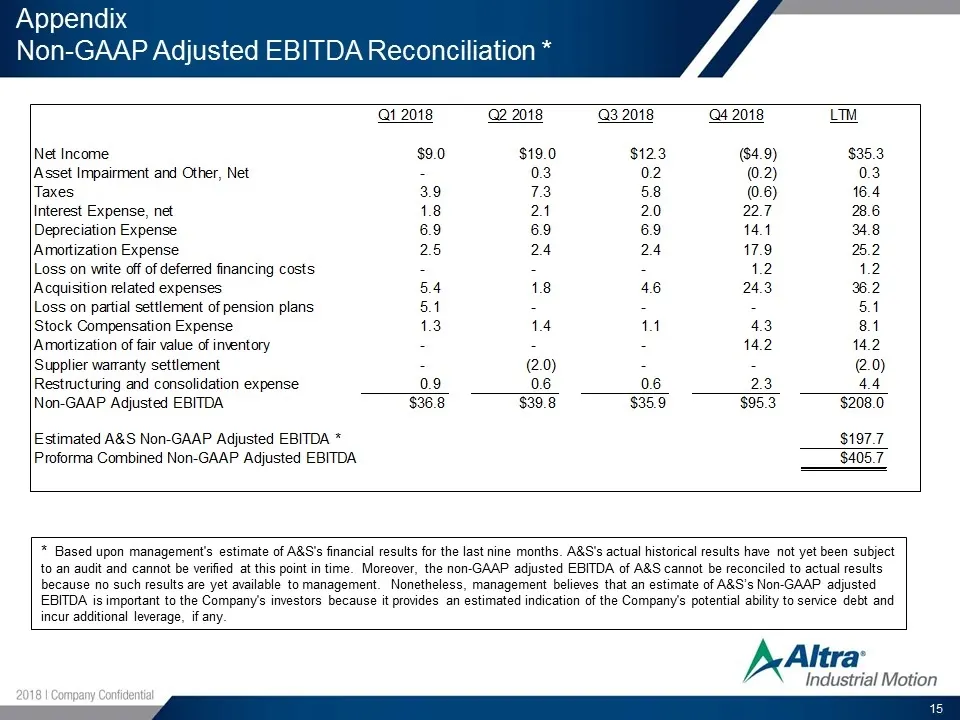
Appendix Non-GAAP Adjusted EBITDA Reconciliation * * Based upon management's estimate of A&S's financial results for the last nine months. A&S's actual historical results have not yet been subject to an audit and cannot be verified at this point in time. Moreover, the non-GAAP adjusted EBITDA of A&S
Source: SEC EDGAR · 8-K filed Feb 21, 2019
More decks from Altra Industrial Motion Corp
 Q2 2022 Earnings Presentation25 slides · Jul 28, 2022
 Q1 2022 Earnings Presentation25 slides · Apr 28, 2022
 Investor Day (March 2022)135 slides · Mar 11, 2022
 Q4 2021 Earnings Presentation17 slides · Feb 16, 2022
 Q3 2021 Earnings Presentation16 slides · Oct 22, 2021
 Q2 2021 Earnings Presentation16 slides · Jul 23, 2021