Superior Well Services — EnerCom Oil & Services Conference February 2009
36 slides from Superior Well Services's conference presentation, Feb 17, 2009
Slide 1: EnerCom Oil & Services Conference February 2009
EnerCom Oil & Services Conference February 2009
Slide 2: Forward-Looking Statements
2 Forward-Looking Statements This presentation includes "forward-looking statements" within the meaning of Section 27A of the Securities Act of 1933, as amended, and Section 21E of the Securities Act of 1934, as amended. All statements, other than statements of historical facts, included in this pre
Slide 3: Company Overview
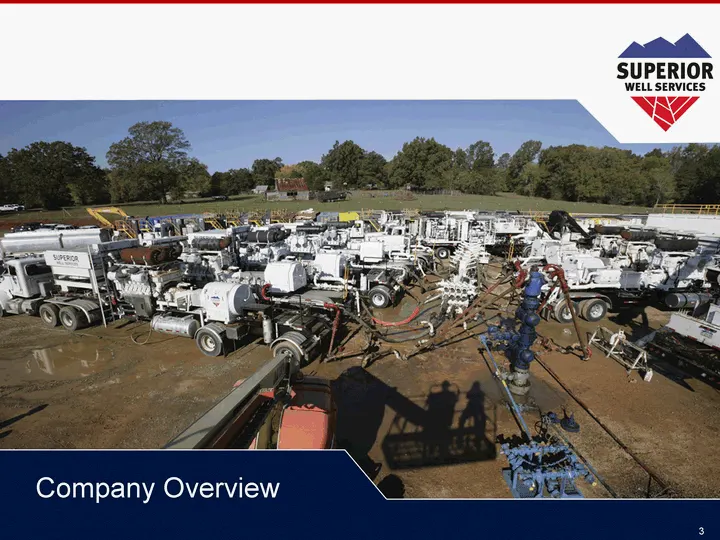
SUPERIOR WELL SERVICES Company Overview
Slide 4: Superior Overview
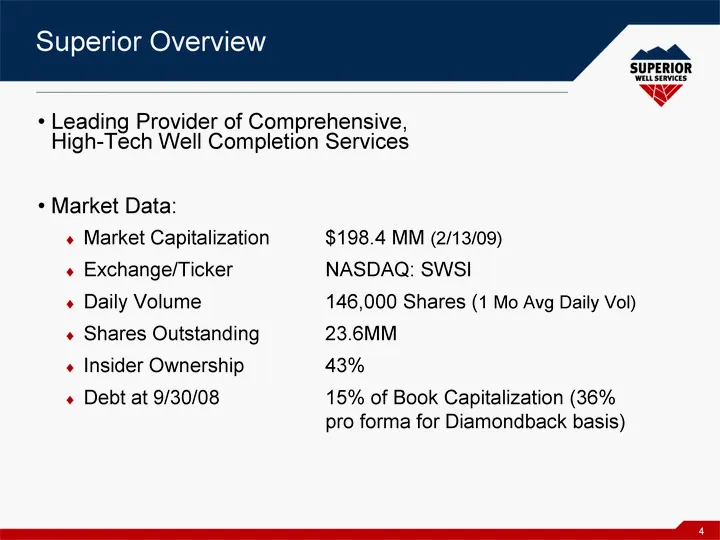
4 Superior Overview Leading Provider of Comprehensive, High-Tech Well Completion Services Market Data: Market Capitalization $198.4 MM (2/13/09) Exchange/Ticker NASDAQ: SWSI Daily Volume 146,000 Shares (1 Mo Avg Daily Vol) Shares Outstanding 23.6MM Insider Ownership 43% Debt at 9/30/08 15% of Book C
Slide 5: Core Competency - Differentiation
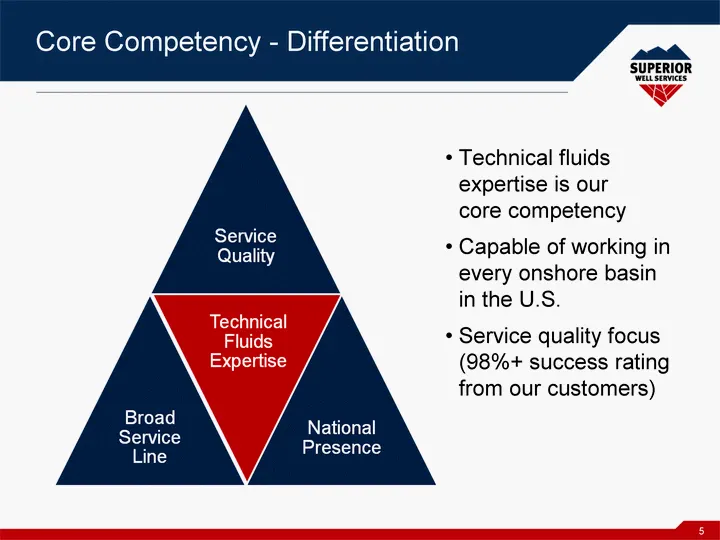
5 Core Competency - Differentiation Technical fluids expertise is our core competency Capable of working in every onshore basin in the U.S. Service quality focus (98%+ success rating from our customers)
Slide 6: Service Matrix
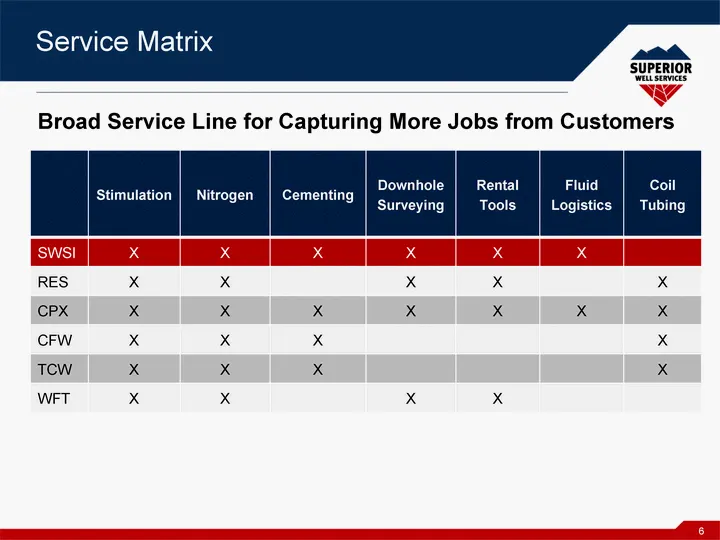
6 Service Matrix Stimulation Nitrogen Cementing Downhole Surveying Rental Tools Fluid Logistics Coil Tubing SWSI X X X X X X RES X X X X X CPX X X X X X X X CFW X X X X TCW X X X X WFT X X X X Broad Service Line for Capturing More Jobs from Customers
Slide 7: Technology Leadership
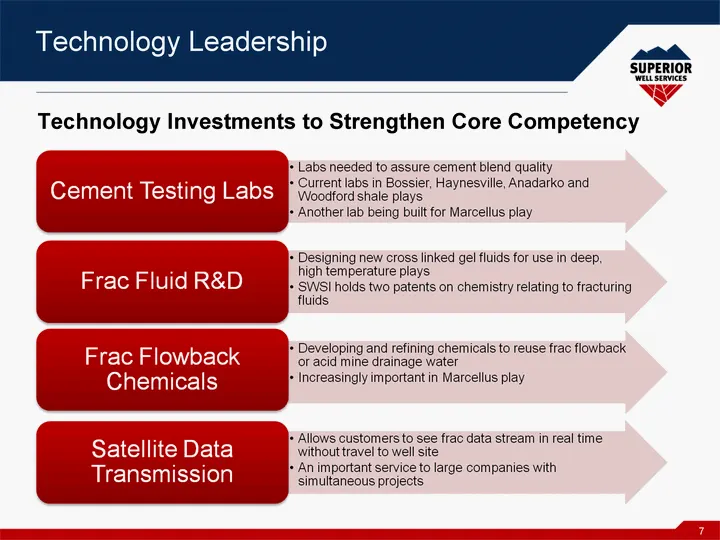
7 Technology Leadership Technology Leadership Technology Investments to Strengthen Core Competency
Slide 8: Diamondback Adds Substantial HHP
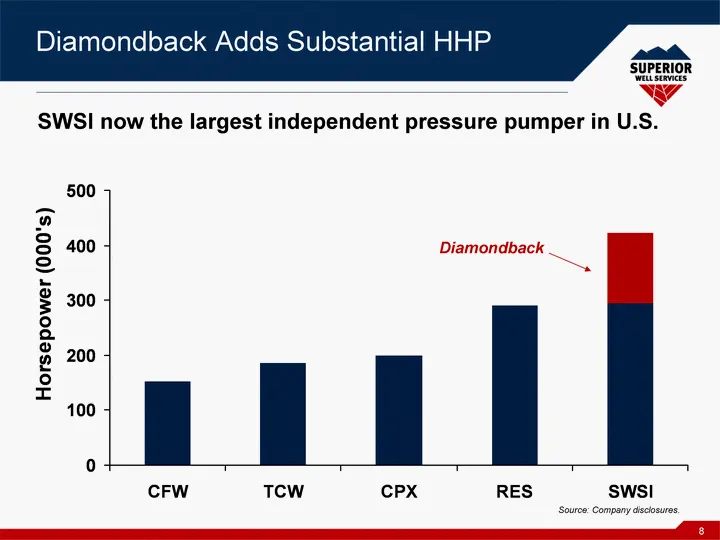
8 Diamondback Adds Substantial HHP CFW TCW CPX RES SWSI 153 186 200 290 295 0 0 0 0 128 Diamondback Source: Company disclosures. SWSI now the largest independent pressure pumper in U.S.
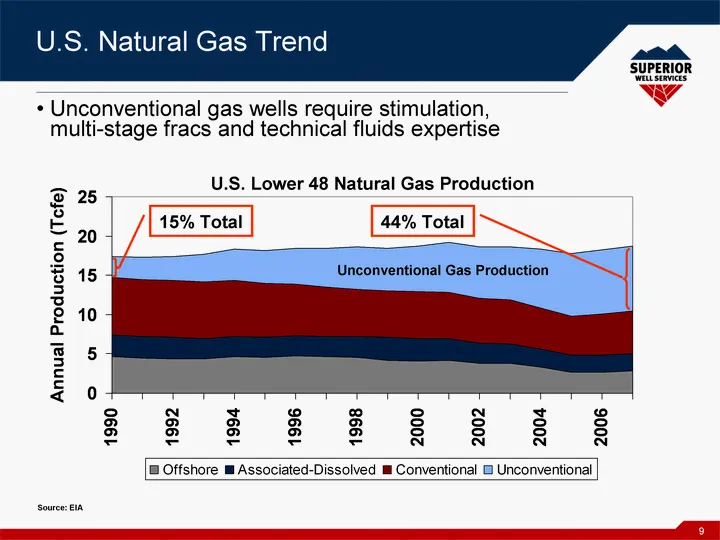
Slide 9: U.S. Natural Gas Trend
9 U.S. Natural Gas Trend 1990 1991 1992 1993 1994 1995 1996 1997 1998 1999 2000 2001 2002 2003 2004 2005 2006 2007 Offshore 4.69 4.46 4.35 4.42 4.67 4.56 4.75 4.63 4.52 4.19 4.11 4.18 3.83 3.81 3.35 2.69 2.646371 2.89378 Associated-Dissolved 2.69 2.72 2.74 2.55 2.57 2.57 2.54 2.58 2.73 2.92 2.83 2.7
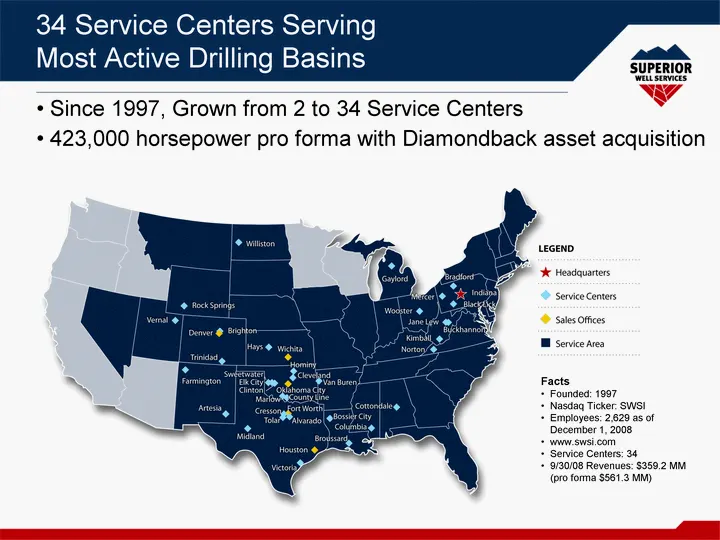
Slide 10: Service Centers Serving Most Active Drilling Basins
34 Service Centers Serving Most Active Drilling Basins Since 1997, Grown from 2 to 34 Service Centers 423,000 horsepower pro forma with Diamondback asset acquisition Facts Founded: 1997 Nasdaq Ticker: SWSI Employees: 2,629 as of December 1, 2008 www.swsi.com Service Centers: 34 9/30/08 Revenues: $35
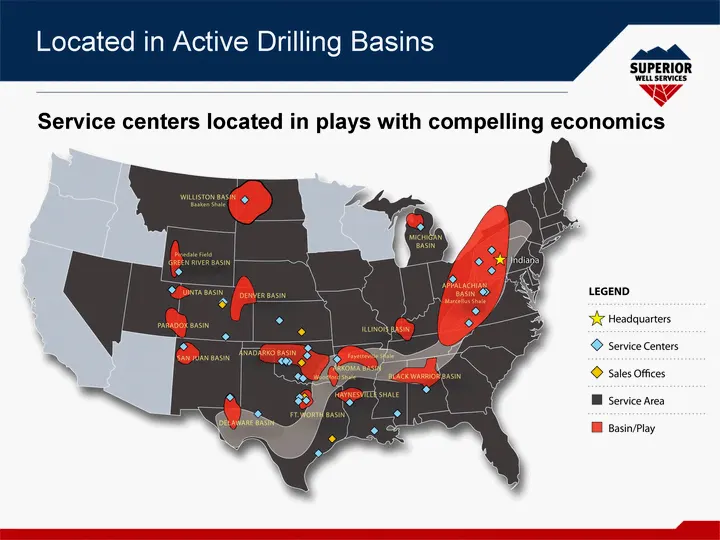
Slide 11: Located in Active Drilling Basins
Located in Active Drilling Basins Service centers located in plays with compelling economics
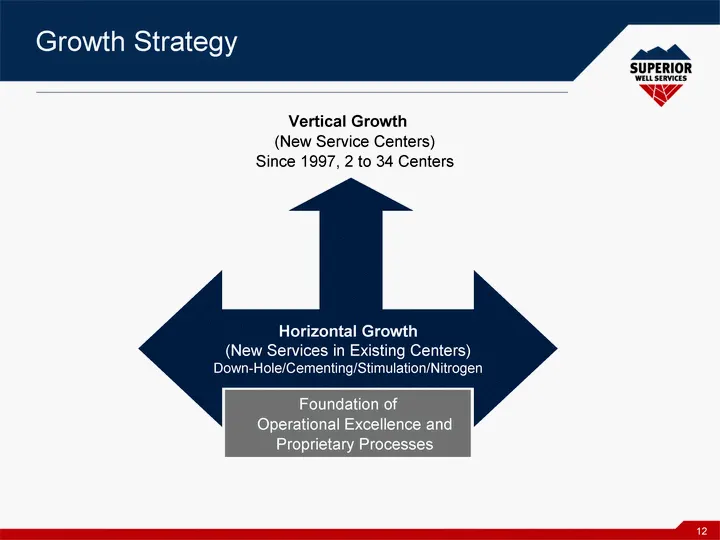
Slide 12: Growth Strategy
12 Growth Strategy Horizontal Growth (New Services in Existing Centers) Down-Hole/Cementing/Stimulation/Nitrogen Foundation of Operational Excellence and Proprietary Processes Vertical Growth (New Service Centers) Since 1997, 2 to 34 Centers
Slide 13: Today's Well Completion Market
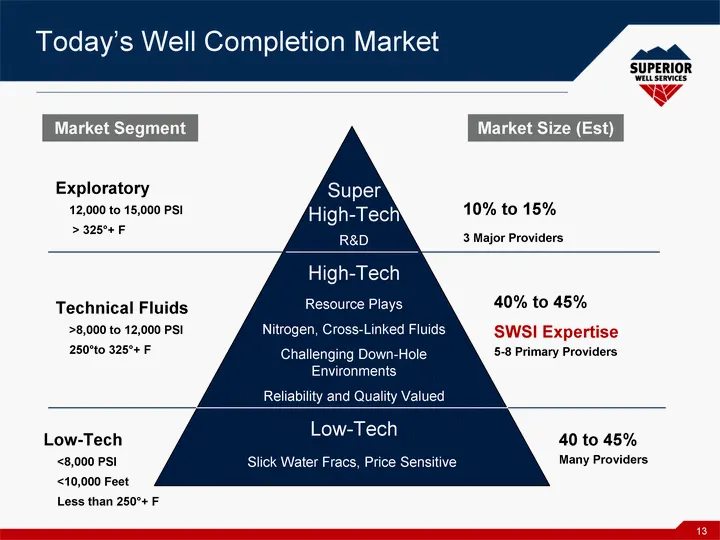
13 Today's Well Completion Market Super High-Tech High-Tech Low-Tech Exploratory 12,000 to 15,000 PSI > 325°+ F 40% to 45% SWSI Expertise 40 to 45% Slick Water Fracs, Price Sensitive 10% to 15% Resource Plays Nitrogen, Cross-Linked Fluids Challenging Down-Hole Environments Reliability and Quality Va
Slide 14: Growing Revenue and EBITDA
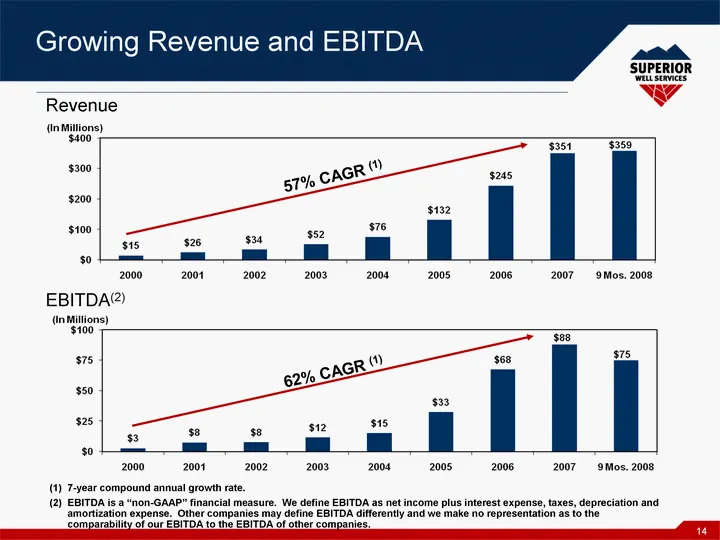
14 Growing Revenue and EBITDA 7-year compound annual growth rate. EBITDA is a "non-GAAP" financial measure. We define EBITDA as net income plus interest expense, taxes, depreciation and amortization expense. Other companies may define EBITDA differently and we make no representation as to the compar
Slide 15: EBITDA (Non-GAAP Financial Measure)
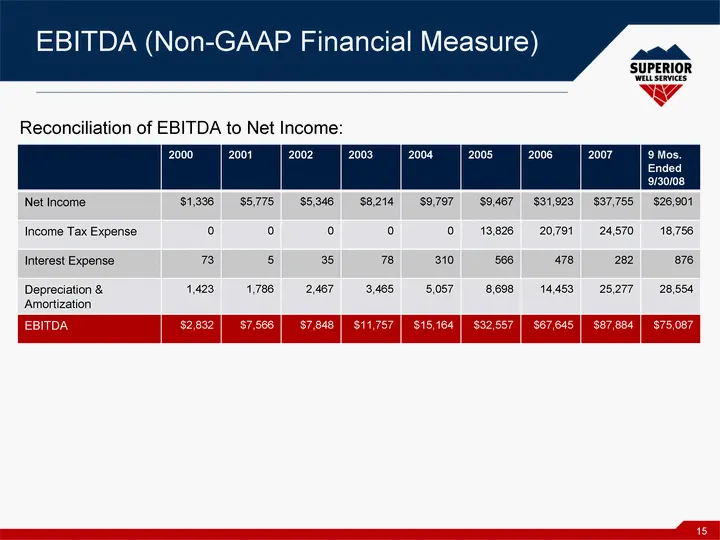
15 EBITDA (Non-GAAP Financial Measure) 2000 2001 2002 2003 2004 2005 2006 2007 9 Mos. Ended 9/30/08 Net Income $1,336 $5,775 $5,346 $8,214 $9,797 $9,467 $31,923 $37,755 $26,901 Income Tax Expense 0 0 0 0 0 13,826 20,791 24,570 18,756 Interest Expense 73 5 35 78 310 566 478 282 876 Depreciation & Amo
Slide 16: Operations Overview
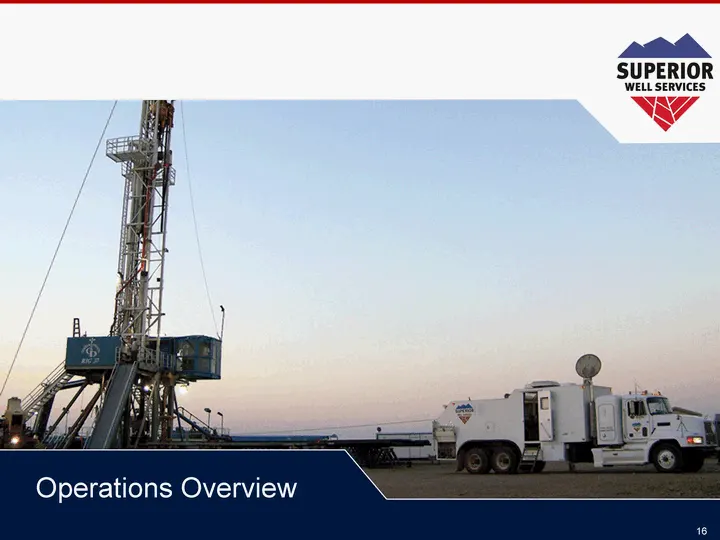
16 Operations Overview
Slide 17: Diversified Revenue Stream - 9/30/2008
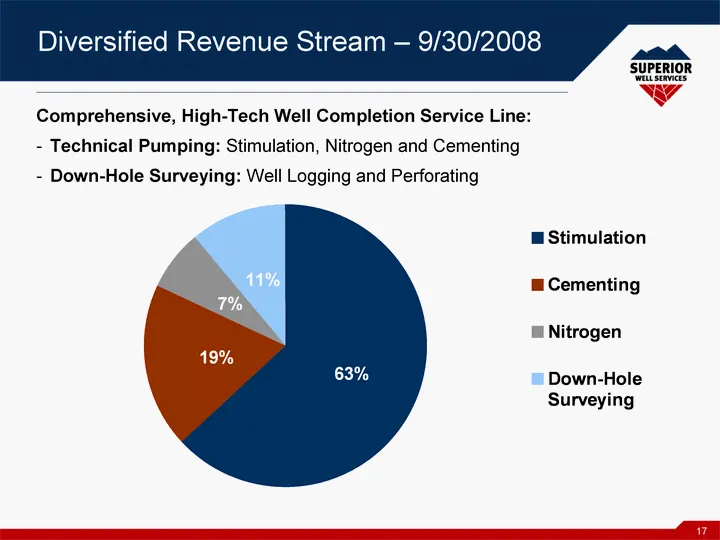
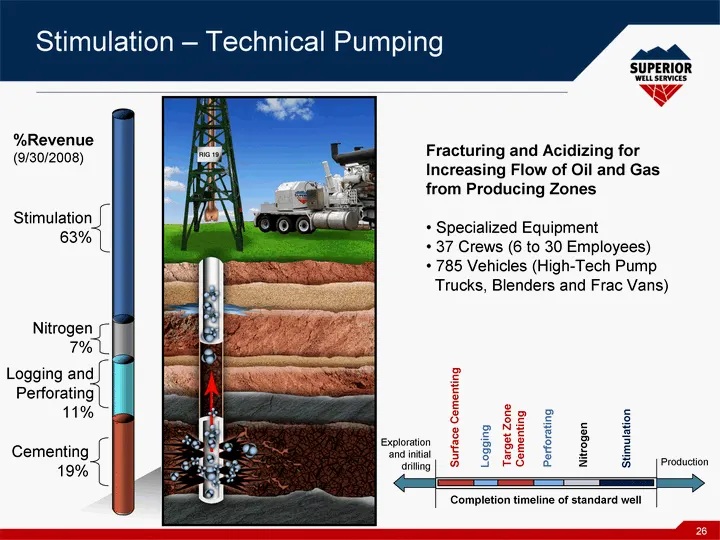
17 Diversified Revenue Stream - 9/30/2008 Stimulation Cementing Nitrogen Down-Hole Surveying 0.63 0.19 0.07 0.11 Comprehensive, High-Tech Well Completion Service Line: Technical Pumping: Stimulation, Nitrogen and Cementing Down-Hole Surveying: Well Logging and Perforating
Slide 18: Cementing - Technical Pumping
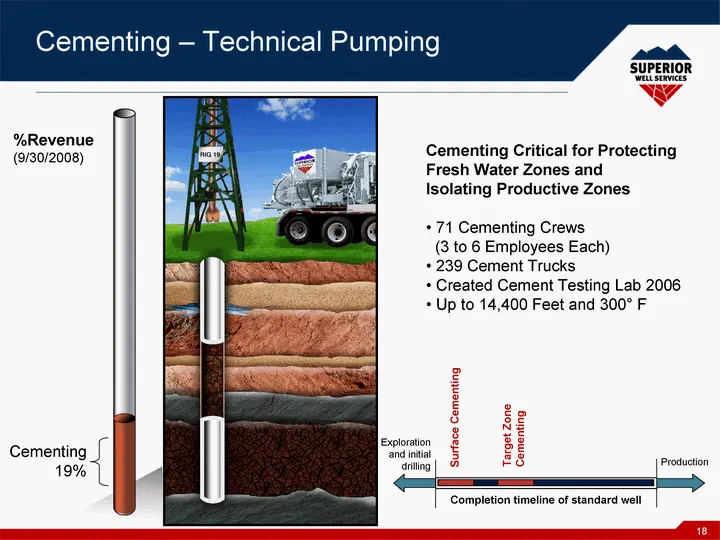
18 Cementing - Technical Pumping Cementing Critical for Protecting Fresh Water Zones and Isolating Productive Zones 71 Cementing Crews (3 to 6 Employees Each) 239 Cement Trucks Created Cement Testing Lab 2006 Up to 14,400 Feet and 300° F Exploration and initial drilling Production Completion timelin
Slide 19: Logging - Down-Hole Surveying
19 Logging - Down-Hole Surveying Logging
Slide 20: Logging - Down-Hole Surveying
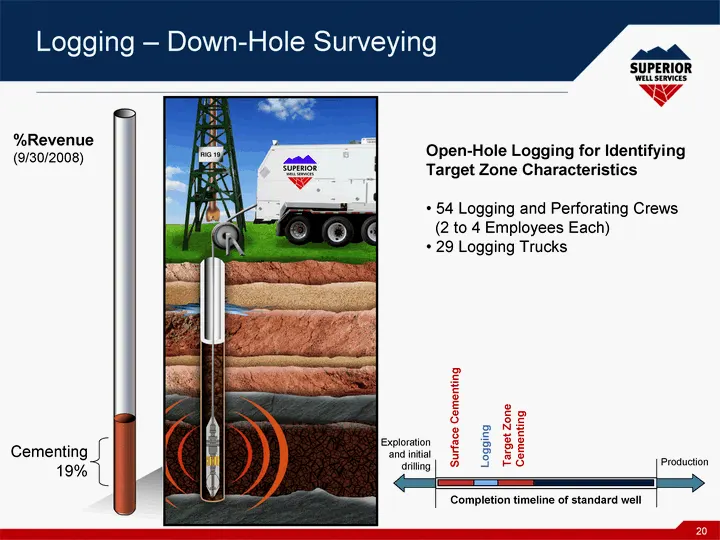
20 Logging - Down-Hole Surveying Open-Hole Logging for Identifying Target Zone Characteristics 54 Logging and Perforating Crews (2 to 4 Employees Each) 29 Logging Trucks Exploration and initial drilling Production Completion timeline of standard well Surface Cementing Target Zone Cementing Logging %
Slide 21: Perforating - Down-Hole Surveying
21 Perforating - Down-Hole Surveying Perforating
Slide 22: Perforating - Down-Hole Surveying
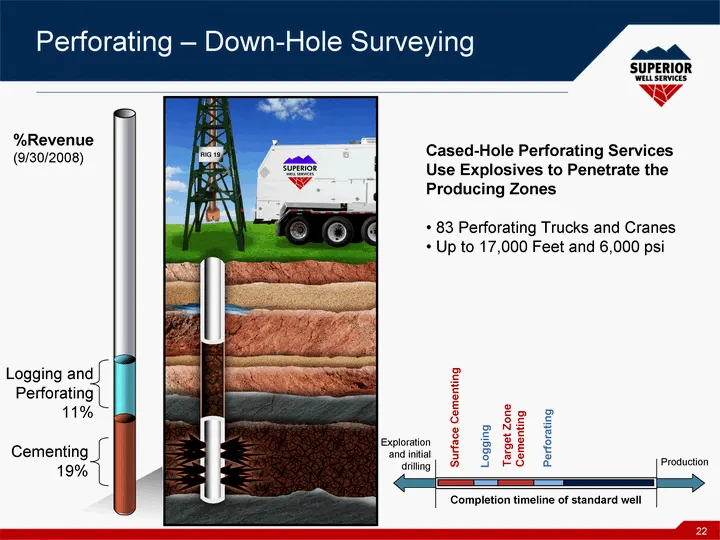
22 Perforating - Down-Hole Surveying Cased-Hole Perforating Services Use Explosives to Penetrate the Producing Zones 83 Perforating Trucks and Cranes Up to 17,000 Feet and 6,000 psi Exploration and initial drilling Production Completion timeline of standard well Surface Cementing Target Zone Cementi
Slide 23: Nitrogen - Technical Pumping
23 Nitrogen - Technical Pumping Nitrogen
Slide 24: Nitrogen - Technical Pumping
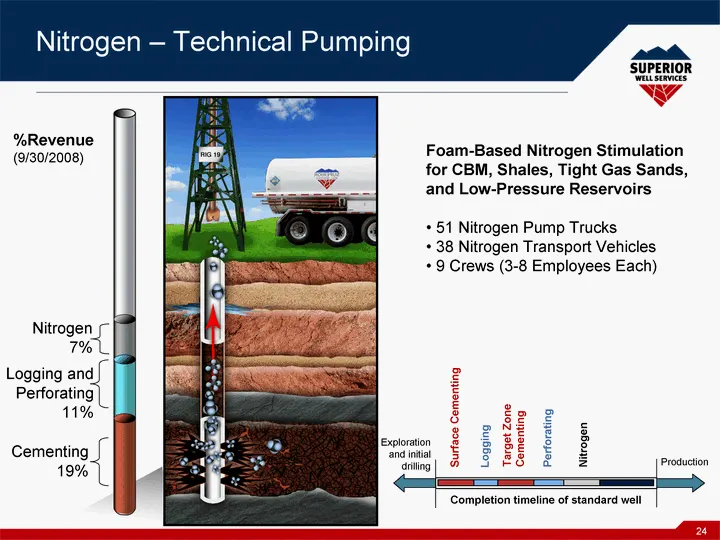
24 Nitrogen - Technical Pumping Foam-Based Nitrogen Stimulation for CBM, Shales, Tight Gas Sands, and Low-Pressure Reservoirs 51 Nitrogen Pump Trucks 38 Nitrogen Transport Vehicles 9 Crews (3-8 Employees Each) Exploration and initial drilling Production Completion timeline of standard well Surface C
Slide 25: Stimulation - Technical Pumping
25 Stimulation - Technical Pumping Stimulation
Slide 26: Stimulation - Technical Pumping
26 Stimulation Stimulation - Technical Pumping Fracturing and Acidizing for Increasing Flow of Oil and Gas from Producing Zones Specialized Equipment 37 Crews (6 to 30 Employees) 785 Vehicles (High-Tech Pump Trucks, Blenders and Frac Vans) Exploration and initial drilling Production Completion timel
Slide 27: Diamondback Acquisition
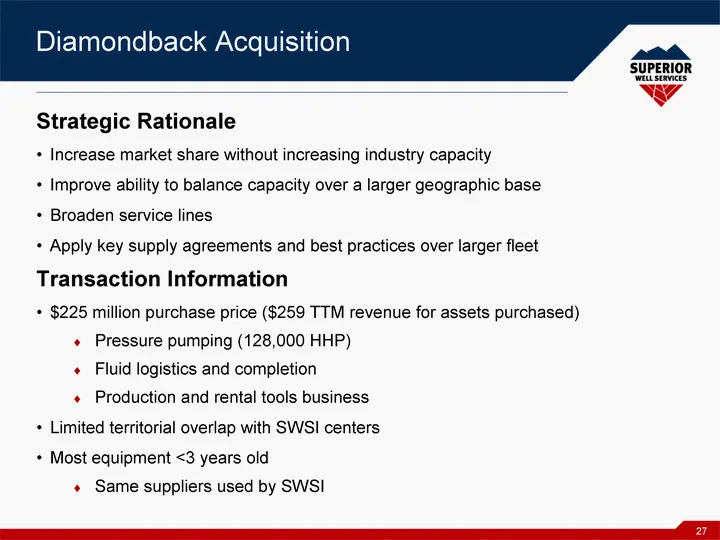
27 Diamondback Acquisition Strategic Rationale Increase market share without increasing industry capacity Improve ability to balance capacity over a larger geographic base Broaden service lines Apply key supply agreements and best practices over larger fleet Transaction Information $225 million purc
Slide 28: Diamondback Acquisition Financing
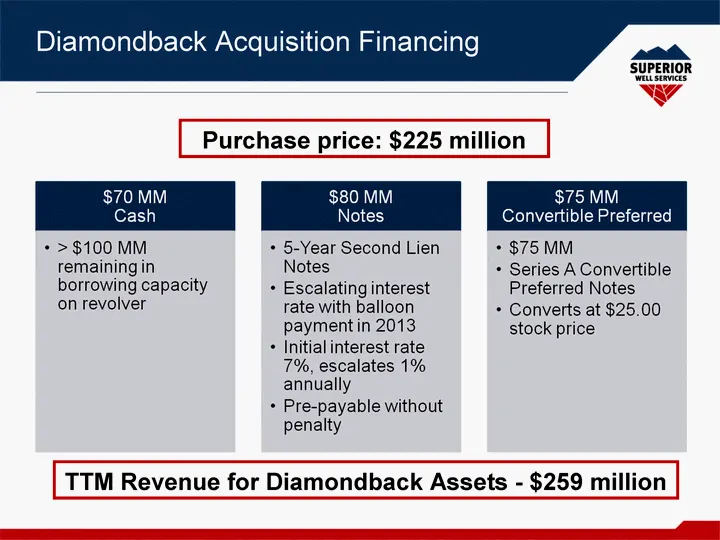
Diamondback Acquisition Financing Purchase price: $225 million TTM Revenue for Diamondback Assets - $259 million
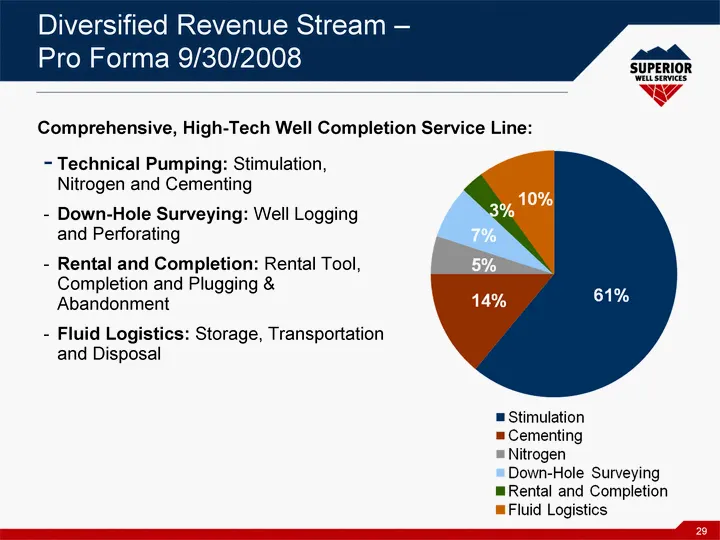
Slide 29: Diversified Revenue Stream - Pro Forma 9/30/2008
29 Diversified Revenue Stream - Pro Forma 9/30/2008 Technical Pumping: Stimulation, Nitrogen and Cementing Down-Hole Surveying: Well Logging and Perforating Rental and Completion: Rental Tool, Completion and Plugging & Abandonment Fluid Logistics: Storage, Transportation and Disposal Comprehensive,
Slide 30: Financial Overview
LOO SUPERIOR WELL SERVICES NV Financial Overview
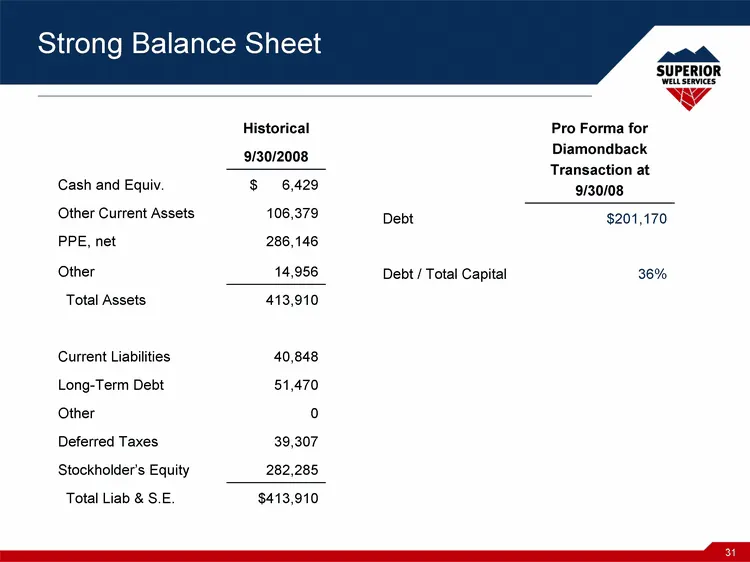
Slide 31: Strong Balance Sheet
31 Strong Balance Sheet Historical 9/30/2008 Cash and Equiv. $ 6,429 Other Current Assets 106,379 PPE, net 286,146 Other 14,956 Total Assets 413,910 Current Liabilities 40,848 Long-Term Debt 51,470 Other 0 Deferred Taxes 39,307 Stockholder's Equity 282,285 Total Liab & S.E. $413,910 TTM Pro Forma fo
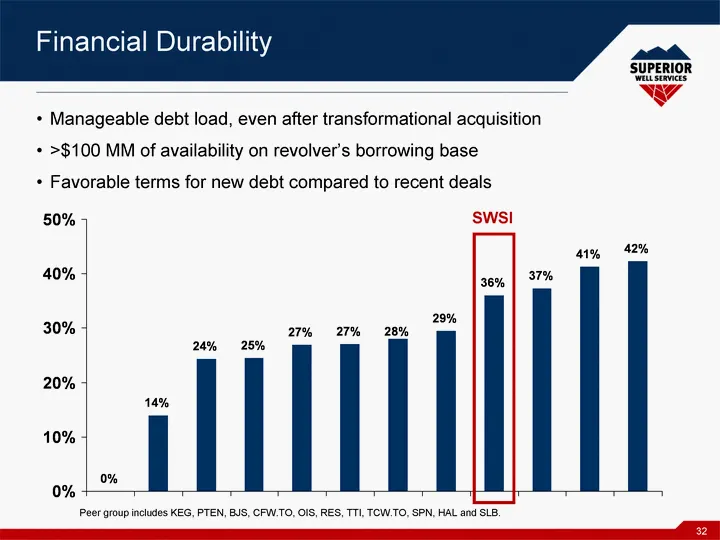
Slide 32: Financial Durability
32 Financial Durability Manageable debt load, even after transformational acquisition >$100 MM of availability on revolver's borrowing base Favorable terms for new debt compared to recent deals SWSI Peer group includes KEG, PTEN, BJS, CFW.TO, OIS, RES, TTI, TCW.TO, SPN, HAL and SLB.
Slide 33: Investments for Service Quality
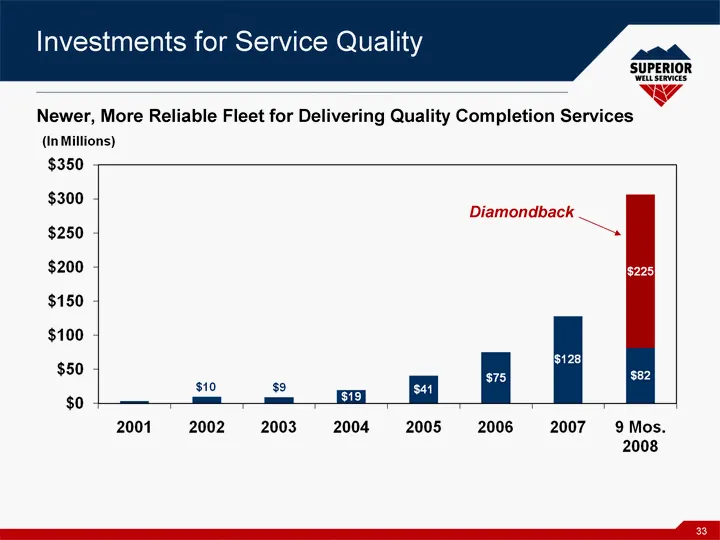
33 Investments for Service Quality Newer, More Reliable Fleet for Delivering Quality Completion Services Diamondback
Slide 34: How We Measure Up - Growth
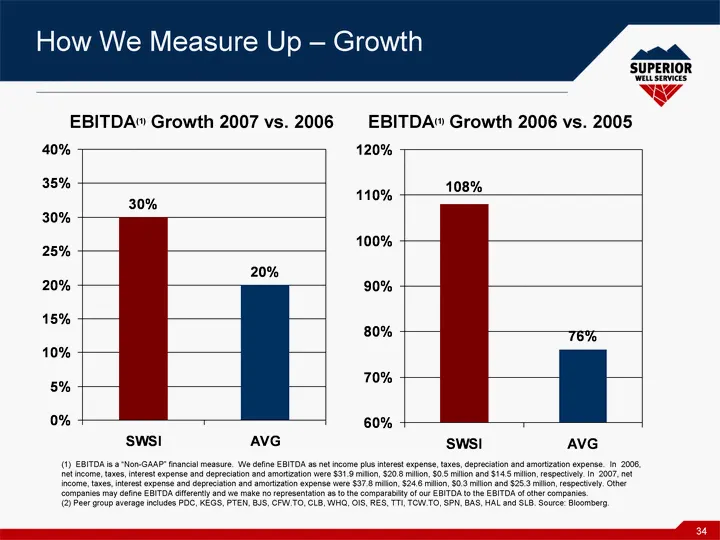
34 How We Measure Up - Growth SWSI AVG 0.3 0.2 SWSI AVG 1.08 0.76 EBITDA(1) Growth 2007 vs. 2006 EBITDA(1) Growth 2006 vs. 2005 (1) EBITDA is a "Non-GAAP" financial measure. We define EBITDA as net income plus interest expense, taxes, depreciation and amortization expense. In 2006, net income, taxes
Slide 35: EBITDA Growth Rankings
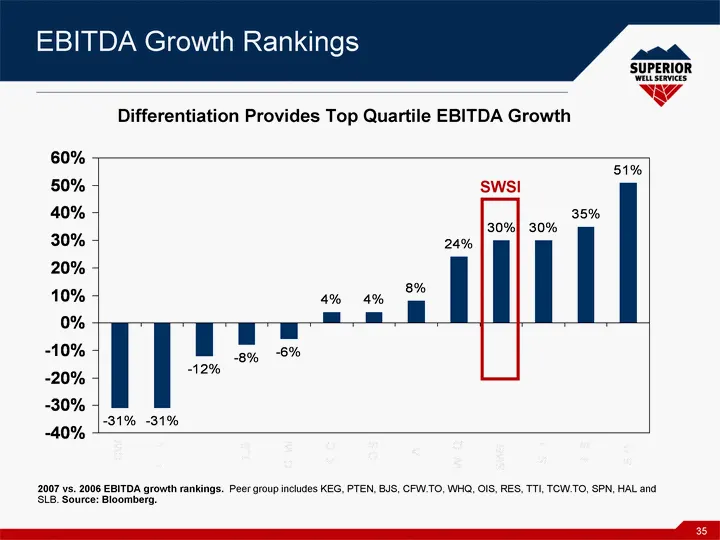
35 EBITDA Growth Rankings Differentiation Provides Top Quartile EBITDA Growth 2007 vs. 2006 EBITDA growth rankings. Peer group includes KEG, PTEN, BJS, CFW.TO, WHQ, OIS, RES, TTI, TCW.TO, SPN, HAL and SLB. Source: Bloomberg. TCW PTEN TTI BJS CFW KEG OIS HAL WHQ SWSI SLB RES SPN -0.31 -0.31 -0.12 -0.
Slide 36: Company Highlights
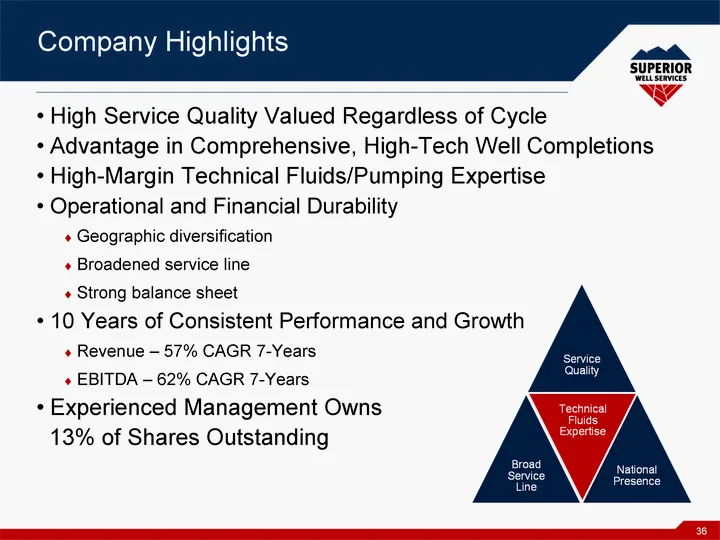
36 Company Highlights High Service Quality Valued Regardless of Cycle Advantage in Comprehensive, High-Tech Well Completions High-Margin Technical Fluids/Pumping Expertise Operational and Financial Durability Geographic diversification Broadened service line Strong balance sheet 10 Years of Consiste
Source: SEC EDGAR · 8-K filed Feb 17, 2009
More decks from Superior Well Services INC
 Investor Presentation (June 2010)28 slides · Jun 7, 2010
 Pritchard Capital Conference 201044 slides · May 19, 2010
 Investor Presentation (May 2010)28 slides · May 13, 2010
 Investor Presentation (March 2010)28 slides · Mar 16, 2010
 Pritchard Capital Partners Energize 201031 slides · Jan 5, 2010
 Pritchard Capital Partners Boston Appalachia Forum 200931 slides · Nov 13, 2009