Novelis — FY2014 Earnings Presentation
25 slides from Novelis's earnings presentation, May 16, 2014
Slide 1: Novelis Q4 & Fiscal Year 2014 Earnings Conference Call
©2014Novelis Inc. 1 May 16, 2014 Philip Martens President and Chief Executive Officer Steve Fisher Senior Vice President and Chief Financial Officer Novelis Q4 & Fiscal Year 2014 Earnings Conference Call Exhibit 99.2
Slide 2: Safe Harbor Statement
©2014Novelis Inc. 2 Safe Harbor Statement Forward-Looking Statements Statements made in this presentation which describe Novelis' intentions, expectations, beliefs or predictions may be forward-looking statements within the meaning of securities laws. Forward-looking statements include statements pr
Slide 3: Agenda
©2014Novelis Inc. 3 Agenda FY14 Business Review Strategy Q4FY14 Detailed Financial Review Summary & Outlook
Slide 4: FY14 Business Review
©2014Novelis Inc. 4 FY14 Business Review
Slide 5: Fiscal Year 2014 Highlights
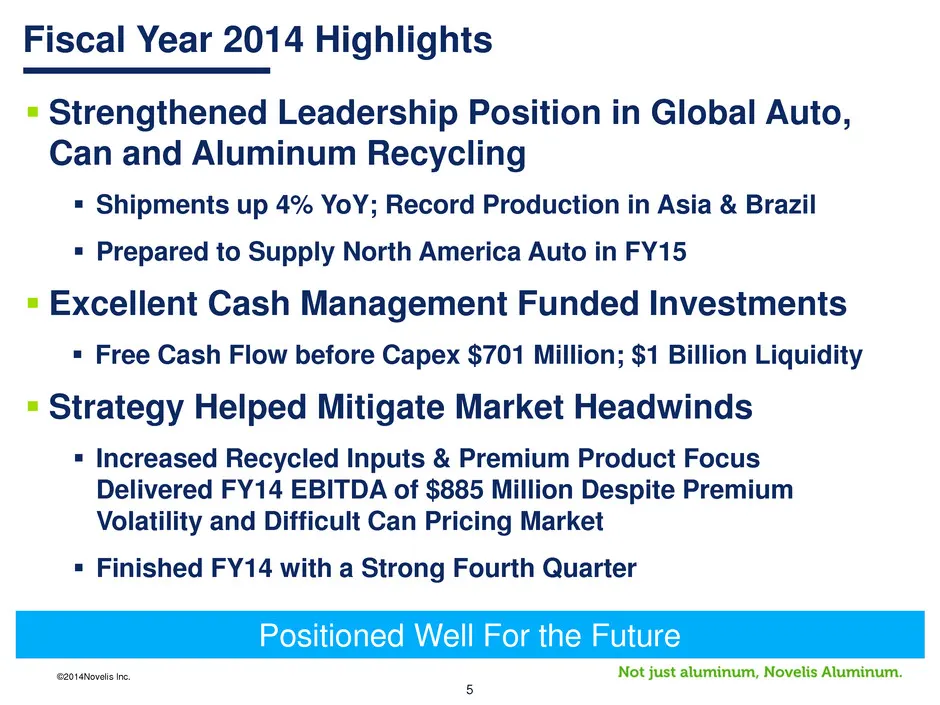
©2014Novelis Inc. 5 Fiscal Year 2014 Highlights Strengthened Leadership Position in Global Auto, Can and Aluminum Recycling Shipments up 4% YoY; Record Production in Asia & Brazil Prepared to Supply North America Auto in FY15 Excellent Cash Management Funded Investments Free Cash Flow befo
Slide 6: Strategy Mitigating Market Headwinds
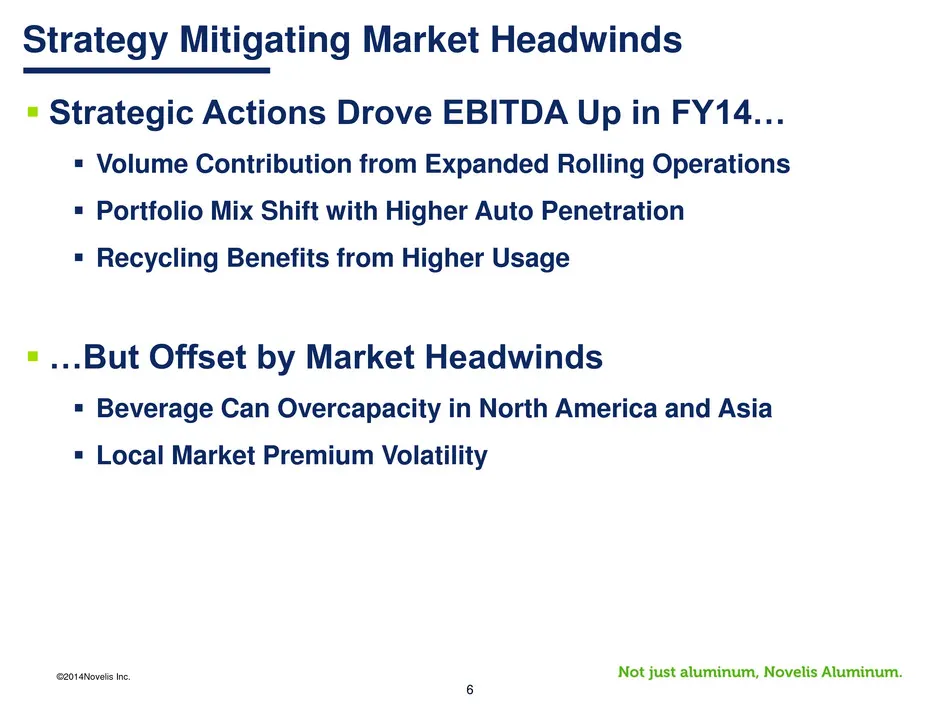
©2014Novelis Inc. 6 Strategy Mitigating Market Headwinds Strategic Actions Drove EBITDA Up in FY14… Volume Contribution from Expanded Rolling Operations Portfolio Mix Shift with Higher Auto Penetration Recycling Benefits from Higher Usage …But Offset by Market Headwinds Beverage Can Over

Slide 7: Strategy
©2014Novelis Inc. 7 Strategy
Slide 8: Novelis' Strategy
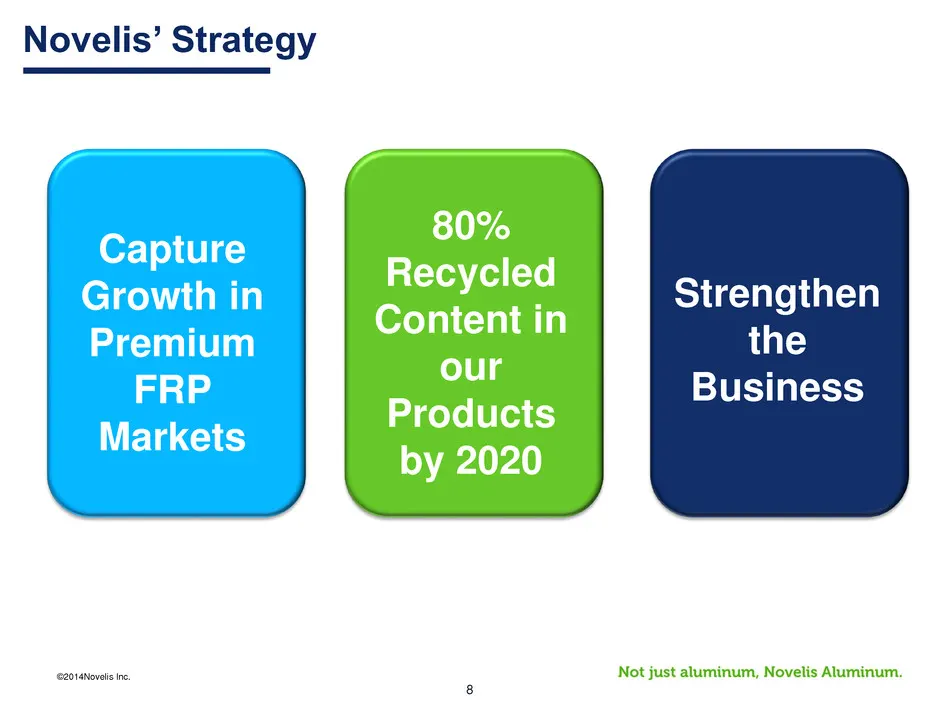
©2014Novelis Inc. 8 Novelis’ Strategy 80% Recycled Content in our Products by 2020 Capture Growth in Premium FRP Markets Strengthen the Business
Slide 9: Novelis Evolution - Growing Premium Products
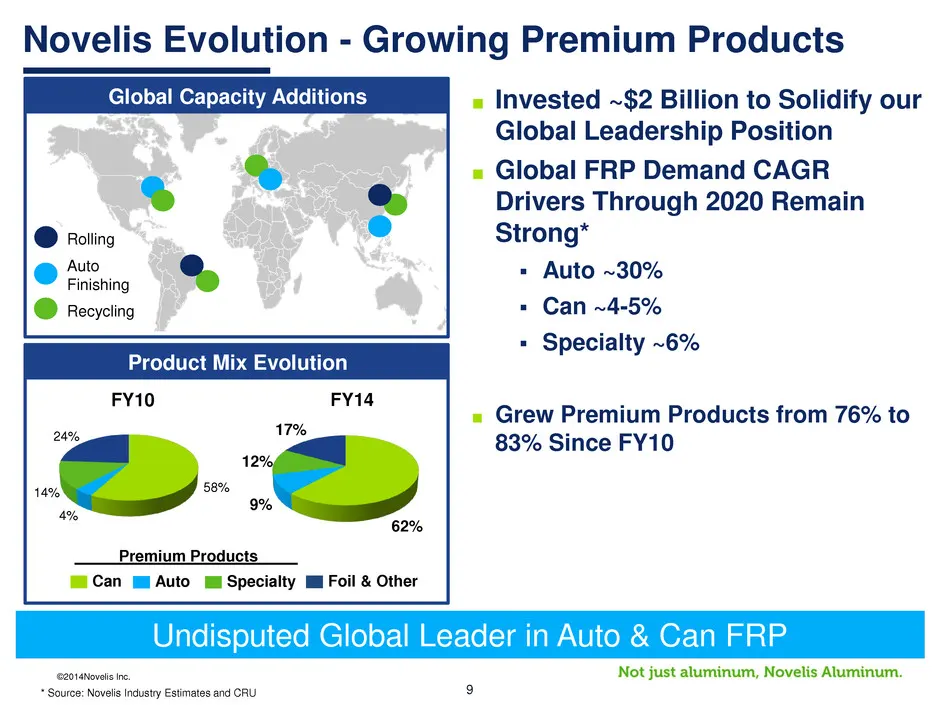
©2014Novelis Inc. 9 Novelis Evolution - Growing Premium Products Global Capacity Additions Product Mix Evolution 58% 4% 14% 24% 62% 9% 12% 17% Rolling Auto Finishing Recycling Undisputed Global Leader in Auto & Can FRP Can Auto Specialty Foil & Other FY14 FY10 Premium Products ■ Invested ~$2 Billion
Slide 10: Evolution of Auto Share in Product Portfolio
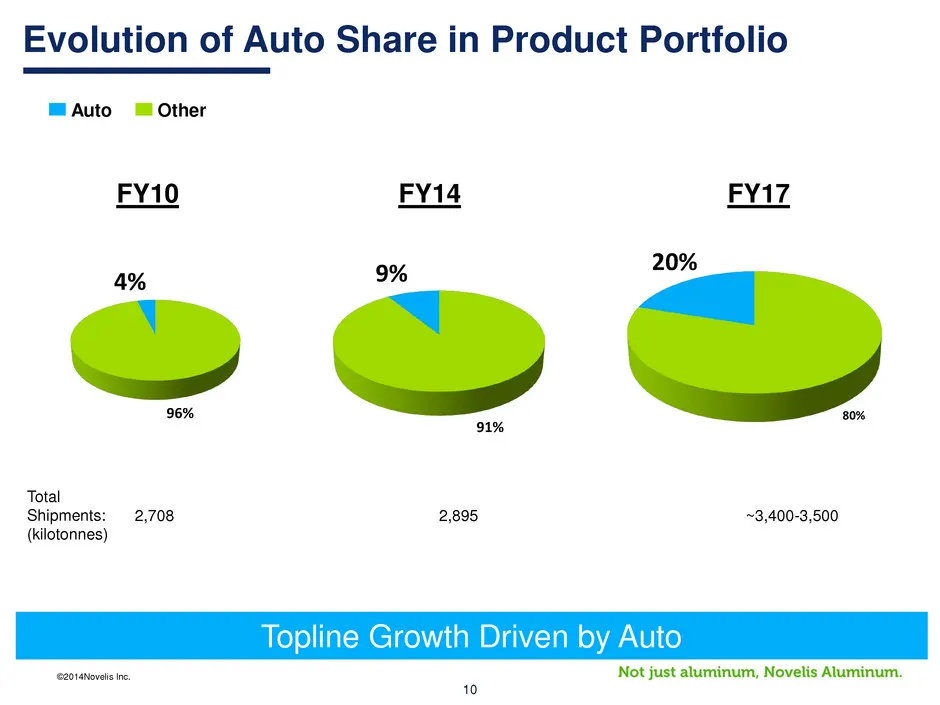
©2014Novelis Inc. 10 Evolution of Auto Share in Product Portfolio 91% 9% 80% Total Shipments: (kilotonnes) Other Auto FY10 FY14 FY17 2,708 2,895 ~3,400-3,500 96% 4% 20% Topline Growth Driven by Auto
Slide 11: Novelis Evolution – Growing Auto Globally
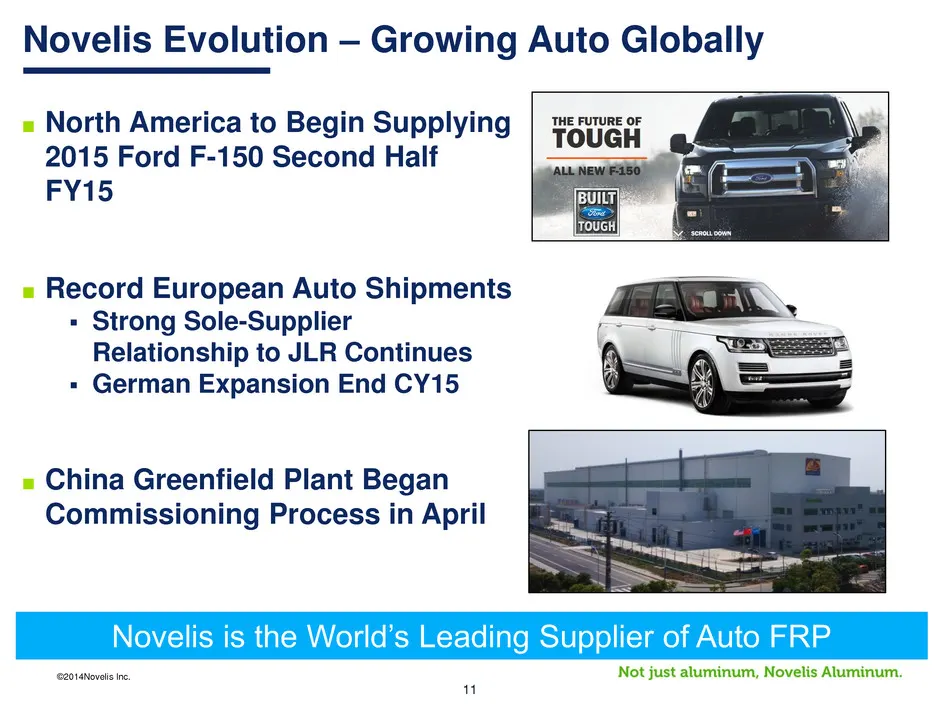
©2014Novelis Inc. 11 Novelis Evolution – Growing Auto Globally Novelis is the World’s Leading Supplier of Auto FRP ■ North America to Begin Supplying 2015 Ford F-150 Second Half FY15 ■ Record European Auto Shipments Strong Sole-Supplier Relationship to JLR Continues German Expansion End CY15 ■ C
Slide 12: Novelis Evolution – Leading in Sustainability
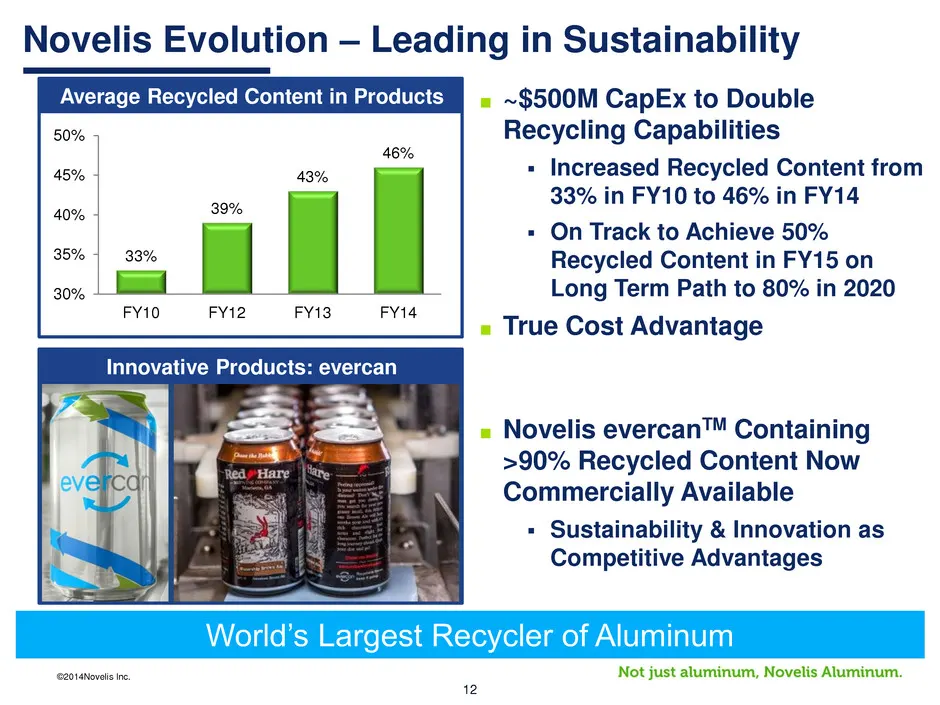
©2014Novelis Inc. 12 Novelis Evolution – Leading in Sustainability Average Recycled Content in Products Innovative Products: evercan 33% 39% 43% 46% 30% 35% 40% 45% 50% FY10 FY12 FY13 FY14 ■ ~$500M CapEx to Double Recycling Capabilities Increased Recycled Content from 33% in FY10 to 46% in FY14
Slide 13: Novelis Evolution – Driving Results
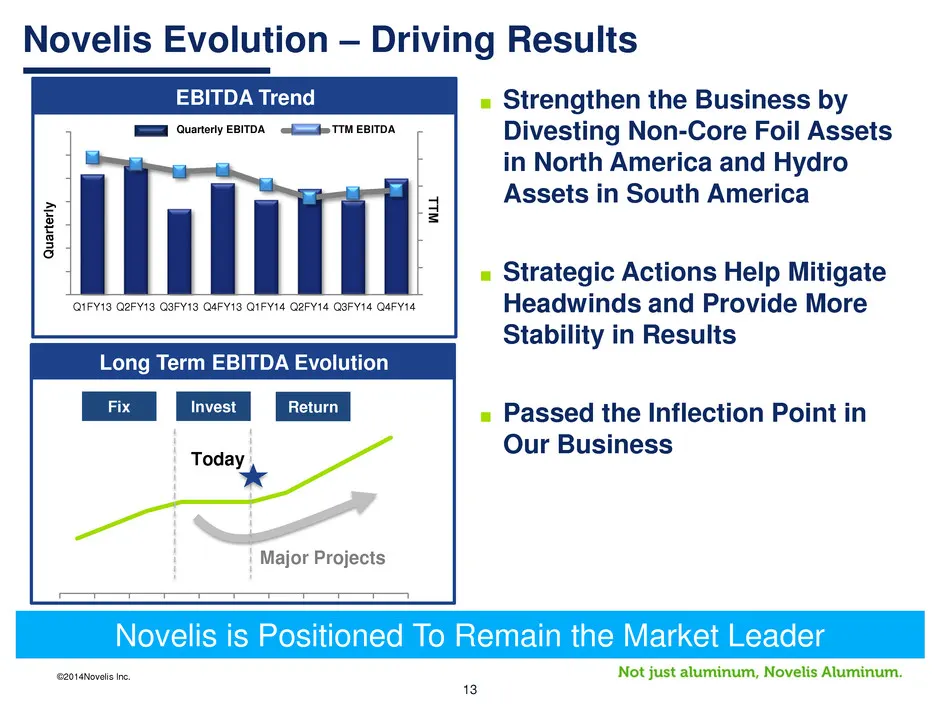
©2014Novelis Inc. 13 Novelis Evolution – Driving Results Long Term EBITDA Evolution EBITDA Trend ■ Strengthen the Business by Divesting Non-Core Foil Assets in North America and Hydro Assets in South America ■ Strategic Actions Help Mitigate Headwinds and Provide More Stability in Results ■ Passed t
Slide 14: Operations & Financial Review
©2014Novelis Inc. 14 Operations & Financial Review
Slide 15: Fourth Quarter Highlights
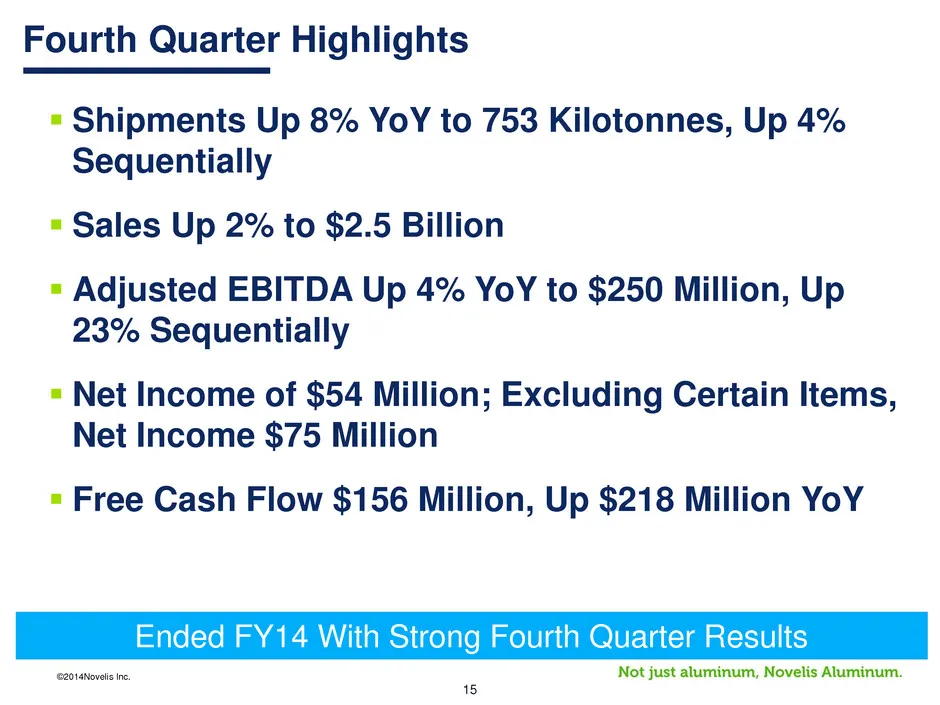
©2014Novelis Inc. 15 Fourth Quarter Highlights Shipments Up 8% YoY to 753 Kilotonnes, Up 4% Sequentially Sales Up 2% to $2.5 Billion Adjusted EBITDA Up 4% YoY to $250 Million, Up 23% Sequentially Net Income of $54 Million; Excluding Certain Items, Net Income $75 Million Free Cash Flow $156
Slide 16: Q4 and FY14 Shipments by Region
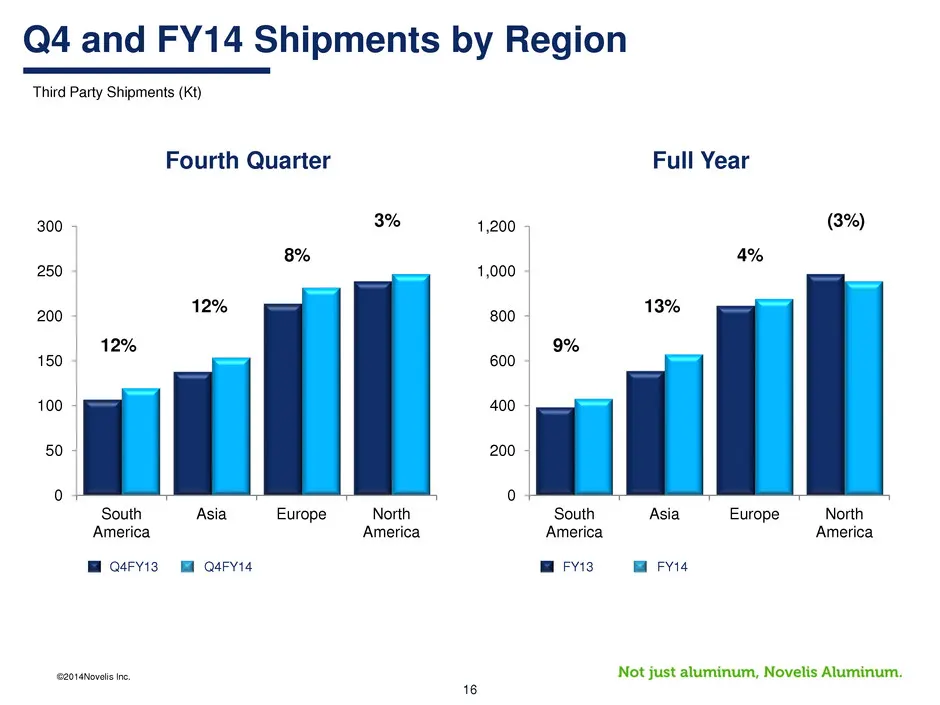
©2014Novelis Inc. 16 0 200 400 600 800 1,000 1,200 South America Asia Europe North America FY14 FY13 13% 4% (3%) 9% Third Party Shipments (Kt) Q4 and FY14 Shipments by Region Full Year 0 50 100 150 200 250 300 South America Asia Europe North America Q4FY14 Q4FY13 12% 8% 3% 12% Fourth Quarter
Slide 17: Q4FY14 Adjusted EBITDA Bridge
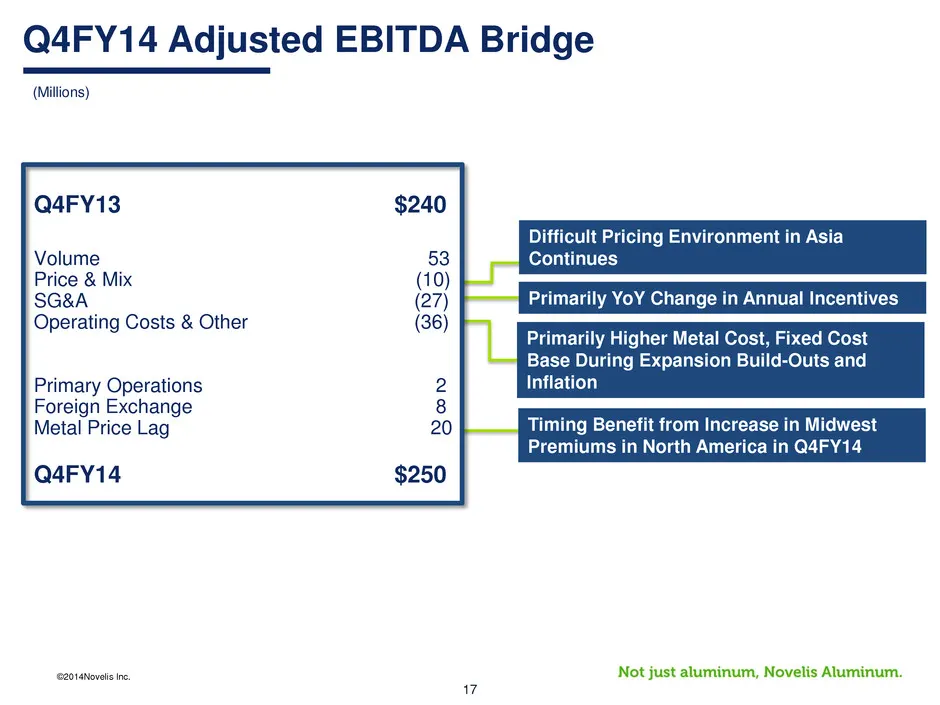
©2014Novelis Inc. 17 Q4FY14 Adjusted EBITDA Bridge (Millions) Q4FY13 $240 Volume 53 Price & Mix (10) SG&A (27) Operating Costs & Other (36) Primary Operations 2 Foreign Exchange 8 Metal Price Lag 20 Q4FY14 $250 Difficult Pricing Environment in Asia Continues Primarily YoY Change in Annual Incentives
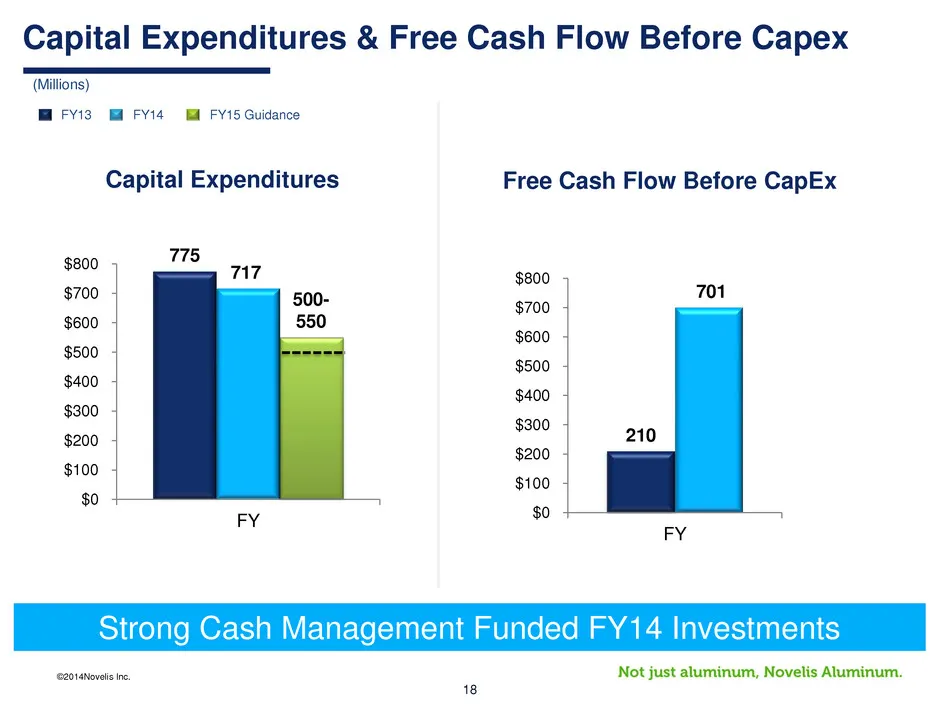
Slide 18: Capital Expenditures & Free Cash Flow Before Capex
©2014Novelis Inc. 18 (Millions) Capital Expenditures & Free Cash Flow Before Capex FY14 FY13 Strong Cash Management Funded FY14 Investments 210 701 $0 $100 $200 $300 $400 $500 $600 $700 $800 FY 775 717 $0 $100 $200 $300 $400 $500 $600 $700 $800 FY Free Cash Flow Before CapEx Capital Expenditures FY1

Slide 19: Summary & Outlook
©2014Novelis Inc. 19 Summary & Outlook
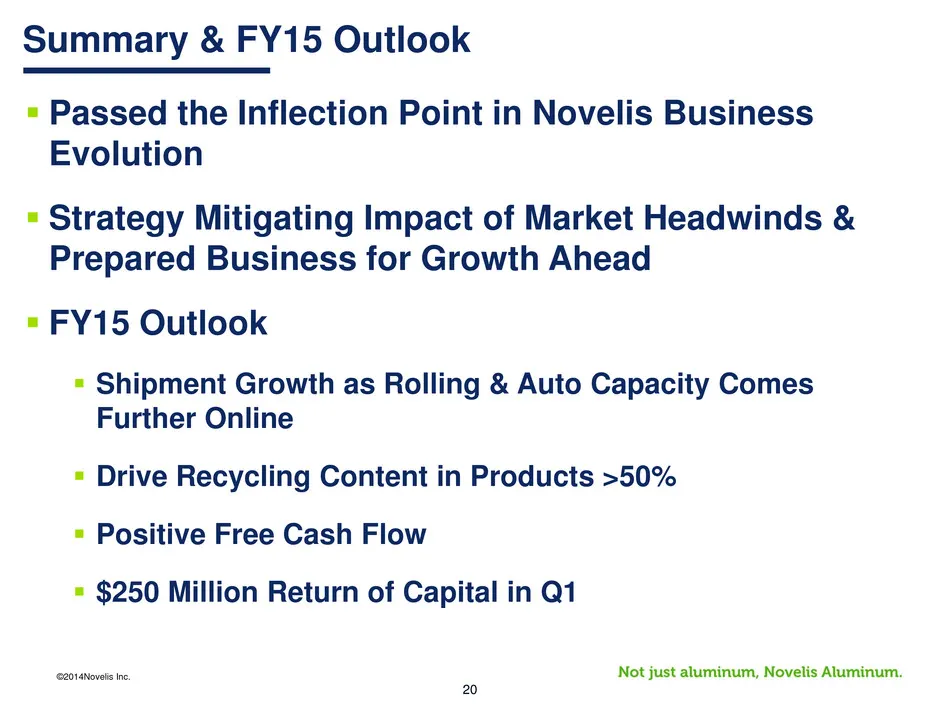
Slide 20: Summary & FY15 Outlook
©2014Novelis Inc. 20 Passed the Inflection Point in Novelis Business Evolution Strategy Mitigating Impact of Market Headwinds & Prepared Business for Growth Ahead FY15 Outlook Shipment Growth as Rolling & Auto Capacity Comes Further Online Drive Recycling Content in Products >50% Positiv

Slide 21: Questions & Answers
©2014Novelis Inc. 21 Questions & Answers

Slide 22: Appendix
©2014Novelis Inc. 22 Appendix
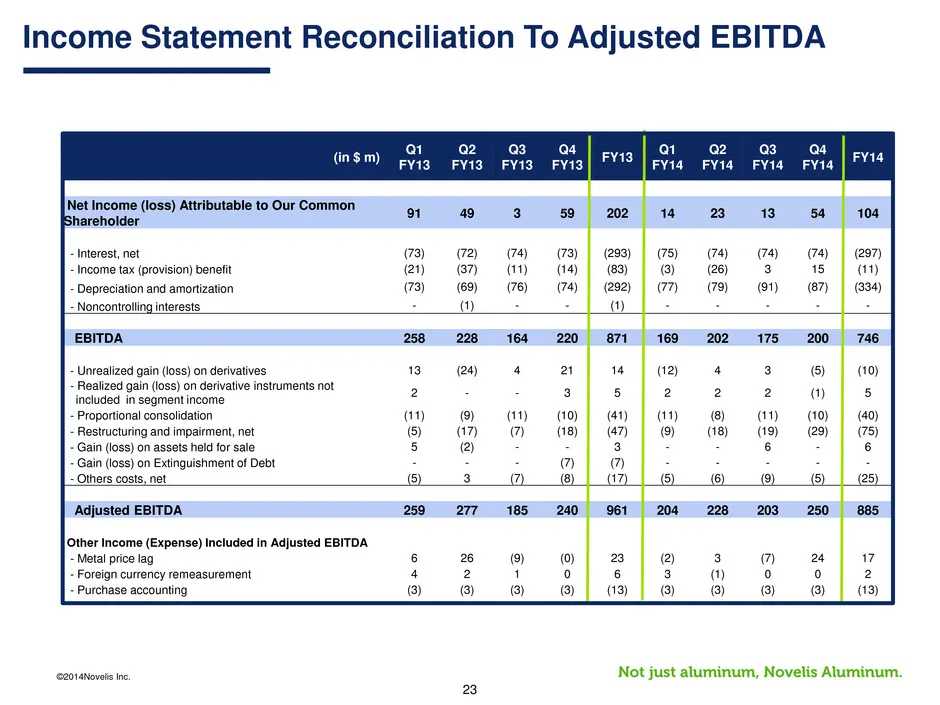
Slide 23: EBITDA Reconciliation
©2014Novelis Inc. 23 (in $ m) Q1 FY13 Q2 FY13 Q3 FY13 Q4 FY13 FY13 Q1 FY14 Q2 FY14 Q3 FY14 Q4 FY14 FY14 Net Income (loss) Attributable to Our Common Shareholder 91 49 3 59 202 14 23 13 54 104 - Interest, net (73) (72) (74) (73) (293) (75) (74) (74) (74) (297) - Income tax (provision) benefit (21) (3
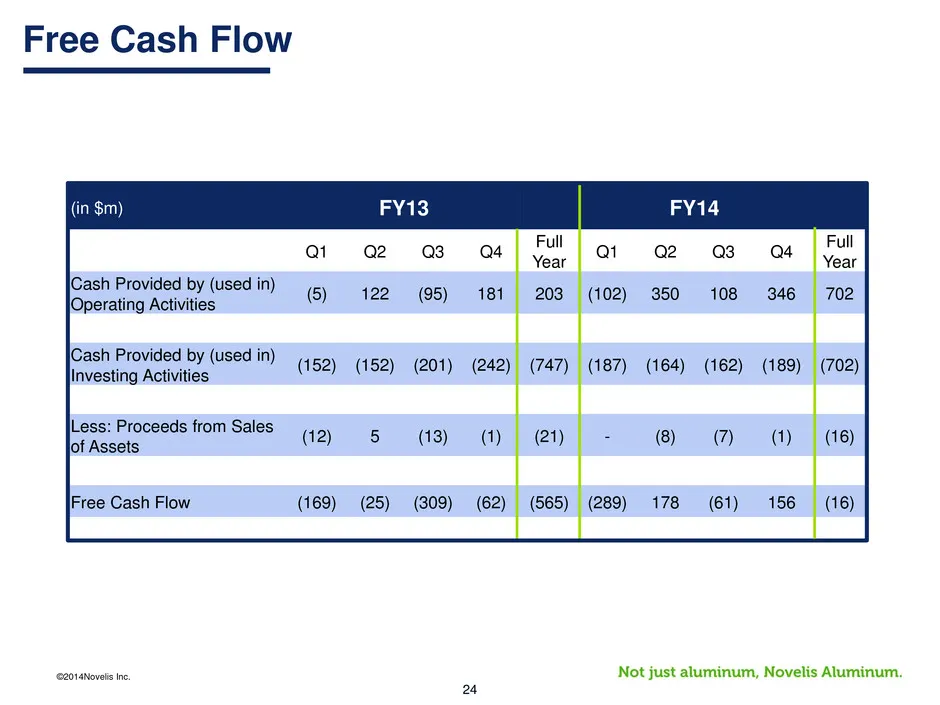
Slide 24: Free Cash Flow Reconciliation
©2014Novelis Inc. 24 (in $m) FY13 FY14 Q1 Q2 Q3 Q4 Full Year Q1 Q2 Q3 Q4 Full Year Cash Provided by (used in) Operating Activities (5) 122 (95) 181 203 (102) 350 108 346 702 Cash Provided by (used in) Investing Activities (152) (152) (201) (242) (747) (187) (164) (162) (189) (702) Less: Proceeds fro
Slide 25: Definitions and Notes
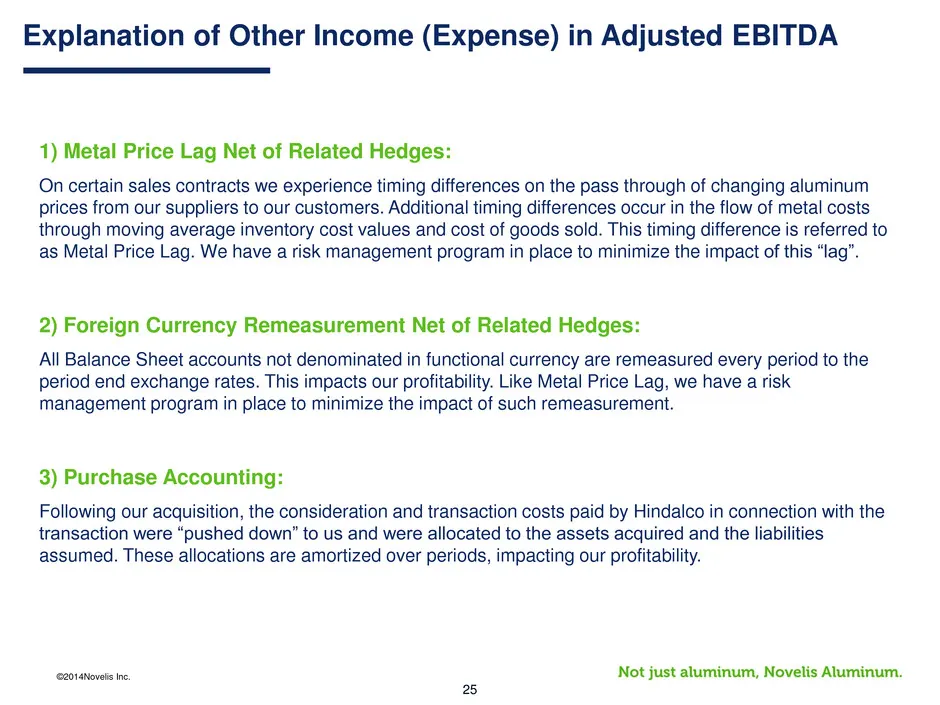
©2014Novelis Inc. 25 1) Metal Price Lag Net of Related Hedges: On certain sales contracts we experience timing differences on the pass through of changing aluminum prices from our suppliers to our customers. Additional timing differences occur in the flow of metal costs through moving average invent
Source: SEC EDGAR · 8-K filed May 16, 2014
More decks from Novelis Inc.
 Q2 FY2027 Earnings Presentation20 slides · Nov 5, 2026
 Q2 FY2027 Earnings Presentation31 slides · Nov 5, 2026
 Q1 FY2027 Earnings Presentation21 slides · Aug 5, 2026
 Q1 FY2027 Earnings Presentation31 slides · Aug 5, 2026
 Q4 FY2026 Earnings Presentation33 slides · May 19, 2026
 Q3 FY2026 Earnings Presentation33 slides · Feb 11, 2026