Ntelos — Debt Investor Presentation (January 2014)
30 slides from Ntelos's debt investor presentation, Jan 14, 2014

Slide 1: Lender Presentation
NASDAQ: NTLS Lender Presentation January 2014 Exhibit 99.2

Slide 2: Company Overview
NASDAQ: NTLS Company Overview
Slide 3: Company Overview
Leading “pure-play” wireless carrier in mid-Atlantic region Headquartered in Waynesboro, VA Exclusive CDMA Network provider for Sprint in WV and Western VA NTELOS-branded retail postpay and prepay subscribers; robust wholesale business NASDAQ: NTLS NASDAQ: NTLS – Market Capitalization approximately
Slide 4: Investment Considerations
Leading “pure-play” regional wireless company Strategic asset set Strong free cash flow Broad geographic and network technology footprint Experienced management team NASDAQ: NTLS Competitive and diversified business model Investment Considerations
Slide 5: Key Operating Strategies
Elevate brand & best value in wireless position to improve quality of subscriber base and grow market share Enhance customer experience at all touch points by focusing on core differentiators of Savings, Simplicity and Service to improve customer satisfaction and reduce subscriber churn Leverage dis
Slide 6: Strategic Network Assets
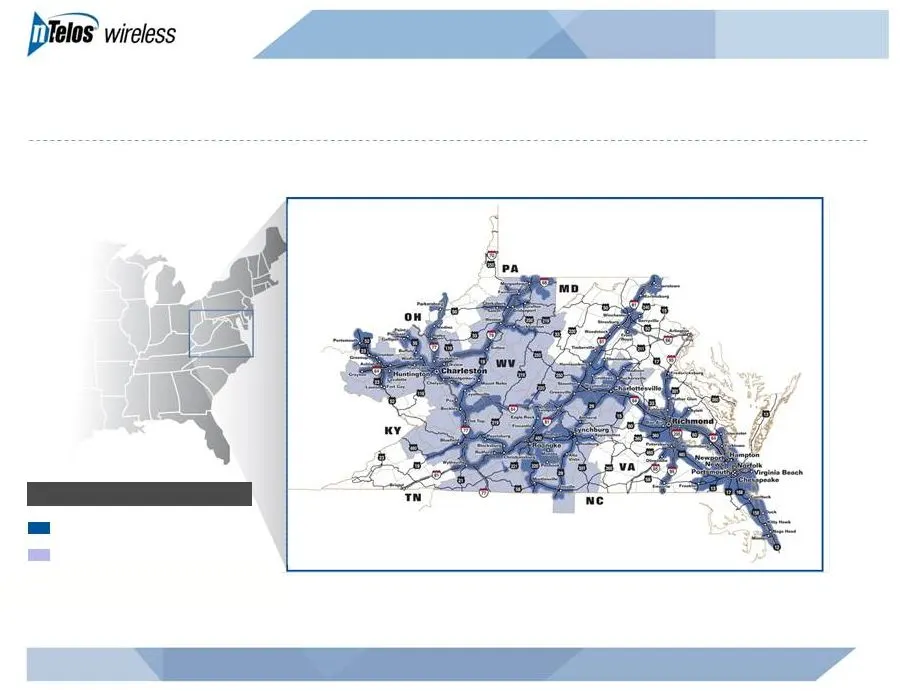
NASDAQ: NTLS STRATEGIC NETWORK ASSETS Regional Wireless Service Provider Ntelos Covered Network Sprint Wholesale Markets
Slide 7: Attractive Spectrum Portfolio
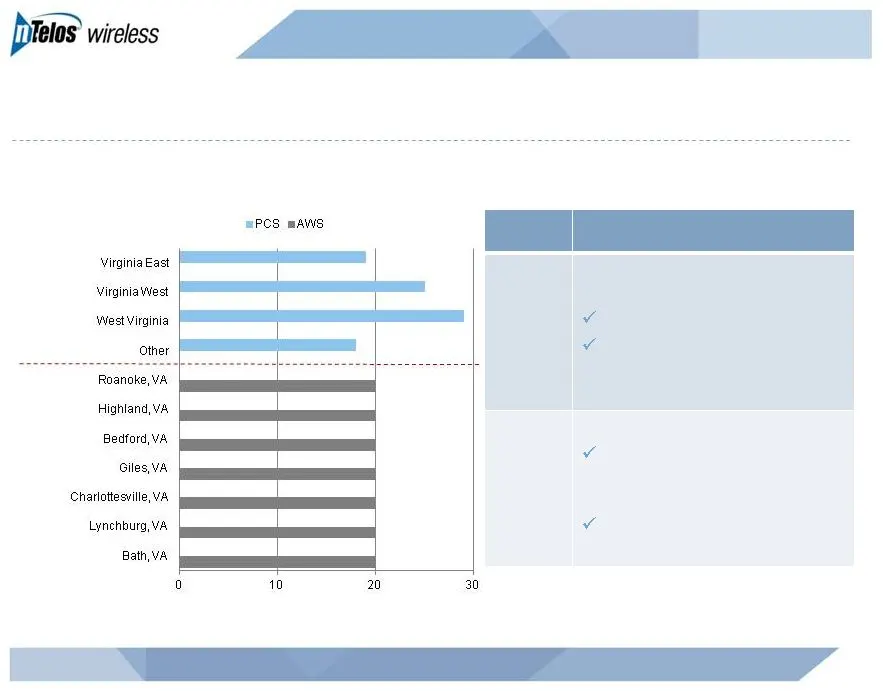
NASDAQ: NTLS Band Commentary Attractive Spectrum Portfolio Average Spectrum Depth in Key Markets (1) PCS Average depth of 23 MHz Scarce strategic asset AWS Significant spectrum holdings in contiguous markets in western Virginia Currently undeployed MHZ 3,673 2,710 1,767 1,016 Licensed POPs (000’s) S
Slide 8: Operating Revenues
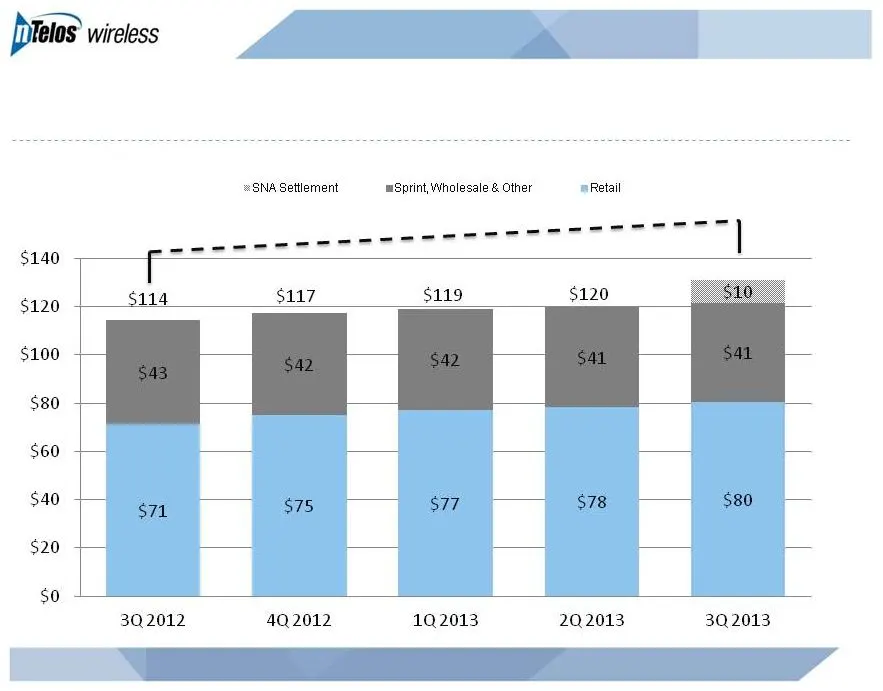
NASDAQ: NTLS Operating Revenues +14% millions $131
Slide 9: Retail Revenue Gains Continue
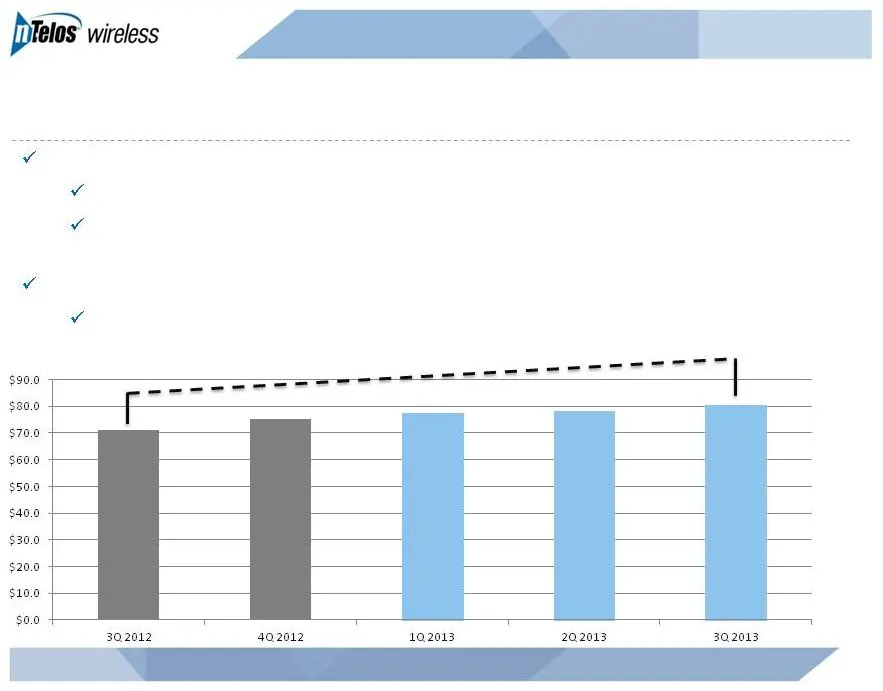
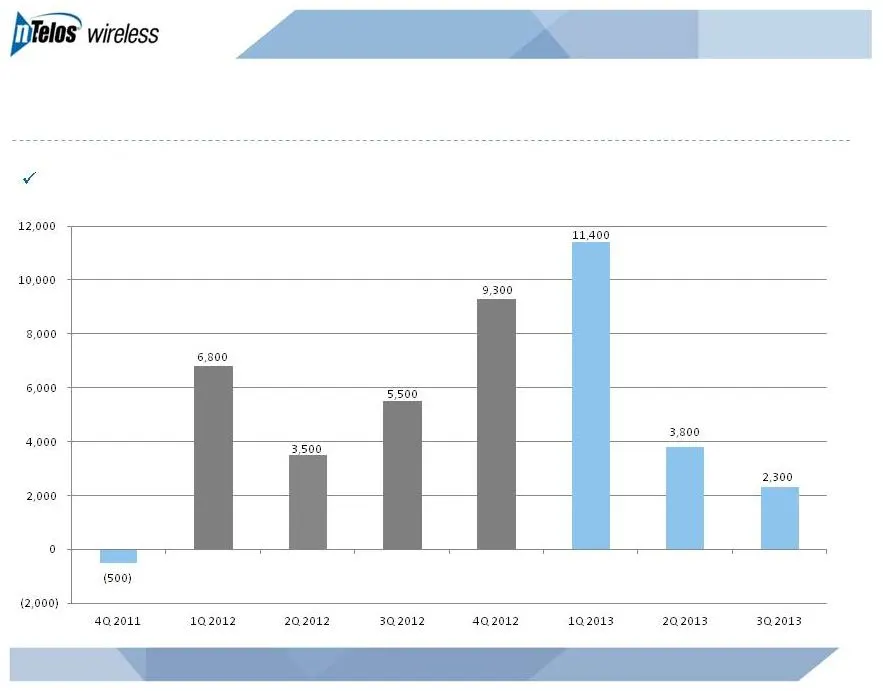
NASDAQ: NTLS Retail Revenue Gains Continue millions Subscriber revenue growth continues: 7 straight quarters of sequential growth 7 straight quarters of positive net adds 3Q13 retail revenue increased 2% sequentially and 13% from 3Q12 to $80.3 million Highest level in company history +13%
Slide 10: NTELOS Branding Resonating With Consumers
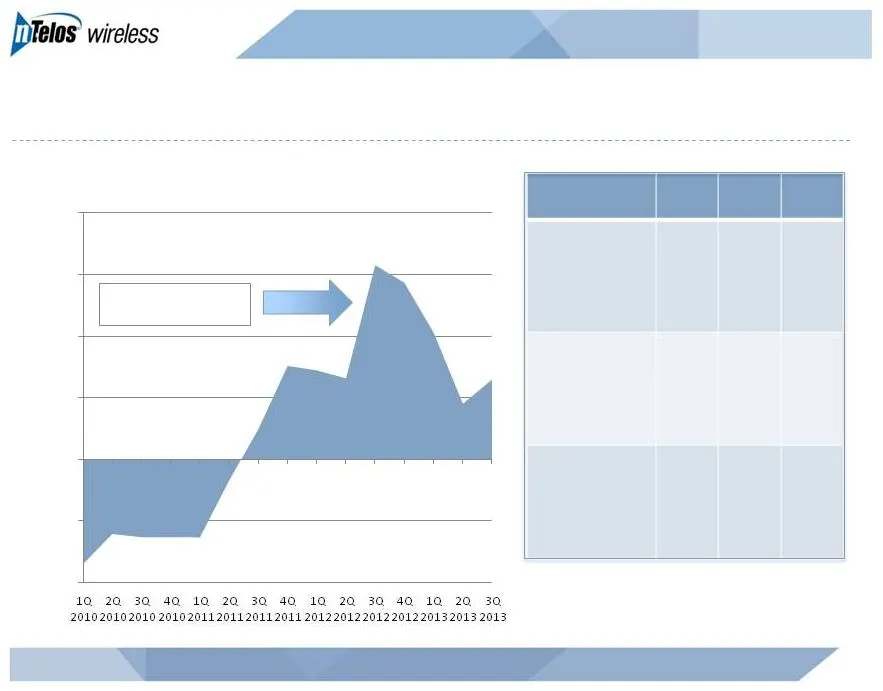
NASDAQ: NTLS 3Q11 3Q12 3Q13 NTELOS Branding Resonating With Consumers Source: Independent third-party research studies. Positive net ports vs. all other carriers Unaided Awareness Unaided Recall Purchase Consideration 18% 28% 29% 12% 21% 13% 24% 32% 31% (4,000) (2,000) 2,000 4,000 6,000 8,000 Net Po
Slide 11: Churn Remains Stable
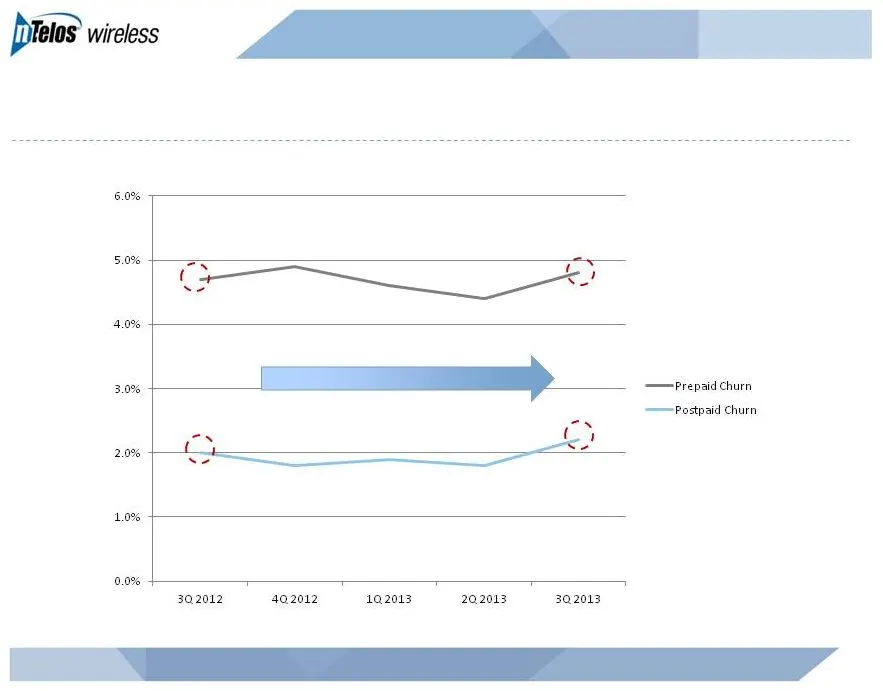
NASDAQ: NTLS Churn Remains Stable
Slide 12: Subscribers – Net Additions Trend
NASDAQ: NTLS Subscribers – Net Additions Trend Seventh consecutive quarter of positive net adds
Slide 13: Smartphone Penetration
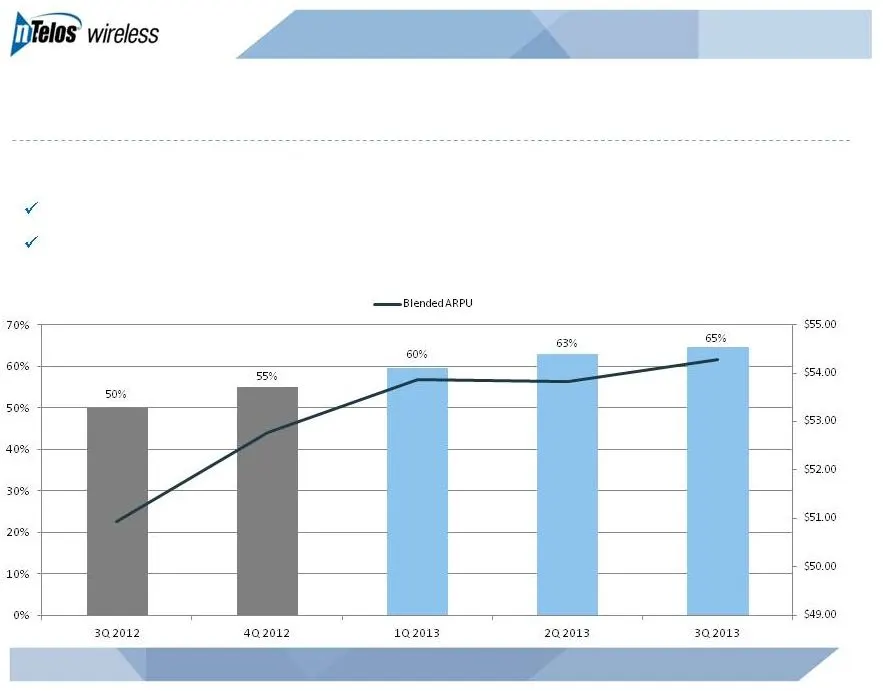
NASDAQ: NTLS Smartphone Penetration As of September 30, 2013: Smartphone Penetration ARPU 69% of postpaid subscribers have a smartphone 57% of prepaid subscribers have a smartphone
Slide 14: Closing the Device Gap on Competition
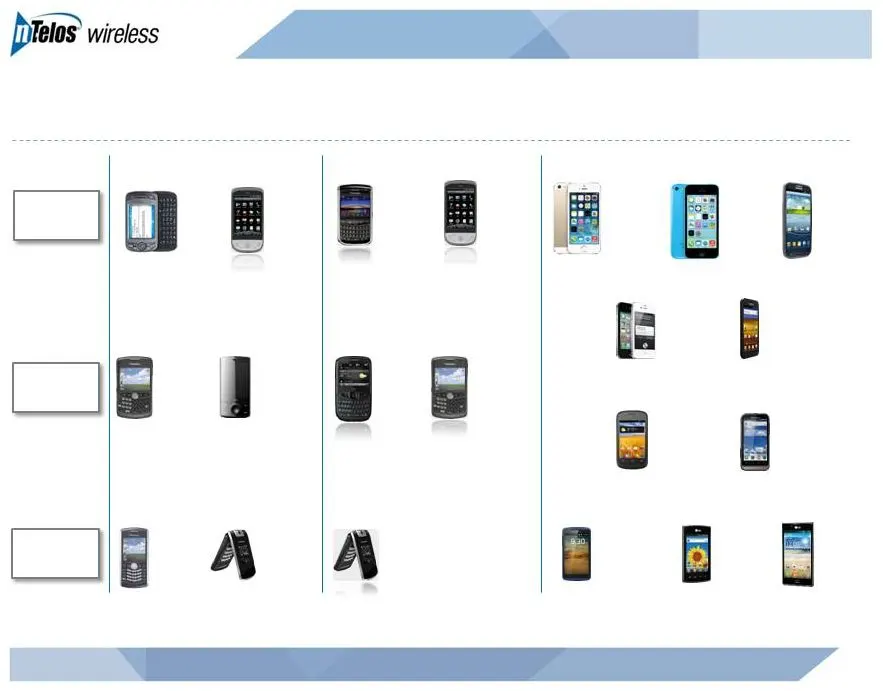
NASDAQ: NTLS Closing the Device Gap on Competition Best Q4 2009 Q4 2010 Q4 2013 Better Good LG Optimus Plus Motorola Defy XT Alcatel One Touch Ultra ZTE Director Samsung Galaxy S II Samsung Galaxy III LG Optimus Select iPhone 4S iPhone 5c BlackBerry Curve 8330 BlackBerry Pearl Flip HTC Hero Android

Slide 15: Network Overview and LTE Deployment
NASDAQ: NTLS • 6.0mm covered POPs; 7.96mm licensed POPs • 100% of covered POPs are served with 3G EV-DO Rev. A • Primarily Alcatel Lucent equipment • 1,432 cell sites deployed • Market level spectrum holdings ranging from 10 MHz to 50 MHz • PCS average depth of 23 MHz • AWS average depth of 20 MHz •
Slide 16: Sprint Strategic Network Alliance Evolution
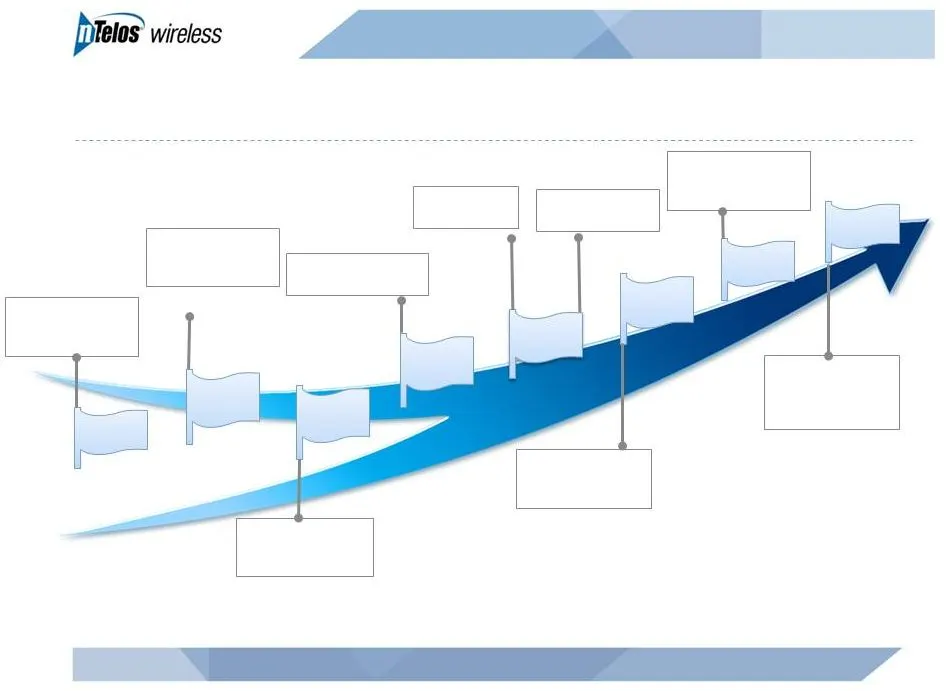
NASDAQ: NTLS Sprint Strategic Network Alliance Evolution 8/1999: Agreement with Horizon PCS (Sprint affiliate) 9/2013: Settles disputes with Sprint and amends agreement 10/2006: Sprint launches EV-DO Rev A in San Diego 10/2010: Sprint announces Network Vision 8/2004: Horizon bankruptcy; Sprint agree
Slide 17: Sprint Strategic Network Alliance Service
NASDAQ: NTLS Exclusively provides 3G services to large number of Sprint home and travel subscribers • Agreement through July 2015, subject to renewal options • Sprint prohibited from beginning 3G overbuild until February 1, 2014 • Covers portions of WV and Western Virginia territories Encompasses ap

Slide 18: Financial Summary
Financial Summary
Slide 19: Historical Financial Performance
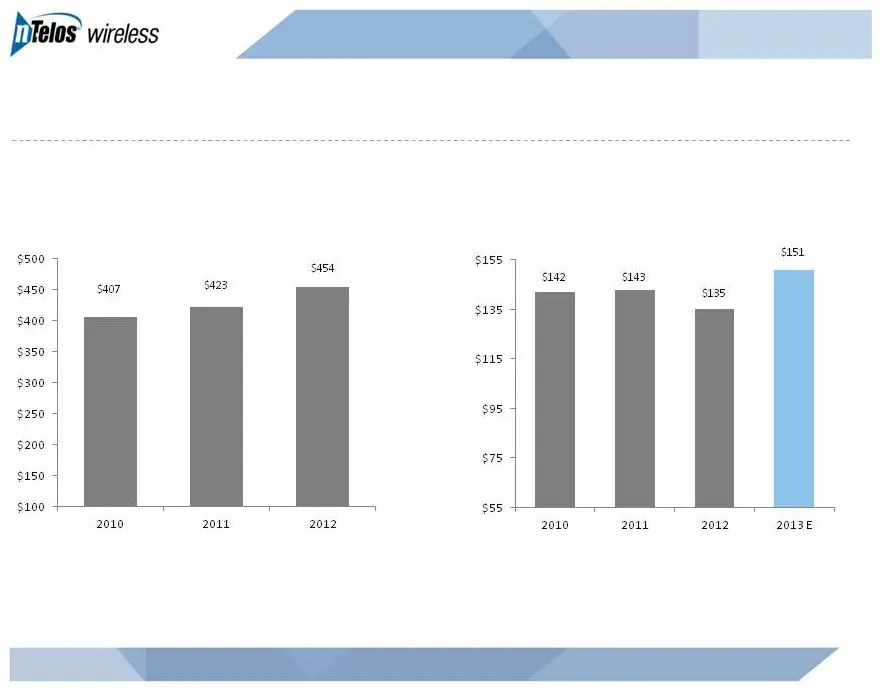
NASDAQ: NTLS Historical Financial Performance Revenue Adjusted EBITDA millions millions (1) Preliminary estimate as of January 13, 2014 (1)
Slide 20: Capital Investment
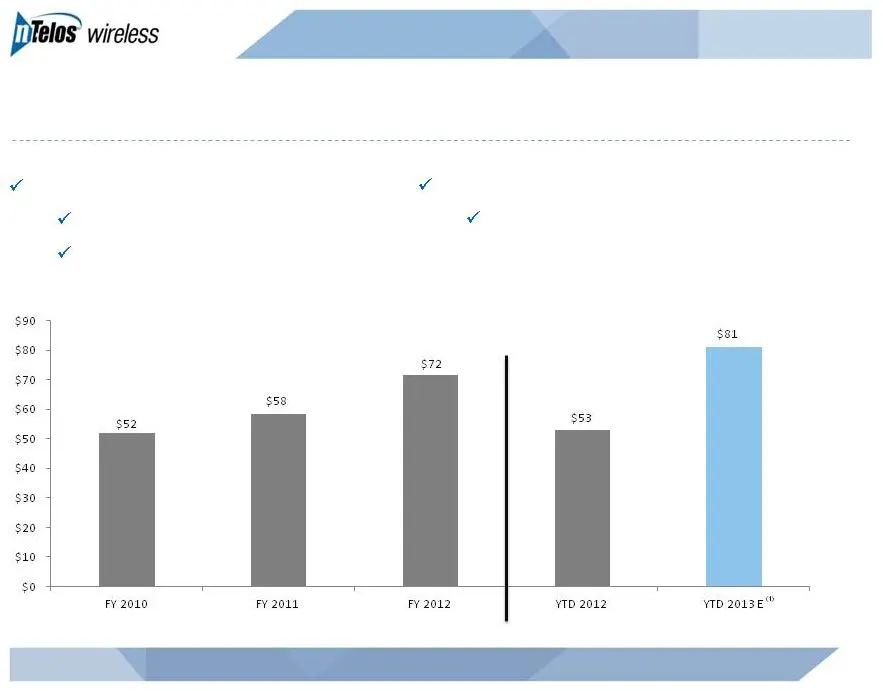
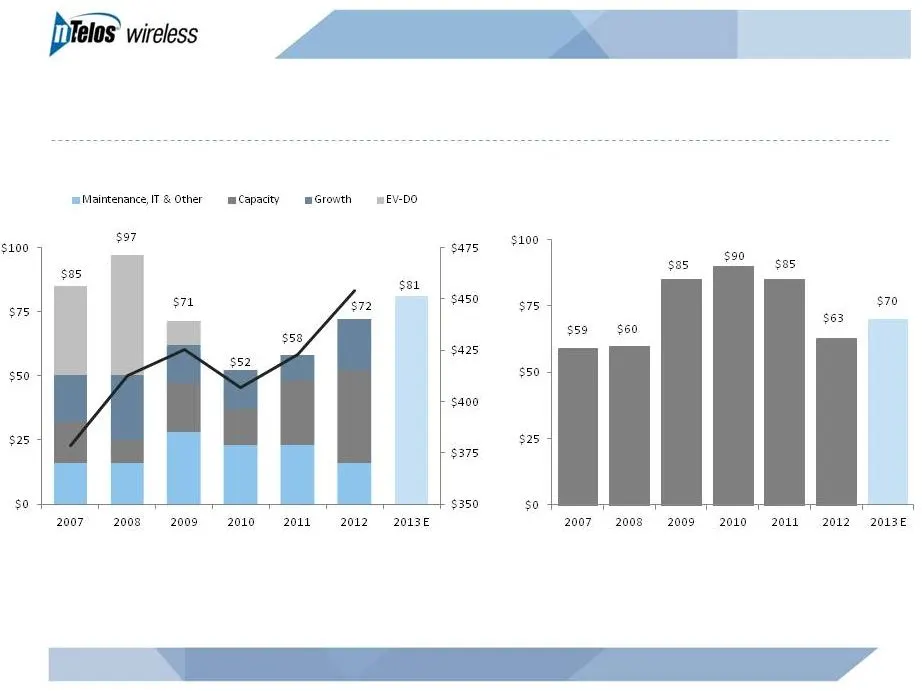
NASDAQ: NTLS Capital Investment Status: 1,434 cell sites as of Sept. 30, 2013 millions Catalysts: 2011-2012 Cell site expansion 2013 Initial LTE deployment (1) Preliminary estimate as of January 13, 2014
Slide 21: Managing Free Cash Flow with Disciplined Capital Investment
NASDAQ: NTLS Managing Free Cash Flow with Disciplined Capital Investment CapEx millions millions CapEx Free Cash Flow (Adjusted EBITDA Less CapEx) (1) Preliminary estimate as of January 13, 2014 Note: Excludes wireline and related capex incurred prior to business separation Revenue Revenue millions
Slide 22

Slide 23
Slide 24: 2013 Preliminary Financial Results and 2014 Guidance
NASDAQ: NTLS 2013 Preliminary Financial Results and 2014 Guidance 2012A Preliminary Guidance Adjusted EBITDA $135mm $151mm $140 to $150mm CapEx $72mm $81mm $85 to $95mm (1) Includes $9.6 million one-time benefit in connection with the Sprint Strategic Network Alliance dispute settlement (1)
Slide 25: Senior Executives—Wireless Veterans
JIM HYDE CEO, President and Director STEB CHANDOR EVP, CFO and Treasurer CONRAD HUNTER EVP, COO Former CEO, T-Mobile UK Former T-Mobile USA / Western Wireless / VoiceStream Sr. Exec 18 years industry experience Former CFO, iPCS Wireless Former CFO, Metro One Telecommunications 17 years industry expe
Slide 26: Summary
Leading “pure-play” regional wireless company Strategic asset set Strong free cash flow Broad geographic and network technology footprint Experienced management team NASDAQ: NTLS Competitive and diversified business model Summary

Slide 27: NTELOS wireless
Telos wireless
Slide 28: Reconciliation of Net Income to Adjusted EBITDA
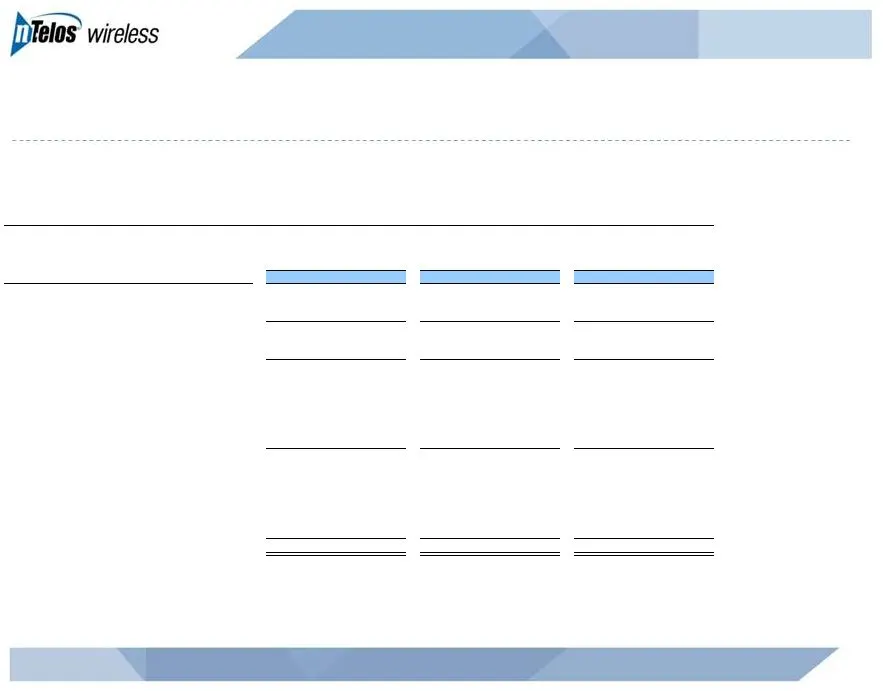
NASDAQ: NTLS NTELOS Holdings Corp. Reconciliation of Net Income Attributable to NTELOS Holdings Corp. to Adjusted EBITDA Year Ended: (In thousands) Net Income Attributable to NTELOS Holdings Corp. 18,387 $ (23,715) $ 44,808 $ Net income attributable to noncontrolling interests 1,941 (1,769) (1,417)
Slide 29: Reconciliation of Net Income to Adjusted EBITDA (Quarterly)
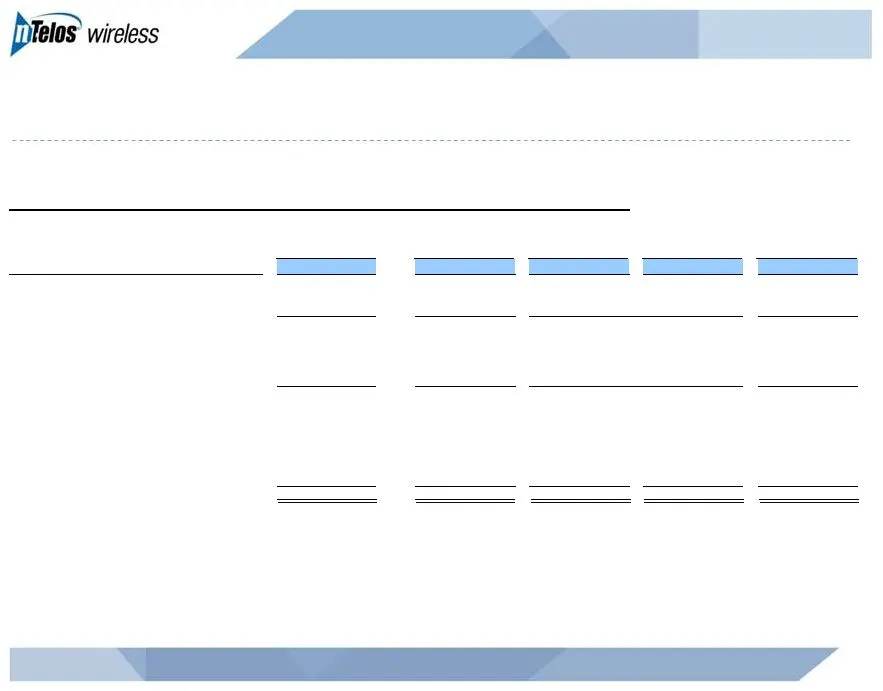
NASDAQ: NTLS NTELOS Holdings Corp. Reconciliation of Net Income Attributable to NTELOS Holdings Corp. to Adjusted EBITDA (In thousands) 3Q13 2Q13 1Q13 4Q12 3Q12 Net Income Attributable to NTELOS Holdings Corp. 10,583 $ 9,386 $ 5,493 $ $ 4,608 $ Net income attributable to noncontrolling interests Net

Slide 30: ARPU Reconciliation
NASDAQ: NTLS NTELOS Holdings Corp. ARPU Reconciliation Average Monthly Revenue per User (ARPU) ¹ 3Q13 2Q13 1Q13 4Q12 3Q12 FY 2012 FY 2011 (In thousands, except for subscribers and ARPU) Operating Revenues 130,912 $ 119,859 $ 119,345 $ 117,398 $ 114,466 $ 453,989 $ 422,629 $ Less: Equipment revenue f
Source: SEC EDGAR · 8-K filed Jan 14, 2014
More decks from Ntelos Inc
 Q2 2015 Earnings Presentation21 slides · Jul 28, 2015
 Q1 2015 Earnings Presentation25 slides · May 1, 2015
 Q4 2014 Earnings Presentation26 slides · Feb 26, 2015
 Investor Presentation (December 2014)24 slides · Dec 10, 2014
 Corporate Update (December 2014)27 slides · Dec 2, 2014
 Q3 2014 Earnings Presentation24 slides · Oct 31, 2014