National Health Investors, Inc. · NYSE:NHI
National Health Investors — Jefferies presentation, June 5, 2013
19 slides from National Health Investors's conference presentation, Jun 4, 2013
Slide 1: Driving Shareholder Value Through Selective Growth
Driving Shareholder Value Through Selective Growth National Health Investors NYSE: NHI NATIONAL HEALTI INVESTORS

Slide 2: Forward-looking statements disclaimer
These slides accompany an oral presentation by National Health Investors, Inc., which contains forward-looking statements that are based on current expectations, estimates, our beliefs and assumptions. Words such as “anticipates, ” “expects,” “intends,” “plans,” “believes,” “seeks,” and “estimates”
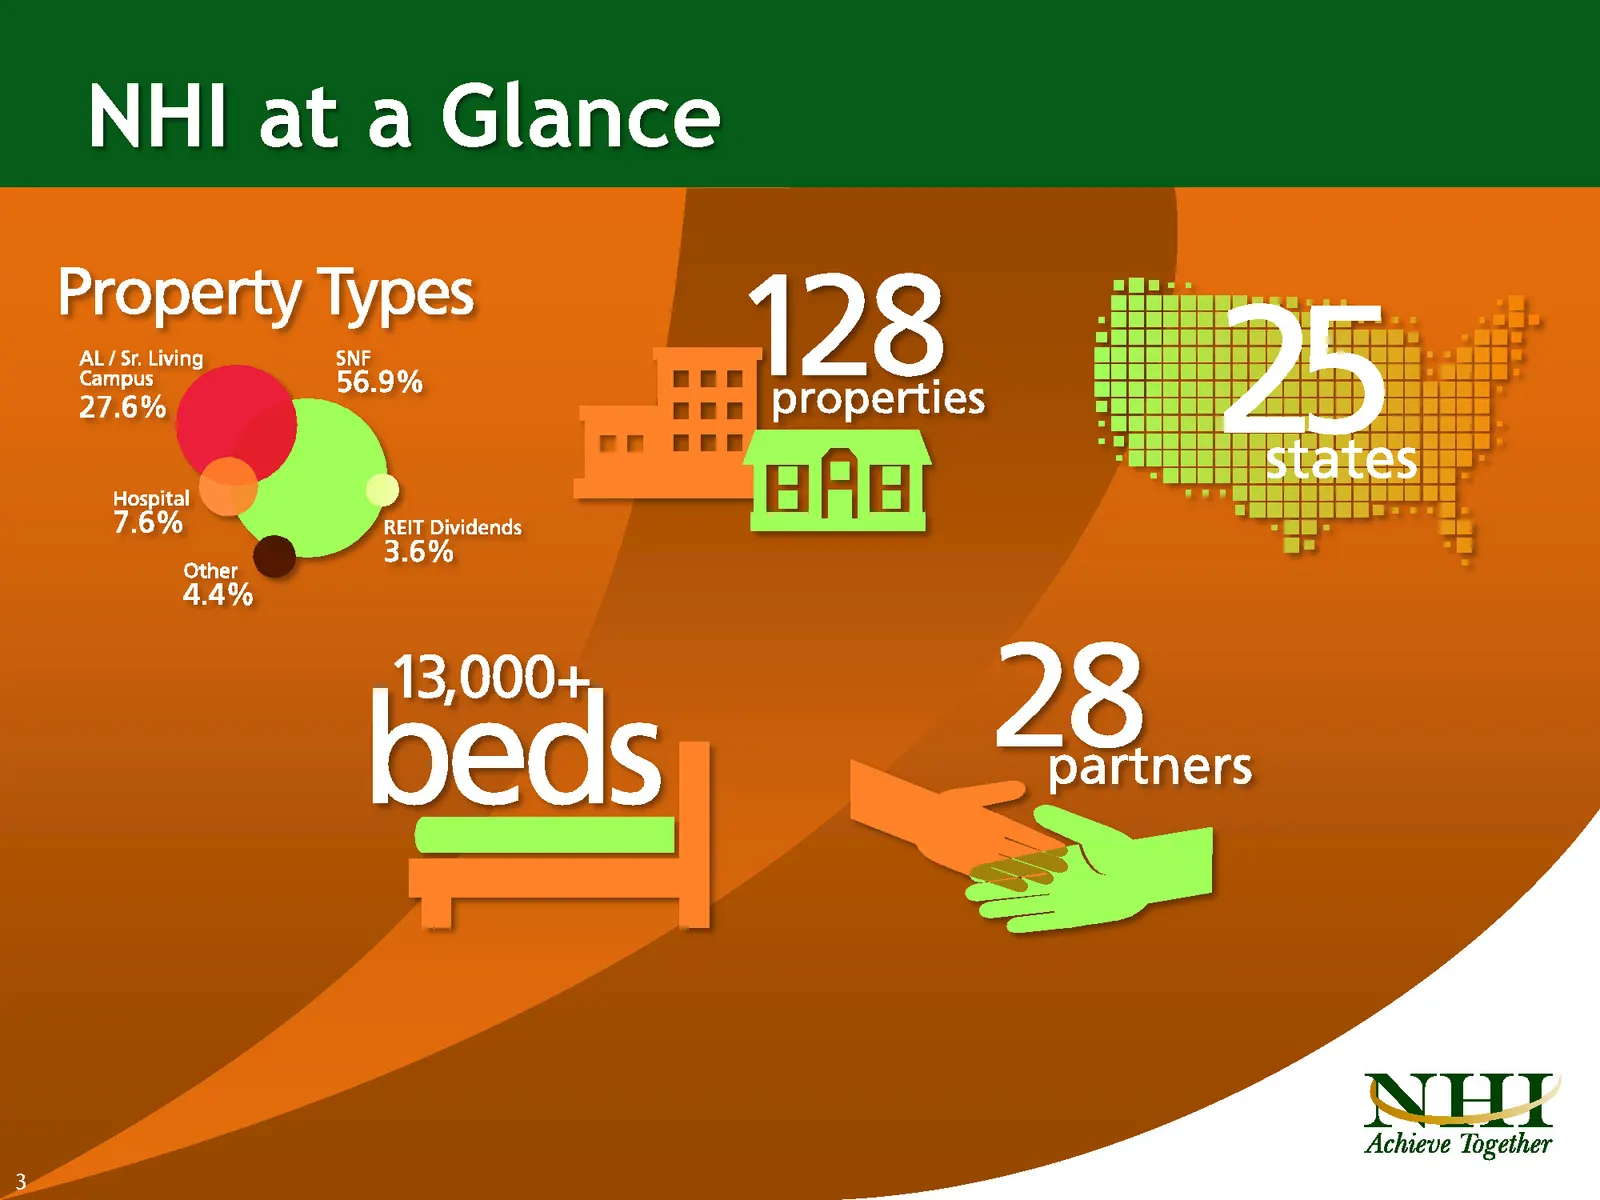
Slide 3: Property Types
Property Types 128 ties BE Oy 27.6% ete TT AZO. nnO Hospital 7.6% >. Dividends Other 3.6% 44% partners > Osc Qs O- Nn NJ
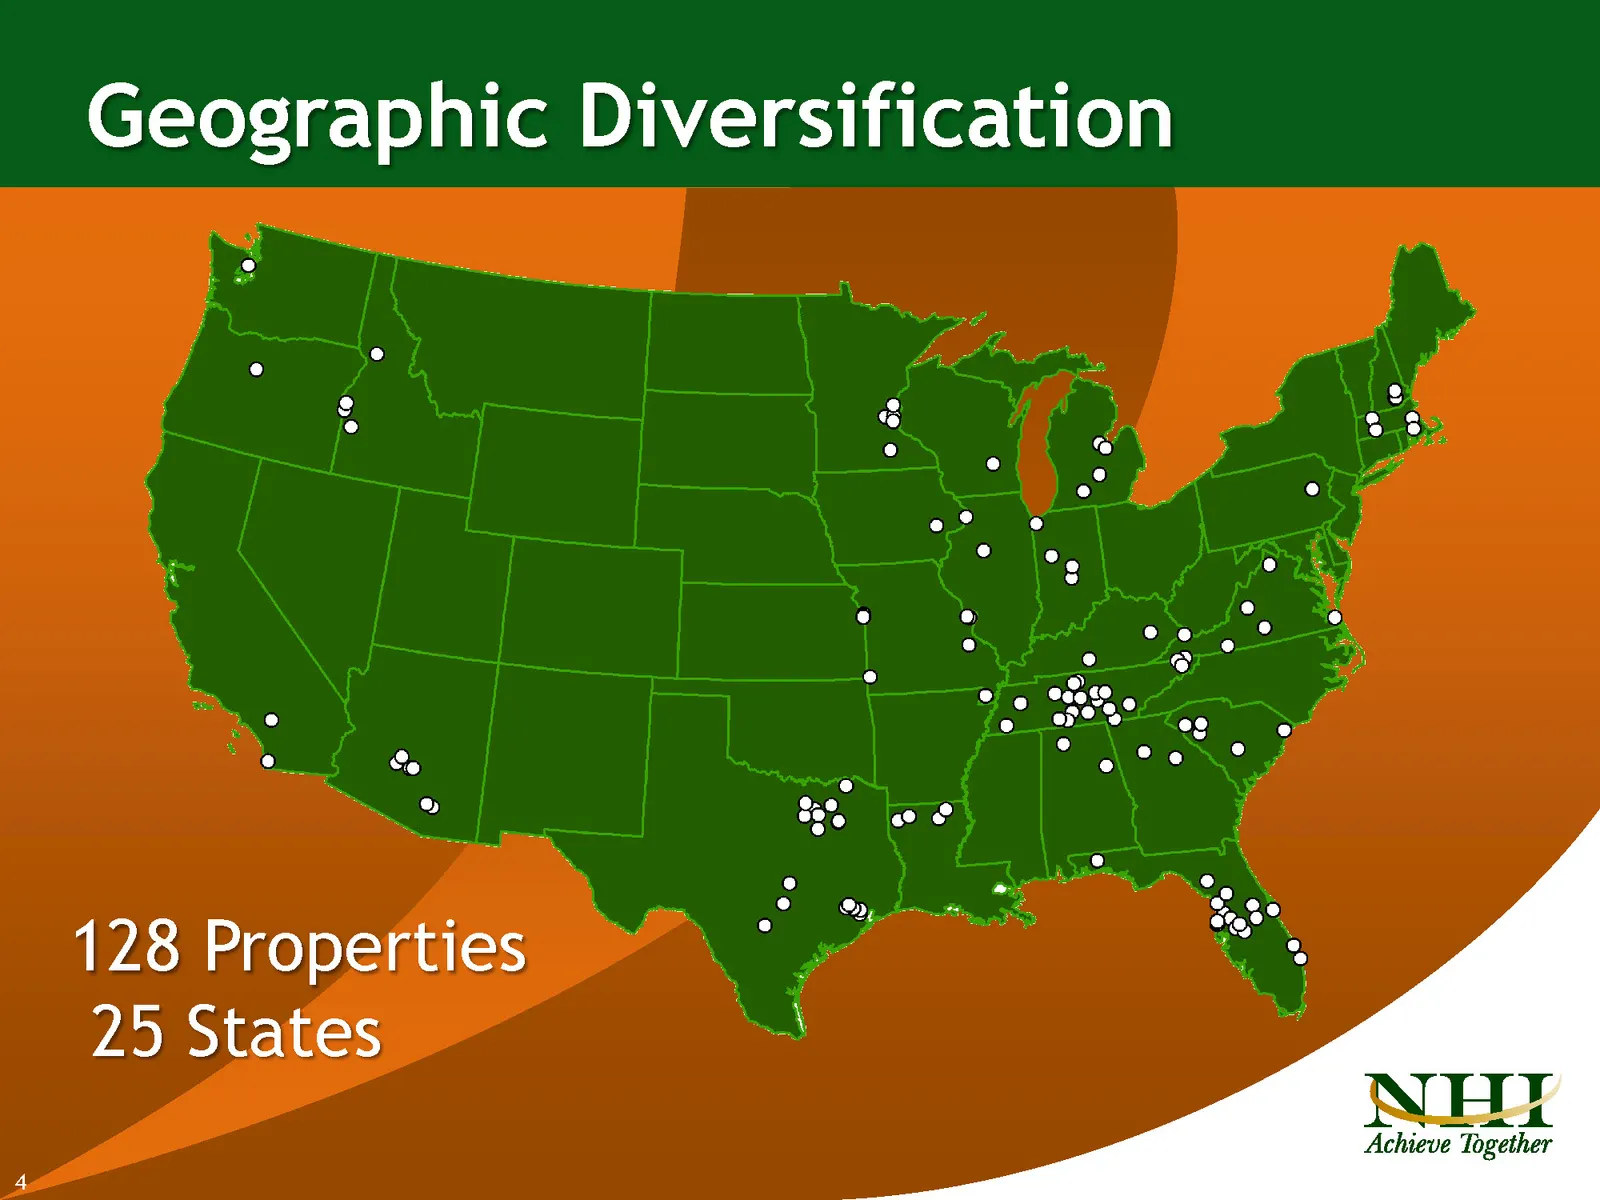
Slide 4: Geographic Diversification Properties States
Geographic Diversification 128 Properties 25 States Achieve Together
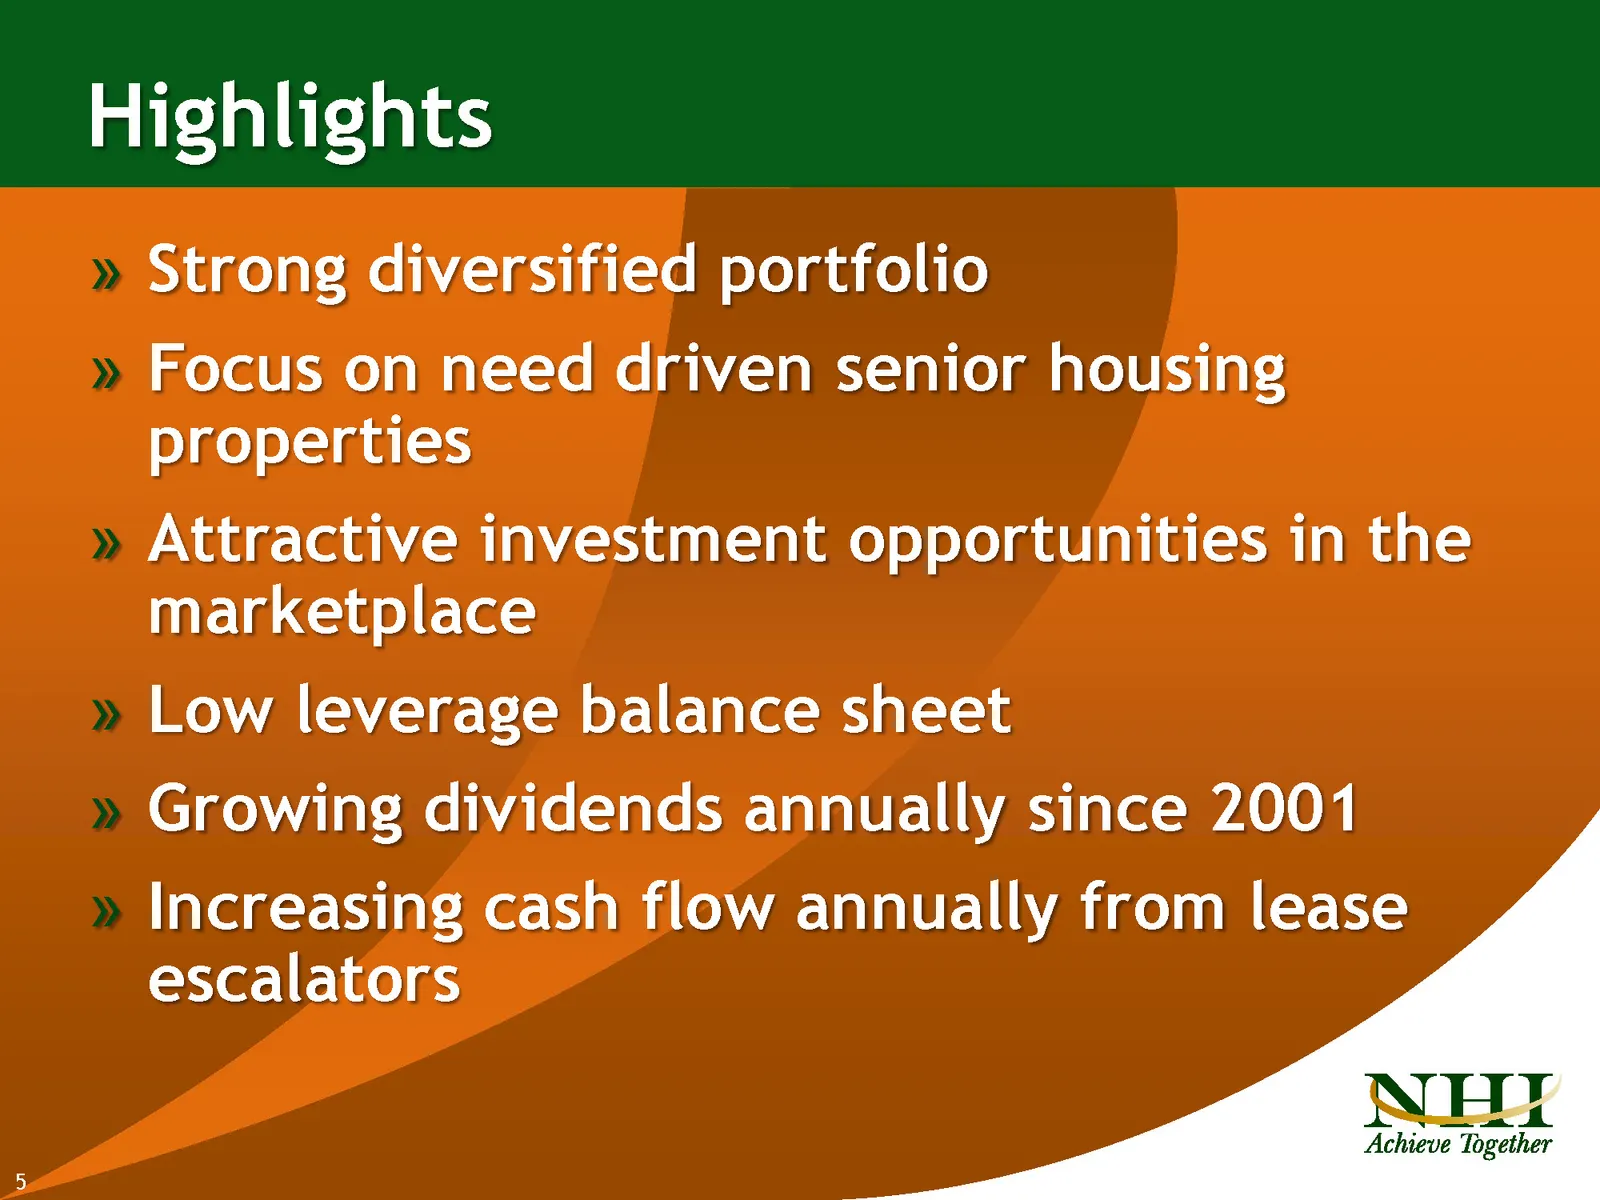
Slide 5: Strong diversified portfolio
~ Strong diversified portfolio ~ Focus on need driven senior housing properties ~ Attractive investment opportunities in the marketplace _ Low leverage balance sheet ~ Growing dividends annually since 2001 ~ Increasing cash flow annually from lease escalators
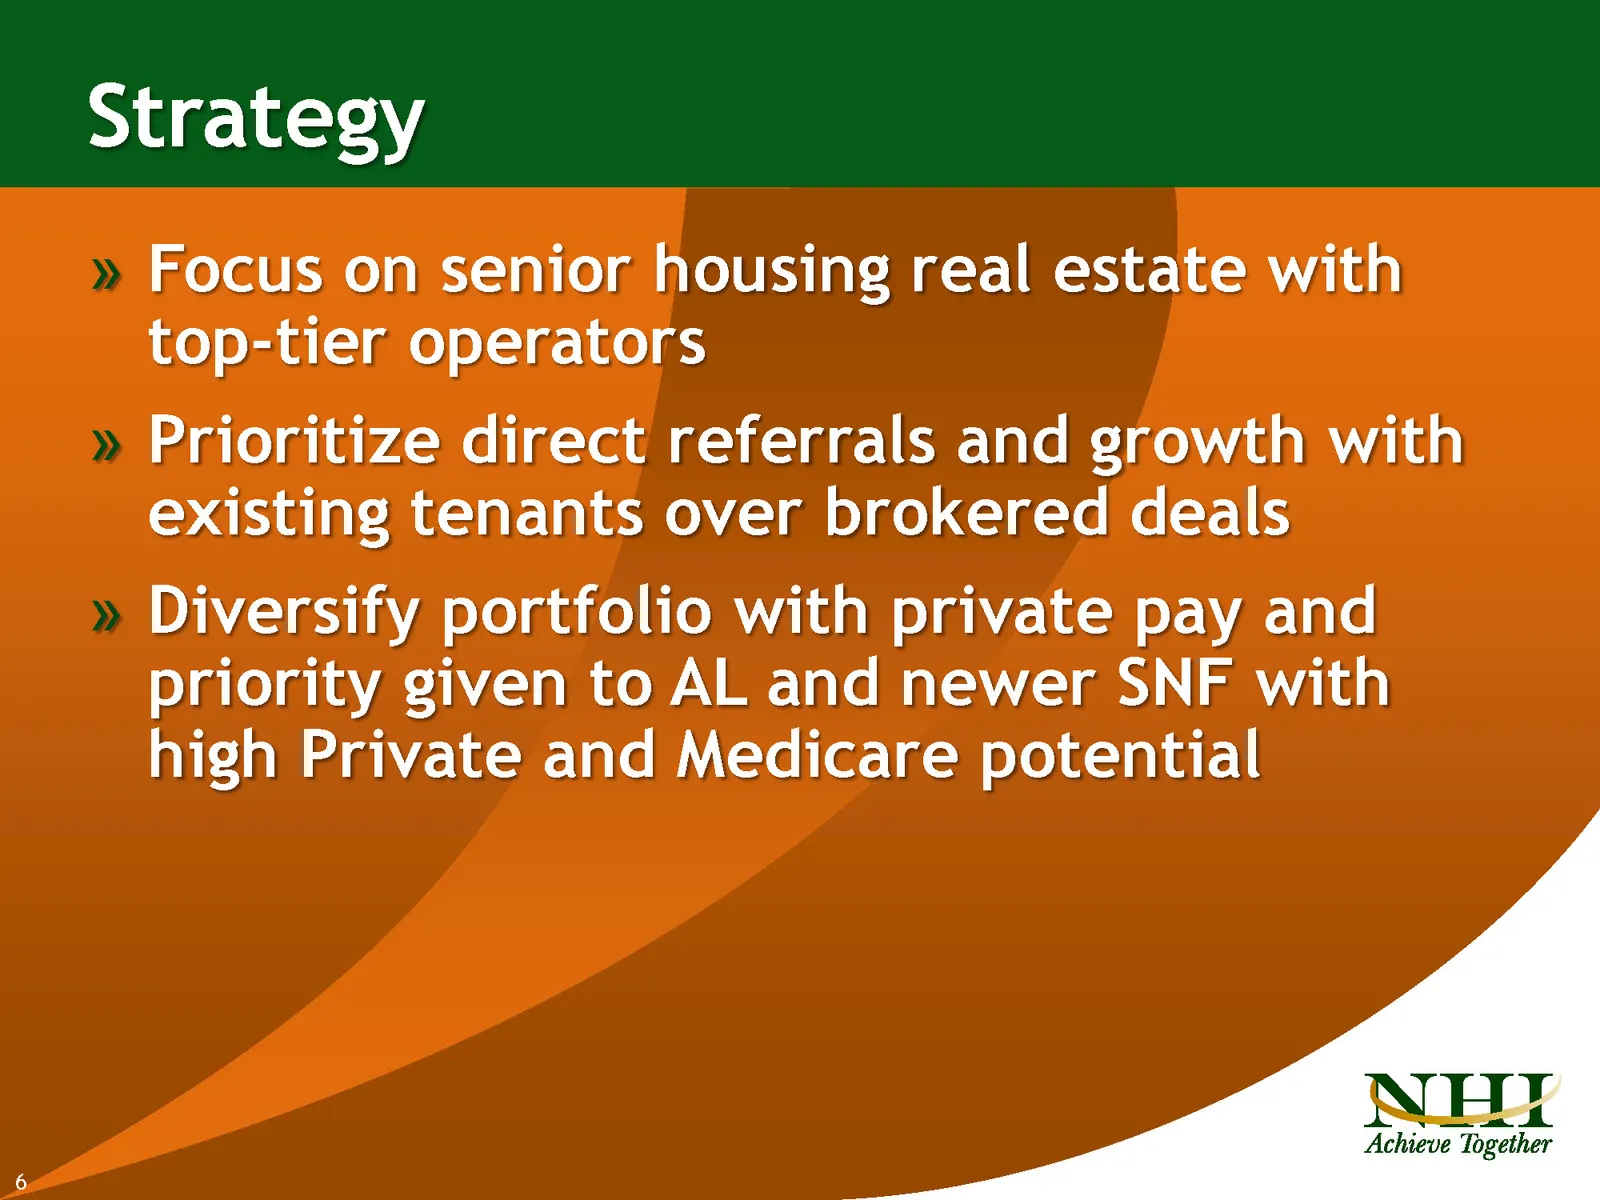
Slide 6: Focus on senior housing real estate with top-tier operators
~ Focus on senior housing real estate with top-tier operators ~ Prioritize direct referrals and growth with existing tenants over brokered deals ~ Diversify portfolio with private pay and priority given to AL and newer SNF with high Private and Medicare potential
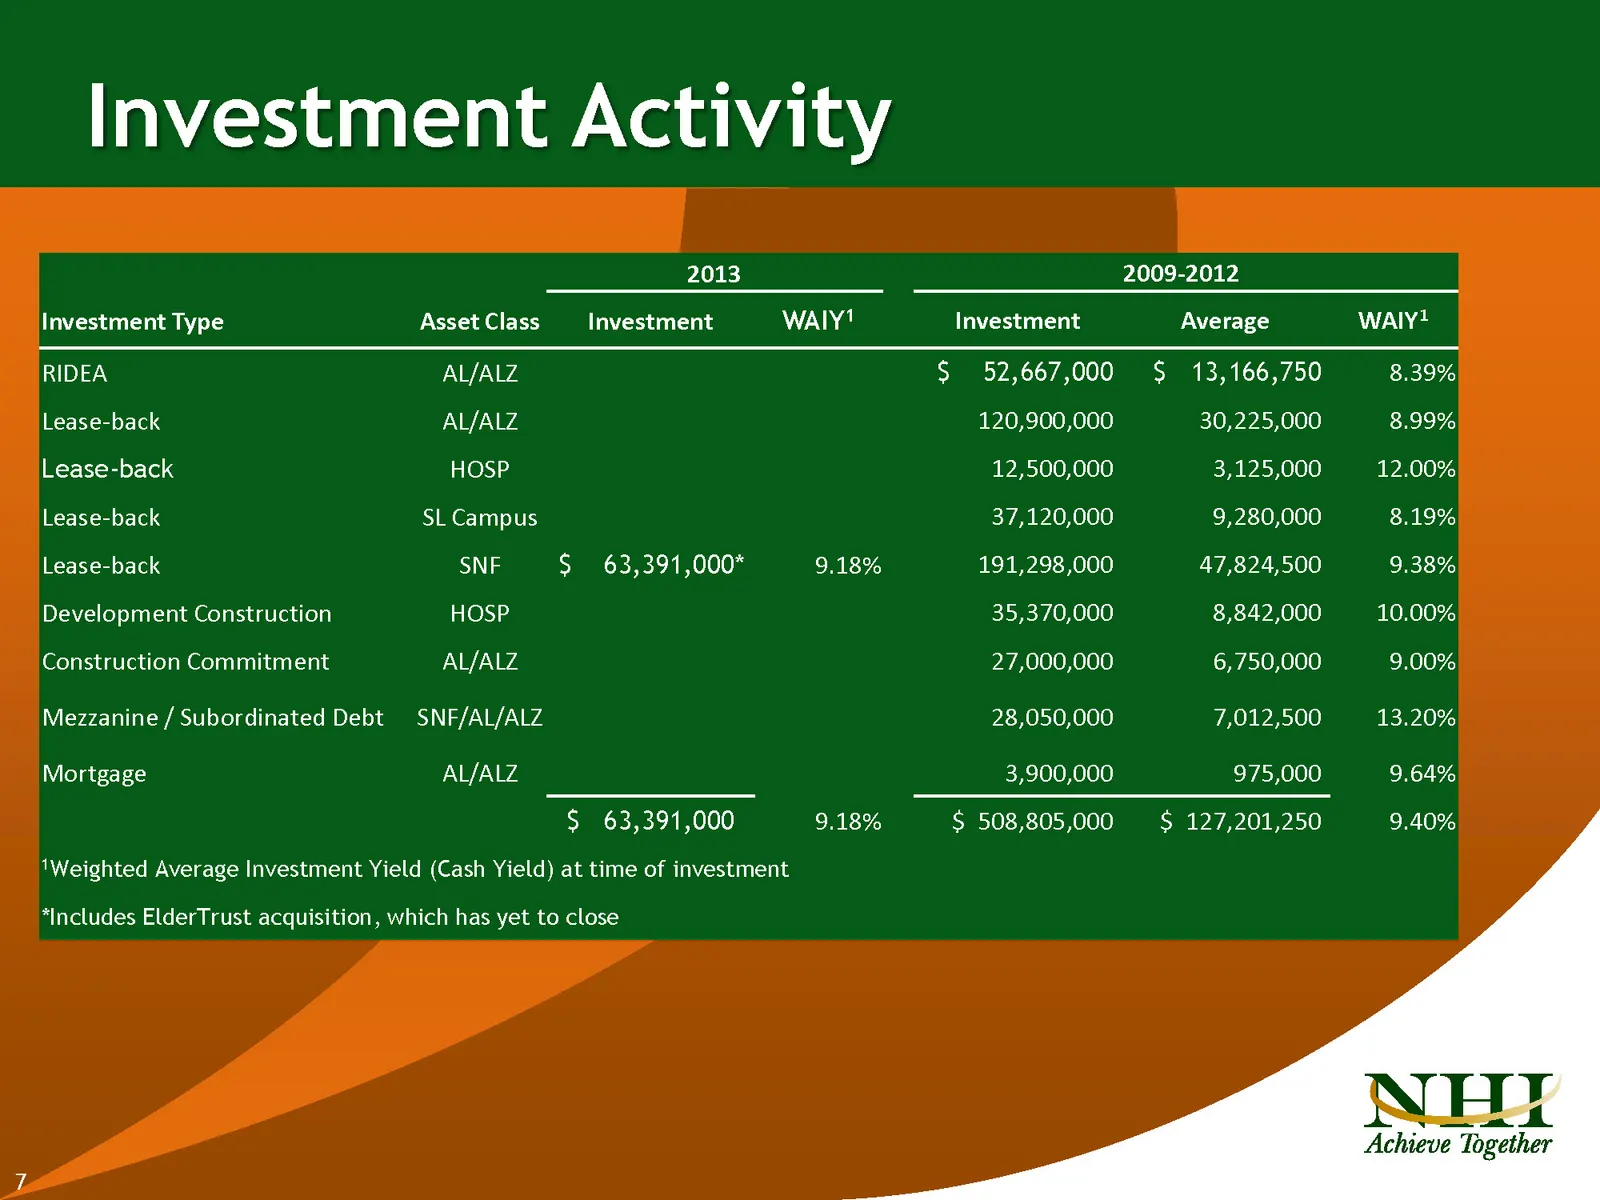
Slide 7: Investment Activity
Investment Activity 2013 2009-2012 Investment Type Asset Class Investment WAIY! Investment Average Waly! RIDEA AL/ALZ $ 52,667,000 $ 13,166,750 8.39% Lease-back AL/ALZ 120,900,000 30,225,000 8.99% Lease-back HOSP 12,500,000 3,125,000 12.00% Lease-back SL Campus 37,120,000 9,280,000 8.19% Lease-back
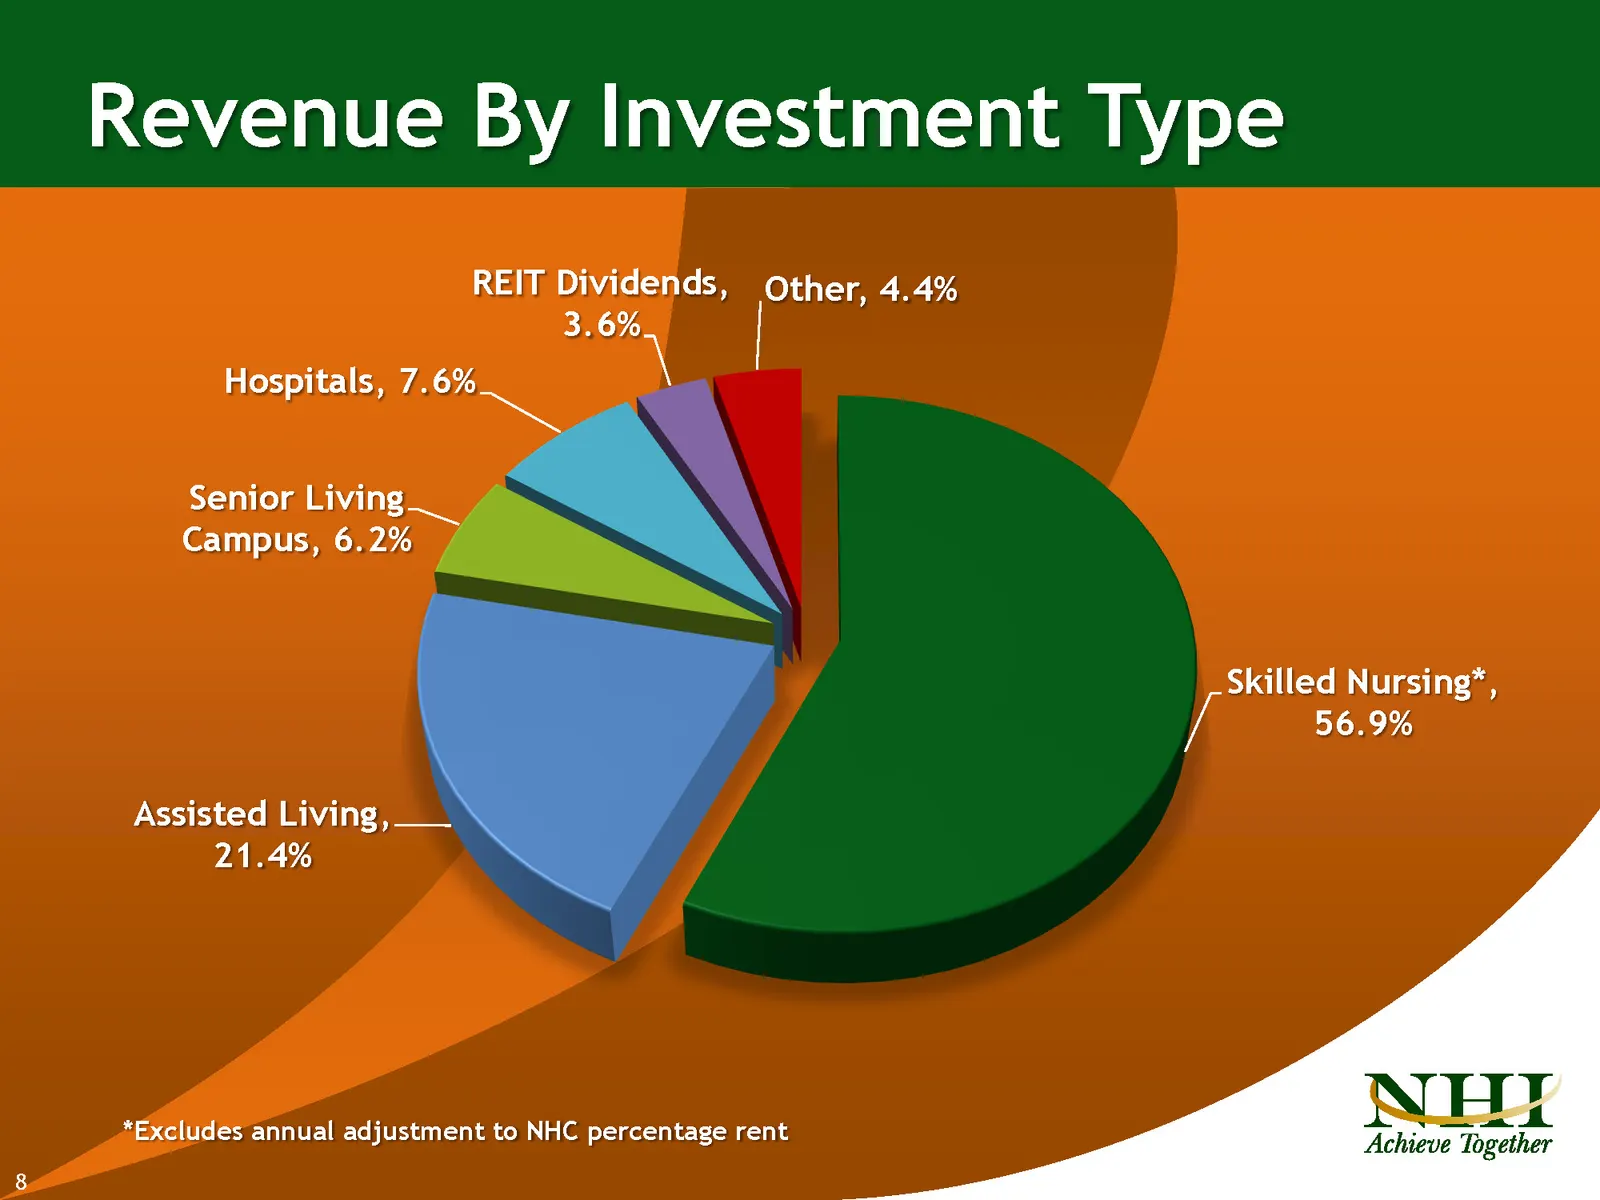
Slide 8: Revenue By Investment Type
Revenue By Investment Type REIT Dividends, Other, 4.4% ee | Hospitals, 7.6% Senior Living Campus, SN Assisted Living, 21.4% Skilled Nursing”, [36.9% NH Achieve Together *Excludes annual adjustment to NHC percentage rent
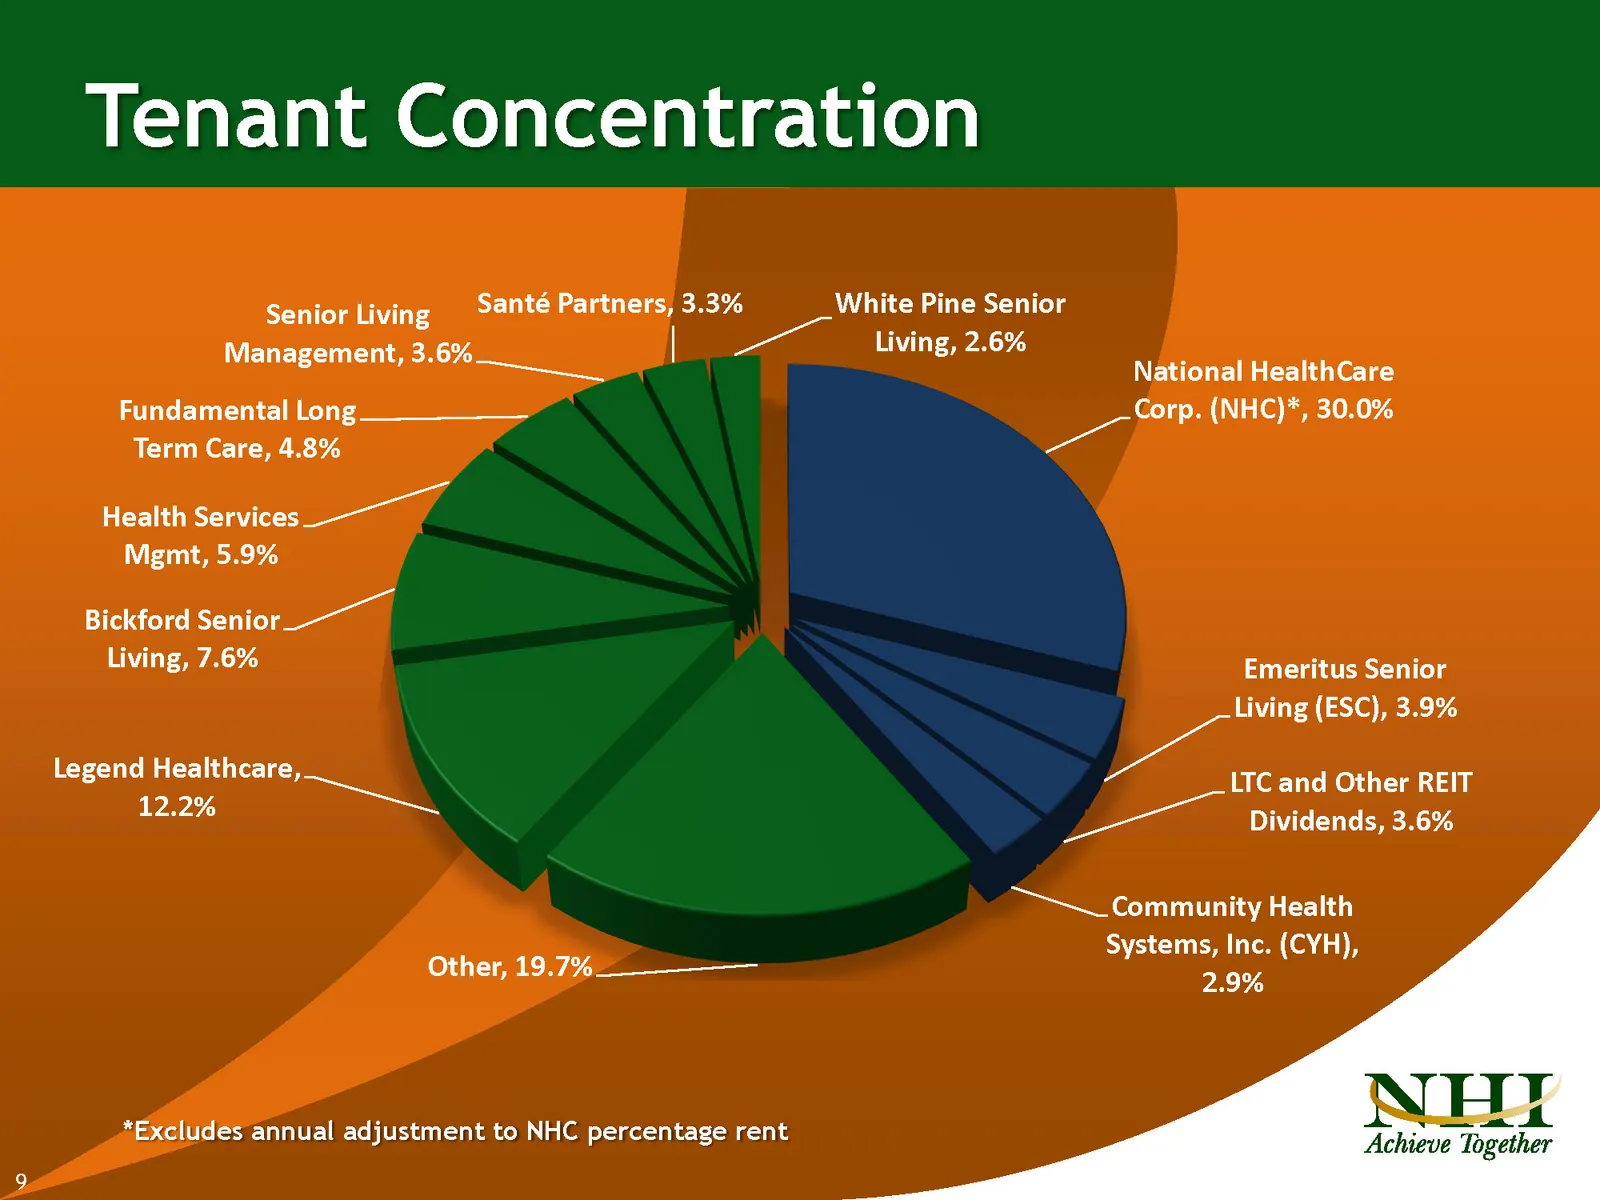
Slide 9: Tenant Concentration
Tenant Concentration Senior Living Santé Partners, 3.3% Management, 3.6% | Fundamental Long Term Care, 4.8% Health eee A Mgmt, 5.9% Bickford nie Living, 7.6% Legend Healthcare, 12.2% Ss Other, 19.7%__»____ *Excludes annual adjustment to NHC percentage rent White Pine Senior Living, 2.6% National Hea
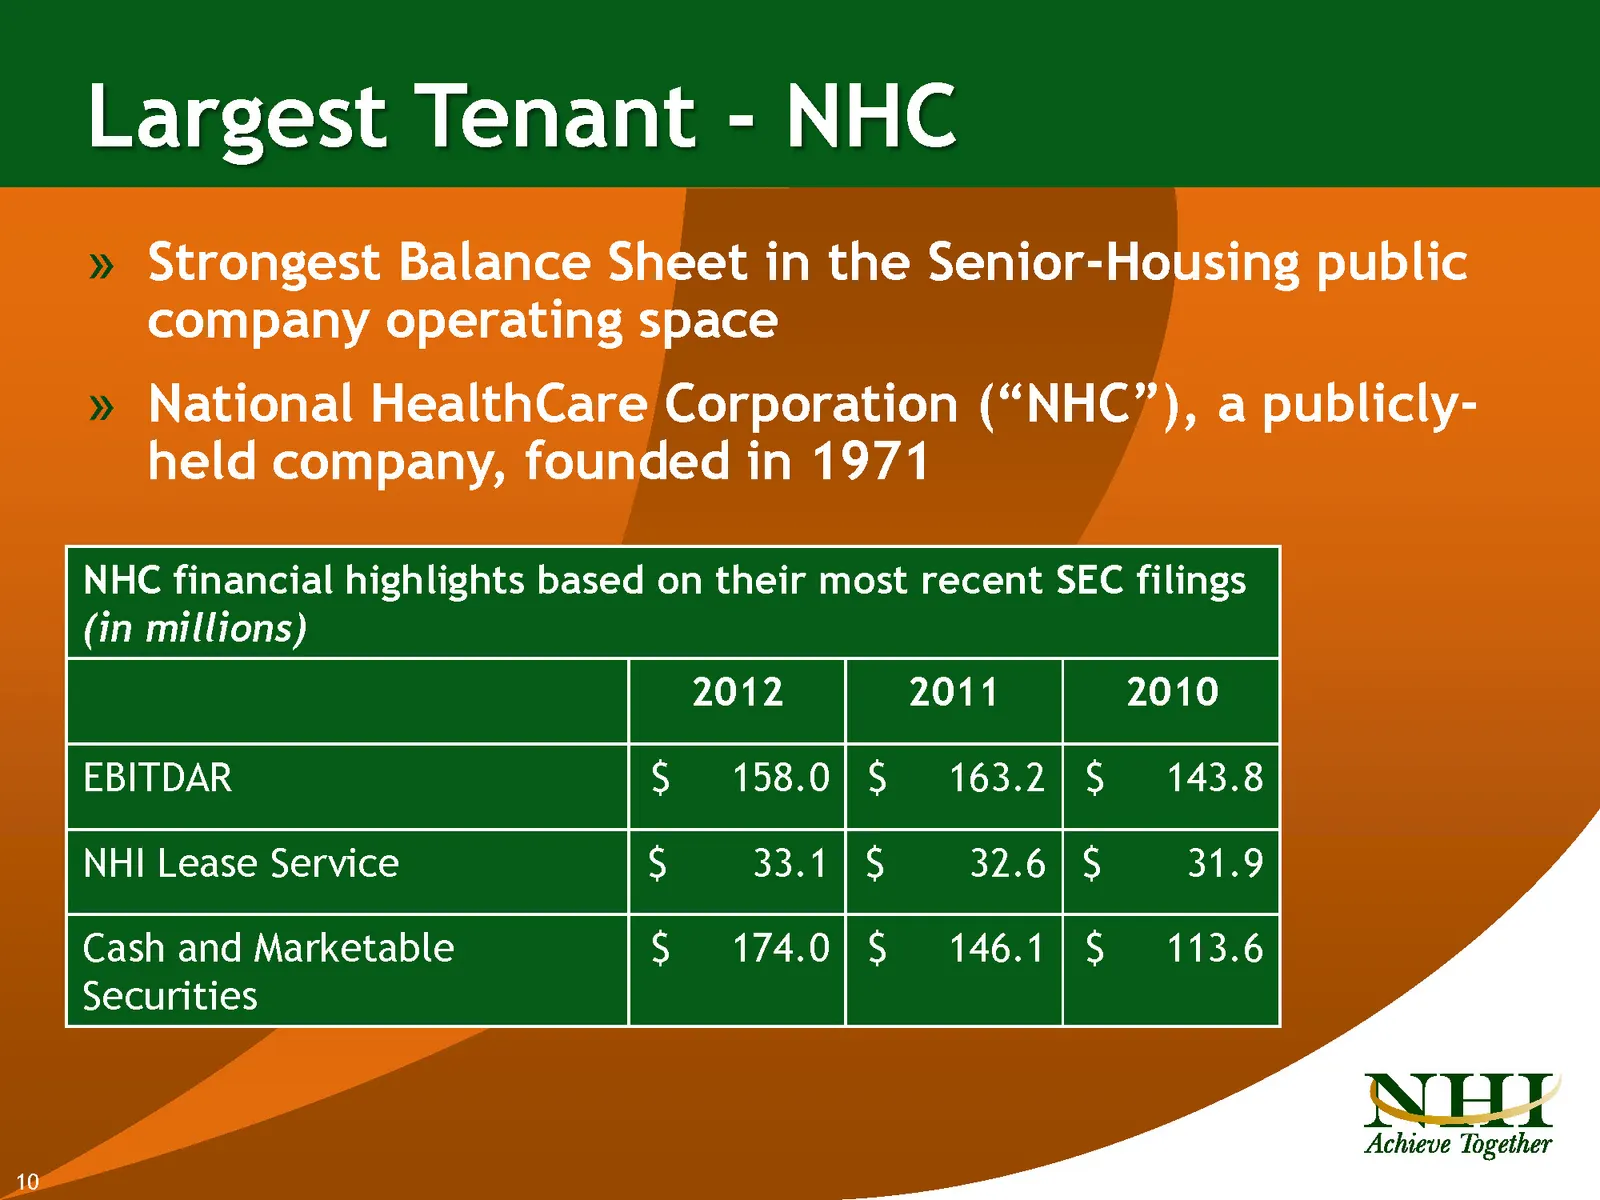
Slide 10: Largest Tenant - NHC
Largest Tenant - NHC Strongest Balance Sheet in the Senior-Housing public company operating space National HealthCare Corporation (“NHC”), a publicly- held company, founded in 1971 NHC financial highlights based on their most recent SEC filings (in millions) 2012 2011 EBITDAR § 158.0]$ 163.2] $ NHI
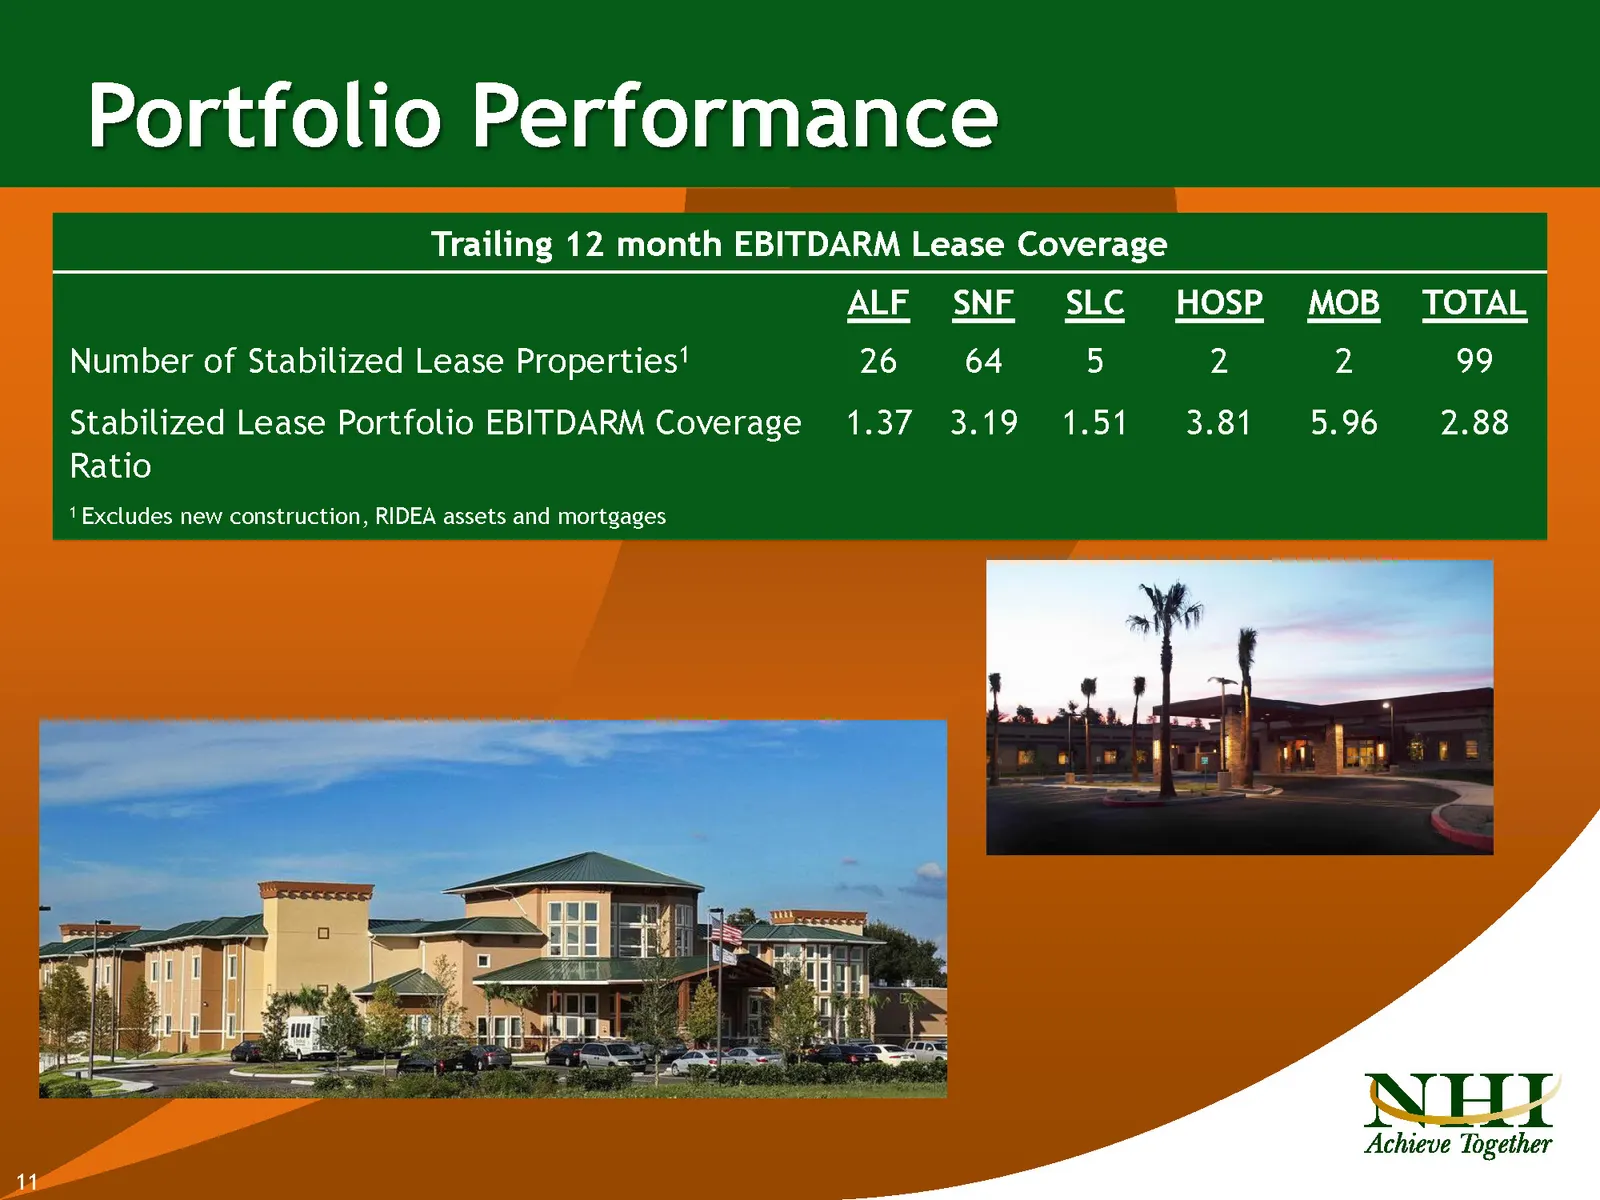
Slide 11: Portfolio Performance
Portfolio Performance Trailing 12 month EBITDARM Lease Coverage ALF SNF SLC HOSP MOB TOTAL Number of Stabilized Lease Properties! 26 64 5) 2 2 99 Stabilized Lease Portfolio EBITDARM Coverage 1.37 3.19 1.51 3.81 5.96 2.88 Ratio 1 Excludes new construction, RIDEA assets and mortgages NH Achieve Togeth
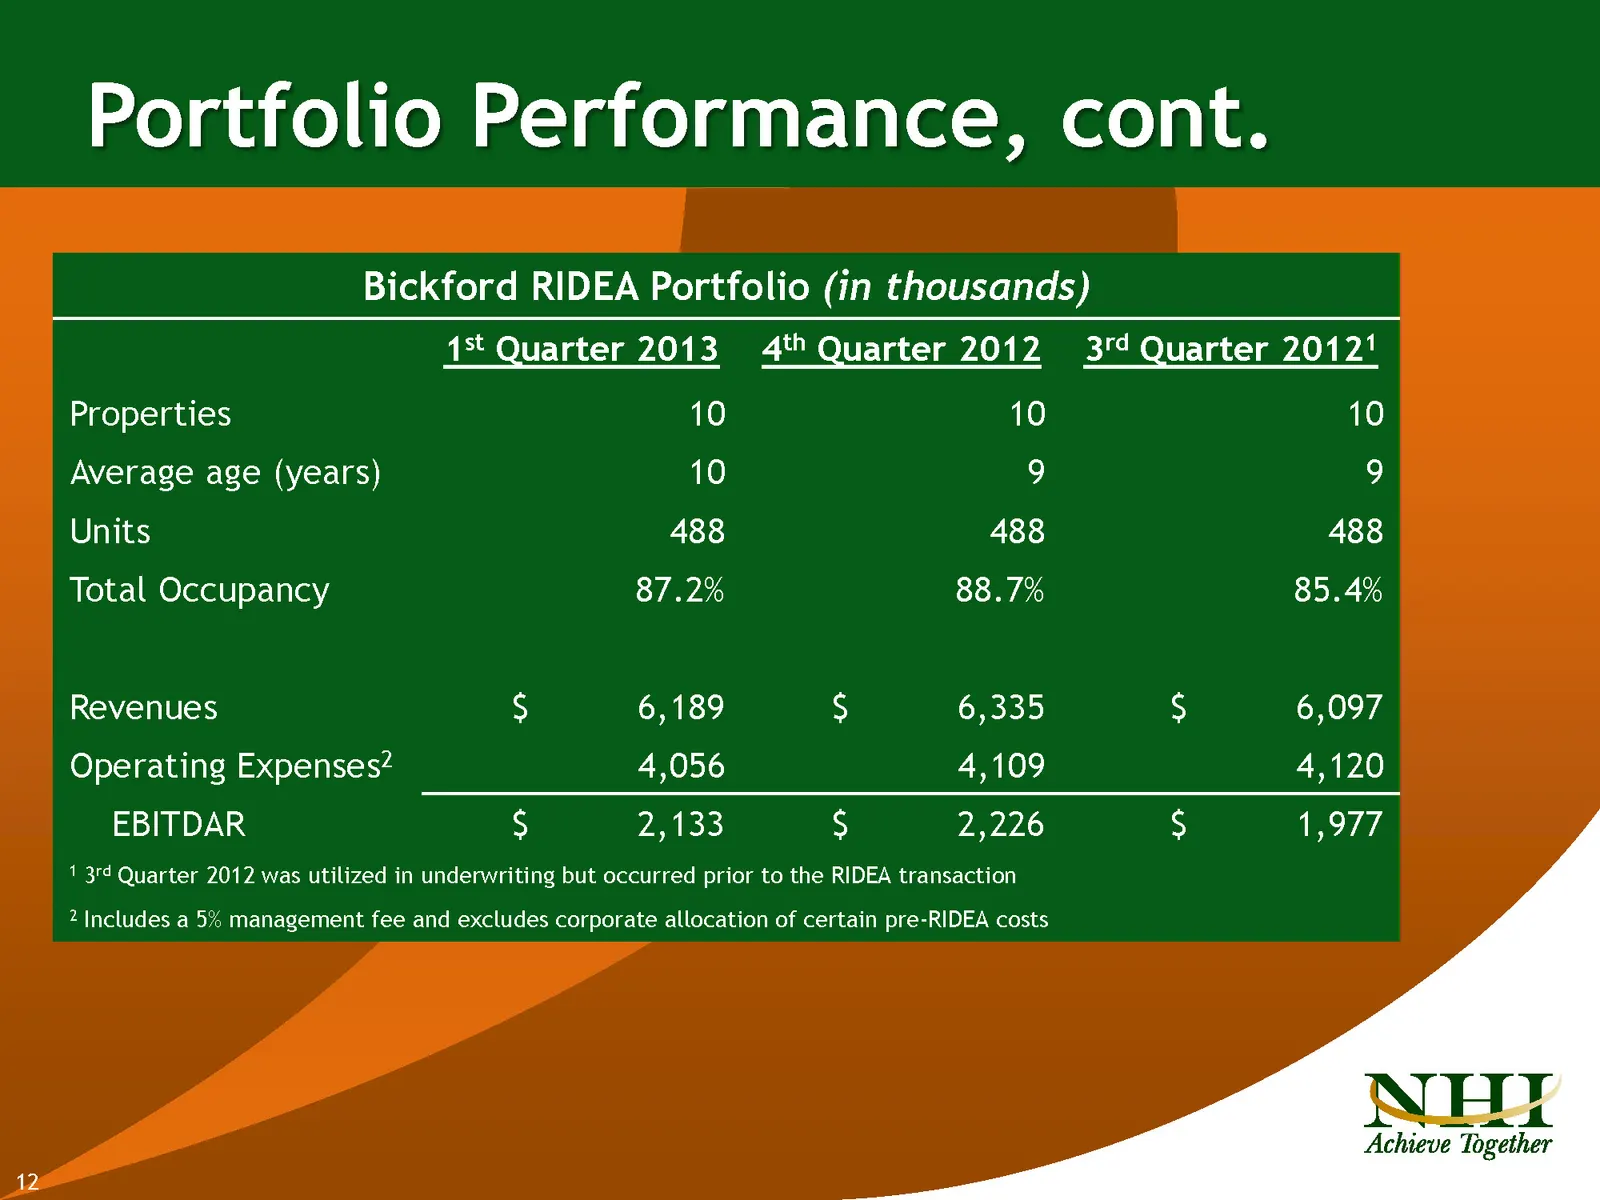
Slide 12: Portfolio Performance, cont.
Portfolio Performance, cont. Bickford RIDEA Portfolio (in thousands) 1%t Quarter 2013 4th Quarter 2012 34 Quarter 2012! Properties 10 10 10 Average age (years) 10 ) 9 Units 488 488 488 Total Occupancy 87.2% 88.7% 85.4% Revenues $ 6,189 $ 6,335 $ 6,097 Operating Expenses? 4,056 4,109 4,120 EBITDAR $
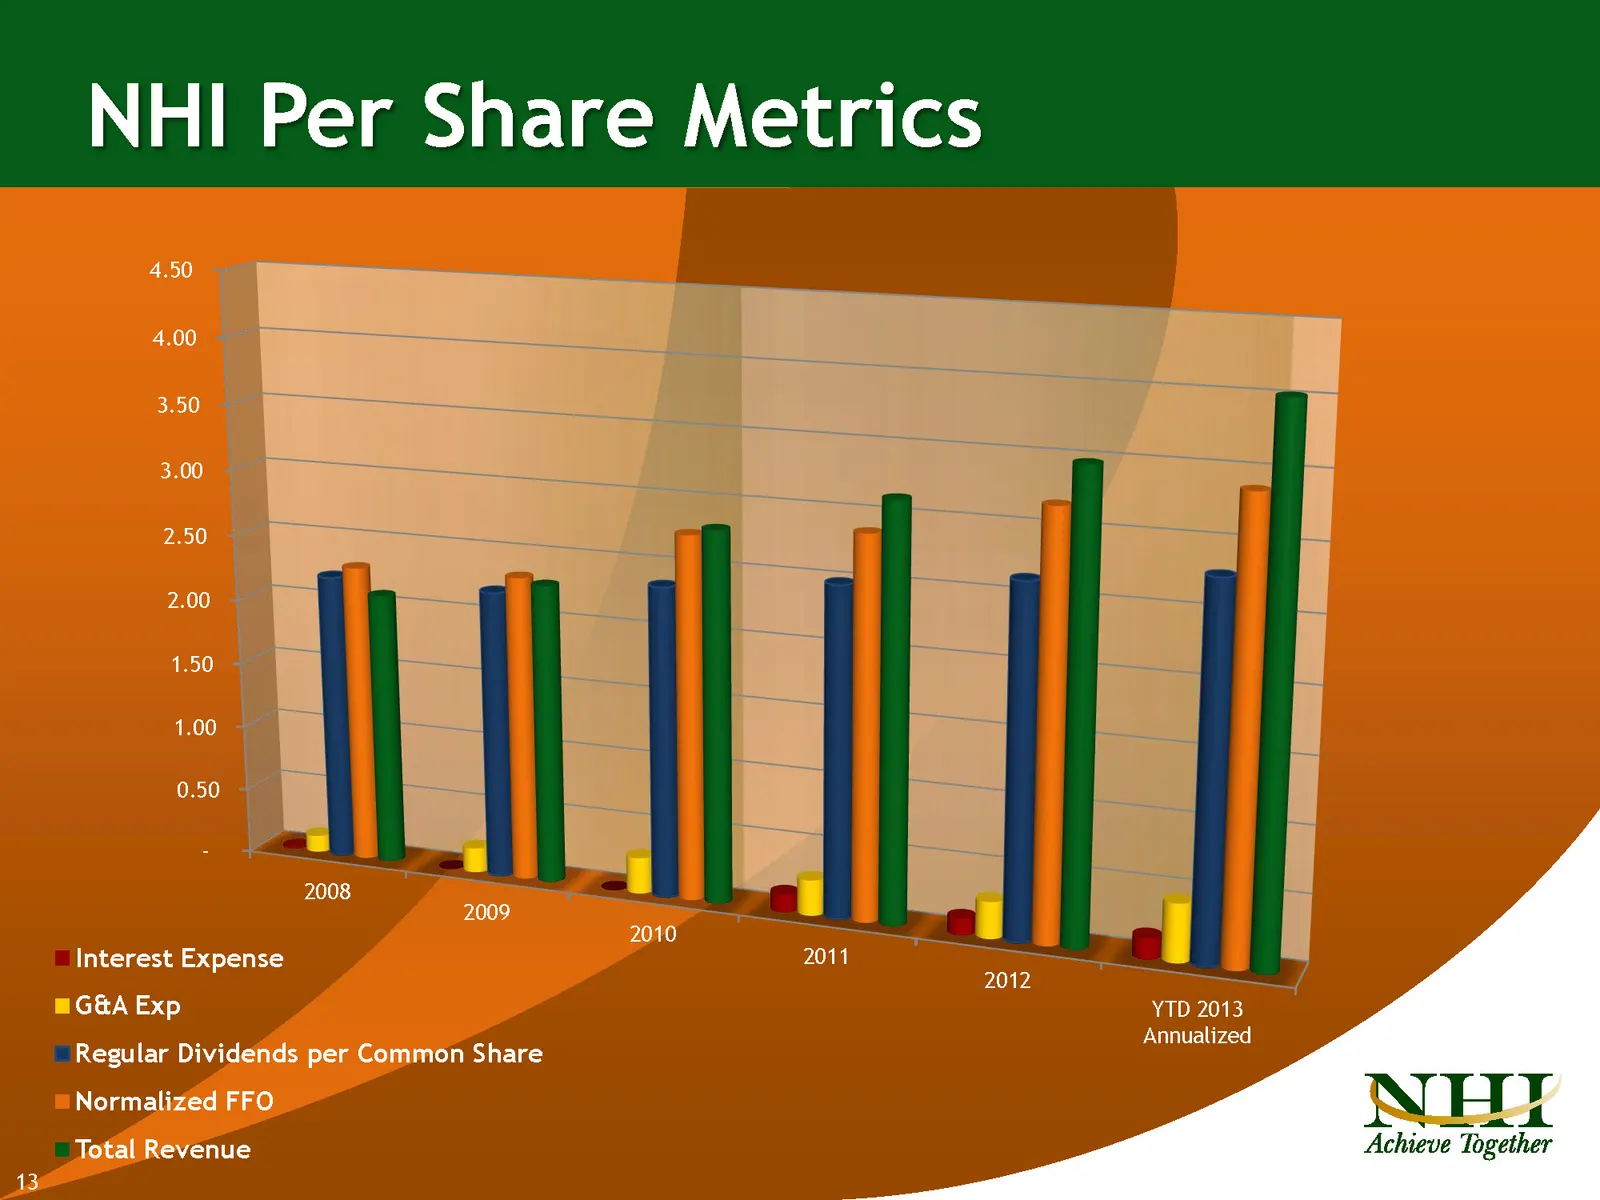
Slide 13: NHI Per Share Metrics
NHI Per Share Metrics
Slide 14: Stagger debt maturities
Stagger debt maturities by paying down revolver with term loans, HUD financing and other long term financing options. (currently no debt maturities until 2017)
Slide 15: Financial Highlights
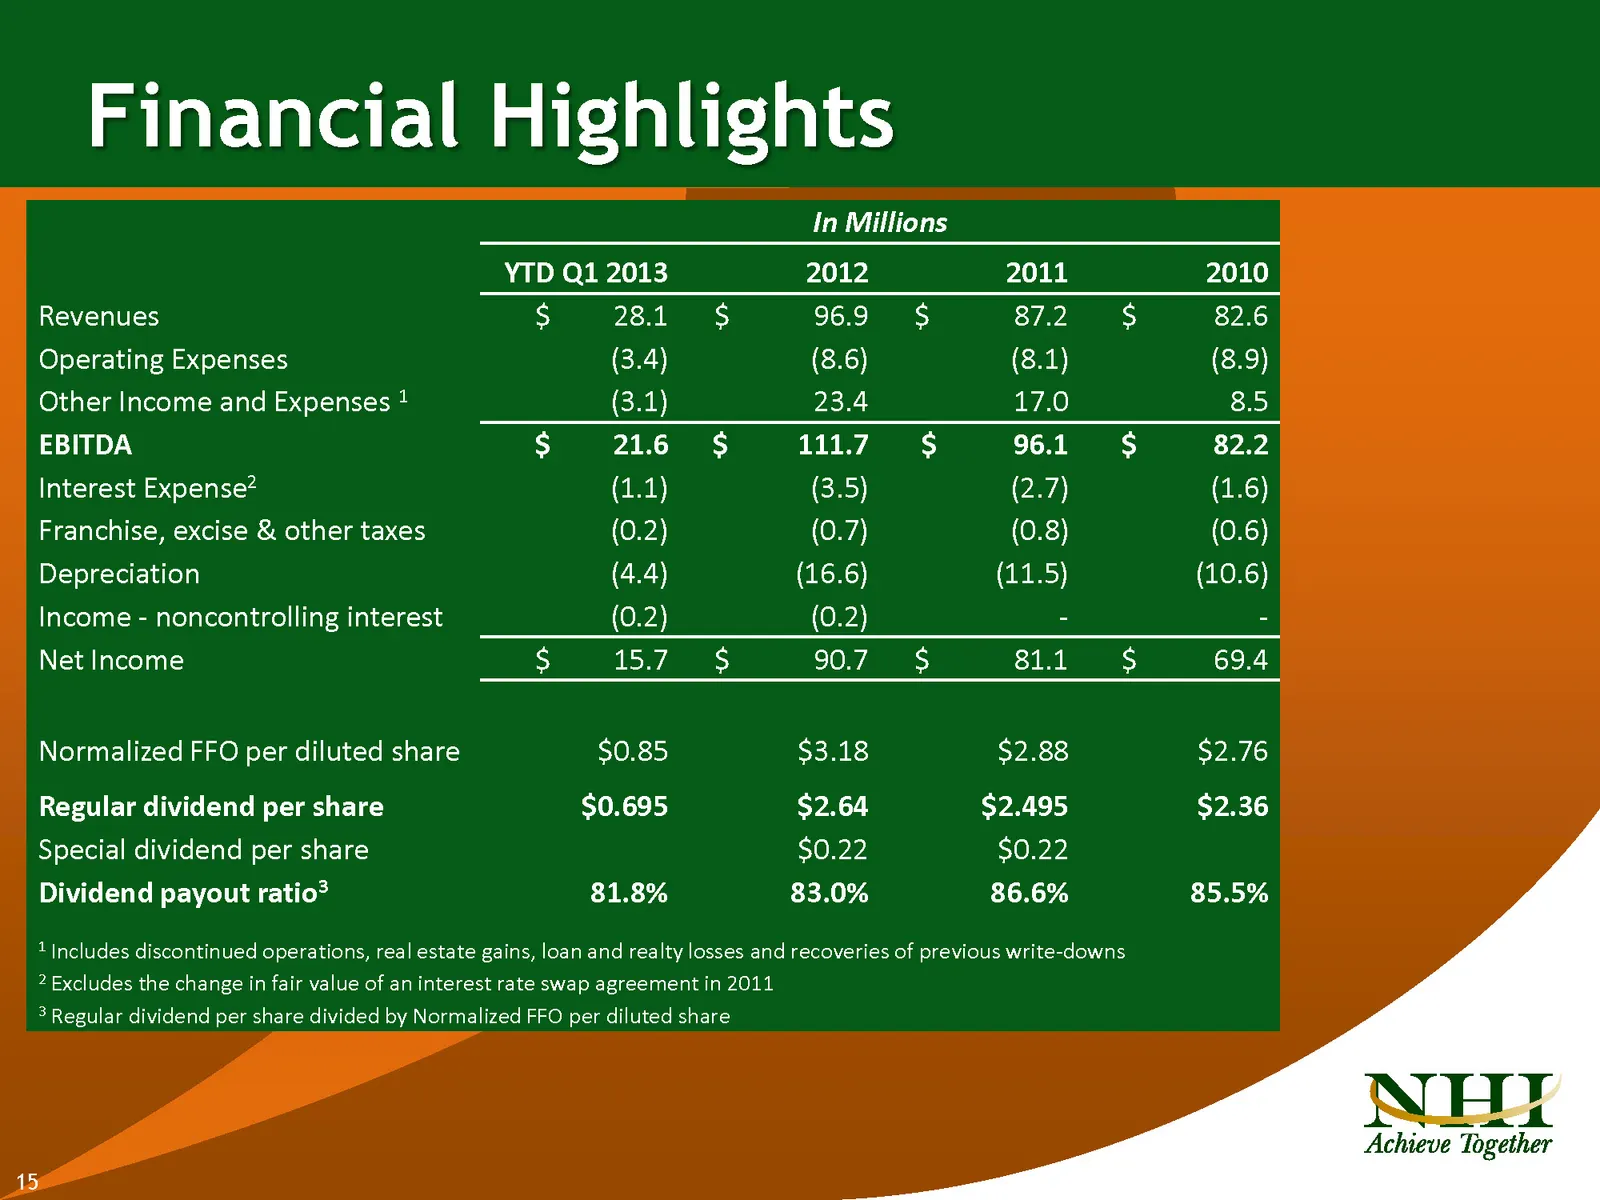
Financial Highlights In Millions YTD Q1 2013 2012 2011 2010 Revenues $ 28.1 $ 96.9 $ 87.2 $ 82.6 Operating Expenses (3.4) (8.6) (8.1) (8.9) Other Income and Expenses (3.1) 23.4 17.0 8.5 EBITDA $ 21.6 $ 111.7 $ 96.1 $ 82.2 Interest Expense? (1.1) (3.5) (2.7) (1.6) Franchise, excise & other taxes (0.2
Slide 16: NHI EBITDA Reconciliation
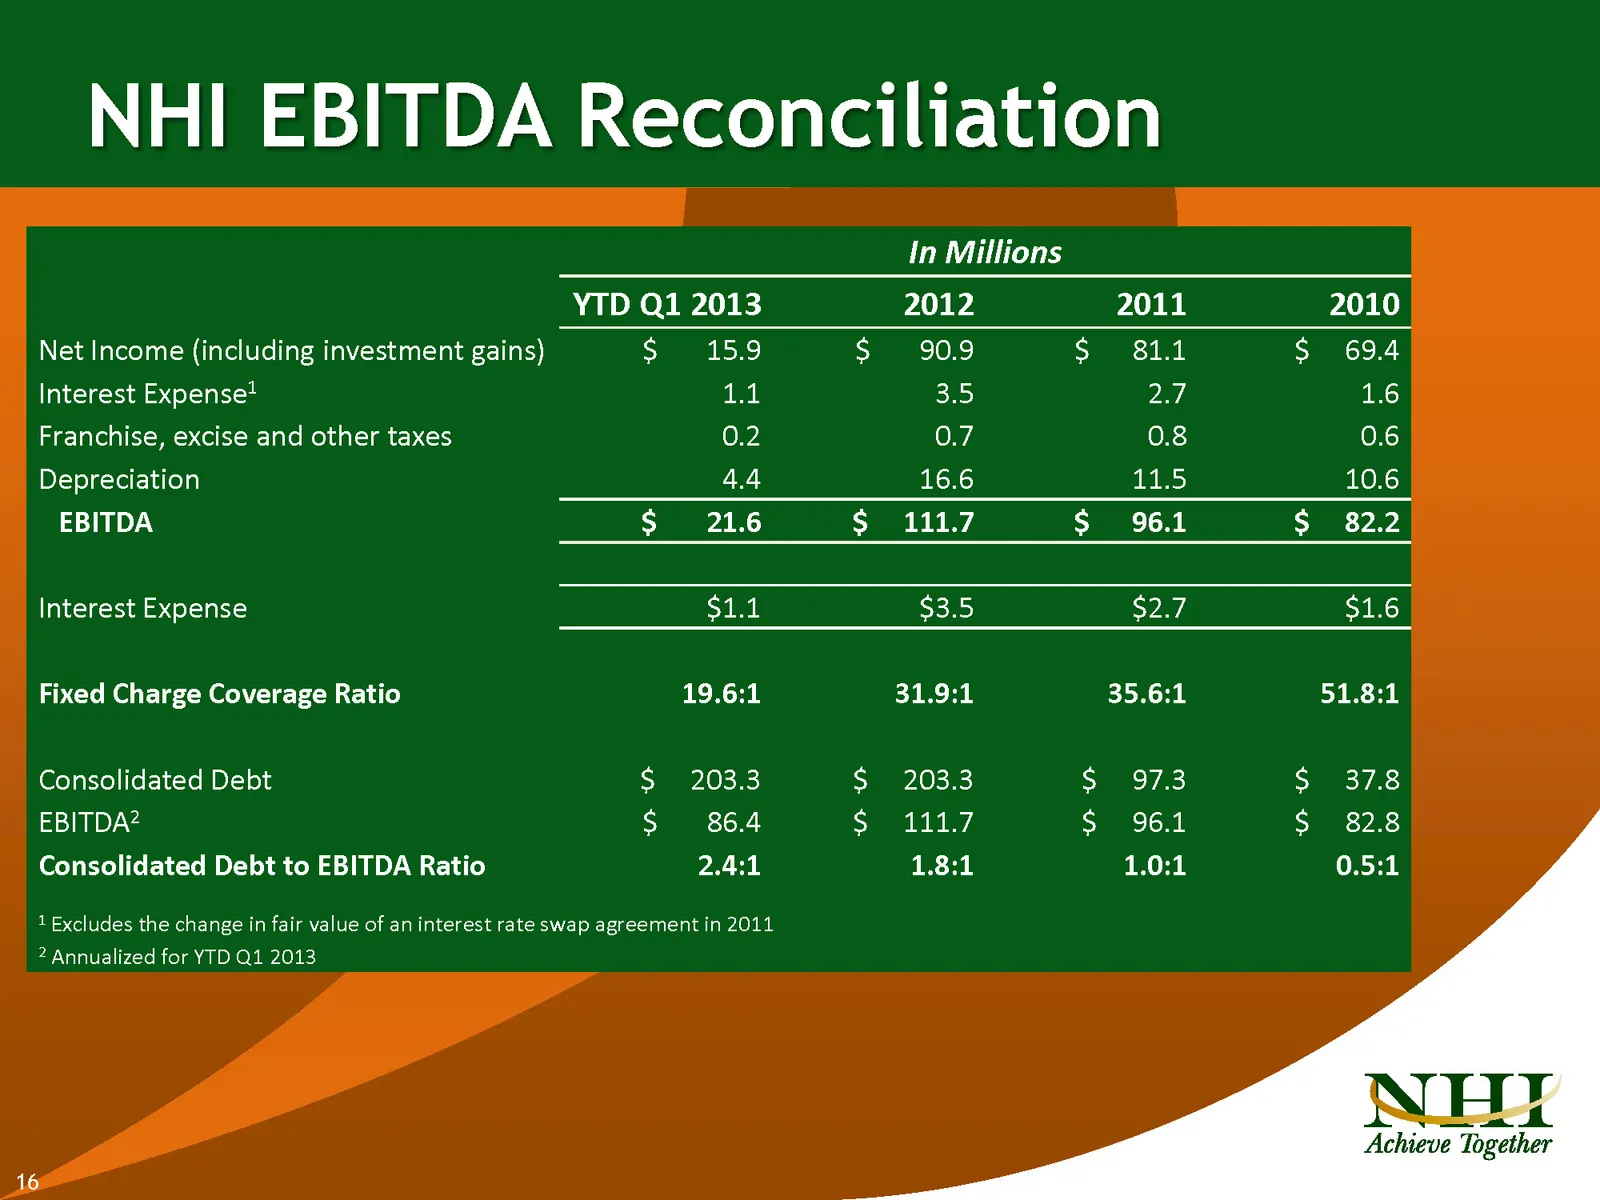
NHI EBITDA Reconciliation In Millions YTD Q1 2013 2012 2011 2010 Net Income (including investment gains) S$ 15.9 S$ 90.9 S$ 81.1 S$ 69.4 Interest Expense? 1.1 25 2.7 1.6 Franchise, excise and other taxes 0.2 0.7 0.8 0.6 Depreciation 4.4 16.6 ila) 10.6 EBITDA S$ 21.6 $ 111.7 S$ 96.1 S$ 82.2 Interest
Slide 17: Normalized FFO Reconciliation
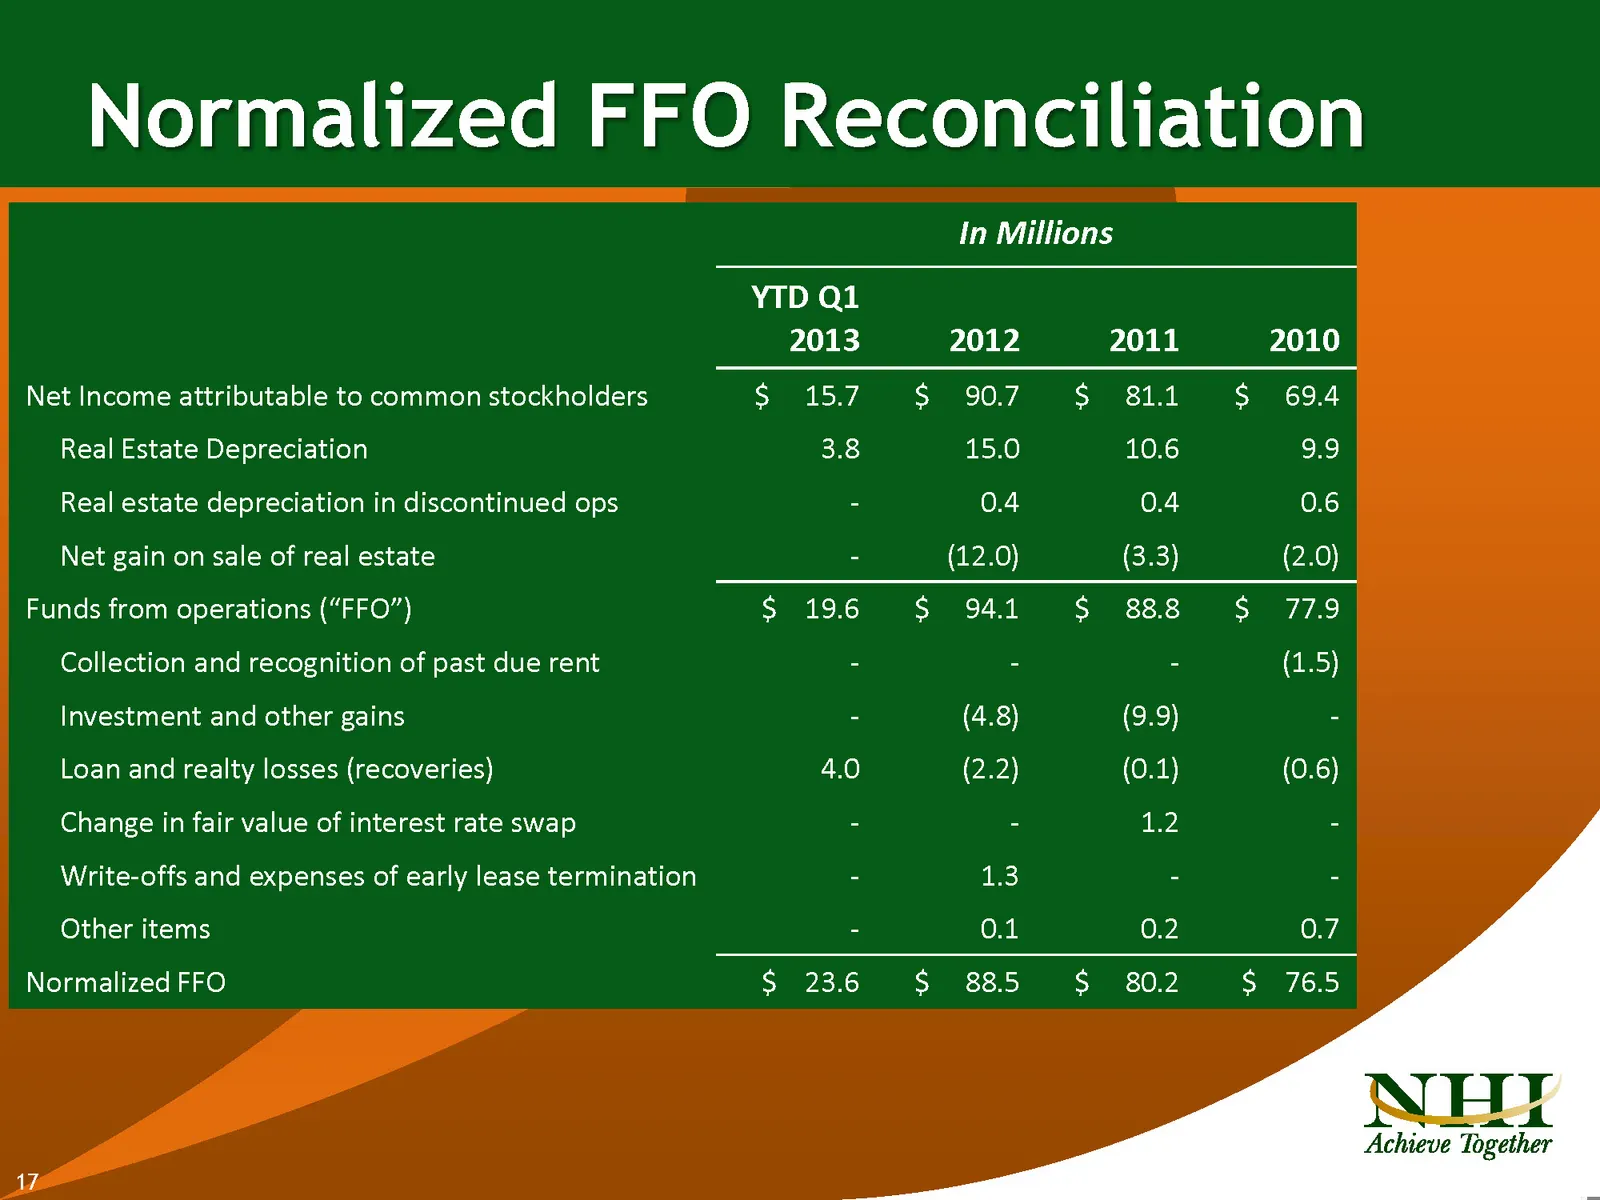
Normalized FFO Reconciliation Net Income attributable to common stockholders Real Estate Depreciation Real estate depreciation in discontinued ops Net gain on sale of real estate Funds from operations (“FFO”) Collection and recognition of past due rent Investment and other gains Loan and realty loss
Slide 18: NHI's goal is to selectively invest in income producing healthcare real estate
NHI’s goal is to selectively invest in income producing healthcare real estate investments to support rising income to the NHI shareholder through dividend growth.

Slide 19: And don't
And don't want to be. NHt Achieve Together
Source: SEC EDGAR · 8-K filed Jun 4, 2013
More decks from National Health Investors, Inc.
 Q3 2026 Earnings Presentation28 slides · Nov 10, 2026
 Q3 2026 Earnings Presentation25 slides · Nov 9, 2026
 Q2 2026 Earnings Presentation28 slides · Aug 11, 2026
 Q2 2026 Earnings Presentation22 slides · Aug 10, 2026
 Q1 2026 Earnings Presentation28 slides · May 5, 2026
 Q1 2026 Earnings Presentation23 slides · May 4, 2026