Vantagesouth Bancshares — Crescent Financial — Howe Barnes Hoefer & Arnett 12th Annual Bank Conference (August 2007)
32 slides from Vantagesouth Bancshares's conference presentation, Aug 13, 2007

Slide 1: Howe Barnes Hoefer & Arnett 12th Annual Bank Conference
Howe Barnes Hoefer & Arnett 12 th Annual Bank Conference August 13, 2007

Slide 2: Forward Looking Statements
Forward Looking Statements This presentation contains forward-looking statements (within the meaning of the Private Securities Litigation Reform Act of 1955). Such statements are not historical facts, but rather are based on our current expectations, estimates and projections about our industry, our

Slide 3: About Crescent Financial
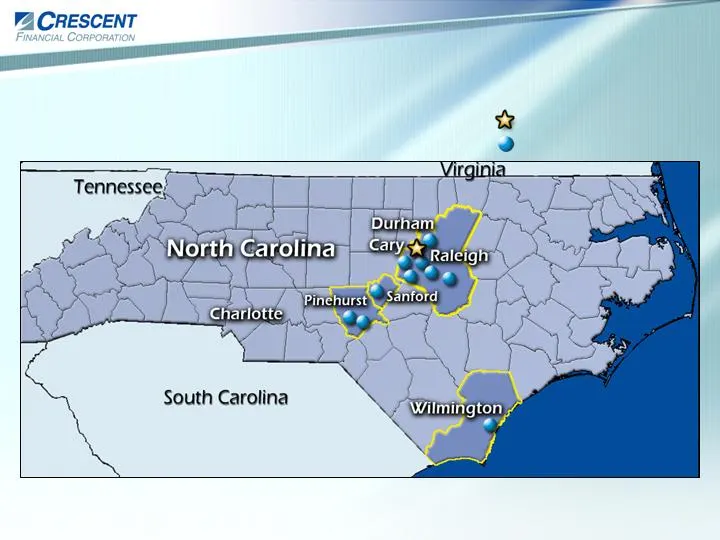
State-chartered community bank opened in Dec.1998 Formed holding company in June 2001 In September 2006, acquired Port City Bank with $185 million in assets Total assets of $782 million as of June 30, 2007 11 full-service offices, with headquarters in Cary, NC Serves 3 major markets: Raleigh-Durham,

Slide 4: About Crescent Financial: CRFN
About Crescent Financial: CRFN 1 Listed on NASDAQ: October 2005 Market Cap: $94 million Inside ownership: 18.6% Institutional ownership: 6.7% Avg. daily volume (3 mos.): 7,823 shares Shares outstanding: 9.2 million 1 Market Data as of July 30, 2007.

Slide 5: High Growth Strategy
High Growth Strategy: Increase presence in high-growth central and southeast North Carolina markets Identify communities of interest and then hire the best local bankers Target small- and medium-sized businesses, professionals and individuals located in the markets we serve Empower seasoned employee
Slide 6: The Team That Makes It Happen
Years in Banking Years with CRFN Title The Team That Makes It Happen 4 mos. SVP, Dir. Ops William V. Leaming, Jr 11 mos. Regional President, Wilmington Keith Betts SVP & COO SVP & Sr. Credit Officer SVP & CFO President & CEO Ray D. Vaughn Bruce W. Elder Michael G. Carlton Thomas E. Holder, Jr.
Slide 7: Crescent's Market Area
Crescent’s Market Area Crescent headquarters 11 Crescent offices Crescent MSAs are outlined in yellow.
Slide 8: Targeting High Growth Markets
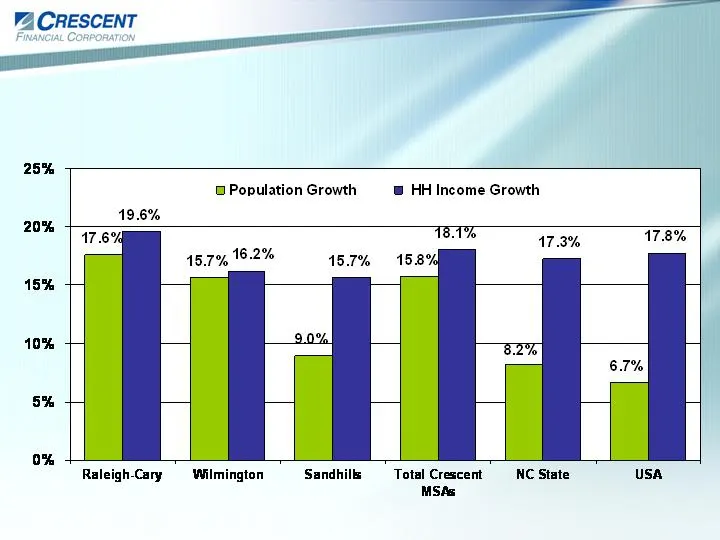
Targeting High Growth Markets 1 Weighted average of combined Southern Pines-Pinehurst and Sanford MSAs Source: SNL Financial LC. Projected 2006-2011

Slide 9: Raleigh–Durham–Cary MSA
Raleigh–Durham–Cary MSA 7 banking offices with 2.13% deposit market share All CRFN loan growth in this MSA has been organic Population of 1.3 million, with 17.6% population growth forecast over next five years 1 Home to the Research Triangle Park, one of the nation’s leading technology business cent

Slide 10: Sandhills MSA
Sandhills MSA 1 Acquired Centennial Bank in August 2003 with $61.2 million in assets and 2 banking offices in Moore County Now 3 banking offices and 3.6% deposit market share 1 Total population of 138,600, growing at approx. 9.4% over next 5 years 1 Famous for its world-class golf courses Pinehurst

Slide 11: Greater Wilmington Area/Coastal Market
Greater Wilmington Area/Coastal Market Acquired Port City Capital on August 31, 2006 based in Wilmington; consolidated in June 2007 1 banking office with 2.75% deposit market share; assets of $185 million at acquisition Wilmington is the largest city in southeastern NC; a regional medical and educat
Slide 12: Growing the Balance Sheet
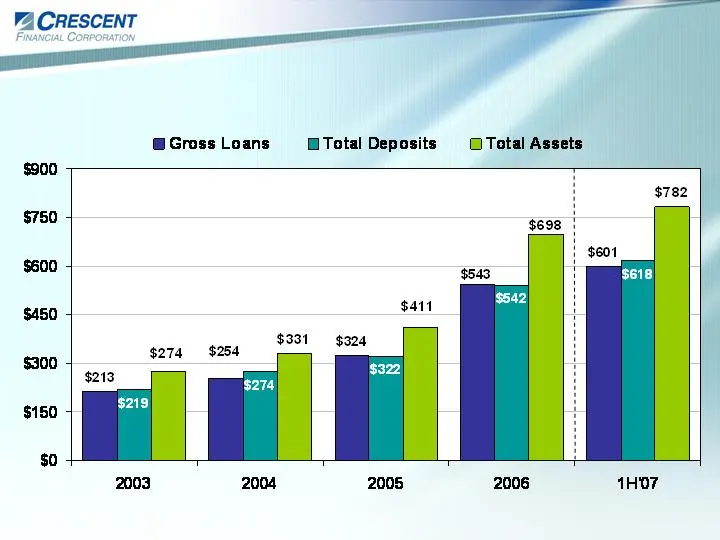
Growing the Balance Sheet 2003-2006 Average Annual Growth: Gross Loans = 38.0% Total Deposits = 37.0% Total Assets = 38.3%
Slide 13: Expanding Deposit Market Share
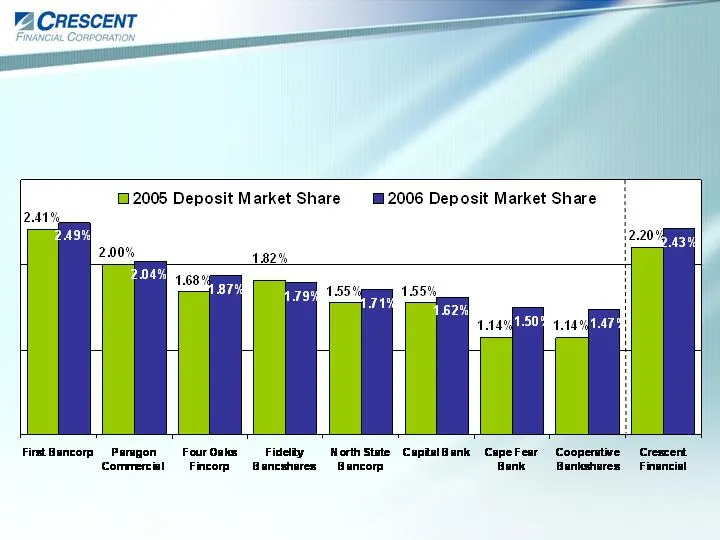
Expanding Deposit Market Share: Measuring Up Against the Top-Ranked Community Banks in Our Markets 1 +8 bps +4 bps +19 bps -3 bps +16 bps +23 bps 1 Community banks ranked by deposit market share in CRFN’s 4 MSAs; includes community banks with more than 1% market share. Excludes regional banks. Sourc
Slide 14: Exceptional Loan Growth
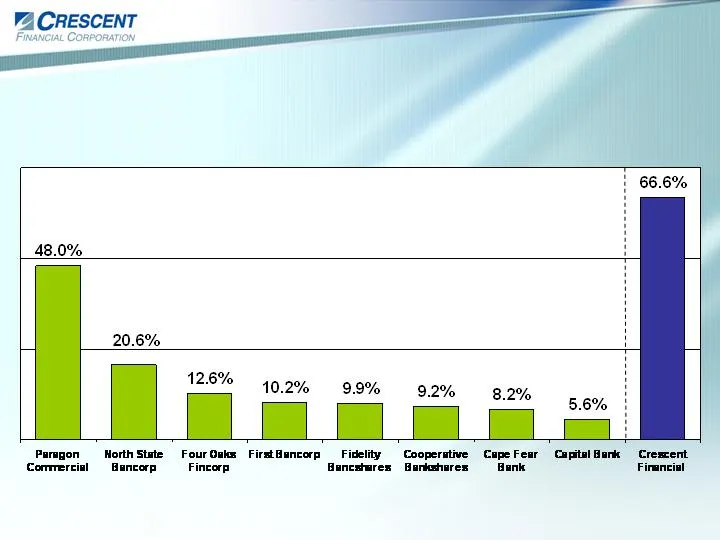
Exceptional Loan Growth: Compared with Top-Ranked Community Banks in Our Markets 1 LTM Loan Growth 2 1 Community banks ranked by deposit market share in CRFN’s 4 MSAs ; includes community banks with more than 1% market share. Excludes regional banks. 2 Source: SNL Financial. Loan growth data for mos
Slide 15: Diversification Reflects the Markets We Serve
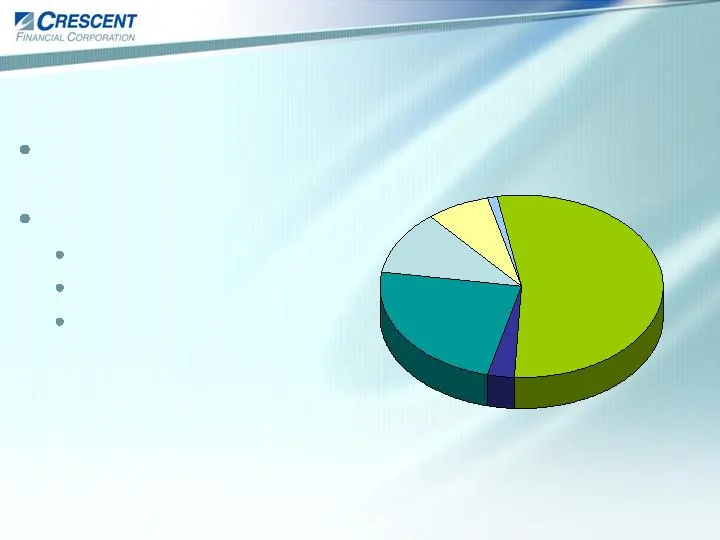
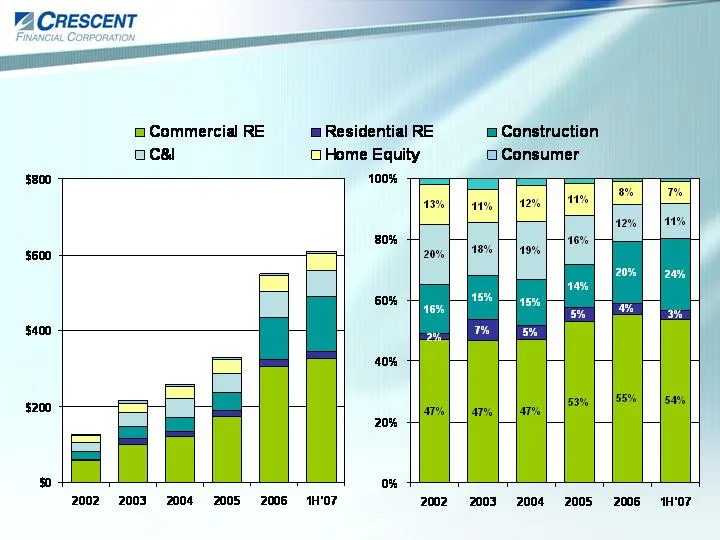
Diversification Reflects the Markets We Serve Commercial RE, 54% C&I, 11% Residential RE, 3% Construction, 24% HELOC, 7% Consumer, 1% Commercial RE is 47% owner occupied Construction = 42% residential 25% commercial 33% land
Slide 16: Balance Sheet Management
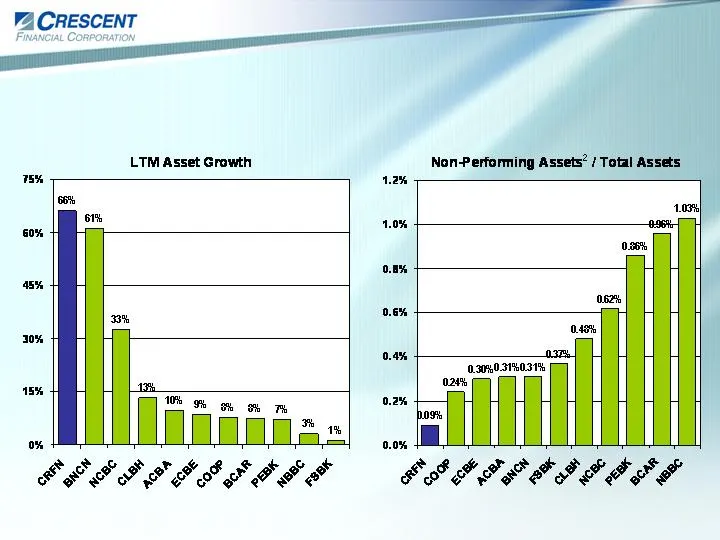
Balance Sheet Management 1 : Growing Assets While Maintaining Asset Quality 1 Peer group = Median of 10 NC banks closest in asset size to CRFN. 2 Non-performing assets include non-accrual loans, loans 90+ past due, and OREOs/Repos.
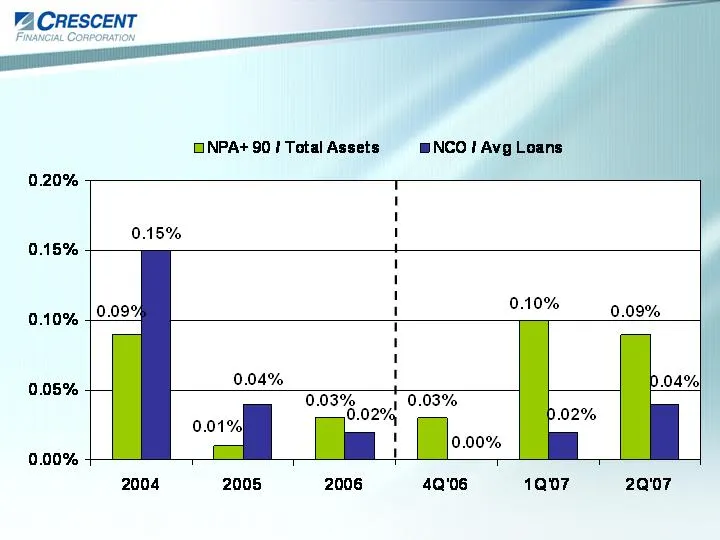
Slide 17: Exceptional Asset Quality Over Time
Exceptional Asset Quality Over Time

Slide 18: Our Commitment to Asset Quality
Our Commitment to Asset Quality Disciplined, conservative credit culture Consistent on the analysis & underwriting standards Effective approval structure aimed at quality & responsiveness Robust credit monitoring process At individual credit level At portfolio level We do not compromise loan quality
Slide 19: Financial Highlights
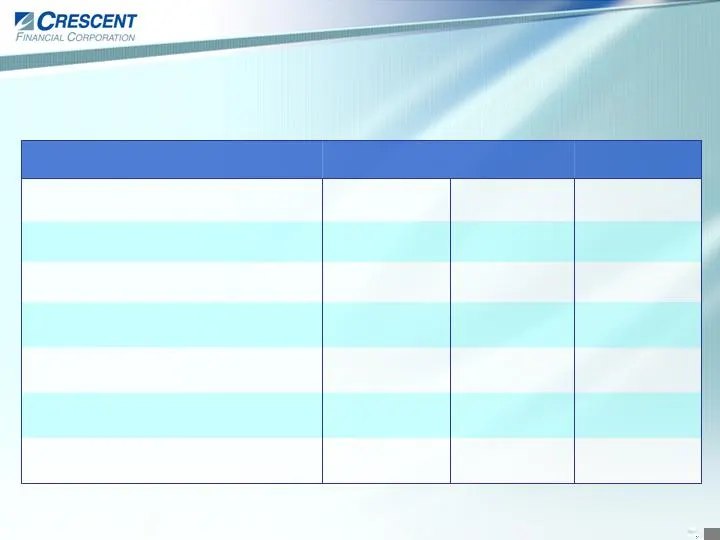
2Q’07 1 1Q’07 2Q’06 ($MMs except EPS) Financial Highlights $1.54 1 $1.47 $1.00 Net Income $0.16 1 $0.15 $0.15 EPS 0.82% 1 0.82% 0.88% ROA 11.26% 1 56.1% $608.3 $782.2 11.26% 57.4% $586.1 $751.5 10.22% 62.6% $365.2 $470.7 ROATE Gross Loans Assets % Core Deposits 1 Excludes non-recurring charge of $14
Slide 20: High Loan Growth & Changing Mix
High Loan Growth & Changing Mix 4.5-Year CAGR = 41.9% $ 126 $217 $258 $328 $608 $550
Slide 21: High Deposit Growth & Changing Mix
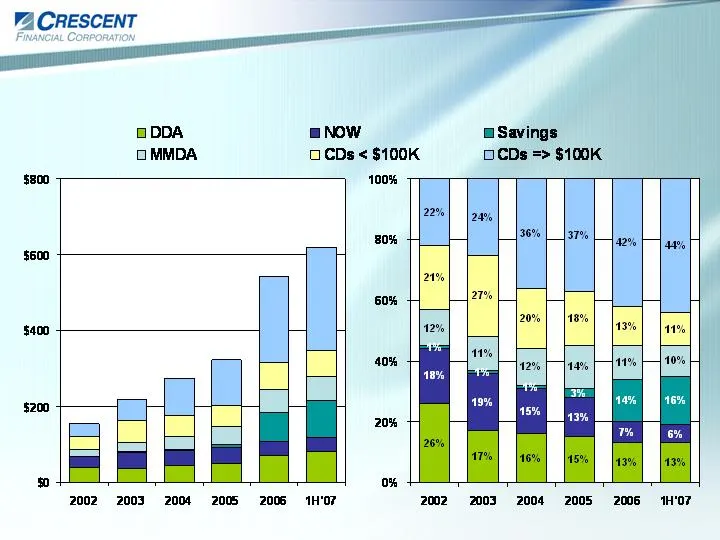
High Deposit Growth & Changing Mix $219 $274 $322 $542 $618 4.5-Year CAGR = 36.3% $153
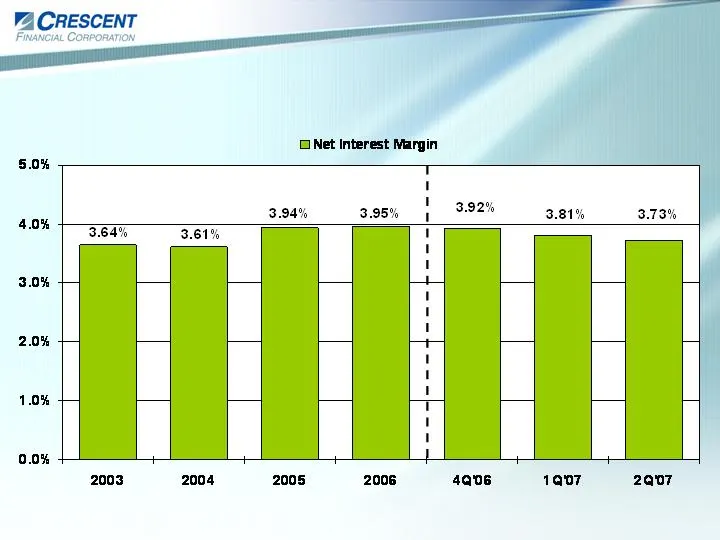
Slide 22: Consistent Net Interest Margin Over Time
Consistent Net Interest Margin Over Time
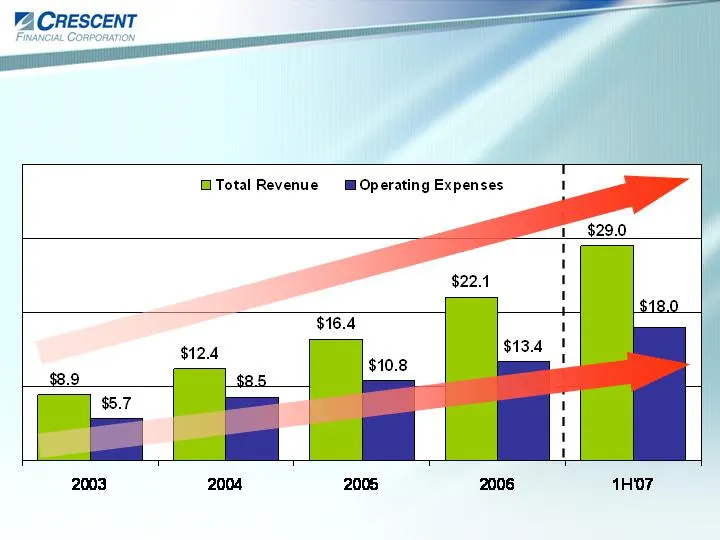
Slide 23: Achieving Critical Mass
($ in millions) * 2007 data is annualized. Achieving Critical Mass Operating Leverage is Increasingly Positive
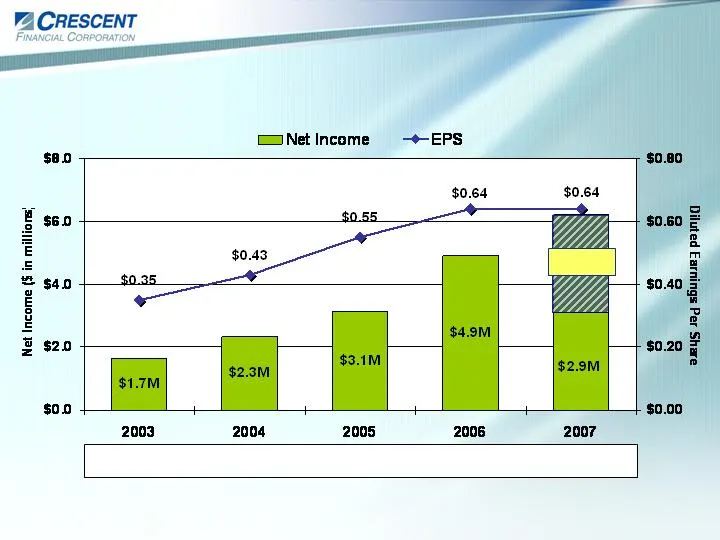
Slide 24: Net Income vs. EPS
Net Income vs. EPS 4.7M 5.4M 5.7M 7.6M 9.6M $3.3M 1 1 2007 net income and EPS represent 1H 2007 (Actual) plus consensus est. for 2H 2007 of $3.3 million NI and $0.34 EPS. Avg. Dil. Shares:

Slide 25: Capital Raising Tied to Strategic Plan
Capital Raising Tied to Strategic Plan December, 1998: $10.9 million IPO August, 2002: $6.3 million secondary offering August, 2003: $8.0 million trust preferred December, 2005: $11.6 million public offering Paid seven stock dividends of 10% or greater
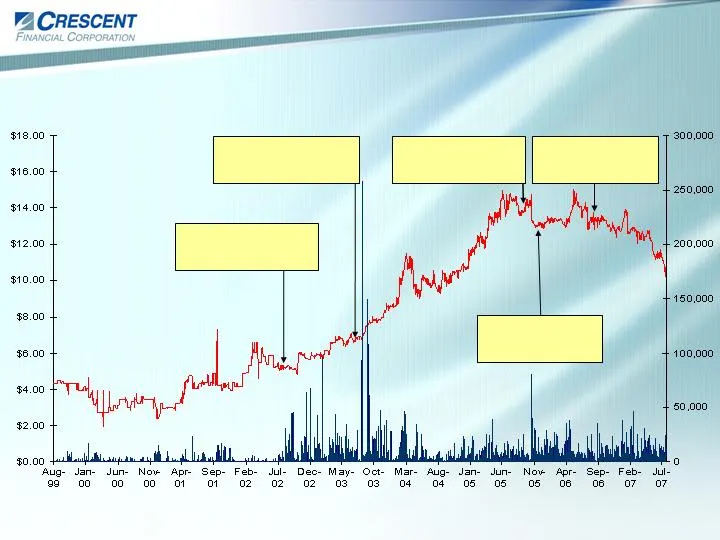
Slide 26: Historical Stock Price Performance
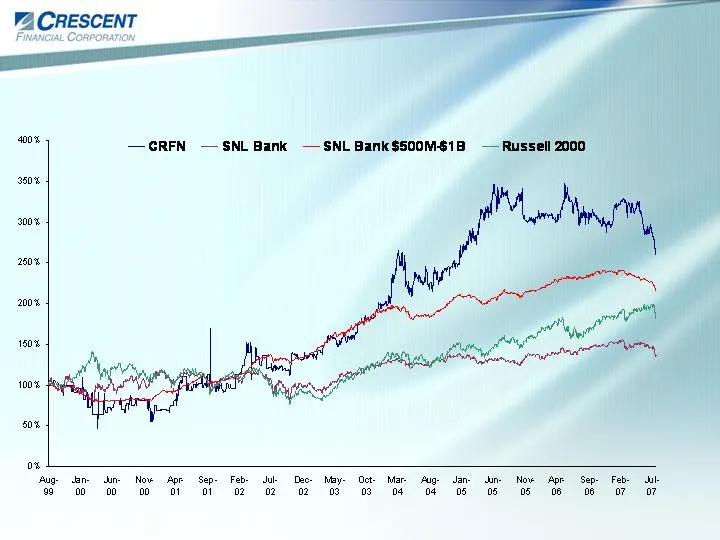
Historical Stock Price Performance 1 1 Trading activity from 8/11/1999 (first day of trading history) to 7/30/2007. Source: SNL Financial. Acquisition of PCCB Completed: August 31, 2006 NASDAQ National Market Listing: October 10, 2005 Public Offering Completed: December 2, 2005 Secondary Offering Co
Slide 27: Relative Price Performance
Relative Price Performance 1 1 Trading activity from 8/11/1999 to 07/30/2007. Source: SNL Financial. +161% +115% + 83% + 36%
Slide 28: CRFN Performance Relative to NC Peer Group
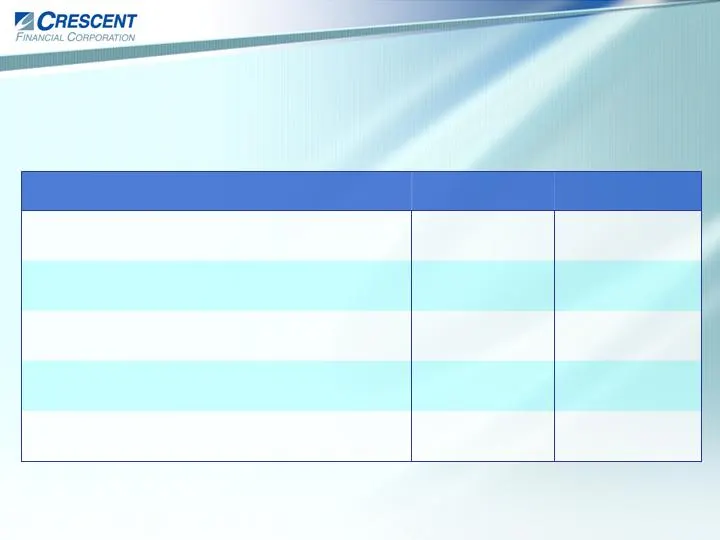
Peer Median 1 CRFN CRFN Performance Relative to NC Peer Group 8% 32% LTM Organic Loan Growth 0.43% 0.09% NPAs/Total Assets 151% 172% Price 2 /Tangible Book Value 15.3x 16.0x Price 2 /LTM Core EPS 144% 109% Price 2 /Book Value 1 Peer median is based on most recent quarter data. 2 Price as of 07/30/07

Slide 29: Investment Highlights
Investment Highlights Strong loan growth with exceptional asset quality Commercially focused business mix Attractive franchise demographics with significant growth potential Proven acquisition and de novo expansion expertise Established local identity in high-growth communities Seasoned management t

Slide 30: Vision of 2006, Goals for 2010
The Bank will have: Traditional bank assets $1.4B 20+ banking offices strategically located in Central and Eastern North Carolina Acquired one or more smaller banks to gain strategic locations, people and/or other resources Improved profitability to ~ 1.00% Expanded services to include some/all of f

Slide 31: Immediate Opportunities for 2007-2008
Profitability: Increase non-interest income through mortgage banking activities Leverage Port City cross-sell opportunities Growth: Branch expansion in 2007-2008 in existing and surrounding markets Expand deposit and loan market share Continue to seek acquisition opportunities Immediate Opportunitie
Slide 32: V2 CRESCEN |
V2 CRESCEN | FINANCIAL CORPOR:
Source: SEC EDGAR · 8-K filed Aug 13, 2007
More decks from Vantagesouth Bancshares Inc.
 Gulf South Conference (May 2014)25 slides · May 12, 2014
 Q1 2014 Earnings Presentation15 slides · Apr 23, 2014
 Merger or Acquisition (March 2014)23 slides · Mar 4, 2014
 Merger or Acquisition (January 2014)15 slides · Jan 27, 2014
 Investor Presentation (December 2013)17 slides · Dec 18, 2013
 Q3 2013 Earnings Presentation14 slides · Oct 30, 2013