Arlington Asset Investment Corp
Arlington Asset Investment — Investor Presentation (February 2013)
11 slides from Arlington Asset Investment's investor presentation, Feb 13, 2013
Slide 1: Investor Presentation February 13, 2013
Investor Presentation February 13, 2013
Slide 2: Information Related to Forward-Looking Statements
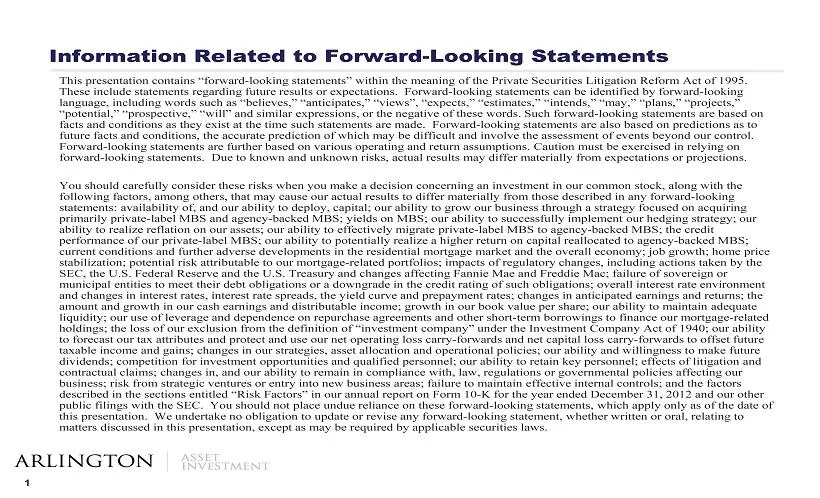
1 Information Related to Forward - Looking Statements This presentation contains “forward - looking statements” within the meaning of the Private Securities Litigation Reform Act of 19 95. These include statements regarding future results or expectations. Forward - looking statements can be identifi
Slide 3: Consistent and attractive profitability
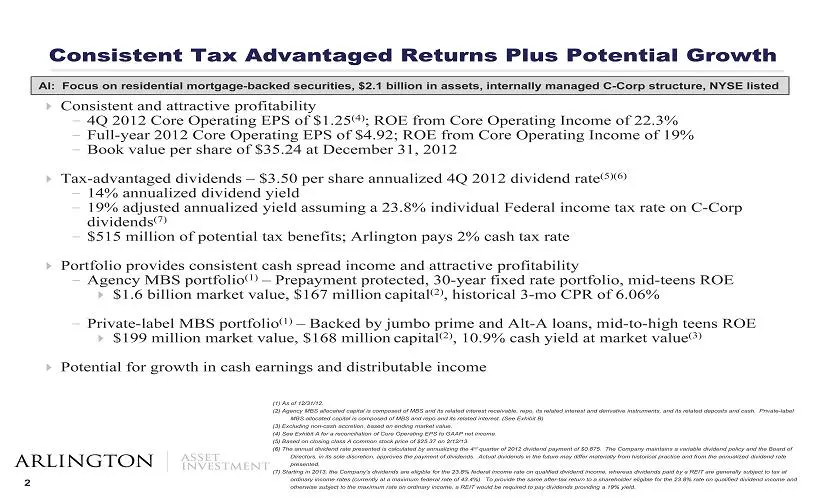
2 Consistent and attractive profitability - 4Q 2012 Core Operating EPS of $1.25 (4) ; ROE from Core Operating Income of 22.3% - Full - year 2012 Core Operating EPS of $4.92; ROE from Core Operating Income of 19% - Book value per share of $35.24 at December 31, 2012 Tax - advantaged dividends – $
Slide 4: C-Corp Structure Provides Flexibility; Tax Benefits Enhance Returns
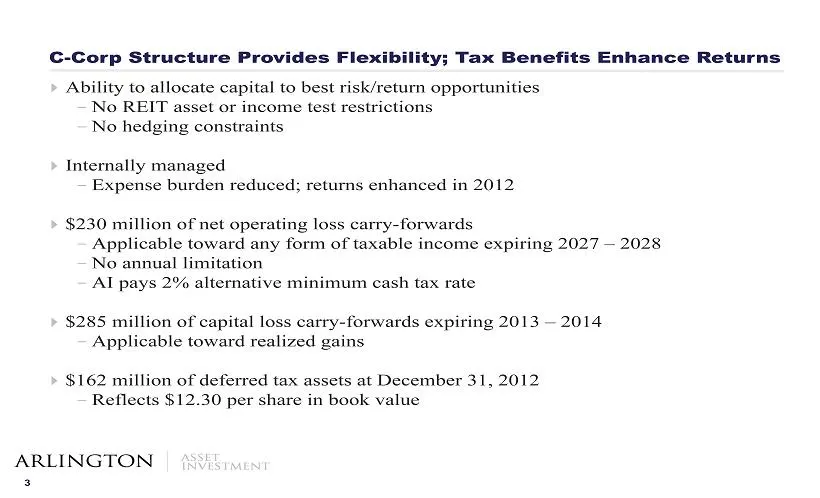
3 Ability to allocate capital to best risk/return opportunities - No REIT asset or income test restrictions - No hedging constraints Internally managed - Expense burden reduced; returns enhanced in 2012 $ 230 million of net operating loss carry - forwards - Applicable toward any form of taxabl
Slide 5: Illustrative MBS Portfolio Returns
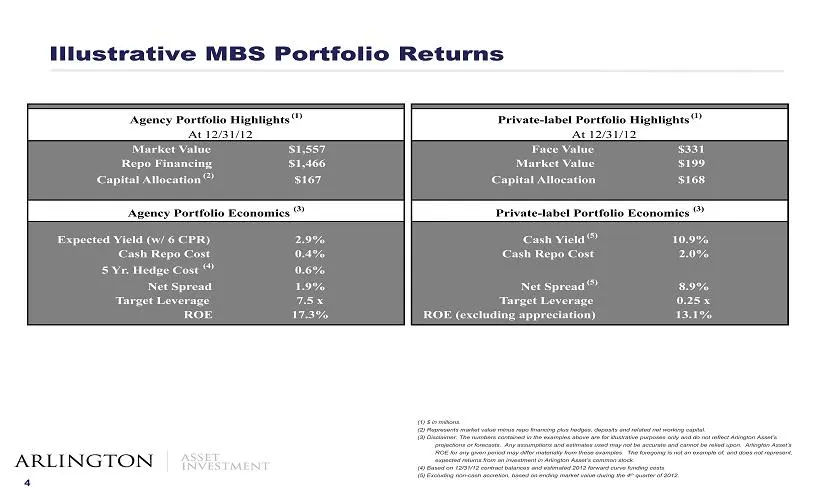
4 Illustrative MBS Portfolio Returns (1) $ in millions. (2) Represents market value minus repo financing plus hedges , deposits and related net working capital. (3) Disclaimer: The numbers contained in the examples above are for illustrative purposes only and do not reflect Arlington Asset’s project
Slide 6: MBS Portfolio Profile
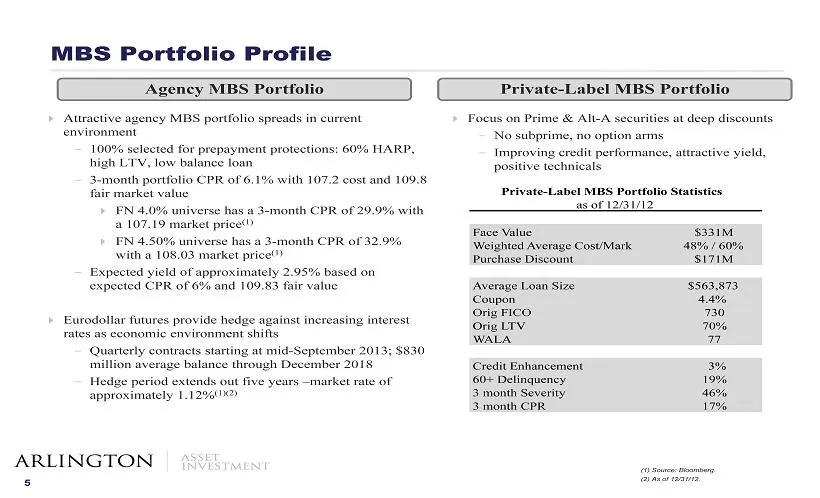
5 MBS Portfolio Profile Attractive agency MBS portfolio spreads in current environment - 100% selected for prepayment protections: 60% HARP, high LTV, low balance loan - 3 - month portfolio CPR of 6.1% with 107.2 cost and 109.8 fair market value FN 4.0% universe has a 3 - month CPR of 29.9% with
Slide 7: Private-label MBS Portfolio: Key Characteristics
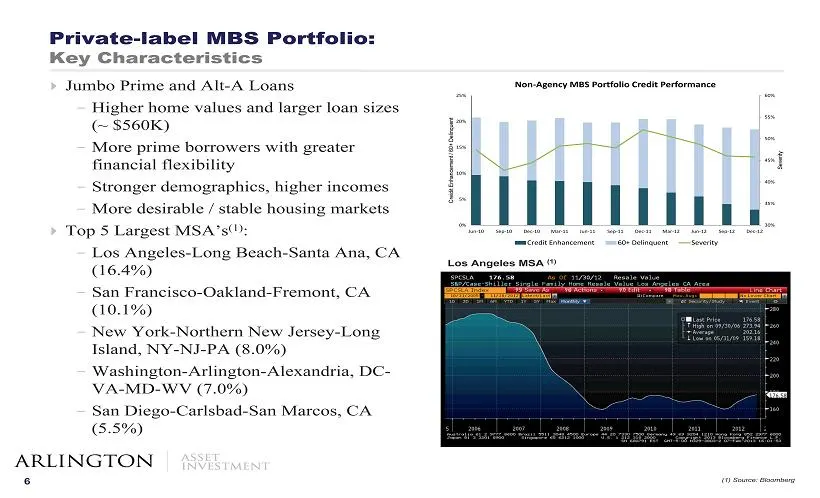
6 Private - label MBS Portfolio: Key Characteristics Jumbo Prime and Alt - A Loans - Higher home values and larger loan sizes (~ $560K) - More prime borrowers with greater financial flexibility - Stronger demographics, higher incomes - More desirable / stable housing markets Top 5 Largest MSA’s
Slide 8: Consistent Core Operating Income Per Share
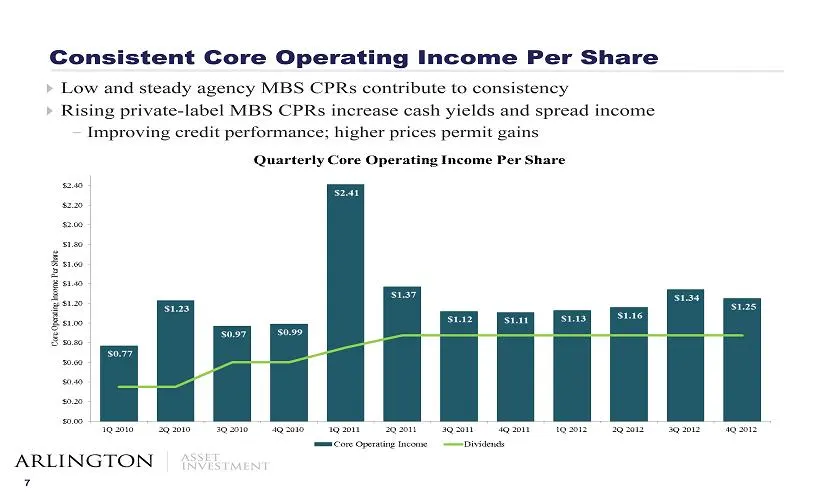
7 Consistent Core Operating Income Per Share Low and steady agency MBS CPRs contribute to consistency Rising private - label MBS CPRs increase cash yields and spread income - Improving credit performance; higher prices permit gains
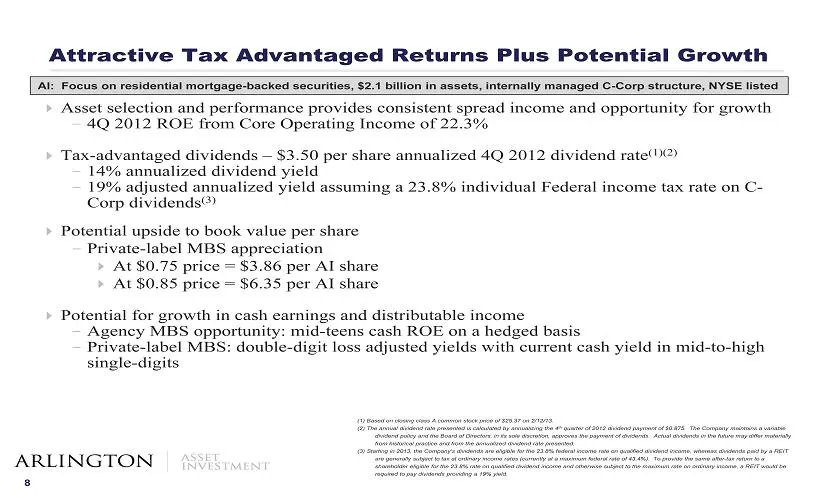
Slide 9: Asset selection and performance provides consistent spread income and opportunity for growth
8 Asset selection and performance provides consistent spread income and opportunity for growth - 4Q 2012 ROE from Core Operating Income of 22.3% Tax - advantaged dividends – $3.50 per share annualized 4Q 2012 dividend rate (1)(2) - 14% annualized dividend yield - 19% adjusted annualized yield as
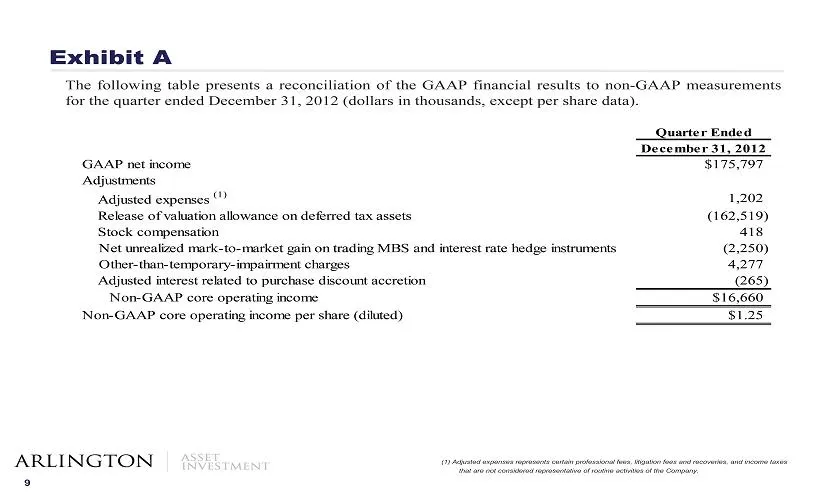
Slide 10: Exhibit A
9 Exhibit A The following table presents a reconciliation of the GAAP financial results to non - GAAP measurements for the quarter ended December 31 , 2012 (dollars in thousands, except per share data) . ( 1) Adjusted expenses represents certain professional fees, litigation fees and recoveries, and
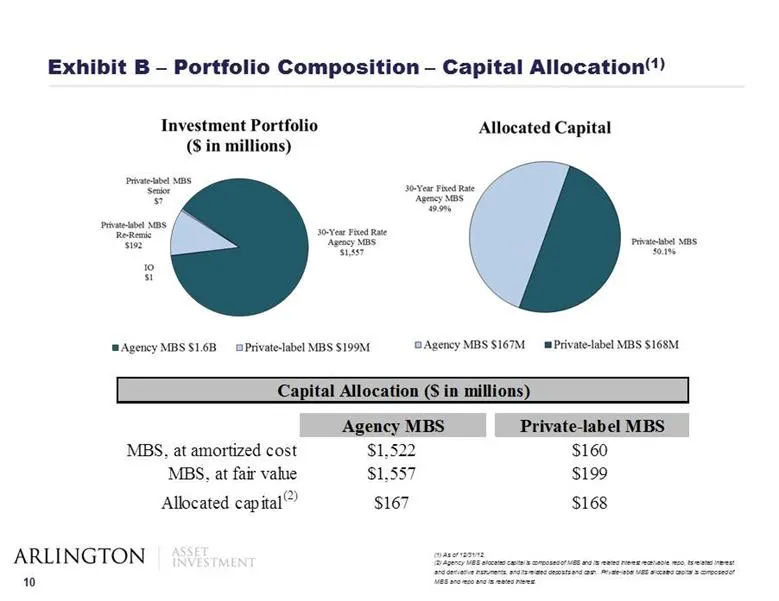
Slide 11: Exhibit B – Portfolio Composition – Capital Allocation
10 Exhibit B – Portfolio Composition – Capital Allocation (1) (1) As of 12/31/12 . (2) Agency MBS allocated capital is composed of MBS and its related interest receivable, repo, its related interest and derivative instruments, and its related deposits and cash. Private - label MBS allocated capital
Source: SEC EDGAR · 8-K filed Feb 13, 2013
More decks from Arlington Asset Investment Corp
 Q3 2023 Earnings Presentation12 slides · Nov 13, 2023
 Q2 2023 Earnings Presentation12 slides · Aug 14, 2023
 Q1 2023 Earnings Presentation16 slides · May 15, 2023
 Q4 2022 Earnings Presentation20 slides · Mar 31, 2023
 Q3 2022 Earnings Presentation29 slides · Nov 15, 2022
 Q2 2022 Earnings Presentation31 slides · Aug 10, 2022