TransAtlantic Petroleum — London Energy Conference 2013
25 slides from TransAtlantic Petroleum's conference presentation, Jan 14, 2013
Slide 1: London Energy Conference January 15, 2013
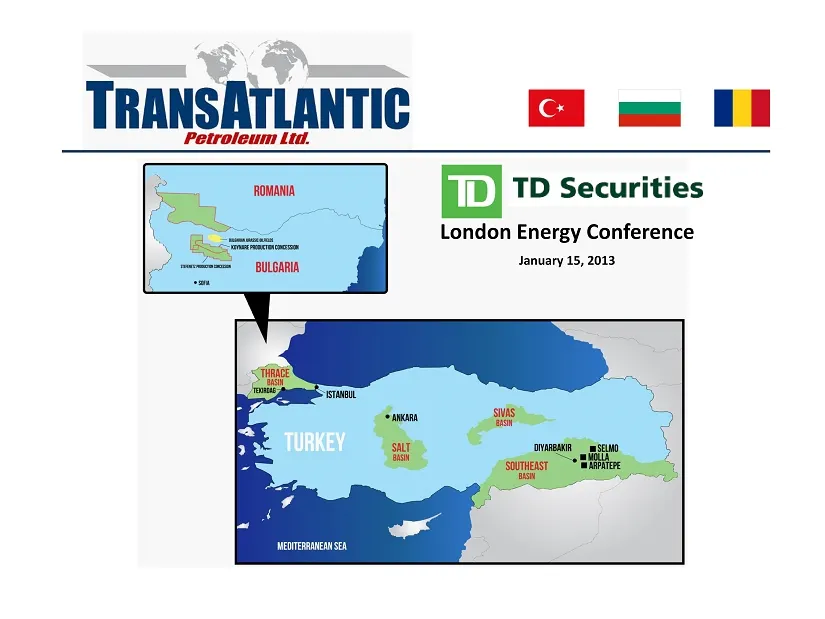
London Energy Conference January 15, 2013
Slide 2: Forward Looking Statements
Forward Looking Statements Outlooks , projections, estimates, targets, and business plans in this presentation or any related subsequent discussions are forward - looking statements . Actual future results, including TransAtlantic Petroleum Ltd . ’s own production growth and mix ; financial results
Slide 3: Company Overview
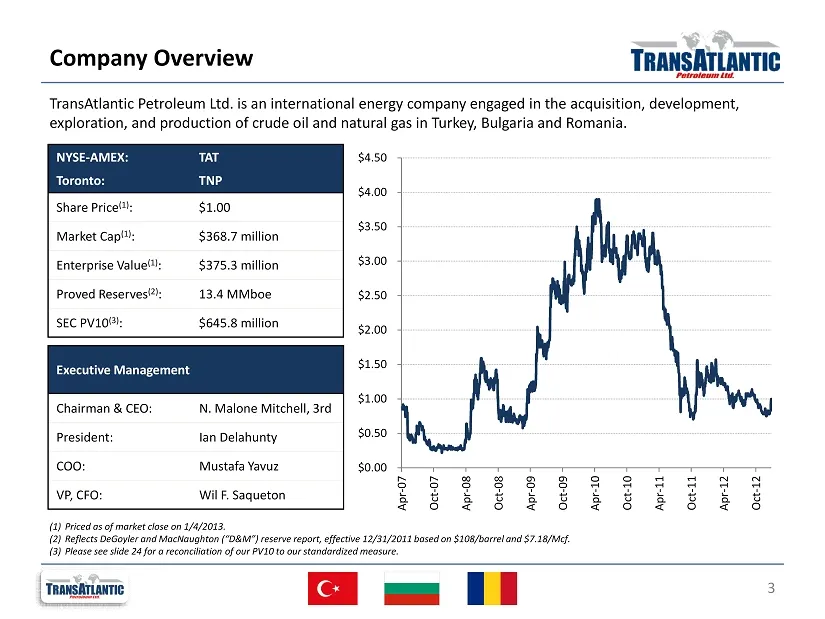
Company Overview TransAtlantic Petroleum Ltd. is an international energy company engaged in the acquisition, development, exploration, and production of crude oil and natural gas in Turkey, Bulgaria and Romania. 3 NYSE - AMEX: Toronto: TAT TNP Share Price (1) : $1.00 Market Cap (1) : $368.7 million
Slide 4: Growth Profile, Reserve Profile and Asset Characteristics
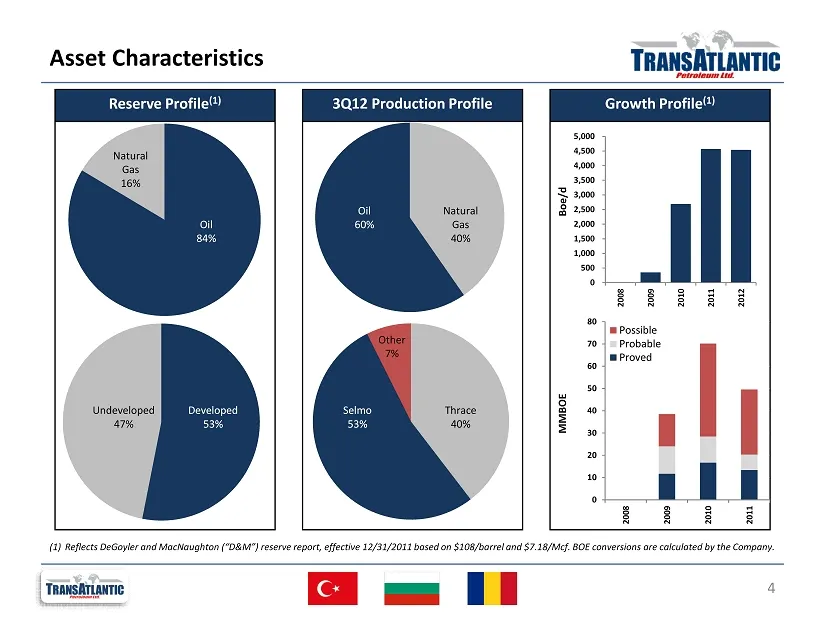
Growth Profile (1) 0 10 20 30 40 50 60 70 80 2008 2009 2010 2011 Possible Probable Proved MMBOE 0 500 1,000 1,500 2,000 2,500 3,000 3,500 4,000 4,500 5,000 2008 2009 2010 2011 2012 Boe /d Reserve Profile (1) Asset Characteristics 4 Natural Gas 16% Oil 84% Undeveloped 47% Developed 53% 3Q12 Productio
Slide 5: Turkey: Acreage Overview
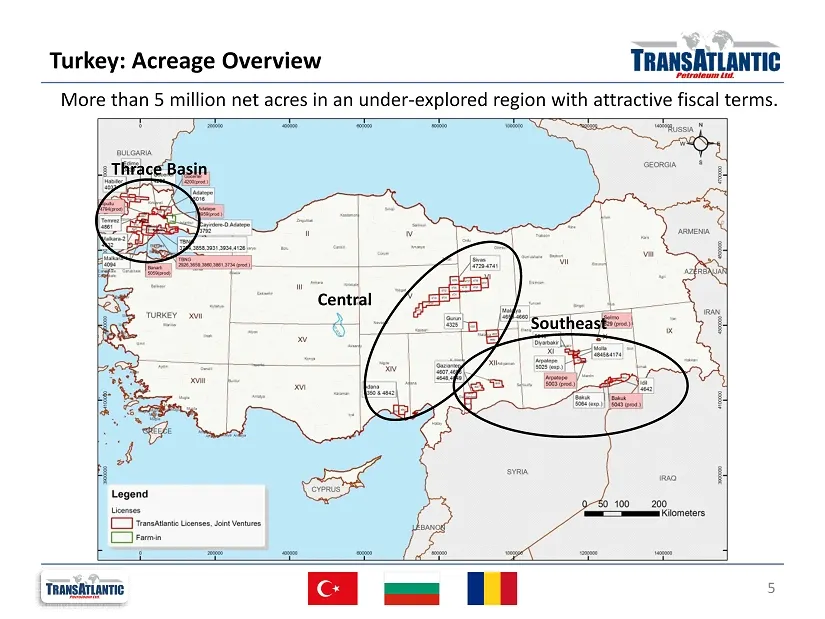
Turkey: Acreage Overview 5 Thrace Basin Southeast Central More than 5 million net acres in an under - explored region with attractive fiscal terms.
Slide 6: 2013 Plan of Action
2013 Plan of Action 6 $130 Million Capital Budget • Within current cash flow, cash on hand, and credit availability. • Accelerate with consummation of a joint venture Southeast Turkey • Drill horizontal wells to increase productivity. • Expand 2012 discoveries (Goksu, Bahar , and Alibey ). • Drill o
Slide 7: Turkey: Southeast Overview
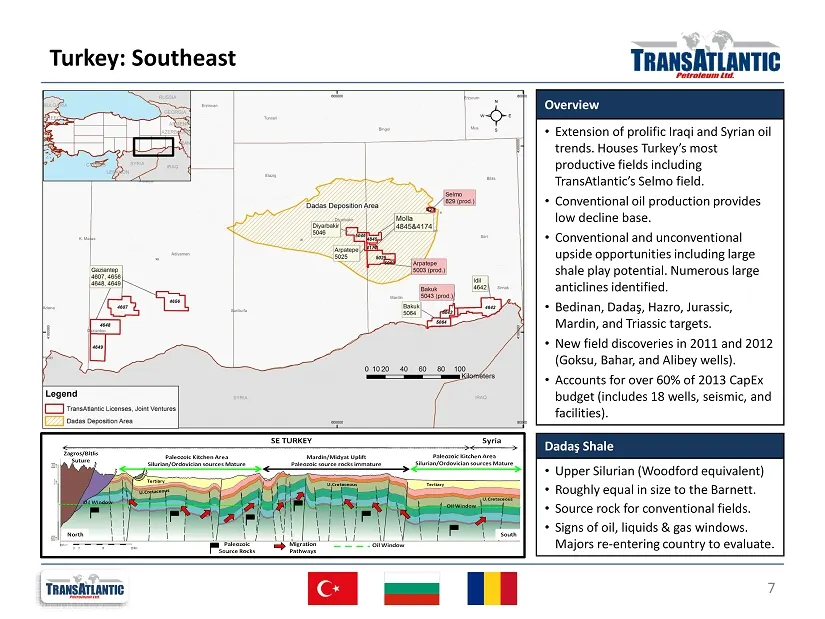
Turkey: Southeast 7 Overview • Extension of prolific Iraqi and Syrian oil trends. Houses Turkey’s most productive fields including TransAtlantic’s Selmo field. • Conventional oil production provides low decline base. • Conventional and unconventional upside opportunities including large shale play p
Slide 8: Turkey: Southeast – Molla Development Concept
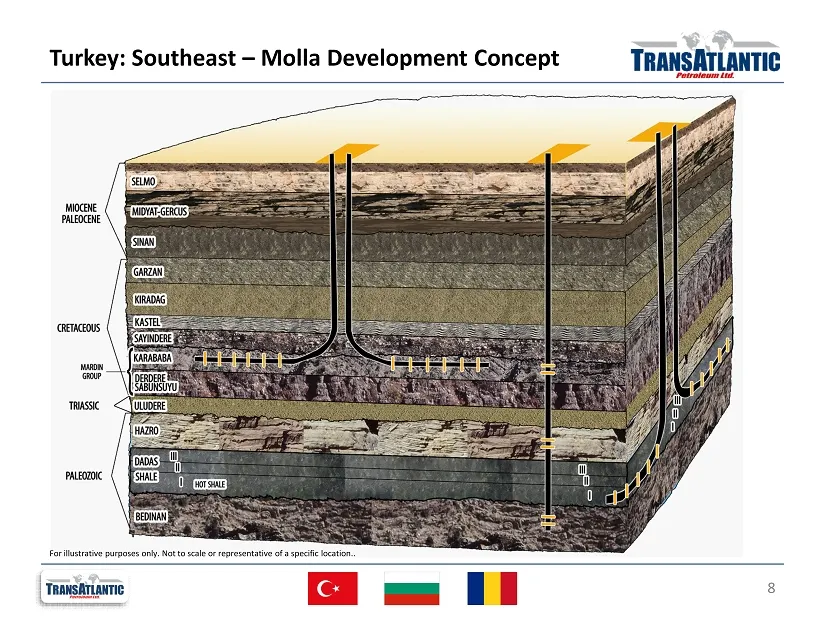
Turkey: Southeast – Molla Development Concept 8 For illustrative purposes only. Not to scale or representative of a specific location..
Slide 9: Turkey: Southeast – Molla – Mardin Horizontal Play
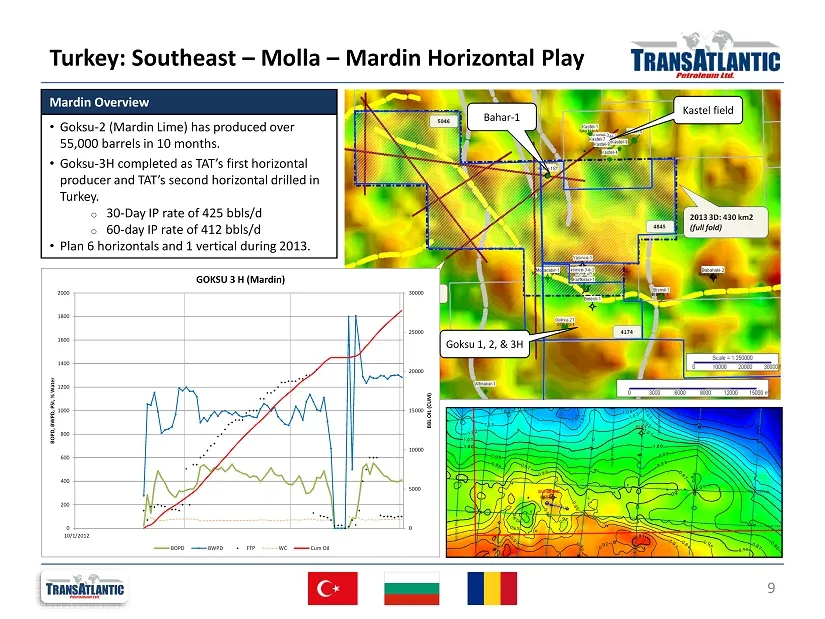
Turkey: Southeast – Molla – Mardin Horizontal Play 9 Mardin Overview • Goksu - 2 ( Mardin Lime) has produced over 55,000 barrels in 10 months. • Goksu - 3H completed as TAT’s first horizontal producer and TAT’s second horizontal drilled in Turkey. o 30 - Day IP rate of 425 bbls /d o 60 - day IP rate
Slide 10: Turkey: Southeast – Molla – Bedinan Sandstone
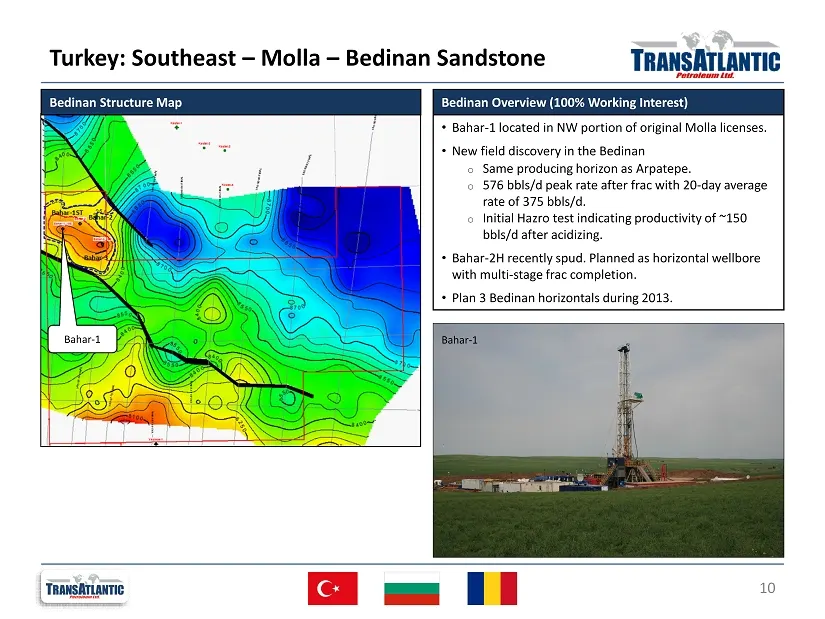
Turkey: Southeast – Molla – Bedinan Sandstone 10 Bedinan Overview (100% Working Interest) • Bahar - 1 located in NW portion of original Molla licenses. • New field discovery in the Bedinan o Same producing horizon as Arpatepe . o 576 bbls /d peak rate after frac with 20 - day average rate of 375 bbl
Slide 11: Turkey: Southeast – Molla – Bedinan Correlation
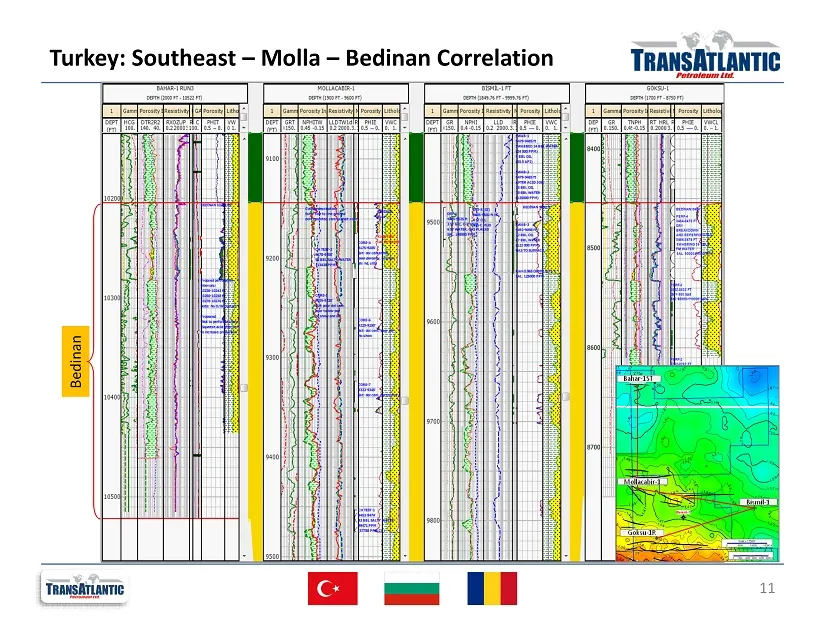
Turkey: Southeast – Molla – Bedinan Correlation 11 Bedinan
Slide 12: Southeast – Dadaş Shale – Industry Activity
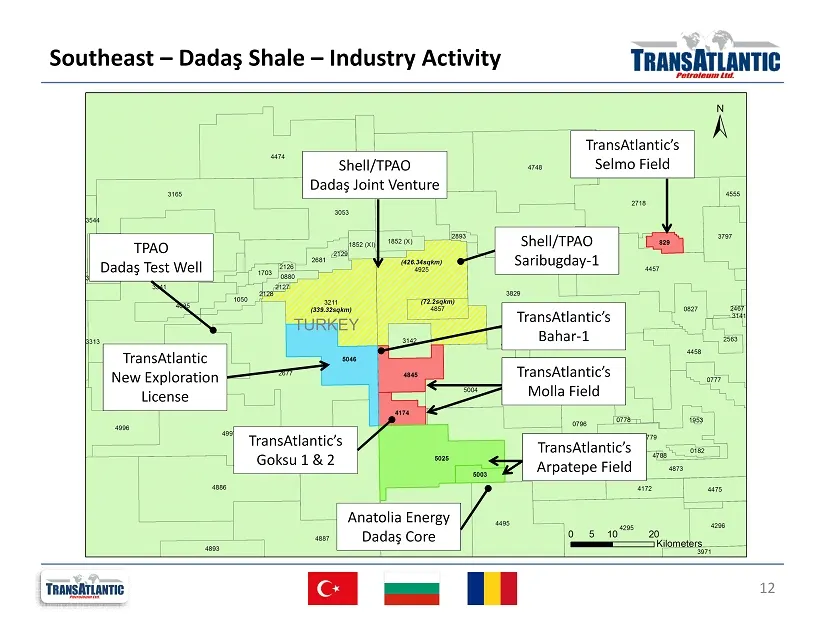
Southeast – Dadaş Shale – Industry Activity 12 Shell/TPAO Dadaş Joint Venture TransAtlantic’s Molla Field TransAtlantic’s Arpatepe Field TransAtlantic’s Selmo Field TransAtlantic New Exploration License Anatolia Energy Dadaş Core TPAO Dadaş Test Well TransAtlantic’s Bahar - 1 TransAtlantic’s Goksu 1
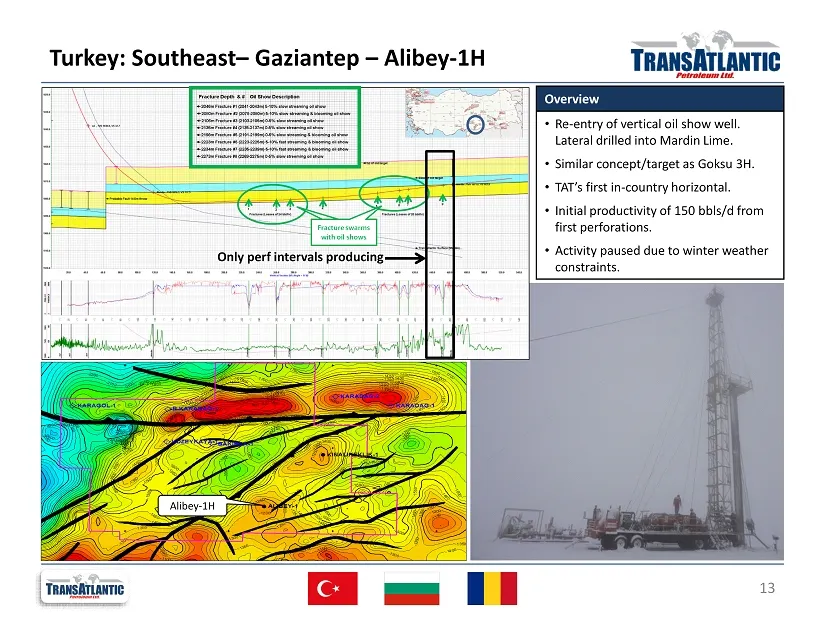
Slide 13: Turkey: Southeast – Gaziantep – Alibey-1H
Turkey: Southeast – Gaziantep – Alibey - 1H 13 Overview • Re - entry of vertical oil show well. Lateral drilled into Mardin Lime. • Similar concept /target as Goksu 3H. • TAT’s first in - country horizontal. • Initial productivity of 150 bbls /d from first perforations. • Activity paused due to wint
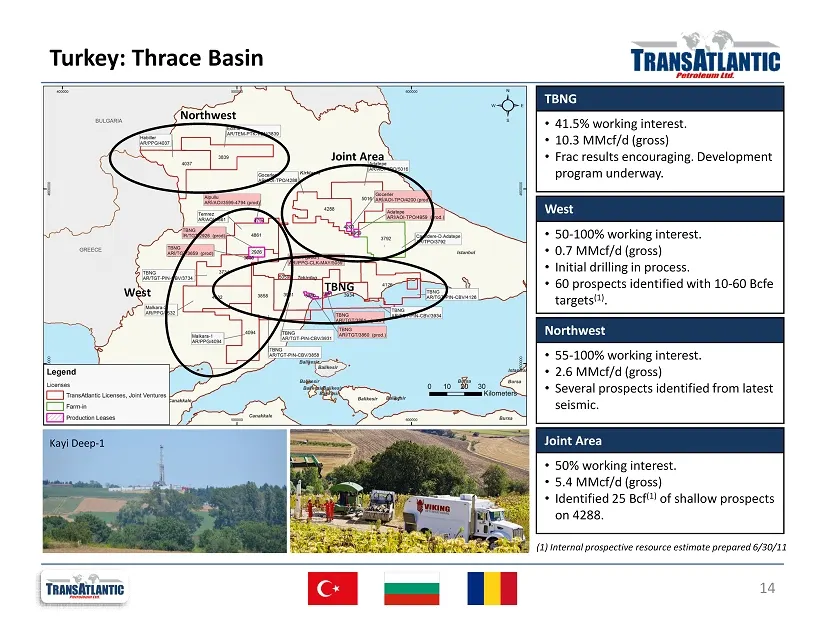
Slide 14: Turkey: Thrace Basin
Turkey: Thrace Basin 14 TBNG West Northwest Joint Area TBNG • 41.5% working interest. • 10.3 MMcf/d (gross) • Frac results encouraging. Development program underway. West • 50 - 100% working interest. • 0.7 MMcf/d (gross) • Initial drilling in process. • 60 prospects identified with 10 - 60 Bcfe tar
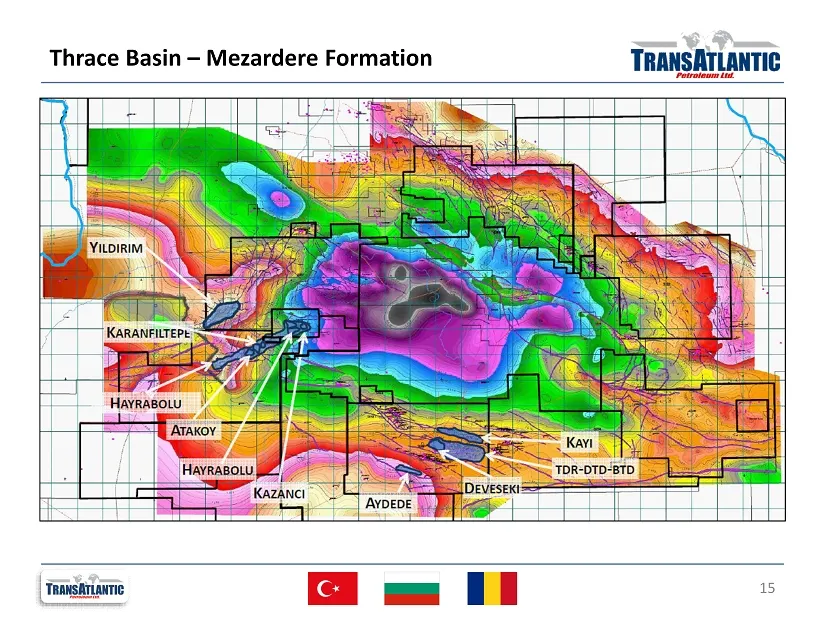
Slide 15: Thrace Basin – Mezardere Formation
Thrace Basin – Mezardere Formation 15
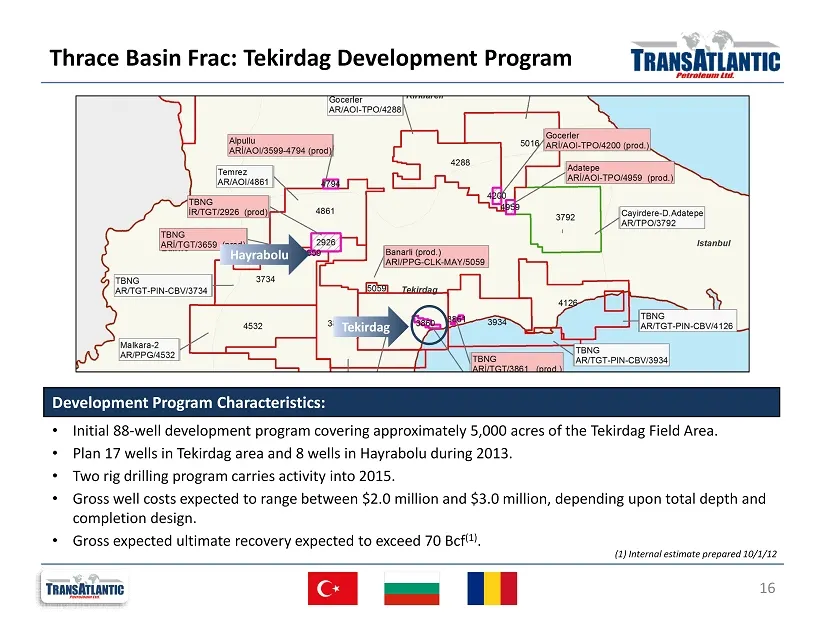
Slide 16: Thrace Basin Frac: Tekirdag Development Program
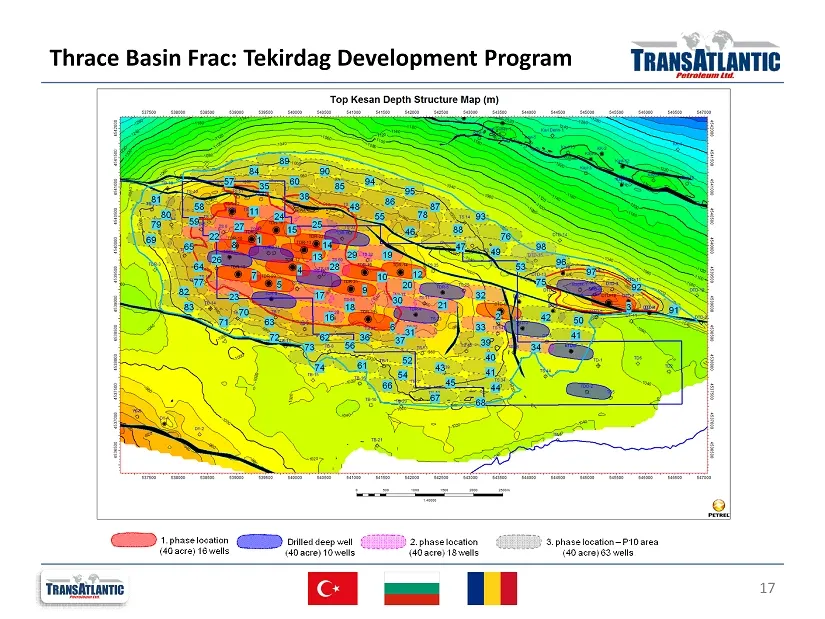
Thrace Basin Frac: Tekirdag Development Program 16 Development Program Characteristics: • Initial 88 - well development program covering approximately 5,000 acres of the Tekirdag Field Area. • Plan 17 wells in Tekirdag area and 8 wells in Hayrabolu during 2013. • Two rig drilling program carries act
Slide 17: Thrace Basin Frac: Tekirdag Development Program
Thrace Basin Frac: Tekirdag Development Program 17
Slide 18: Thrace Basin Frac: Hayrabolu Trend
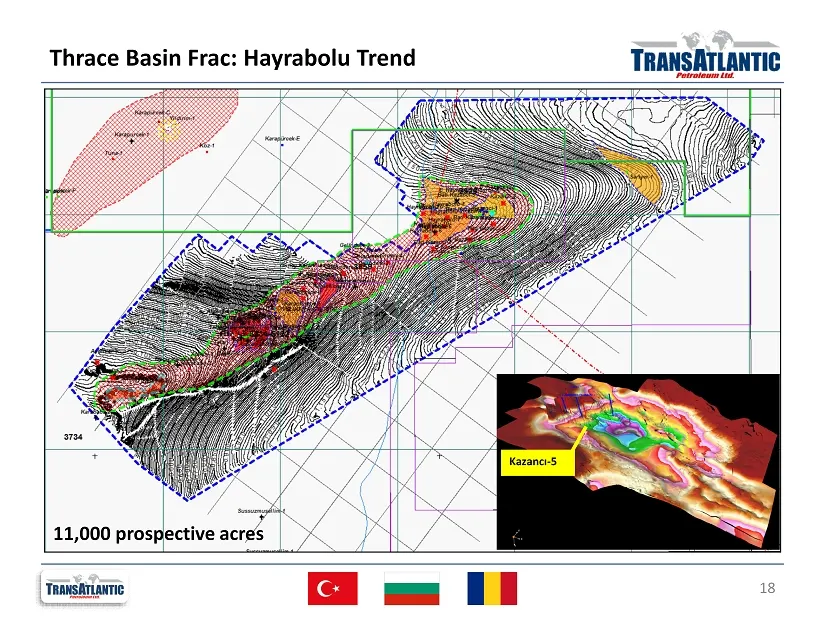
Thrace Basin Frac: Hayrabolu Trend 18 Kazancı - 5 11,000 prospective acres
Slide 19: Thrace Basin: Long-term Development Concept
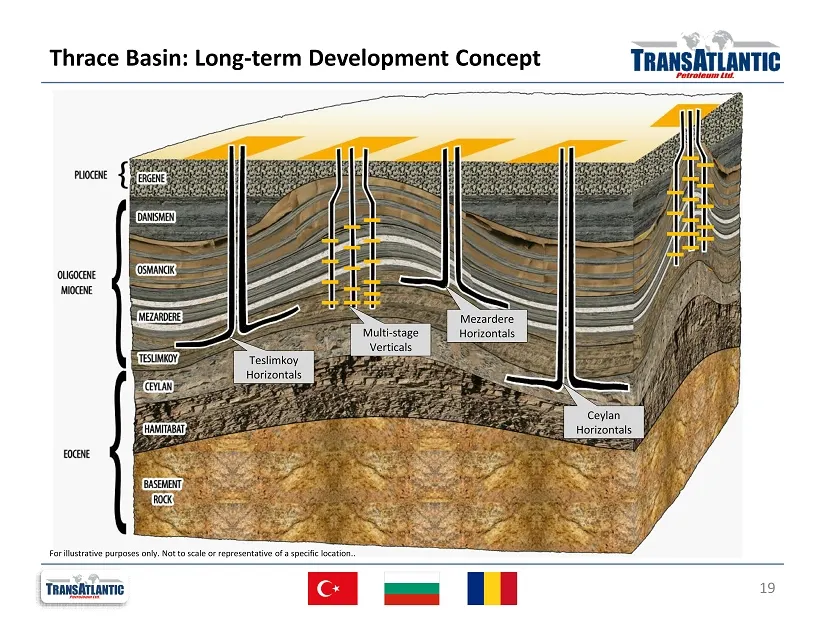
Thrace Basin: Long - term Development Concept 19 For illustrative purposes only. Not to scale or representative of a specific location.. Ceylan Horizontals Mezardere Horizontals Teslimkoy Horizontals Multi - stage Verticals
Slide 20: Bulgaria Overview
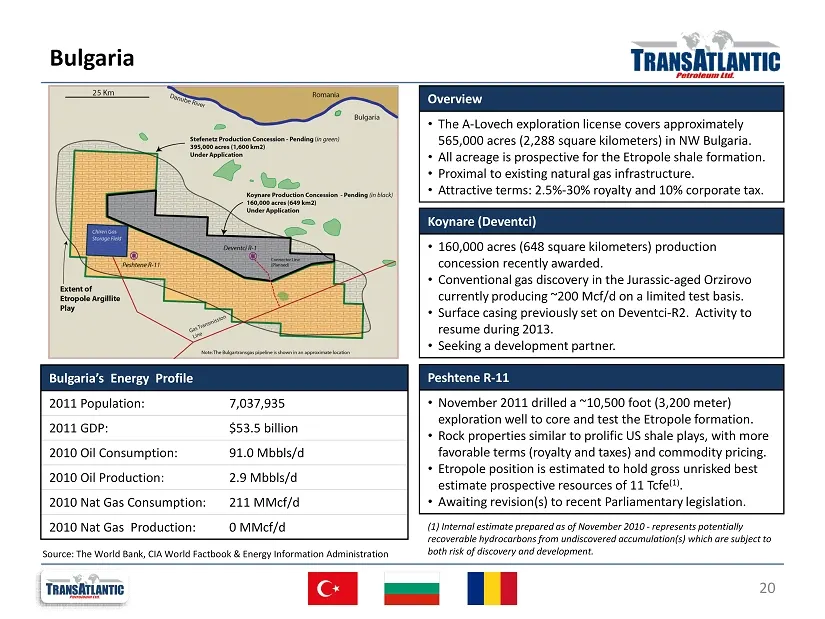
Bulgaria 20 Overview • The A - Lovech exploration license covers approximately 565,000 acres (2,288 square kilometers) in NW Bulgaria. • All acreage is prospective for the Etropole shale formation. • Proximal to existing natural gas infrastructure. • Attractive terms: 2.5% - 30% royalty and 10% corp
Slide 21: Q12 Financial & Operating Results
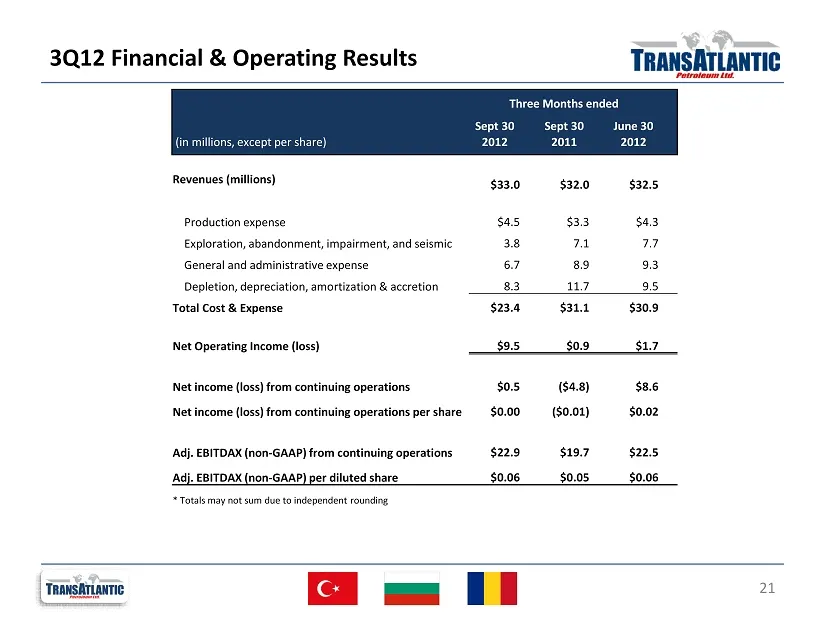
3 Q12 Financial & Operating Results 21 Three Months ended Sept 30 Sept 30 June 30 (in millions, except per share) 2012 2011 2012 Revenues (millions) $33.0 $32.0 $32.5 Production expense $4.5 $3.3 $4.3 Exploration, abandonment, impairment, and seismic 3.8 7.1 7.7 General and administrative expense 6.
Slide 22: EBITDAX Reconciliation
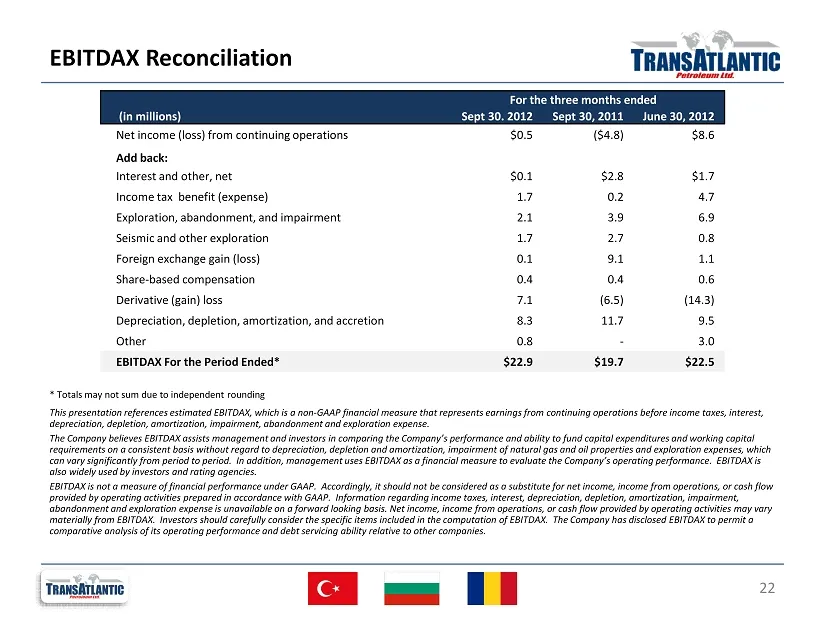
EBITDAX Reconciliation 22 For the three months ended (in millions) Sept 30. 2012 Sept 30, 20 11 June 30, 20 12 Net income (loss) from continuing operations $0.5 ($4.8) $8.6 Add back: Interest and other, net $0.1 $2.8 $1.7 Income tax benefit (expense) 1.7 0.2 4.7 Exploration, abandonment, and impairm
Slide 23: Hedge Profile
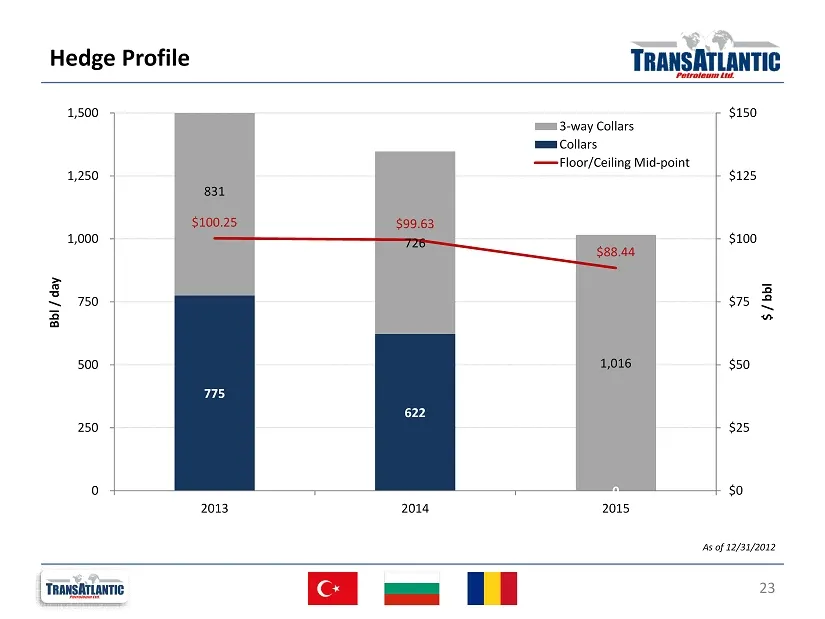
Hedge Profile 23 775 622 0 831 726 1,016 $100.25 $99.63 $88.44 $0 $25 $50 $75 $100 $125 $150 0 250 500 750 1,000 1,250 1,500 2013 2014 2015 $ / bbl Bbl / day 3-way Collars Collars Floor/Ceiling Mid-point As of 12/31/2012
Slide 24: PV10 Reconciliation
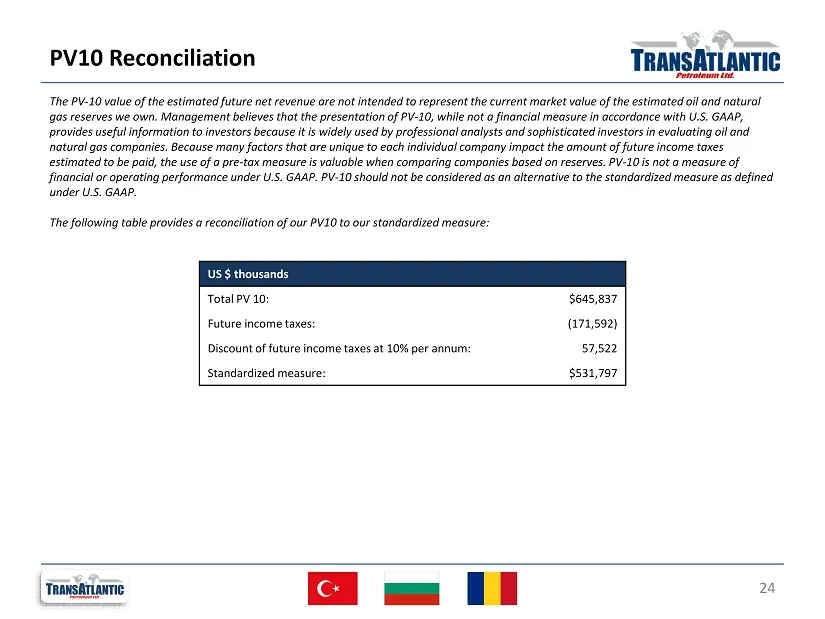
PV10 Reconciliation 24 The PV - 10 value of the estimated future net revenue are not intended to represent the current market value of the estimated oil and natural gas reserves we own. Management believes that the presentation of PV - 10, while not a financial measure in accordance with U.S. G AAP,
Slide 25: Investor Contact Information
Investor Contact Information Chad W. Potter, CFA VP – Finance / Investor Relations (214) 265 - 4746 [email protected] Wil F. Saqueton VP – Chief Financial Officer (214) 265 - 4743 [email protected] 16803 Dallas Parkway P.O. Box 246 Addison, TX 75001 - 0246 25
Source: SEC EDGAR · 8-K filed Jan 14, 2013
More decks from TransAtlantic Petroleum Ltd
 Shareholder Meeting (June 2020)11 slides · Jun 4, 2020
 Corporate Update (March 2020)9 slides · Mar 9, 2020
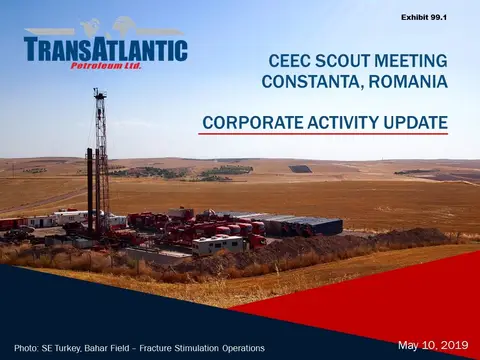 CEEC Scout Meeting, Constanta, Romania (May 2019)14 slides · May 10, 2019
 Technical Presentation (March 2019)10 slides · Mar 26, 2019
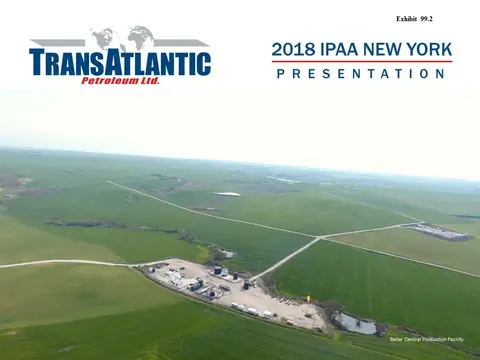 2018 IPAA OGIS New York32 slides · Apr 6, 2018
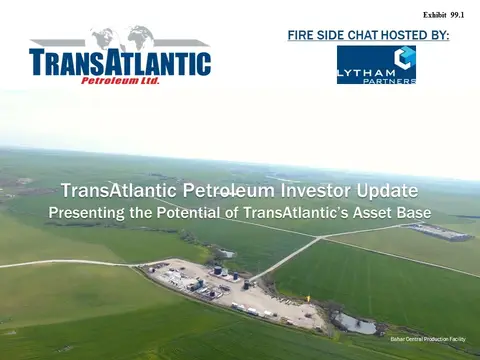 Investor Presentation (April 2018)14 slides · Apr 2, 2018