National Financial Partners Corp
National Financial Partners — Investor Presentation (December 2004)
29 slides from National Financial Partners's investor presentation, Dec 1, 2004
Slide 1: National Financial Partners Corp.
National Financial Partners Corp. December 1, 2004
Slide 2: Forward-Looking Statements
About Forward-Looking Statements and forward-looking risks Forward-looking these These of Actual results may differ materially discussion statements. statements. The Company expressly disclaims any additional for forward-looking forward-looking The Company refers you to its filings with the SEC, S-1
Slide 3: Explanatory Note on Non-GAAP Financial Information
Explanatory Note on Non-GAAP Financial Information on as Cash this at measures based defined within site Web are is or the “Company”) GAAP. page performance which earnings under Company’s of following Cash the includes both apparent the on EPS”), (“GAAP”). otherwise on available presentation (“Cash
Slide 4: Reconciliation of Net Income to Cash Earnings
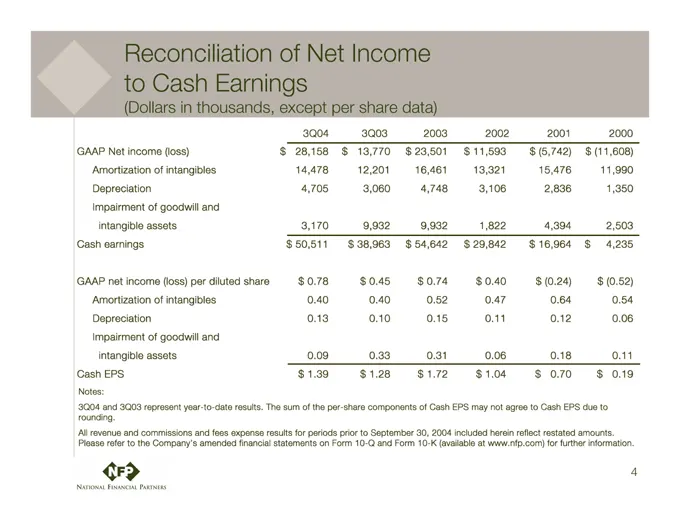
Reconciliation of Net Income to Cash Earnings (Dollars in thousands, except per share data) 2000 11,990 1,350 2,503 4,235 (0.52) 0.54 0.06 0.11 0.19 (11,608) $ $ $ $ (5,742) 15,476 2,836 4,394 16,964 (0.24) 0.64 0.12 0.18 0.70 $ $ $ $ 3,106 1,822 0.40 0.47 0.11 0.06 1.04 11,593 13,321 29,842 $ $ $ $
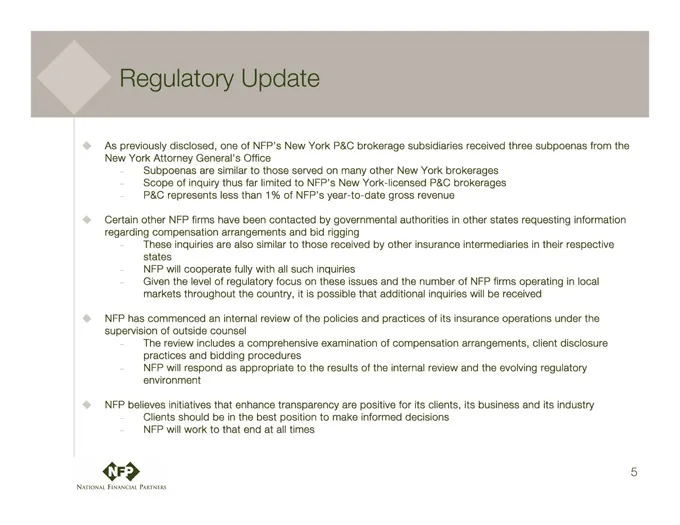
Slide 5: Regulatory Update
Regulatory Update As previously disclosed, one of NFP’s New York P&C brokerage subsidiaries received three subpoenas from the New York Attorney General’s Office Subpoenas are similar to those served on many other New York brokerages Scope of inquiry thus far limited to NFP’s New York-licensed P&C br
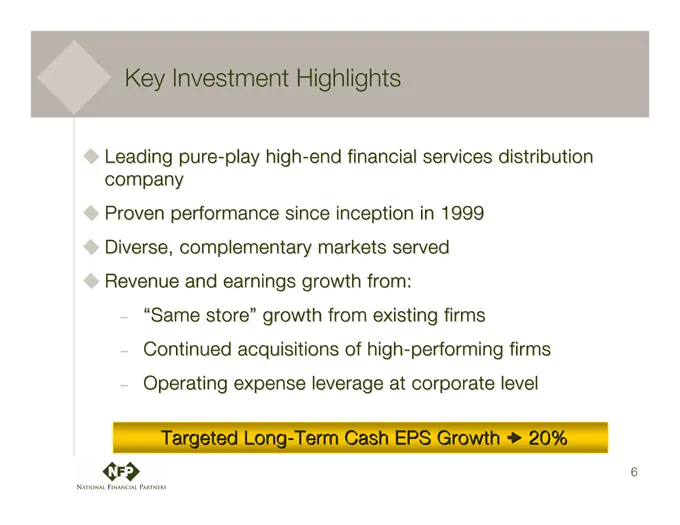
Slide 6: Key Investment Highlights
Key Investment Highlights Leading pure-play high-end financial services distribution company Proven performance since inception in 1999 Diverse, complementary markets served Revenue and earnings growth from: “Same store” growth from existing firms Continued acquisitions of high-performing firms Oper
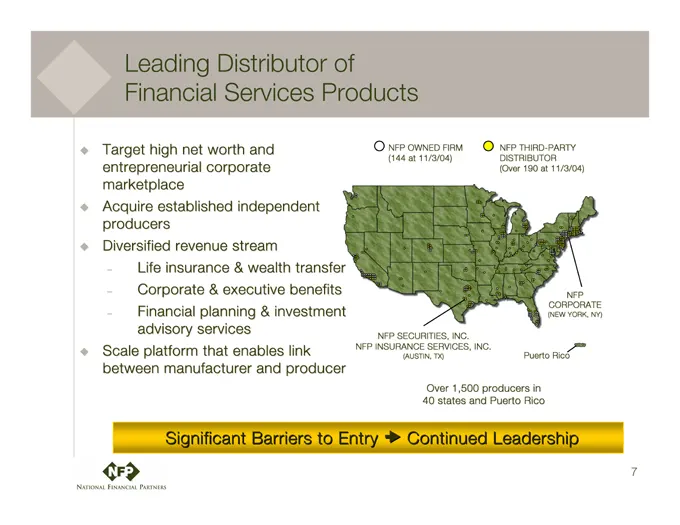
Slide 7: Leading Distributor of Financial Services Products
Leading Distributor of Financial Services Products Target high net worth and entrepreneurial corporate marketplace Acquire established independent producers Diversified revenue stream Life insurance & wealth transfer Corporate & executive benefits Financial planning & investment advisory services Sc
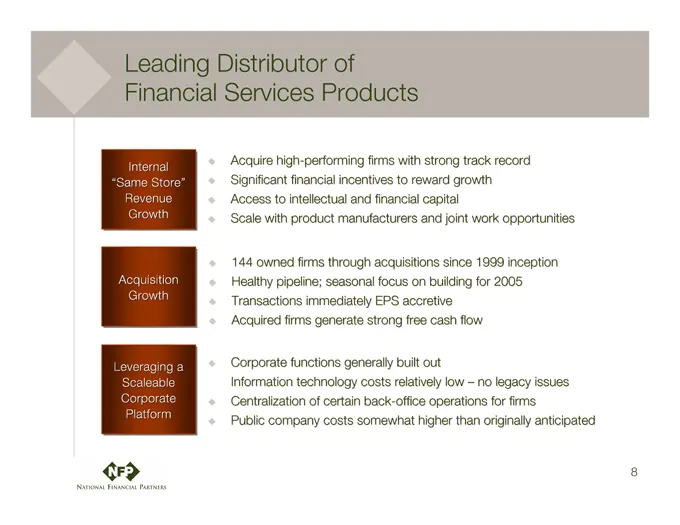
Slide 8: Leading Distributor of Financial Services Products
Leading Distributor of Financial Services Products • issues anticipated record opportunities inception 2005 legacy firms for originally work 1999 for no track growth flow – than joint since low strong capital and building cash out operations higher with reward on accretive free to focus built relati
Slide 9: Strong Revenue Growth
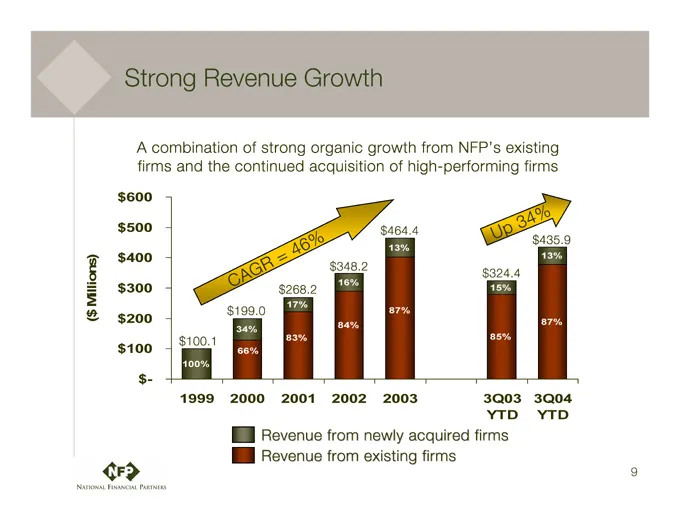
Strong Revenue Growth A combination of strong organic growth from NFP’s existing firms and the continued acquisition of high-performing firms ($ Millions) CAGR 46% UP 34% $600 $500 $400 $300 $200 $100 $- $100.1 $199.0 $268.2$ $348.2 $464.4 $324.4 $435.9 1999 2000 2001 2002 2003 3Q03 3Q03 Millions) (
Slide 10: Diversified Revenue
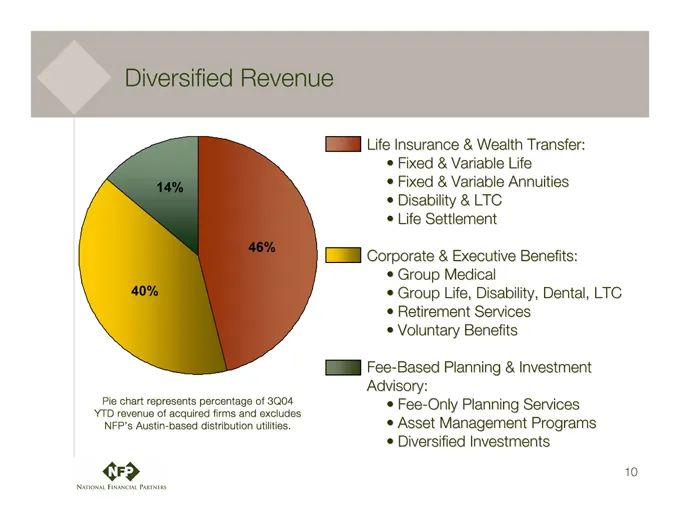
Diversified Revenue Pie chart represents percentage of 3Q04 YTD revenue of acquired firms and excludes NFP’s Austin-based distribution utilities. Life Insurance & Wealth Transfer: Fixed & Variable Life Fixed & Variable Annuities Disability <C • Life Settlement • • • Corporate & Executive Benefits:
Slide 11: Diversified Revenue Stream
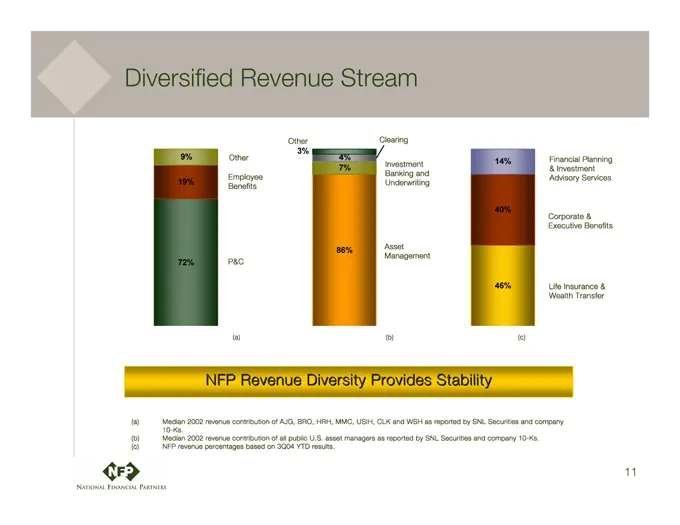
Diversified Revenue Stream Financial Planning & Investment Advisory Services Corporate & Executive Benefits Life Insurance & Wealth Transfer (c) 14% 40% 46% NFP Investment Banking and Underwriting Asset Management (b) 4% 7% 86% Asset Managers Other Employee Benefits P&C (a) 9% 19% 72% NFP Revenue Di
Slide 12: Same Store Revenue Growth: The Results and the Targets
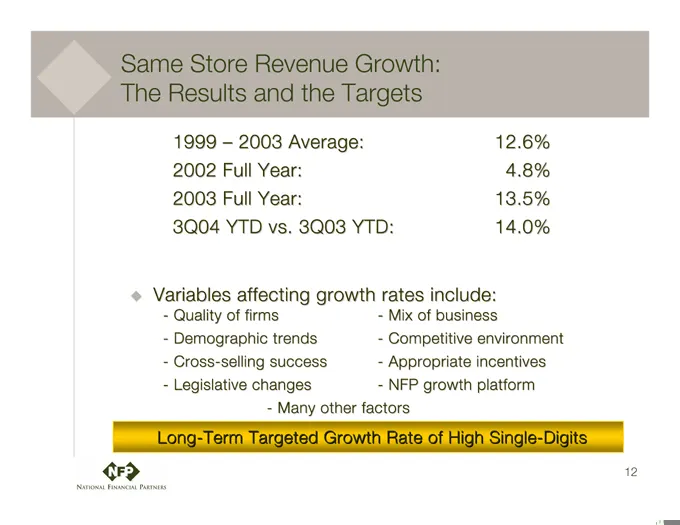
Same Store Revenue Growth: The Results and the Targets 12.6% 4.8% 13.5% 14.0% 2003 Average: 1999 – 2002 Full Year: 2003 Full Year: 3Q04 YTD vs. 3Q03 YTD: Variables affecting growth rates include: u Mix of business Competitive environment Appropriate incentives NFP growth platform -—- - Quality of fi
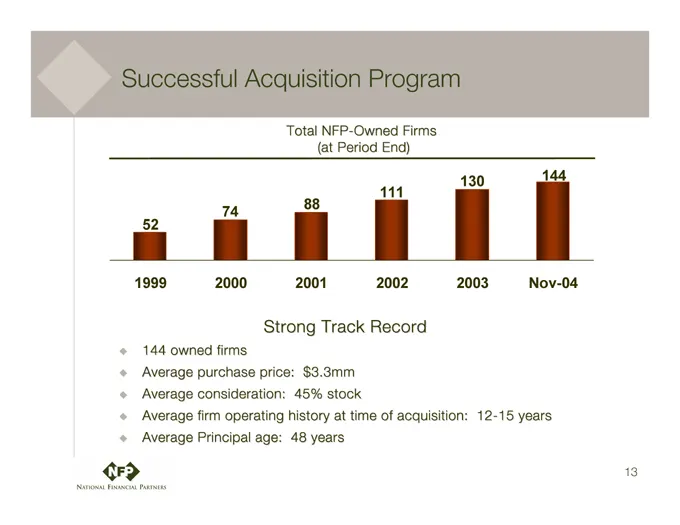
Slide 13: Successful Acquisition Program
Successful Acquisition Program Total NFP-Owned Firms (at Period End) Strong Track Record Nov-04 2003 • years 12-15 acquisition: of time $3.3mm stock at years 45% history 48 price: operating age: firms purchase consideration: Principal owned firm 144 Average Average Average Average • u u u
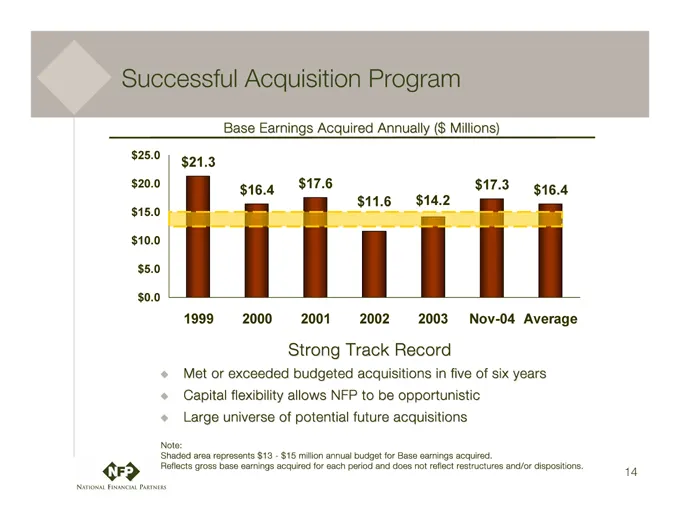
Slide 14: Successful Acquisition Program
Successful Acquisition Program Base Earnings Acquired Annually ($ Millions) Strong Track Record • years six of five in opportunistic acquisitions be acquisitions to future budgeted NFP potential allows of exceeded flexibility universe or Capital Large Met • u Note: $15 million annual budget for Base
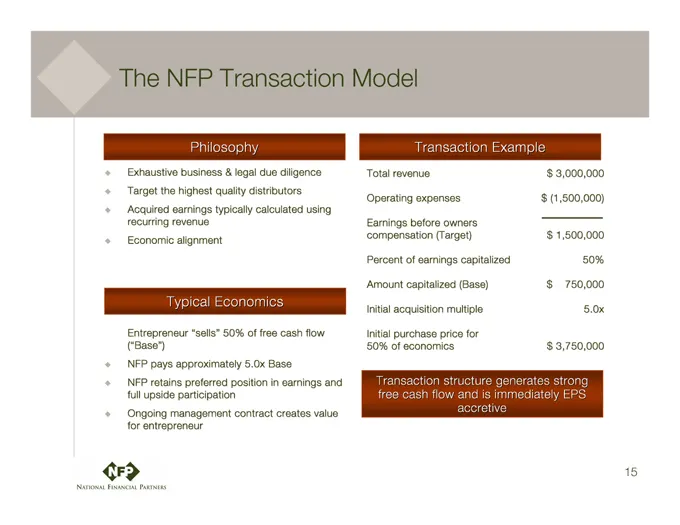
Slide 15: The NFP Transaction Model
The NFP Transaction Model $3,000,000, $(1,500,000) $1,500,000 50% $ 750,000 5.0x $ 3,750,000 Exhaustive • diligence using due distributors calculated legal & quality typically business highest earnings the Acquired Target • u 50% of free cash flow Entrepreneur “sells” (“Base”) • and value earnings c
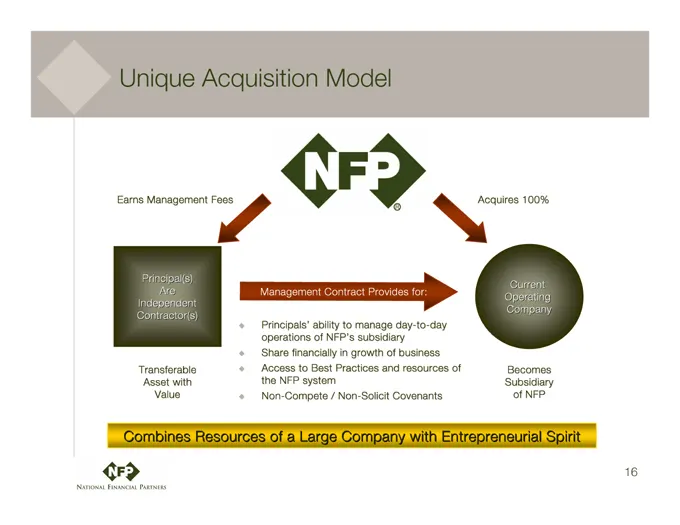
Slide 16: Unique Acquisition Model
Unique Acquisition Model Transferable Asset with Value • of business resources Covenants of and growth in Practices Non-Solicit / Best system financially to NFP Share Access the Non-Compete • u Becomes Subsidiary of NFP
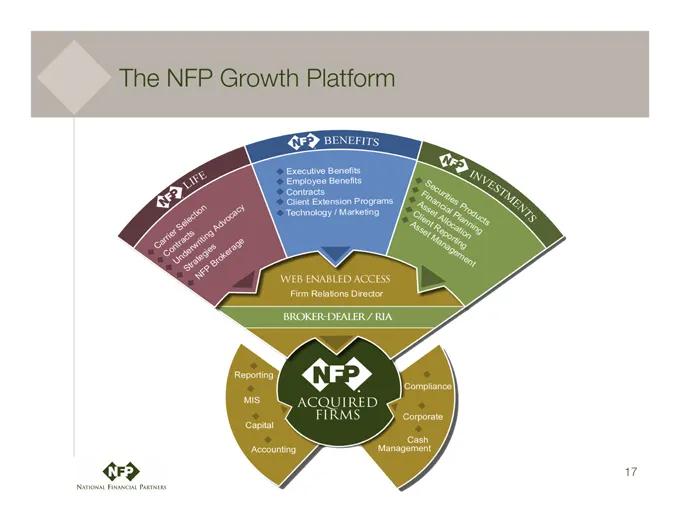
Slide 17: The NFP Growth Platform
The NFP Growth Platform Carrier Selection Contracts Underwriting Advocacy Strategies NFP Brokerage Executive Benefits Employee Benefits Contracts Client Extension Programs Technology/Marketing Securities Products Financial Planning Asset Allocation Client Reporting Asset Management WEB ENABLED ACCES
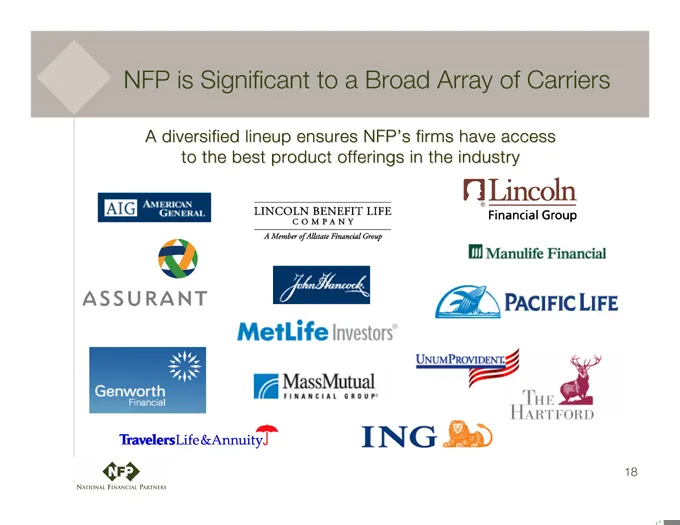
Slide 18: NFP is Significant to a Broad Array of Carriers
NFP is Significant to a Broad Array of Carriers A diversified lineup ensures NFP’s firms have access to the best product offerings in the industry AMERICAN GENERAL LINCOLN BENEFIT LIFE COMPONY A member of allstate Financial Group Lincoln Financial Group Assurant Metlife Investors Pacific Life Mass M
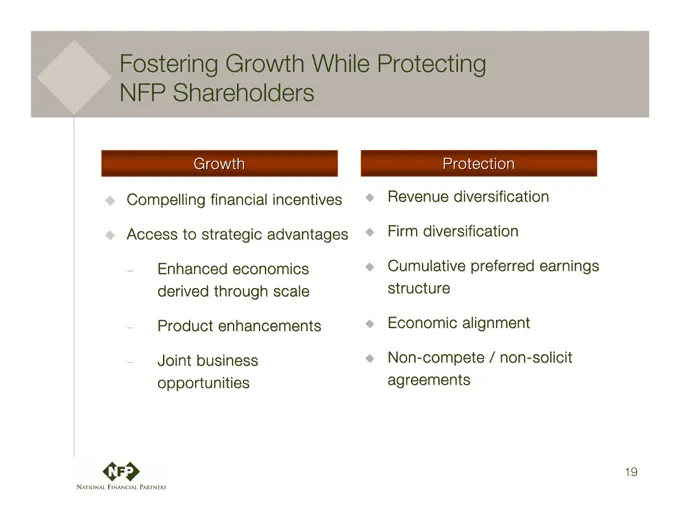
Slide 19: Fostering Growth While Protecting NFP Shareholders
Fostering Growth While Protecting NFP Shareholders Compelling financial incentives Access to strategic advantages – – – Enhanced economics derived through scale Product enhancements Joint business opportunities Revenue diversification Firm diversification Cumulative preferred earning structure Econo
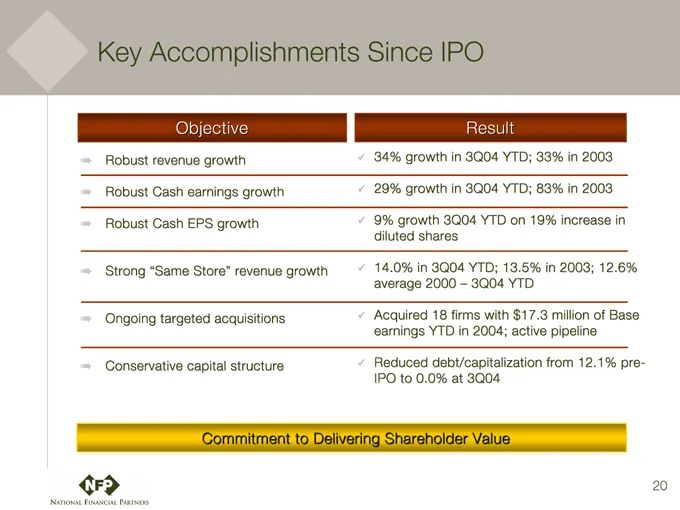
Slide 20: Key Accomplishments Since IPO
Key Accomplishments Since IPO Objective Result Robust revenue growth 34% growth in 3Q04 YTD; 33% in 2003 Robust Cash earnings growth 29% growth in 3Q04 YTD; 83% in 2003 Robust Cash EPS growth 9% growth 3Q04 YTD on 19% increase in diluted shares Strong “Same Store” revenue growth 14.0% in 3Q04 YTD; 1
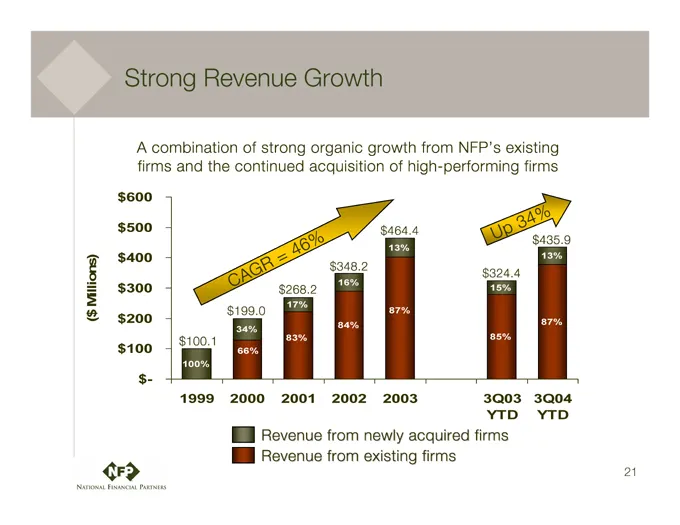
Slide 21: Strong Revenue Growth
Strong Revenue Growth A combination of strong organic growth from NFP’s existing firms and the continued acquisition of high-performing firms $600 $500 $400 $300 $200 $100 $- Millions) ($ YTD YTD Revenue from newly acquired firms Revenue from existing firms
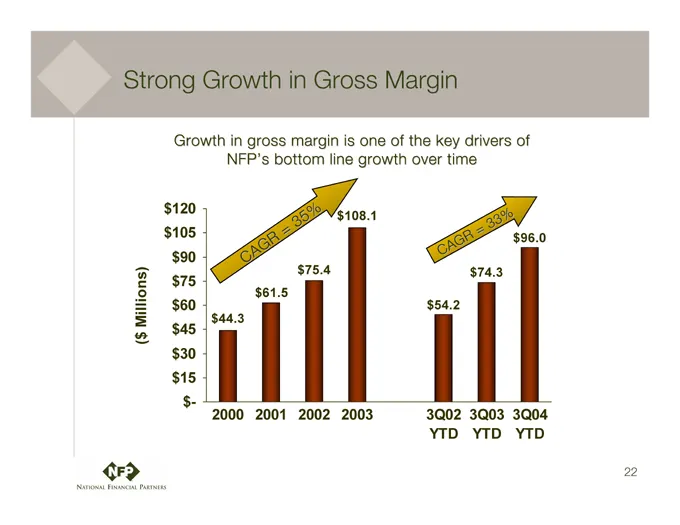
Slide 22: Strong Growth in Gross Margin
Strong Growth in Gross Margin Growth in gross margin is one of the key drivers of NFP’s bottom line growth over time Millions) ($ YTD YTD YTD CAGR 35% CAGR 33% $ 120 $ 105 $ $ 75 3Q03 $ $ $ $ $ 44.3 $ 61.5 $ 75.4 $ 108.1 $ 54.2 $ 74.3 $ 96.0 3Q02 3Q02
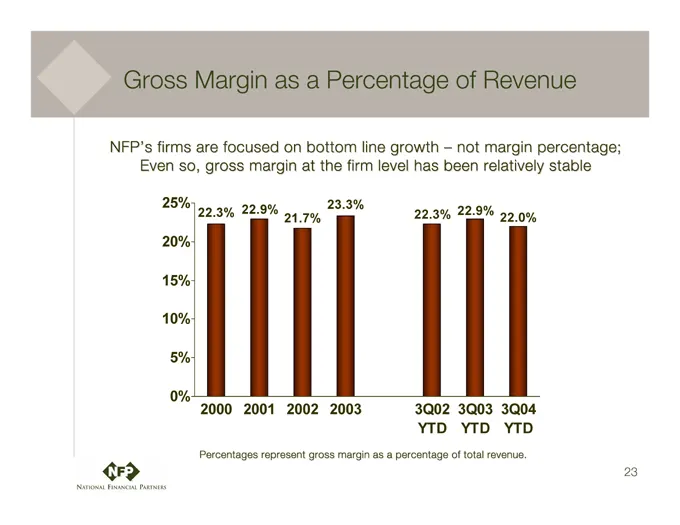
Slide 23: Gross Margin as a Percentage of Revenue
Gross Margin as a Percentage of Revenue not margin percentage; Even so, gross margin at the firm level has been relatively stable NFP’s firms are focused on bottom line growth – 22.3% 22.9% 21.7% 23.3% 22.3% 22.9% 22.0% 25% 20% 15% 10% 5% 0% 2000 2001 2002 2003 YTD YTD YTD Percentages represent gros
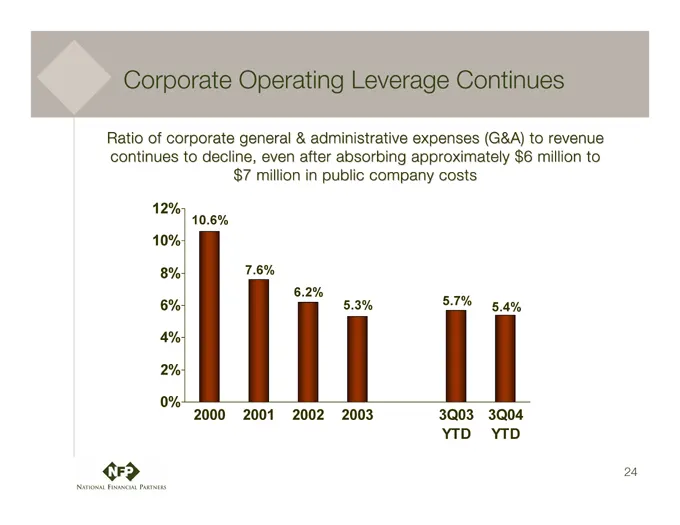
Slide 24: Corporate Operating Leverage Continues
Corporate Operating Leverage Continues Ratio of corporate general & administrative expenses (G&A) to revenue continues to decline, even after absorbing approximately $6 million to $7 million in public company costs 12 % 10 % 8% 6% 4% 2% 0% 10.6% 7.6% 6.2% 5.3% 5.7% 5.4% YTD YTD
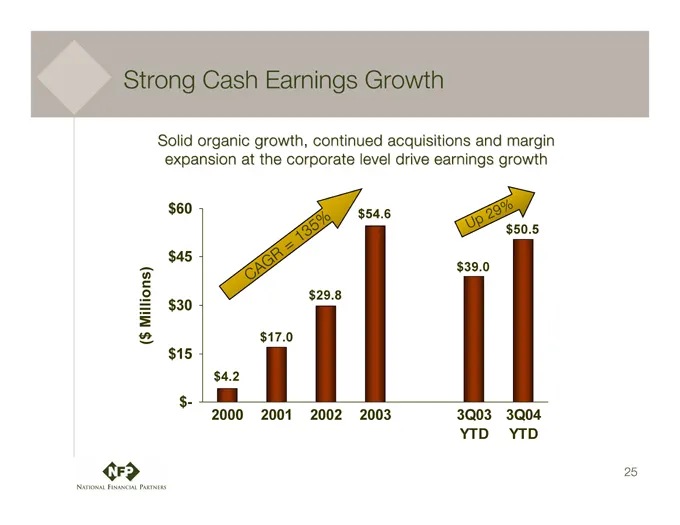
Slide 25: Strong Cash Earnings Growth
Strong Cash Earnings Growth Solid organic growth, continued acquisitions and margin expansion at the corporate level drive earnings growth $ 60 $45 $30 $15 $4.2 $17.0 $29.8 $54.6 $39.0 $50.5 CAGR 135% Up 29% Millions) ($ 3Q03 3Q04 YTD YTD
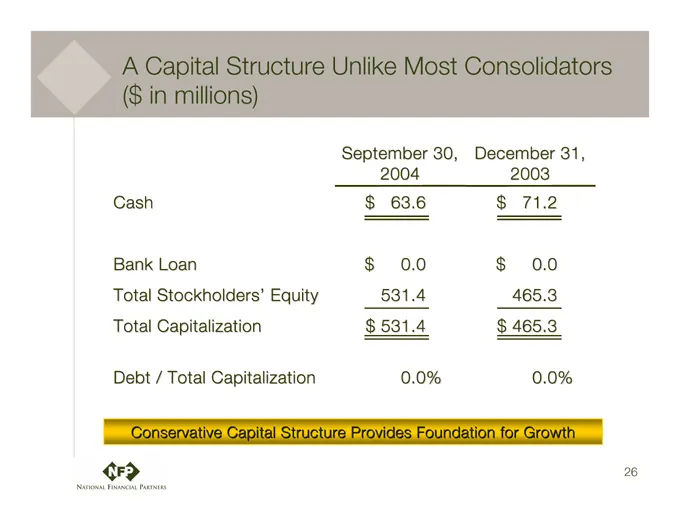
Slide 26: Capital Structure Unlike Most Consolidators
A Capital Structure Unlike Most Consolidators ($ in millions) 2003 71.2 0.0 465.3 465.3 0.0% December 31, $ $ $ 2004 63.6 0.0 531.4 531.4 0.0% September 30, $ $ $ Equity Debt / Total Capitalization Cash Bank Loan Total Stockholders’ Total Capitalization Conservative captial Structure Provides Founda
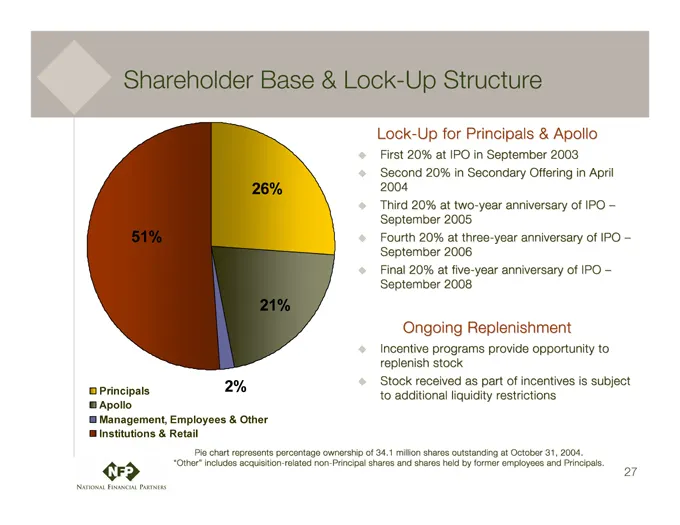
Slide 27: Shareholders Base & Lock Up Structure
Shareholders Base & Lock Up Structure Lock up for Principals & Apollo First 20% at IPO September 2003 Second 20% in Secondary Offering in April Third 20% two year anniversary of IPO September 2006 Fourth 20% two year anniversary of IPO September 2006 Ongoing Replenishment Incentive programs provide
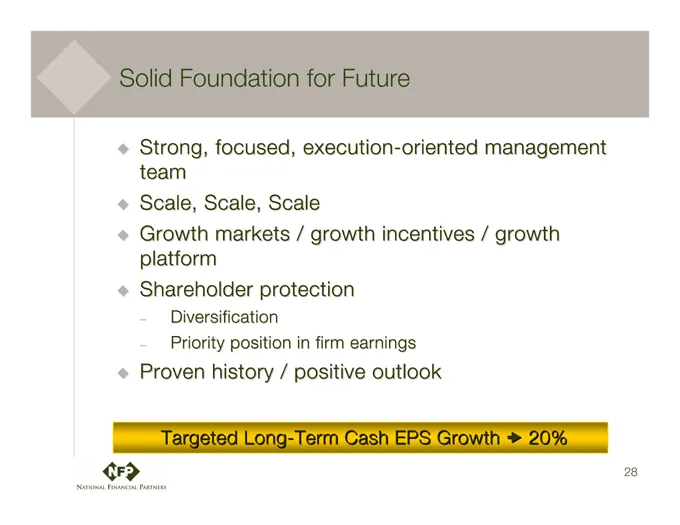
Slide 28: Solid Foundation for Future
Solid Foundation for Future Š Strong, focused, execution-oriented management team Š Scale, Scale, Scale Š Growth markets /growth incentives / growth platform Š Share holder protection - Diversification - Priority position in firm earnings Proven history / positive outlook Targeted Long-Term Cash EPS

Slide 29: Corporate Headquarters
Corporate Headquarters National Financial Partners 787 7th Avenue, 49th Floor New York, NY 10036 phone 212.301.4000 www.nfp.com
Source: SEC EDGAR · 8-K filed Dec 1, 2004
More decks from National Financial Partners Corp
 Q4 2012 Earnings Presentation19 slides · Feb 15, 2013
 Q3 2012 Earnings Presentation18 slides · Oct 31, 2012
 Q2 2012 Earnings Presentation19 slides · Jul 31, 2012
 Q1 2012 Earnings Presentation19 slides · Apr 27, 2012
 Q4 2011 Earnings Presentation18 slides · Feb 8, 2012
 Q3 2011 Earnings Presentation19 slides · Oct 28, 2011