Meredith — UBS 44th Annual Global Media and Communications Conference 2016
39 slides from Meredith's conference presentation, Dec 6, 2016

Slide 1: UBS 44th Annual Global Media and Communications Conference
UBS 44th Annual Global Media and Communications Conference December 6, 2016

Slide 2: (Video)
(Video)
Slide 3: Disclaimer
DISCLAIMER This presentation contains confidential information regarding Meredith Corporation (“Meredith” or the “Company”). This presentation constitutes “Business Information” under the Confidentiality Agreement the recipient signed and delivered to the Company and its use and retention are subjec
Slide 4: Today's Agenda
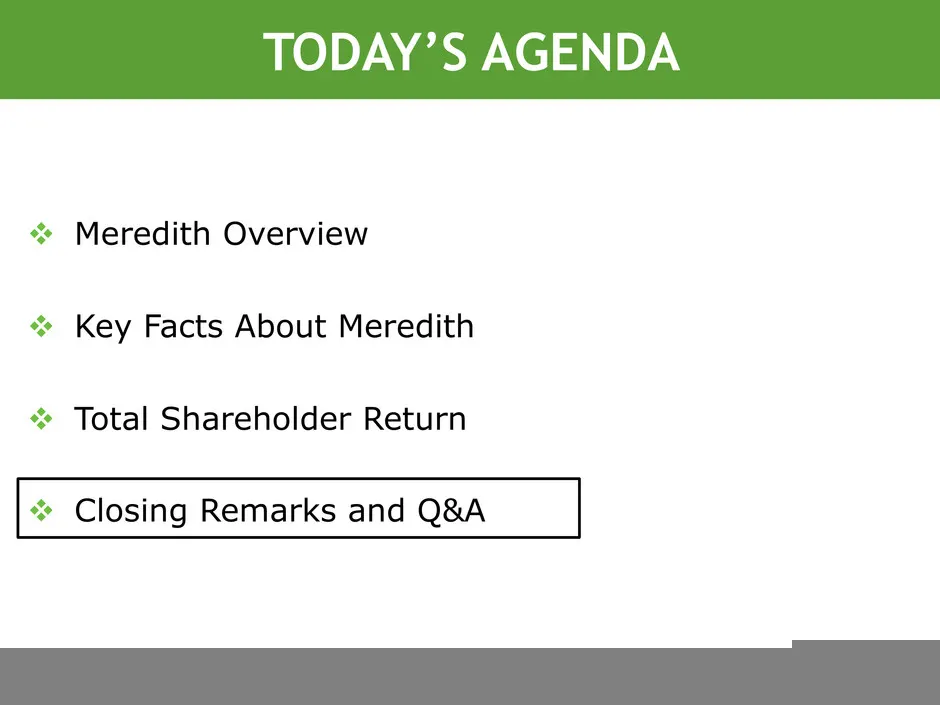
TODAY’S AGENDA Meredith Overview Key Facts About Meredith Total Shareholder Return Closing Remarks and Q&A 4
Slide 5: Key Takeaways From Today
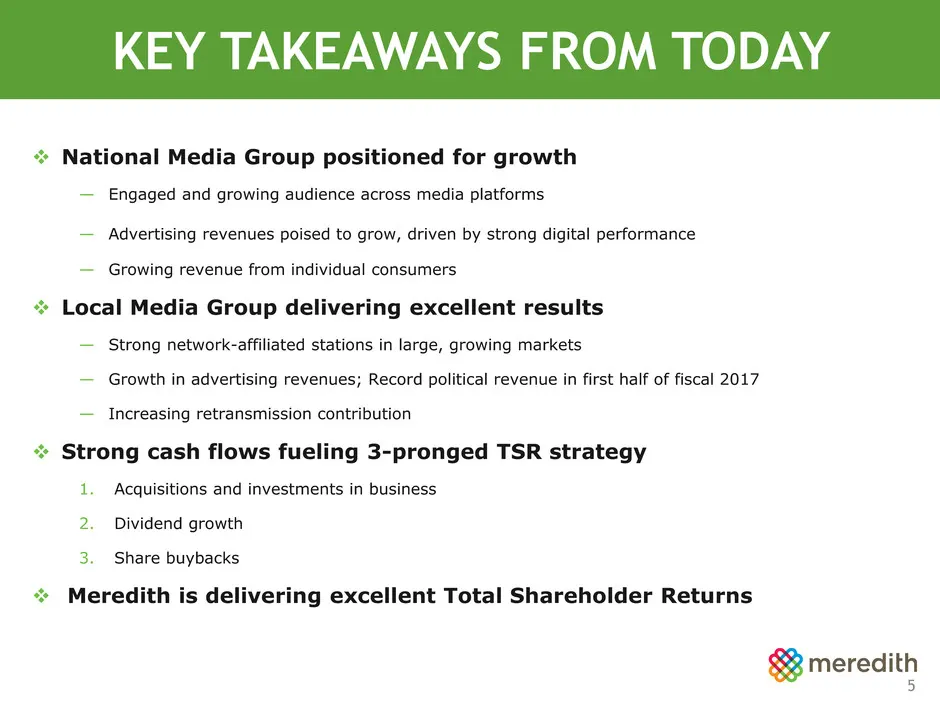
National Media Group positioned for growth — Engaged and growing audience across media platforms — Advertising revenues poised to grow, driven by strong digital performance — Growing revenue from individual consumers Local Media Group delivering excellent results — Strong network-affiliated stat
Slide 6: Revenue and Profit Are Growing
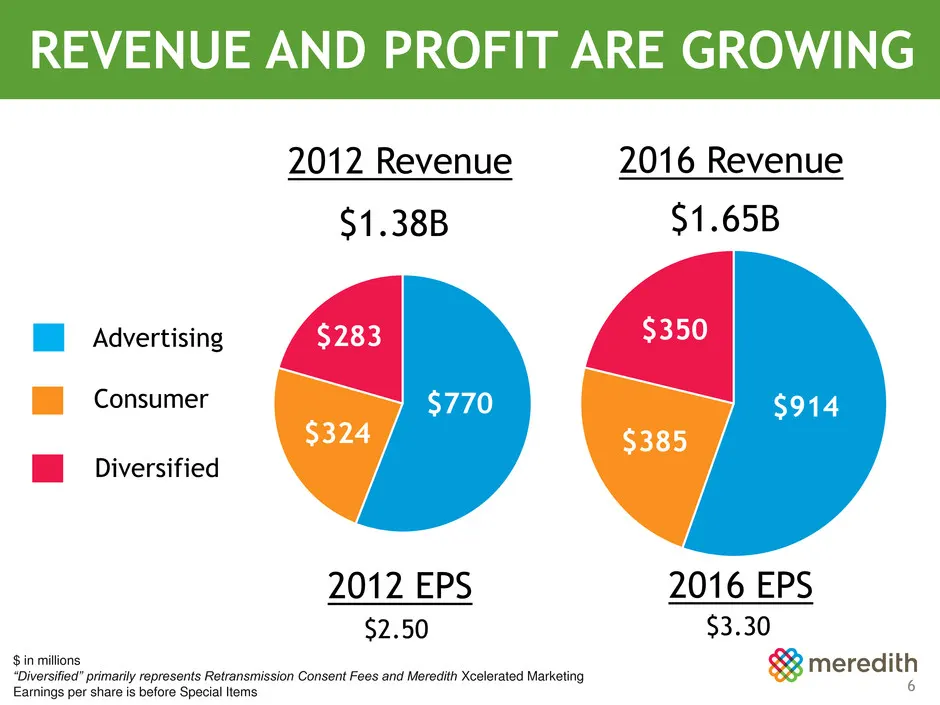
REVENUE AND PROFIT ARE GROWING National Media Revenue: $1.1B EBITDA: $154M¹ Local Media Revenue: $622M EBITDA: $248M¹ $ in millions “Diversified” primarily represents Retransmission Consent Fees and Meredith Xcelerated Marketing Earnings per share is before Special Items $770 $324 $283 $1.38B $914 $
Slide 7: A Strong Start to Fiscal 2017
A STRONG START TO FISCAL 2017 Record advertising revenue, led by political dollars Strong digital and improved print advertising performance Retransmission continues to grow; Renewals in process Rapid growth in consumer connection across media platforms Strong growth in cash flow 7
Slide 8: Today's Agenda
TODAY’S AGENDA Meredith Overview Key Facts About Meredith National Media Group Local Media Group Total Shareholder Return Closing remarks and Q&A 8
Slide 9: National Media Brands Have Largest Reach to Women
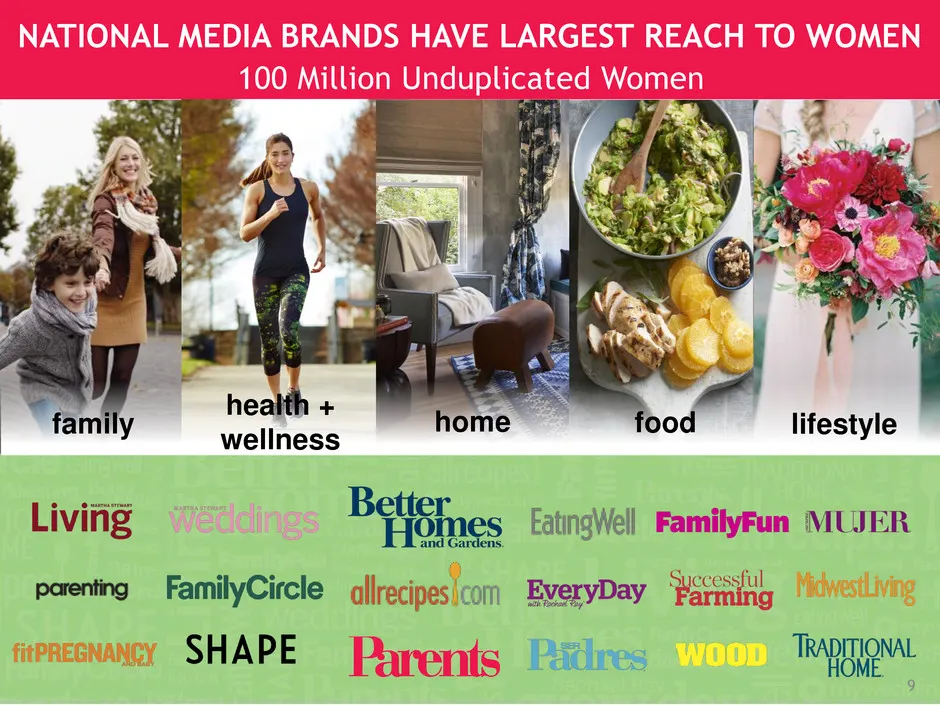
NATIONAL MEDIA BRANDS HAVE LARGEST REACH TO WOMEN 9 100 Million Unduplicated Women home health + wellness homefamily lifestylefood
Slide 10: Strong Reach to Millennial Women
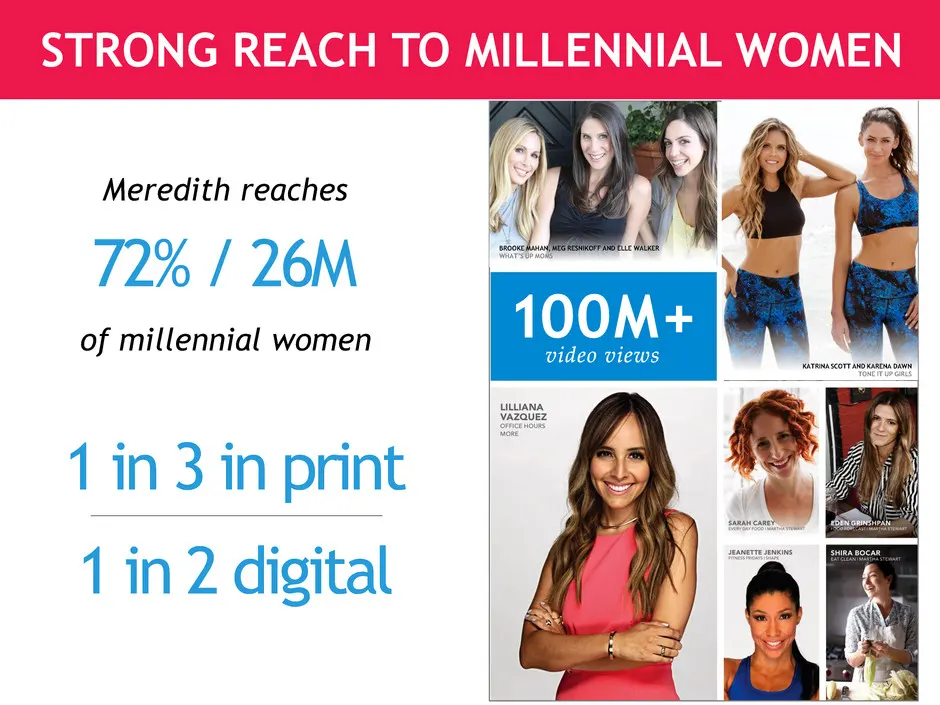
72% / 26M of millennial women 1 in 3 in print 1 in 2 digital STRONG REACH TO MILLENNIAL WOMEN Meredith reaches 10 KATRINA SCOTT AND KARENA DAWN TONE IT UP GIRLS BROOKE MAHAN, MEG RESNIKOFF AND ELLE WALKER WHAT’S UP MOMS
Slide 11: Better Homes and Gardens Millennial Reach
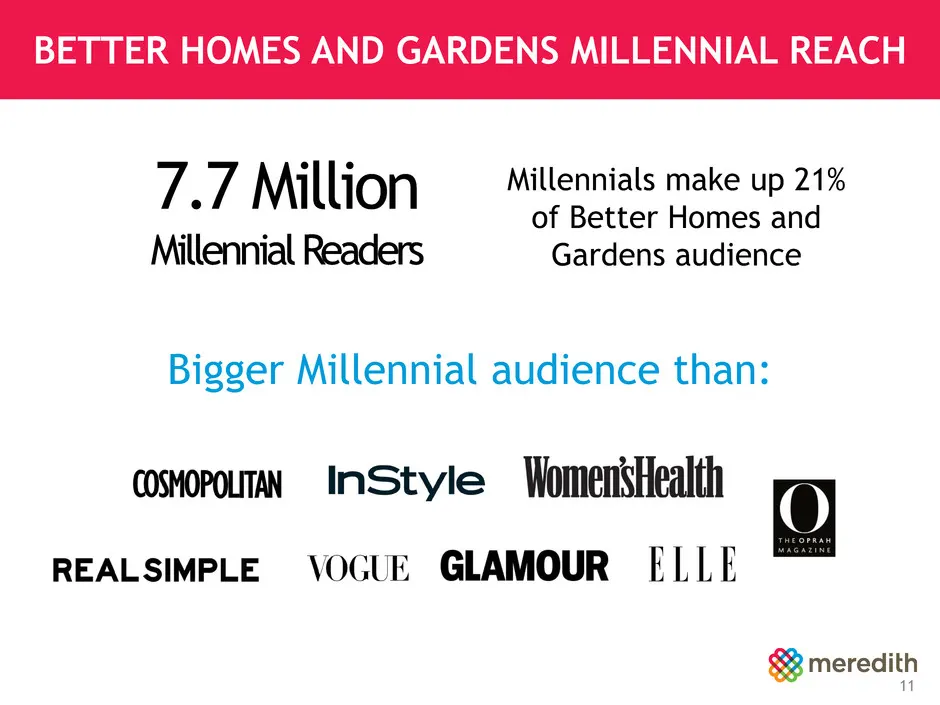
BETTER HOMES AND GARDENS MILLENNIAL REACH 11 Millennials make up 21% of Better Homes and Gardens audience 7.7 Million Millennial Readers Bigger Millennial audience than:
Slide 12: National Media Group Strategies
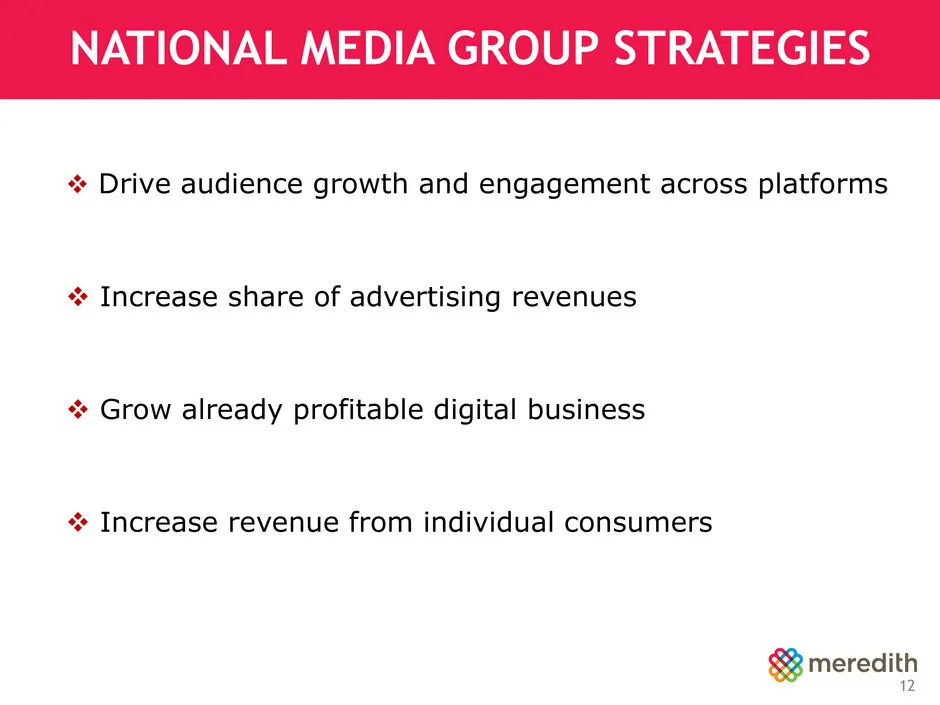
NATIONAL MEDIA GROUP STRATEGIES 12 Drive audience growth and engagement across platforms Increase share of advertising revenues Grow already profitable digital business Increase revenue from individual consumers
Slide 13: Total Audience Is Growing
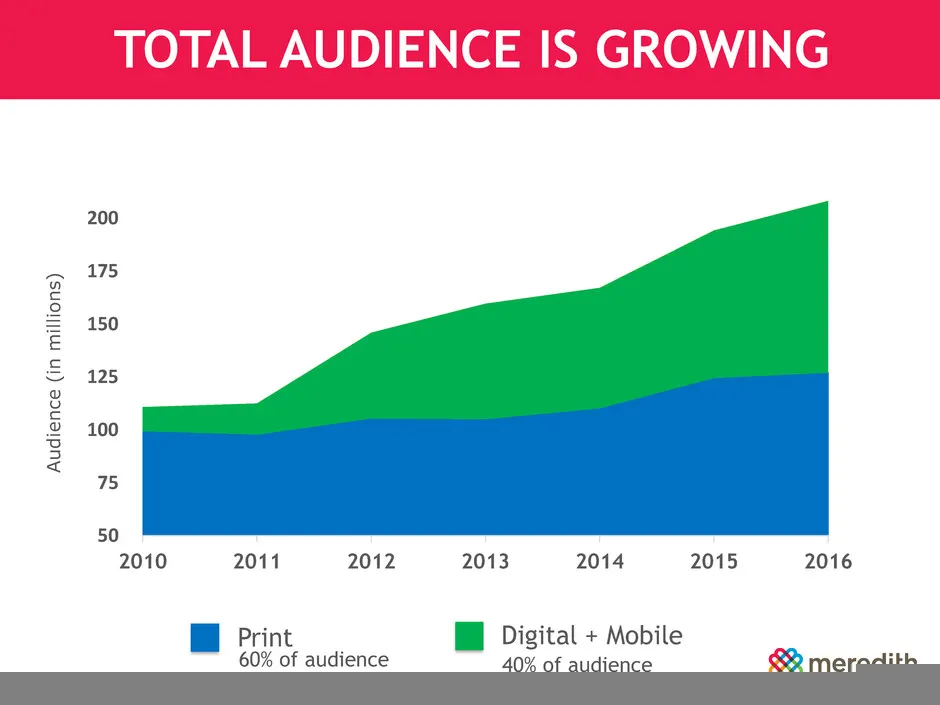
TOTAL AUDIENCE IS GROWING Digital is adding to Meredith’s total audience, and is not cannibalizing print 50 75 100 125 150 175 200 2010 2011 2012 2013 2014 2015 2016 A u d ie n c e ( in m il li on s ) Print Digital + Mobile 40% of audience 60% of audience 13
Slide 14: Meredith Leads With Consumers and Advertisers
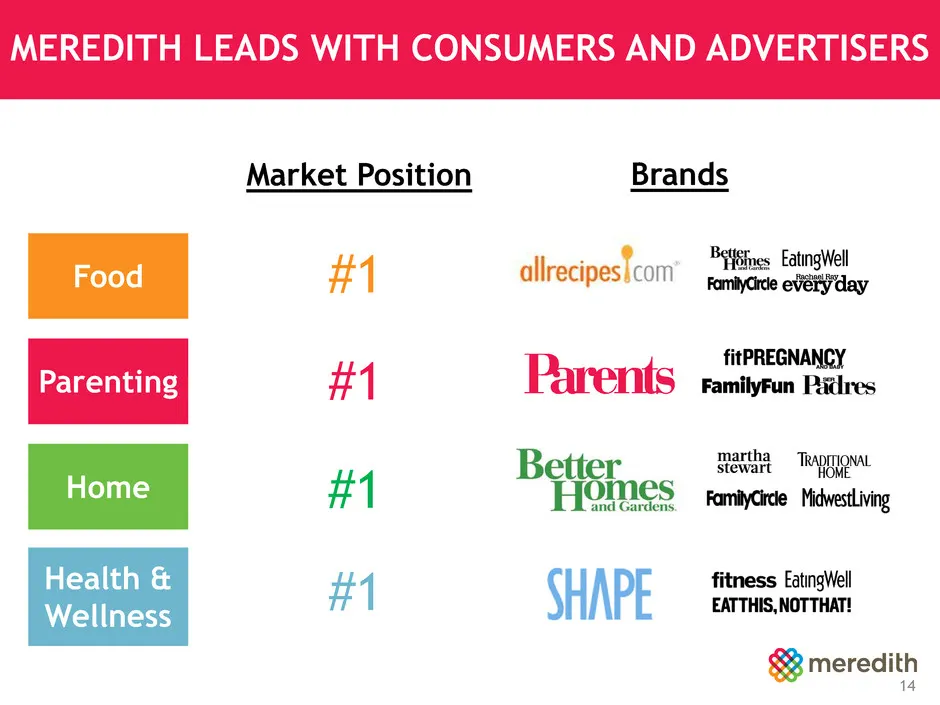
MEREDITH LEADS WITH CONSUMERS AND ADVERTISERS 14 Food Home Health & Wellness Parenting Market Position #1 #1 #1 #1 Brands
Slide 15: Meredith Guarantees Advertising Performance
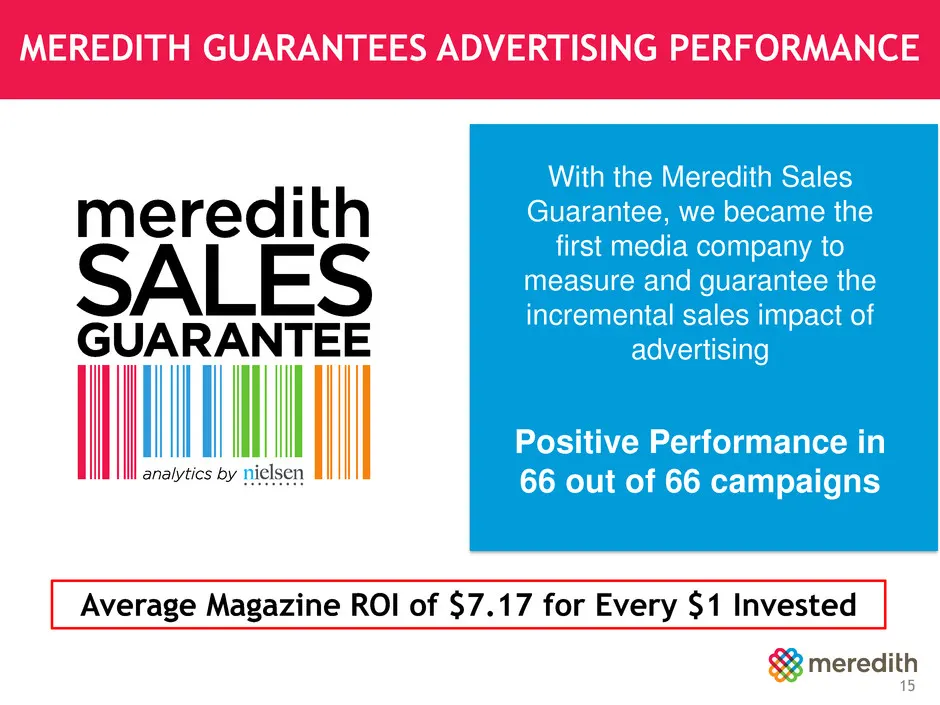
MEREDITH GUARANTEES ADVERTISING PERFORMANCE With the Meredith Sales Guarantee, we became the first media company to measure and guarantee the incremental sales impact of advertising Positive Performance in 66 out of 66 campaigns 15 Average Magazine ROI of $7.17 for Every $1 Invested
Slide 16: Digital Business Operates at Scale
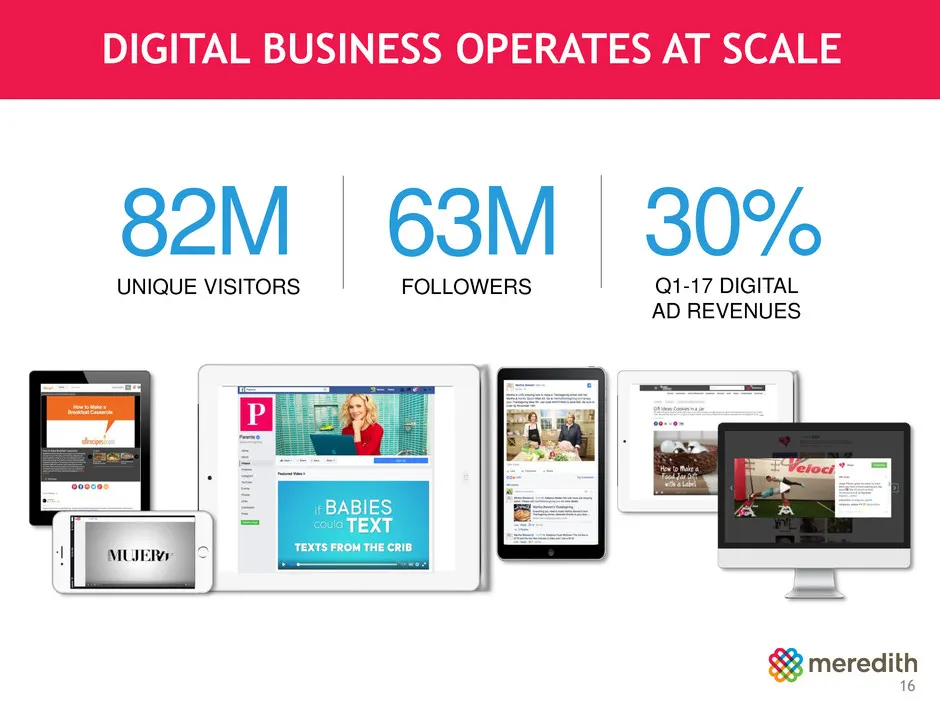
MAGAZINE MEDIA family DIGITAL BUSINESS OPERATES AT SCALE 63M82M UNIQUE VISITORS FOLLOWERS 30% Q1-17 DIGITAL AD REVENUES 16
Slide 17: Digital Driving Growth of Total Advertising
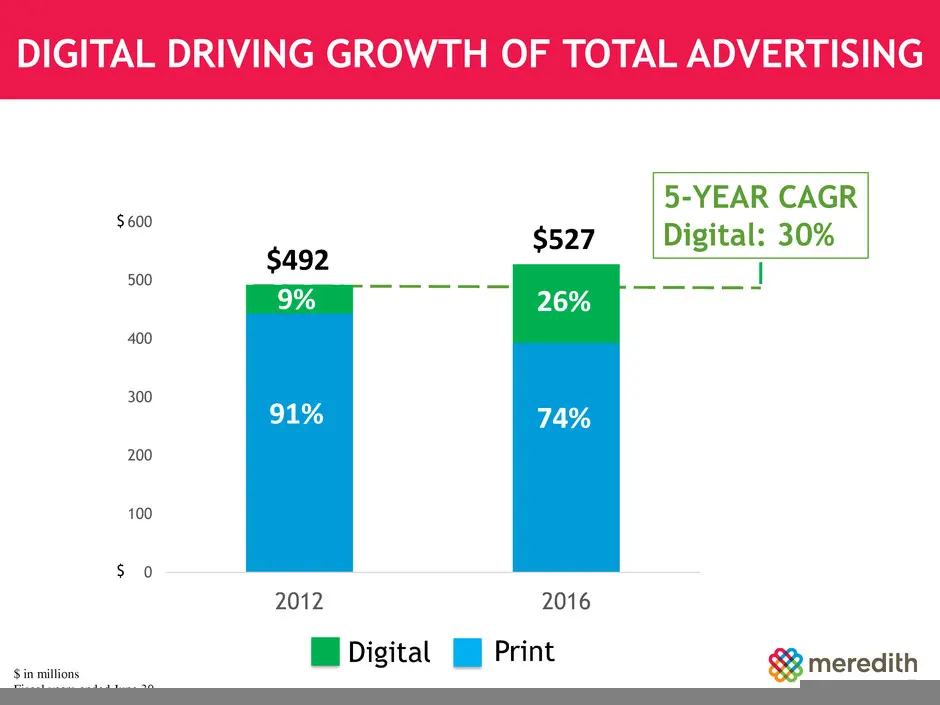
DIGITAL DRIVING GROWTH OF TOTAL ADVERTISING 0 100 200 300 400 500 600 2012 2016 $ in millions Fiscal years ended June 30 PrintDigital $492 $527 9% 26% $ $ 91% 74% 17 5-YEAR CAGR Digital: 30%
Slide 18: Digital Growth Drivers
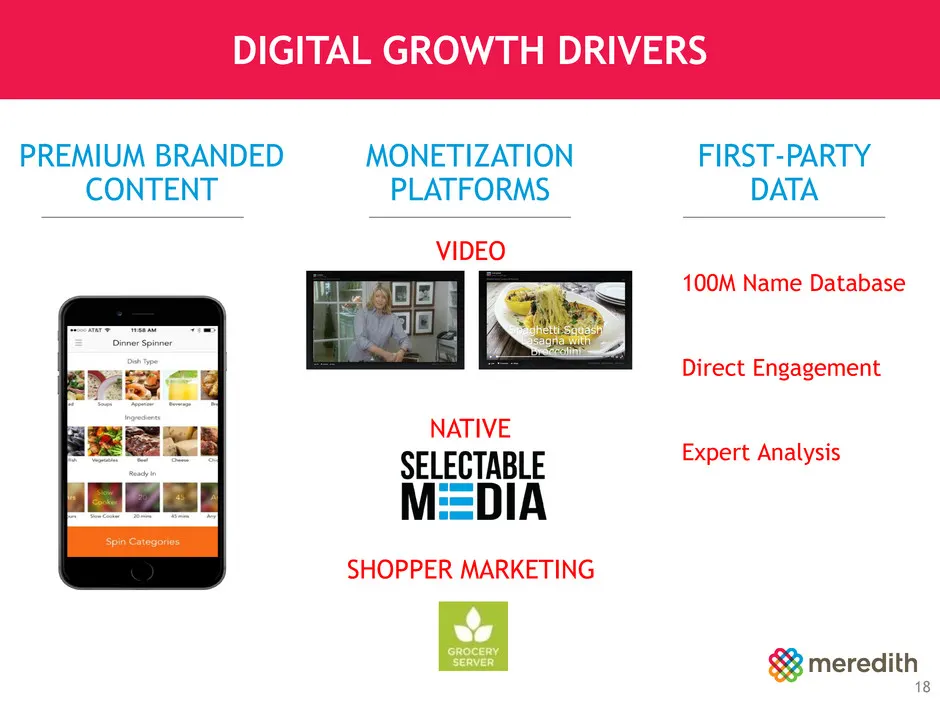
DIGITAL GROWTH DRIVERS 18 PREMIUM BRANDED CONTENT VIDEO FIRST-PARTY DATA MONETIZATION PLATFORMS NATIVE SHOPPER MARKETING 100M Name Database Direct Engagement Expert Analysis
Slide 19: Video Production & Consumption Gaining Scale
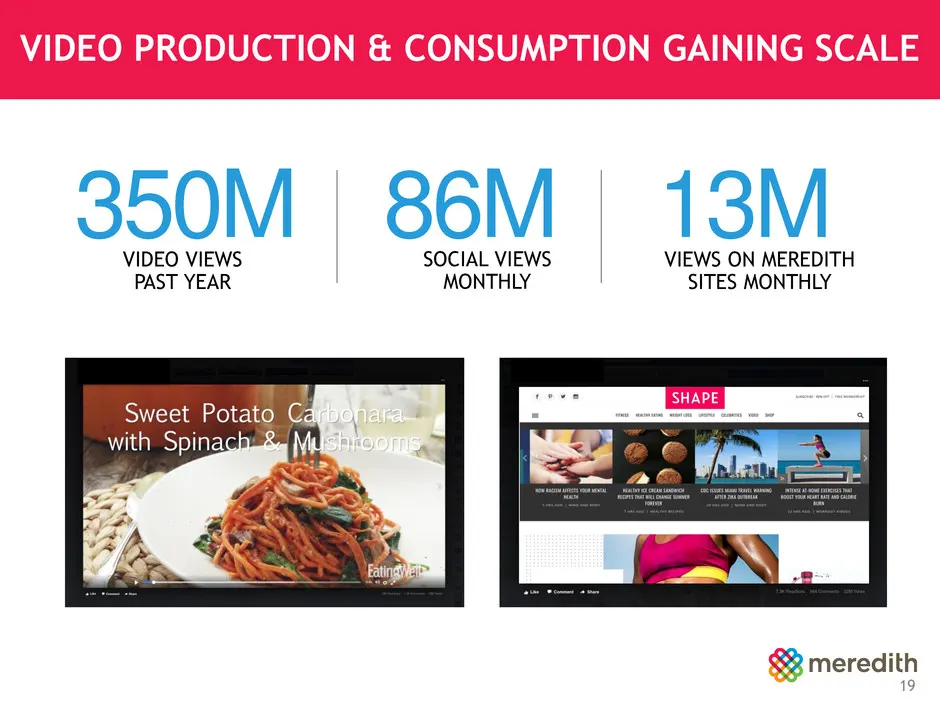
VIDEO PRODUCTION & CONSUMPTION GAINING SCALE 19 350M VIDEO VIEWS PAST YEAR 13M VIEWS ON MEREDITH SITES MONTHLY 86M SOCIAL VIEWS MONTHLY
Slide 20: Increasing Revenue From Individual Consumers
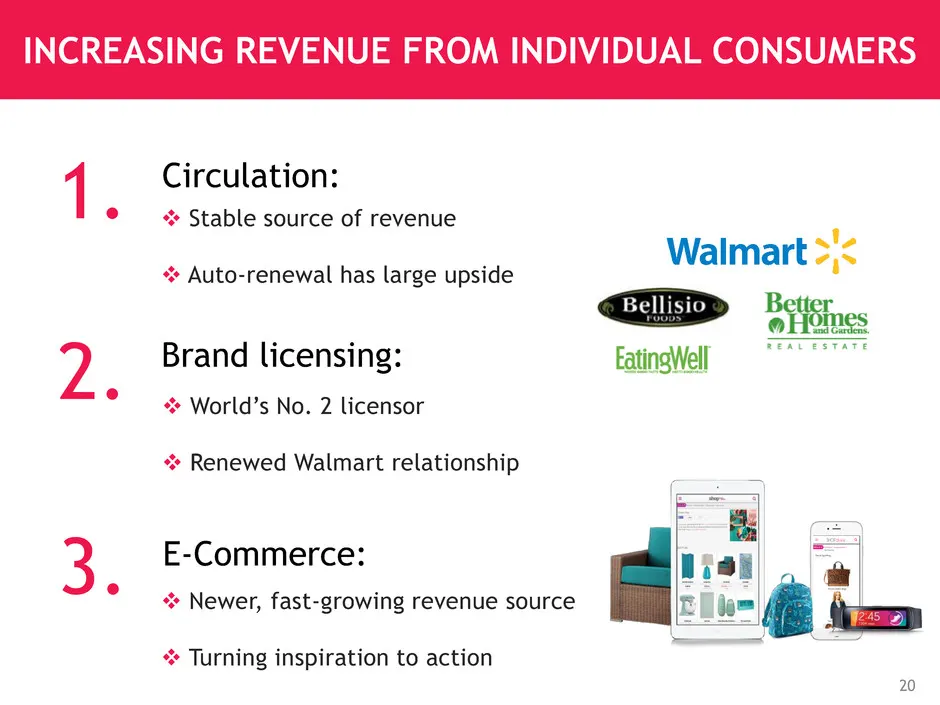
INCREASING REVENUE FROM INDIVIDUAL CONSUMERS Circulation: Brand licensing: E-Commerce: Stable source of revenue Auto-renewal has large upside World’s No. 2 licensor Renewed Walmart relationship Newer, fast-growing revenue source Turning inspiration to action 1. 2. 3. 20
Slide 21: Today's Agenda
TODAY’S AGENDA 21 Meredith Overview Key Facts About Meredith National Media Group Local Media Group Total Shareholder Return Closing Remarks and Q&A
Slide 22: Attractive Stations in Large & Growing Markets
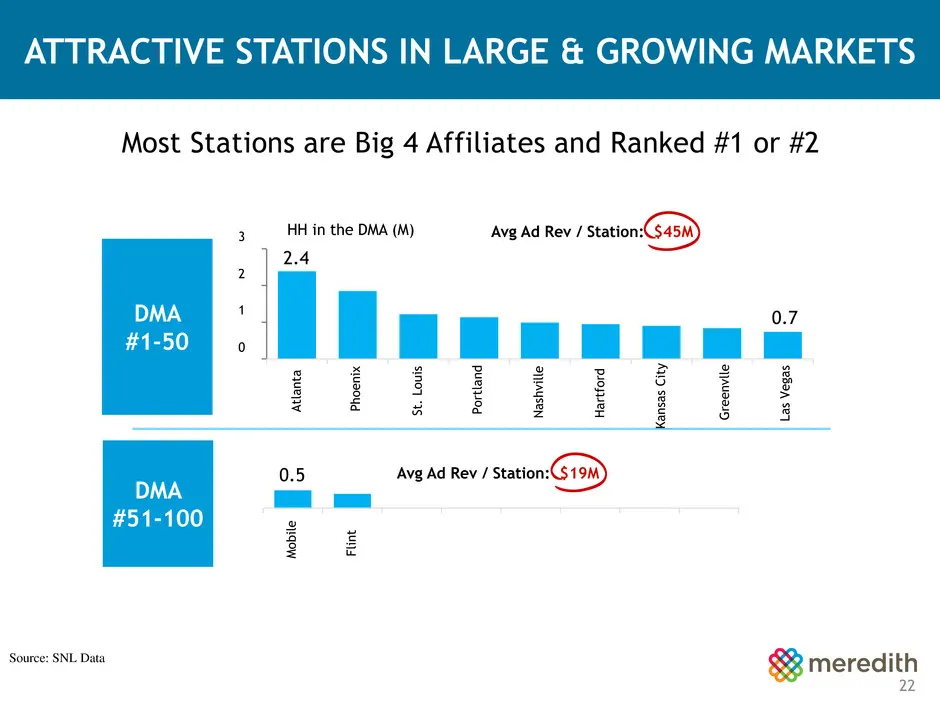
3 2 1 0 HH in the DMA (M) L a s V eg a s 0.7 G re e n vl le K a n sa s C it y H a rt fo rd Na sh vi ll e P o rt la n d St . L o u is P h o e n ix At la n ta 2.4 F li n t M o b il e 0.5 DMA #1-50 DMA #51-100 Avg Ad Rev / Station: $45M Avg Ad Rev / Station: $19M Source: SNL Data 22 ATTRACTIVE STATIONS
Slide 23: Local Media Group Growth Strategies
LOCAL MEDIA GROUP GROWTH STRATEGIES 23 Increase News Viewership Grow Advertising Revenues Scale Digital Video and Mobile Increase Net Retransmission Contribution
Slide 24: Local Content Creation Expanding
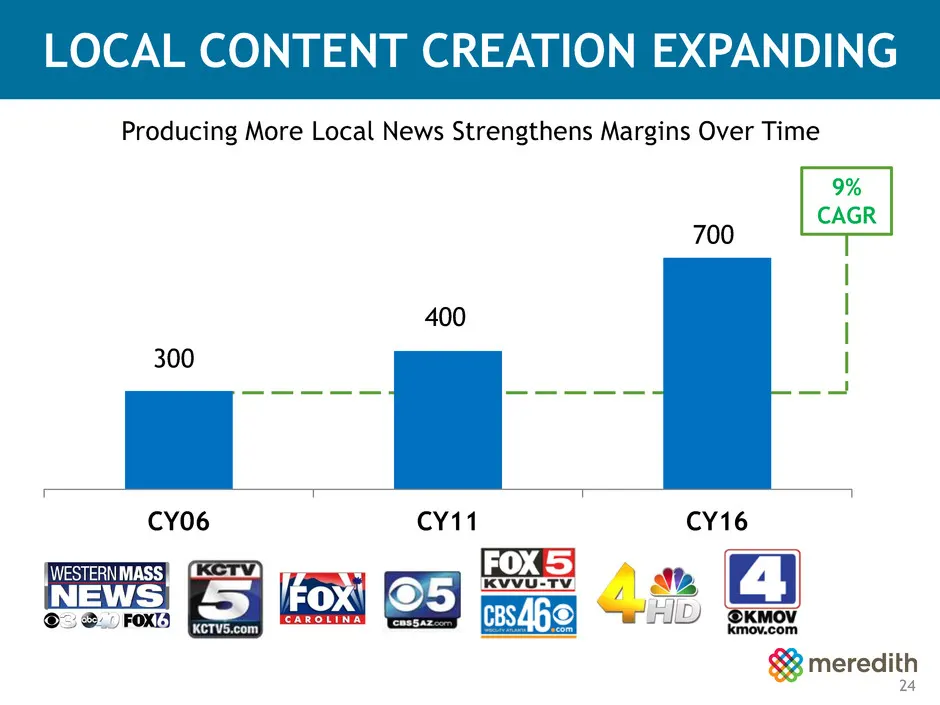
9% CAGR LOCAL CONTENT CREATION EXPANDING Producing More Local News Strengthens Margins Over Time 700 24 CY06 CY11 CY16 300 400
Slide 25: Local News Viewership Dominates Cable
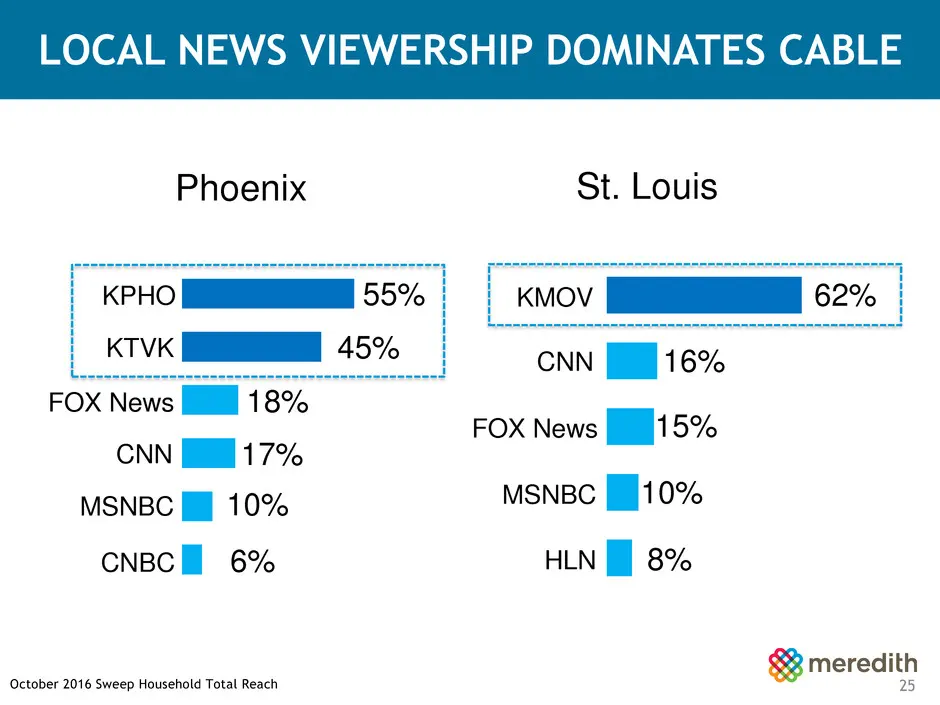
LOCAL NEWS VIEWERSHIP DOMINATES CABLE October 2016 Sweep Household Total Reach Phoenix St. Louis 45% 18% 10% 6% KPHO KTVK CNN MSNBC CNBC FOX News 55% 17% 62% 16% 15% 10% 8% CNN FOX News MSNBC HLN KMOV 25
Slide 26: Political Advertising Surpassed Expectations
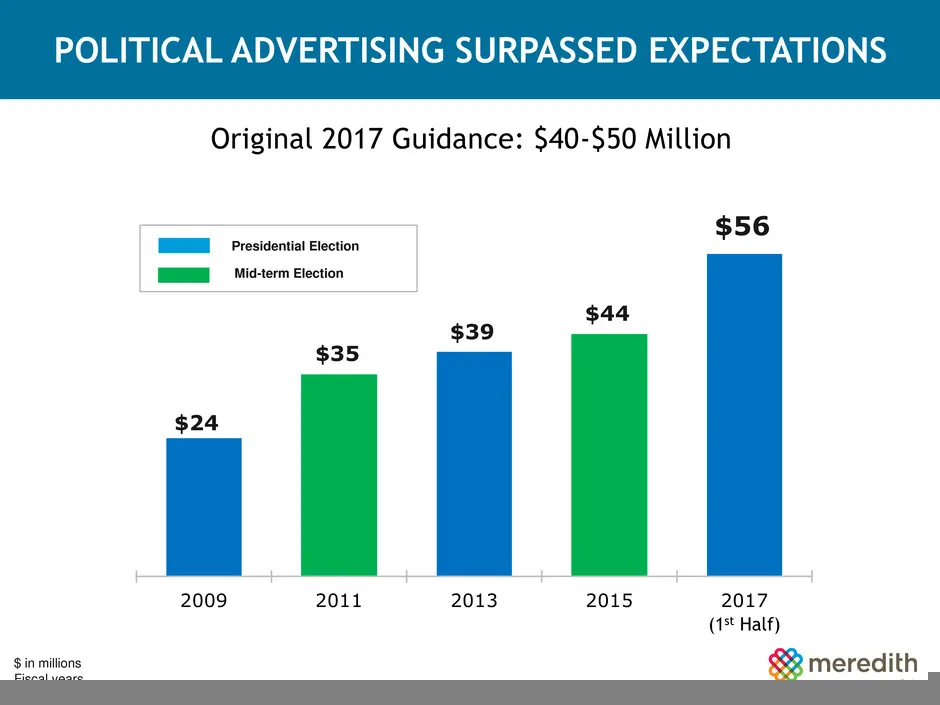
2009 2011 2013 2015 2017 $56 POLITICAL ADVERTISING SURPASSED EXPECTATIONS $35 $24 $39 $ in millions Fiscal years Presidential Election Mid-term Election (1st Half) $44 26 Original 2017 Guidance: $40-$50 Million
Slide 27: Favorable Retransmission Renewals Schedule
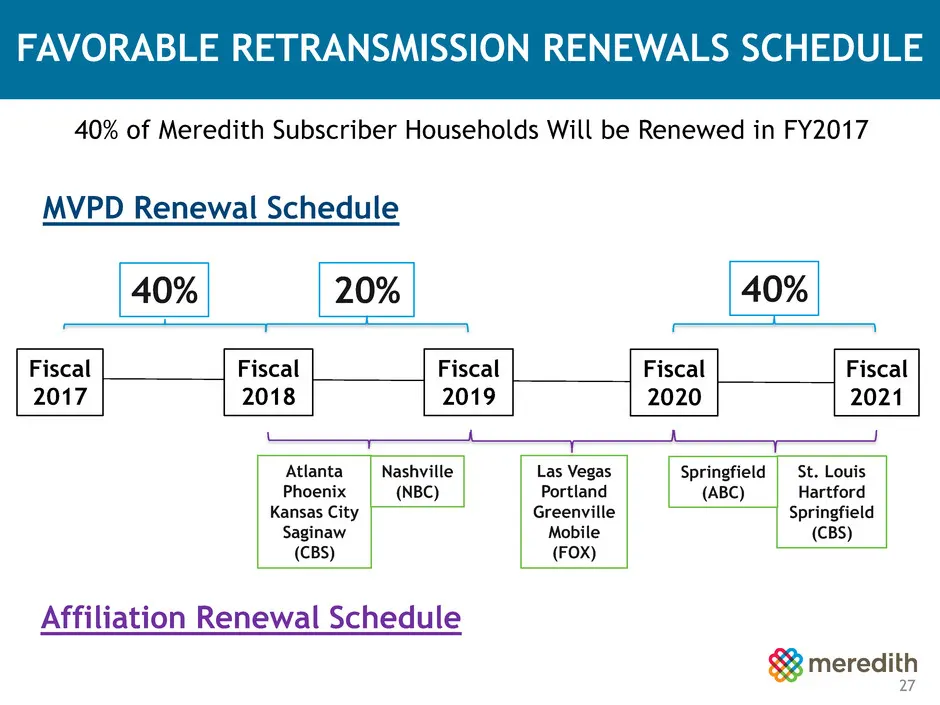
40% Atlanta Phoenix Kansas City Saginaw (CBS) Las Vegas Portland Greenville Mobile (FOX) Fiscal 2021 MVPD Renewal Schedule Affiliation Renewal Schedule Nashville (NBC) FAVORABLE RETRANSMISSION RENEWALS SCHEDULE Fiscal 2018 Fiscal 2019 Fiscal 2017 20% Fiscal 2020 40% St. Louis Hartford Springfield (C
Slide 28: Today's Agenda
TODAY’S AGENDA Meredith Overview Key Facts About Meredith Total Shareholder Return Closing Remarks and Q&A 28
Slide 29: Total Shareholder Return Strategy
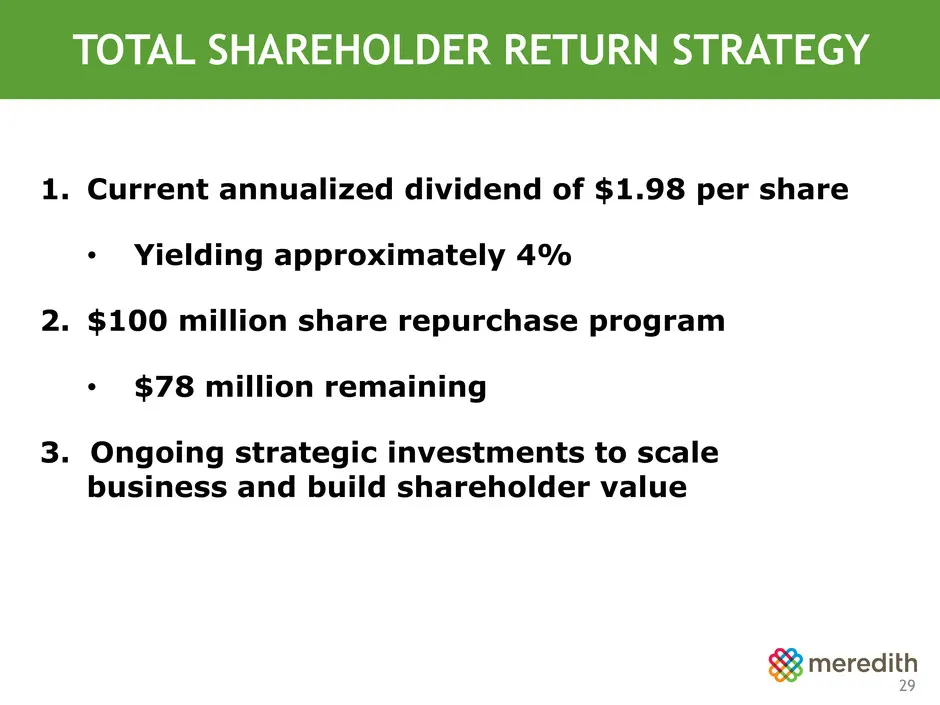
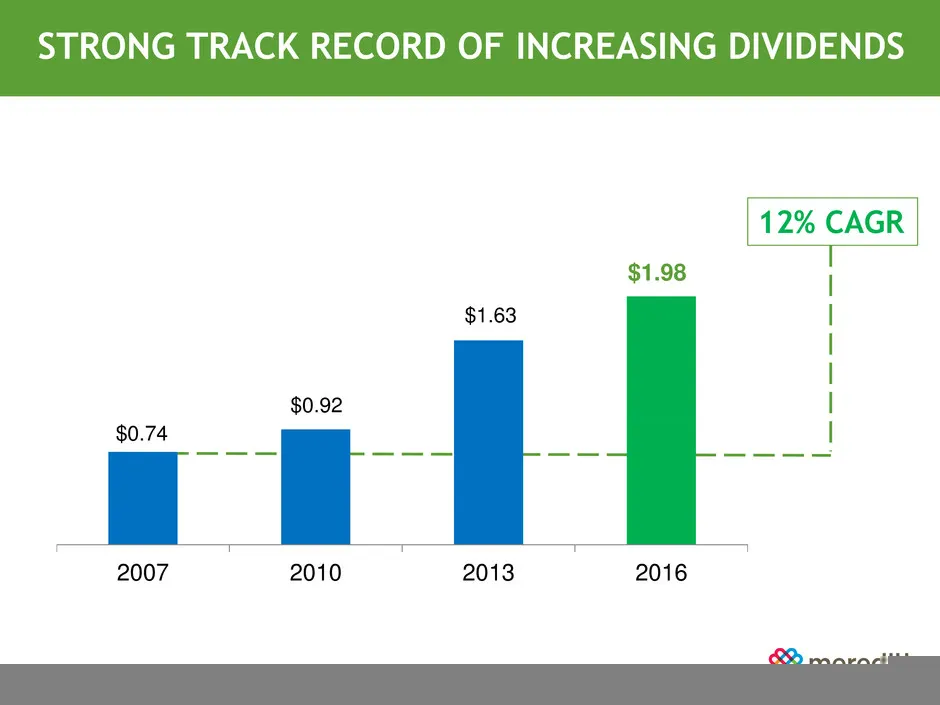
TOTAL SHAREHOLDER RETURN STRATEGY 1. Current annualized dividend of $1.98 per share • Yielding approximately 4% 2. $100 million share repurchase program • $78 million remaining 3. Ongoing strategic investments to scale business and build shareholder value 29
Slide 30: Cash Generation: 2007-2016
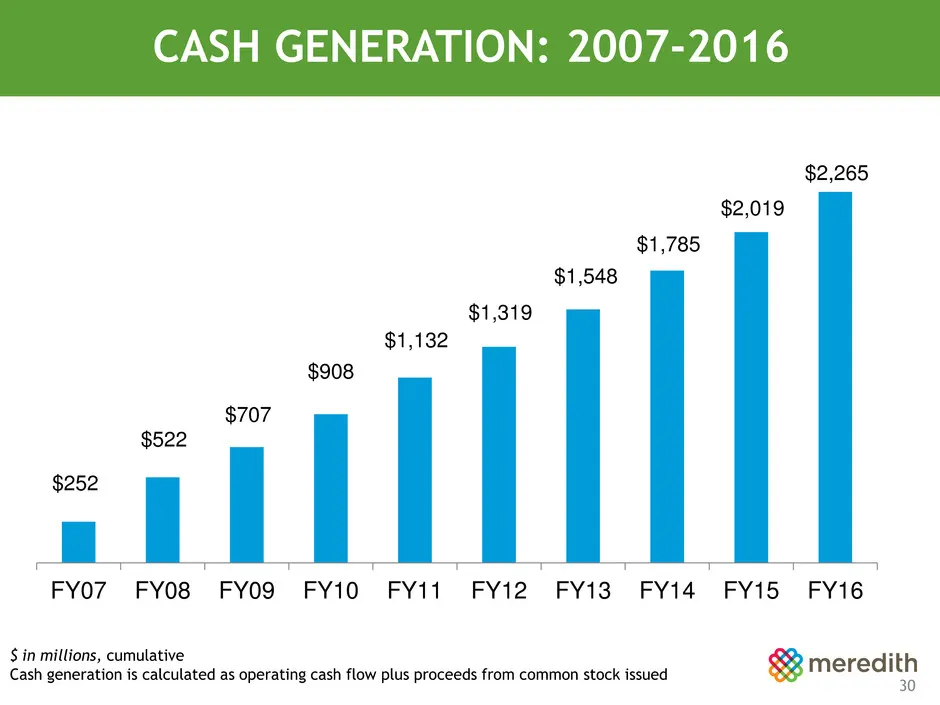
CASH GENERATION: 2007-2016 $252 $522 $707 $908 $1,132 $1,319 $1,548 $1,785 $2,019 $2,265 FY07 FY08 FY09 FY10 FY11 FY12 FY13 FY14 FY15 FY16 $ in millions, cumulative Cash generation is calculated as operating cash flow plus proceeds from common stock issued 30
Slide 31: Balanced Use of Cash: FY2007 to FY2016
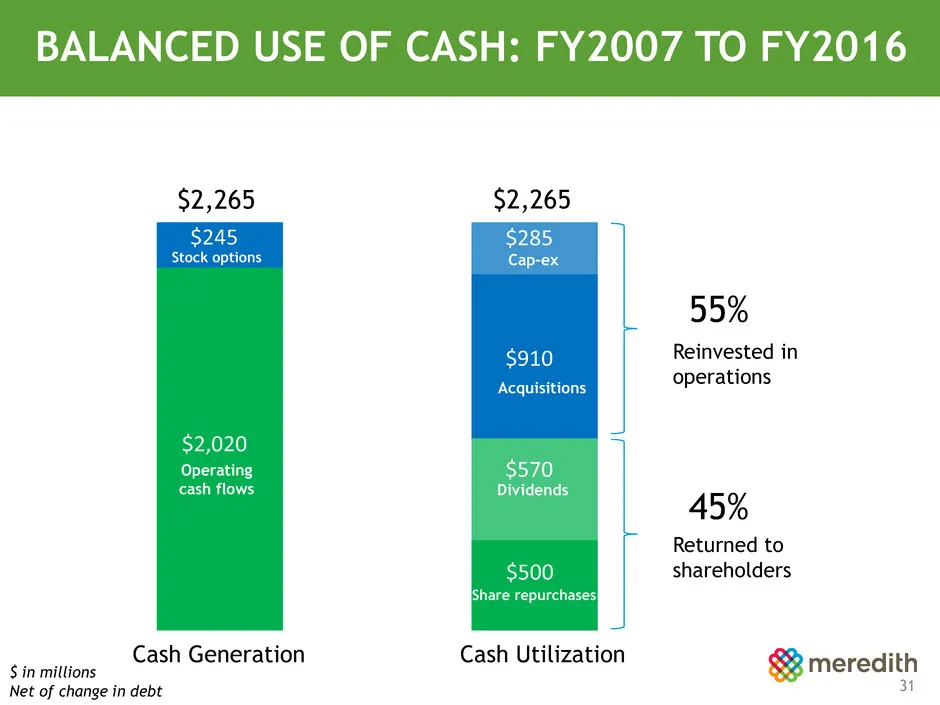
BALANCED USE OF CASH: FY2007 TO FY2016 $ in millions Net of change in debt $2,020 $245 Cash Generation Cash Utilization $2,265 $2,265 $500 $570 Dividends $285 $910 Share repurchases Acquisitions Cap-ex Operating cash flows Stock options Reinvested in operations Returned to shareholders 55% 45% 31
Slide 32: Strong Track Record of Increasing Dividends
STRONG TRACK RECORD OF INCREASING DIVIDENDS $0.74 $0.92 $1.63 2007 2010 2013 2016 $1.98 12% CAGR 32
Slide 33: Fiscal 2017 Second Quarter Outlook
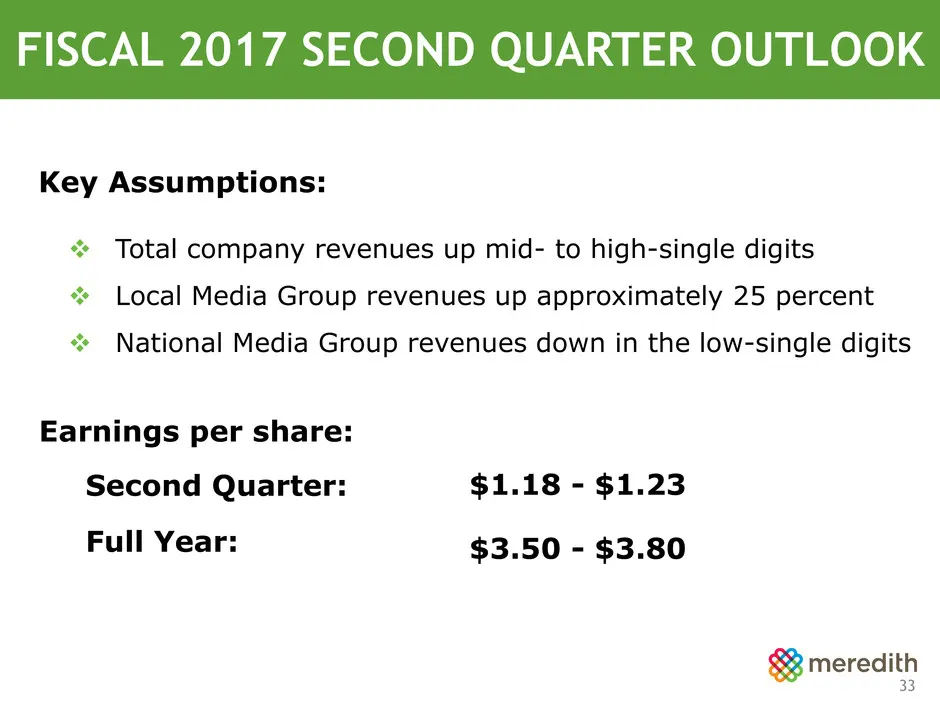
FISCAL 2017 SECOND QUARTER OUTLOOK Total company revenues up mid- to high-single digits Local Media Group revenues up approximately 25 percent National Media Group revenues down in the low-single digits Second Quarter: $1.18 - $1.23 Full Year: $3.50 - $3.80 Key Assumptions: Earnings per share:
Slide 34: Today's Agenda
TODAY’S AGENDA Meredith Overview Key Facts About Meredith Total Shareholder Return Closing Remarks and Q&A 34
Slide 35: Strong Investment Thesis
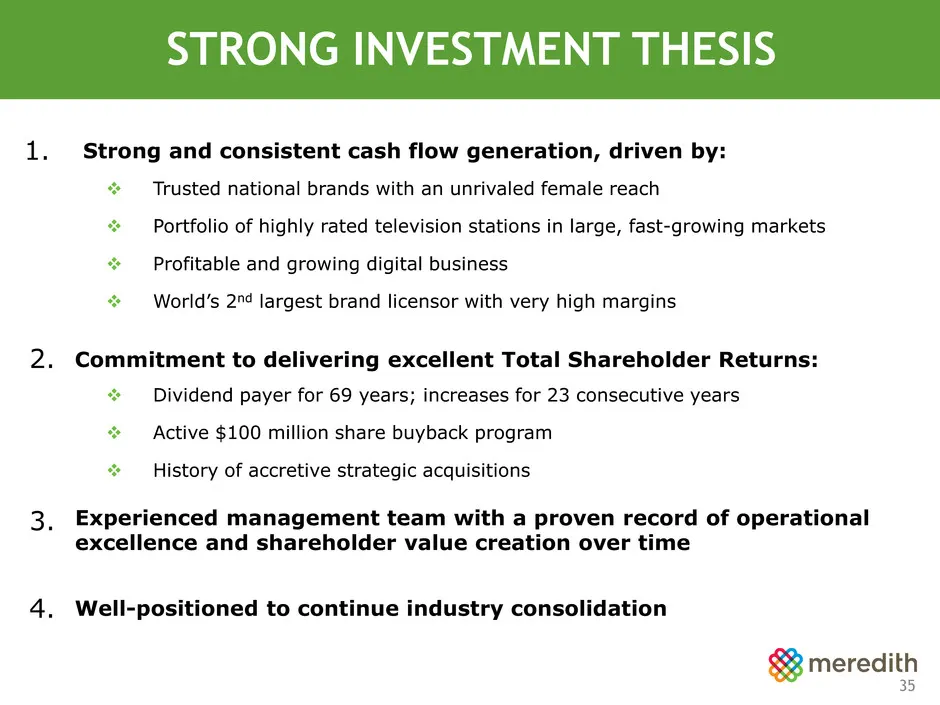
STRONG INVESTMENT THESIS Trusted national brands with an unrivaled female reach Portfolio of highly rated television stations in large, fast-growing markets Profitable and growing digital business World’s 2nd largest brand licensor with very high margins Experienced management team with a pr
Slide 36: Meredith Has a Strong Balance Sheet
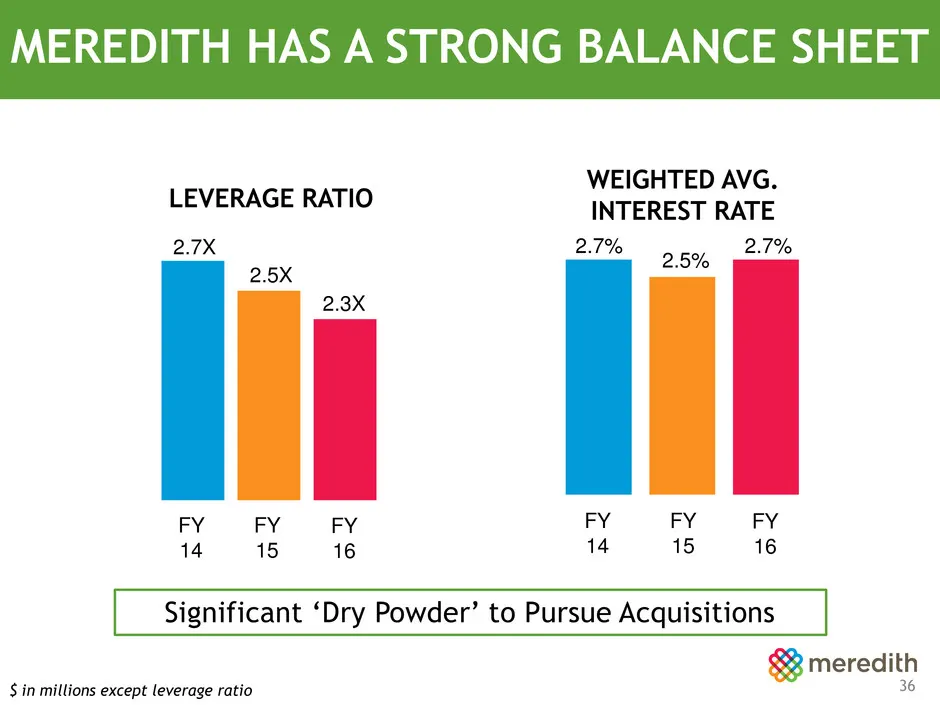
MEREDITH HAS A STRONG BALANCE SHEET FY 14 FY 15 FY 16 2.7% 2.5% 2.7% WEIGHTED AVG. INTEREST RATE FY 14 FY 15 FY 16 2.7X 2.5X 2.3X LEVERAGE RATIO $ in millions except leverage ratio 36 Significant ‘Dry Powder’ to Pursue Acquisitions
Slide 37: Media Is Ripe to Consolidate
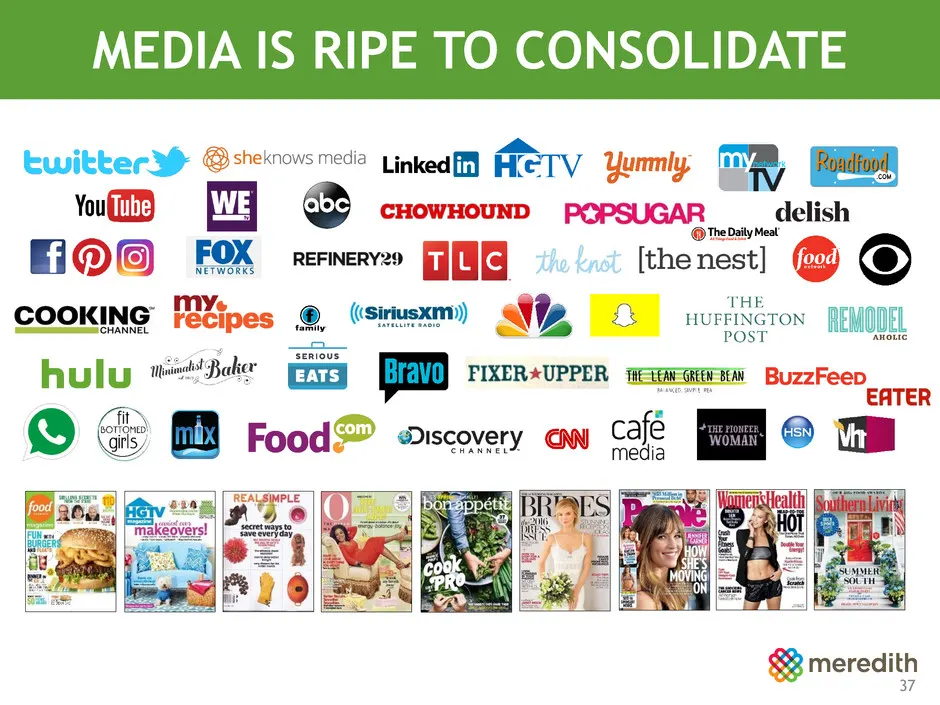
MEDIA IS RIPE TO CONSOLIDATE 37
Slide 38: Meredith Is Partner of Choice
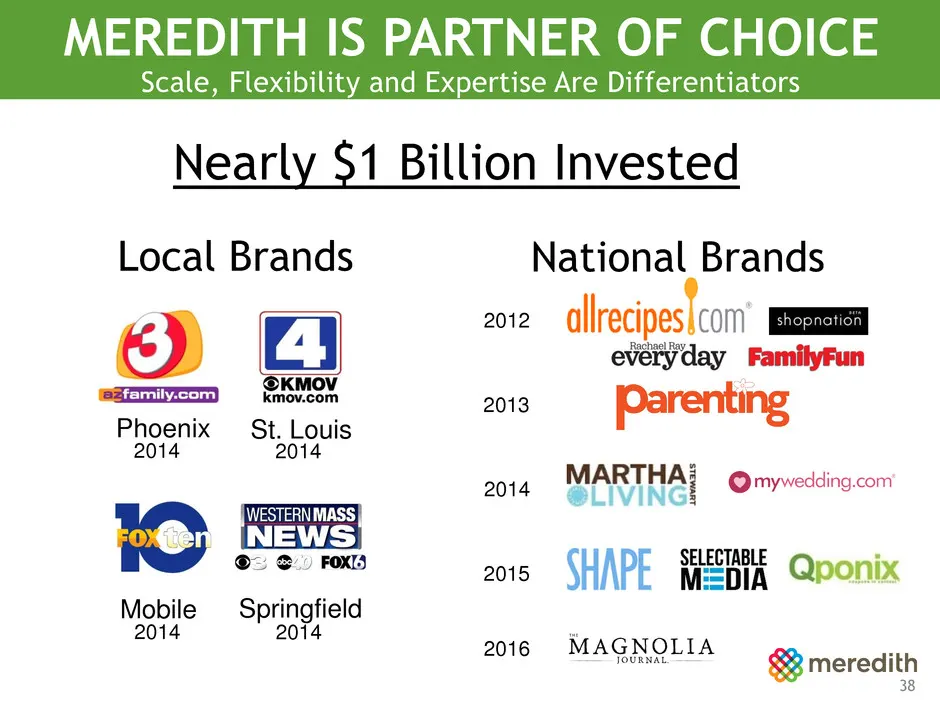
MEREDITH IS PARTNER OF CHOICE Scale, Flexibility and Expertise Are Differentiators Local Brands Phoenix St. Louis Mobile Springfield National Brands 2014 2014 2014 2014 2012 2013 2014 2015 2016 38 Nearly $1 Billion Invested

Slide 39: UBS 44th Annual Global Media and Communications Conference
UBS 44th Annual Global Media and Communications Conference December 6, 2016
Source: SEC EDGAR · 8-K filed Dec 6, 2016
More decks from Meredith Corporation
 Q4 FY2021 Earnings Presentation20 slides · Aug 12, 2021
 Investor Presentation (June 2021)17 slides · Jun 16, 2021
 Merger or Acquisition (May 2021)15 slides · May 3, 2021
 Citi 2021 Global TMT West Virtual Conference11 slides · Jan 6, 2021
 Q4 FY2020 Earnings Presentation19 slides · Aug 13, 2020
 Q3 FY2020 Earnings Presentation15 slides · May 14, 2020