AGL Resources — UBS 2006 Natural Gas & Electric Utilities Conference
15 slides from AGL Resources's conference presentation, Feb 16, 2006
Slide 1: Investor Update
Investor Update UBS 2006 Natural Gas & Electric Utilities Conference February 16, 2006 New York, NY
Slide 2: Important Note to Investors: Forward-Looking Statements
Important Note to Investors: Forward-Looking Statements Statements in this presentation that are not historical facts, including statements regarding our estimates, beliefs, expectations, intentions, strategies or projections, may be “forward-looking statements” as defined in the Private Securities
Slide 3: AGL Resources
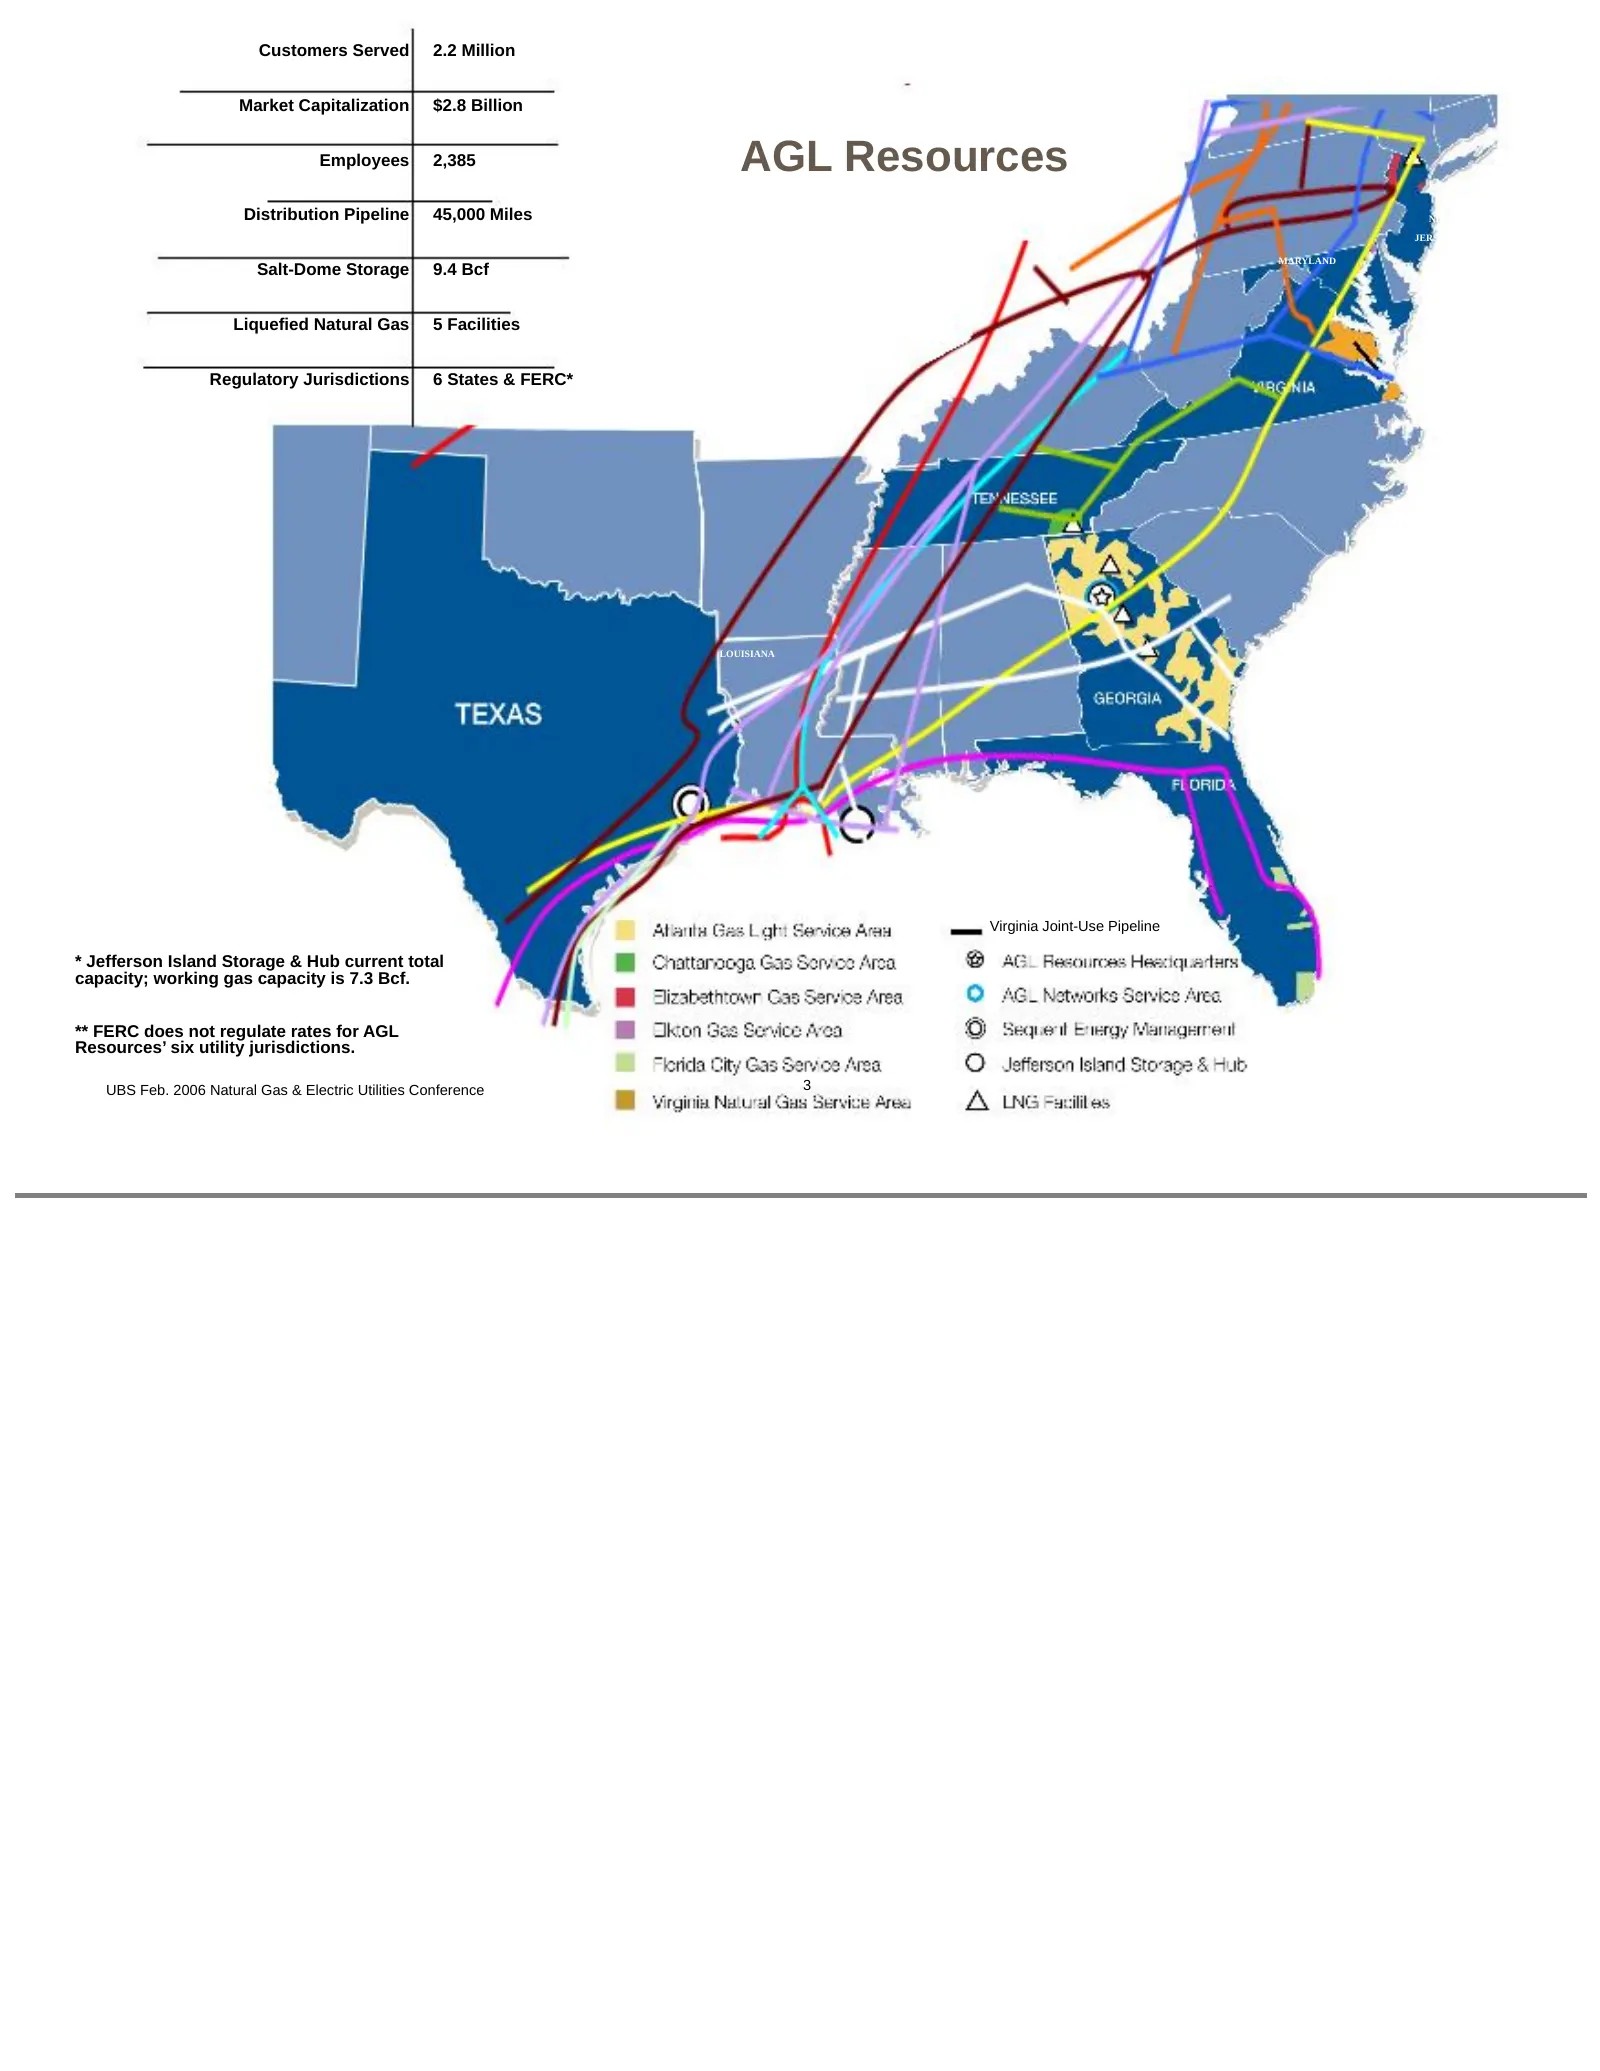
Customers Served 2.2 Million Market Capitalization $2.8 Billion Employees 2,385 AGL Resources Distribution Pipeline 45,000 Miles NEW JERSEY MARYLAND Salt-Dome Storage 9.4 Bcf Liquefied Natural Gas 5 Facilities Regulatory Jurisdictions 6 States & FERC* LOUISIANA Virginia Joint-Use Pipeline * Jefferso
Slide 4: Where Are the Growth Opportunities?
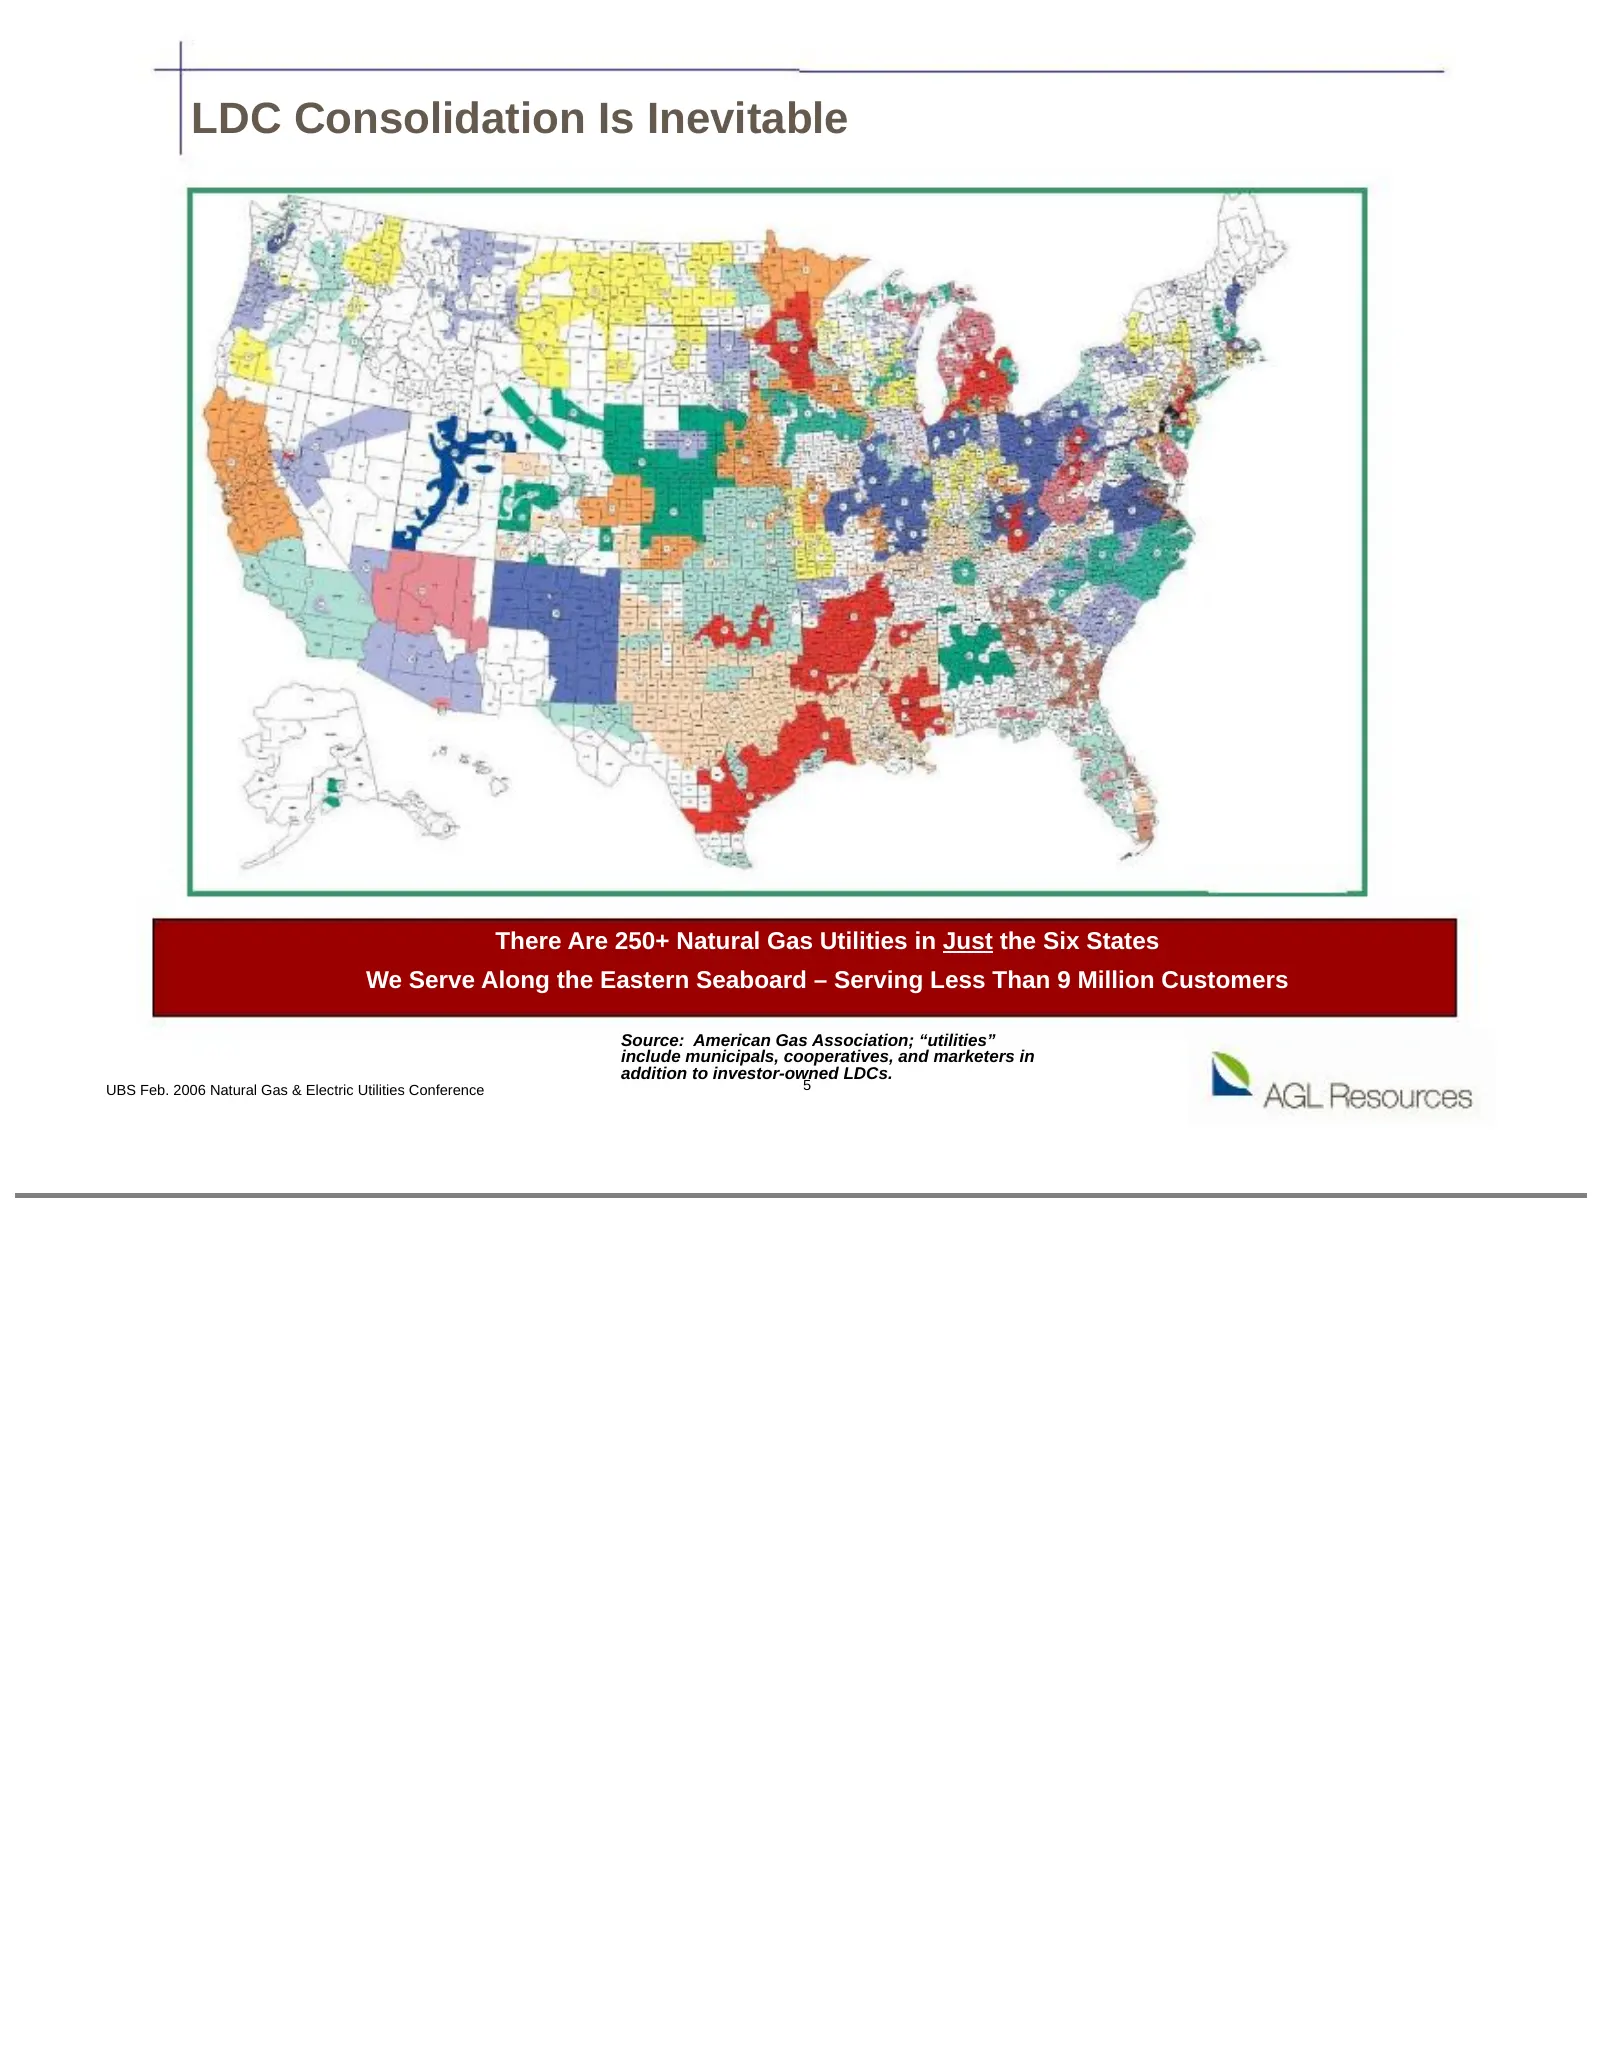
Where Are the Growth Opportunities? • LDCs must be competitive and focus on improving customer service through driving technology and productivity improvements • Consolidation in the LDC space is inevitable, given the staggering number of standalone companies • Peak demand continues to be a challeng
Slide 5: LDC Consolidation Is Inevitable
LDC Consolidation Is Inevitable There Are 250+ Natural Gas Utilities in Just the Six States We Serve Along the Eastern Seaboard – Serving Less Than 9 Million Customers Source: American Gas Association; “utilities” include municipals, cooperatives, and marketers in addition to investor-owned LDCs. UB
Slide 6: Growth … But at What Price?
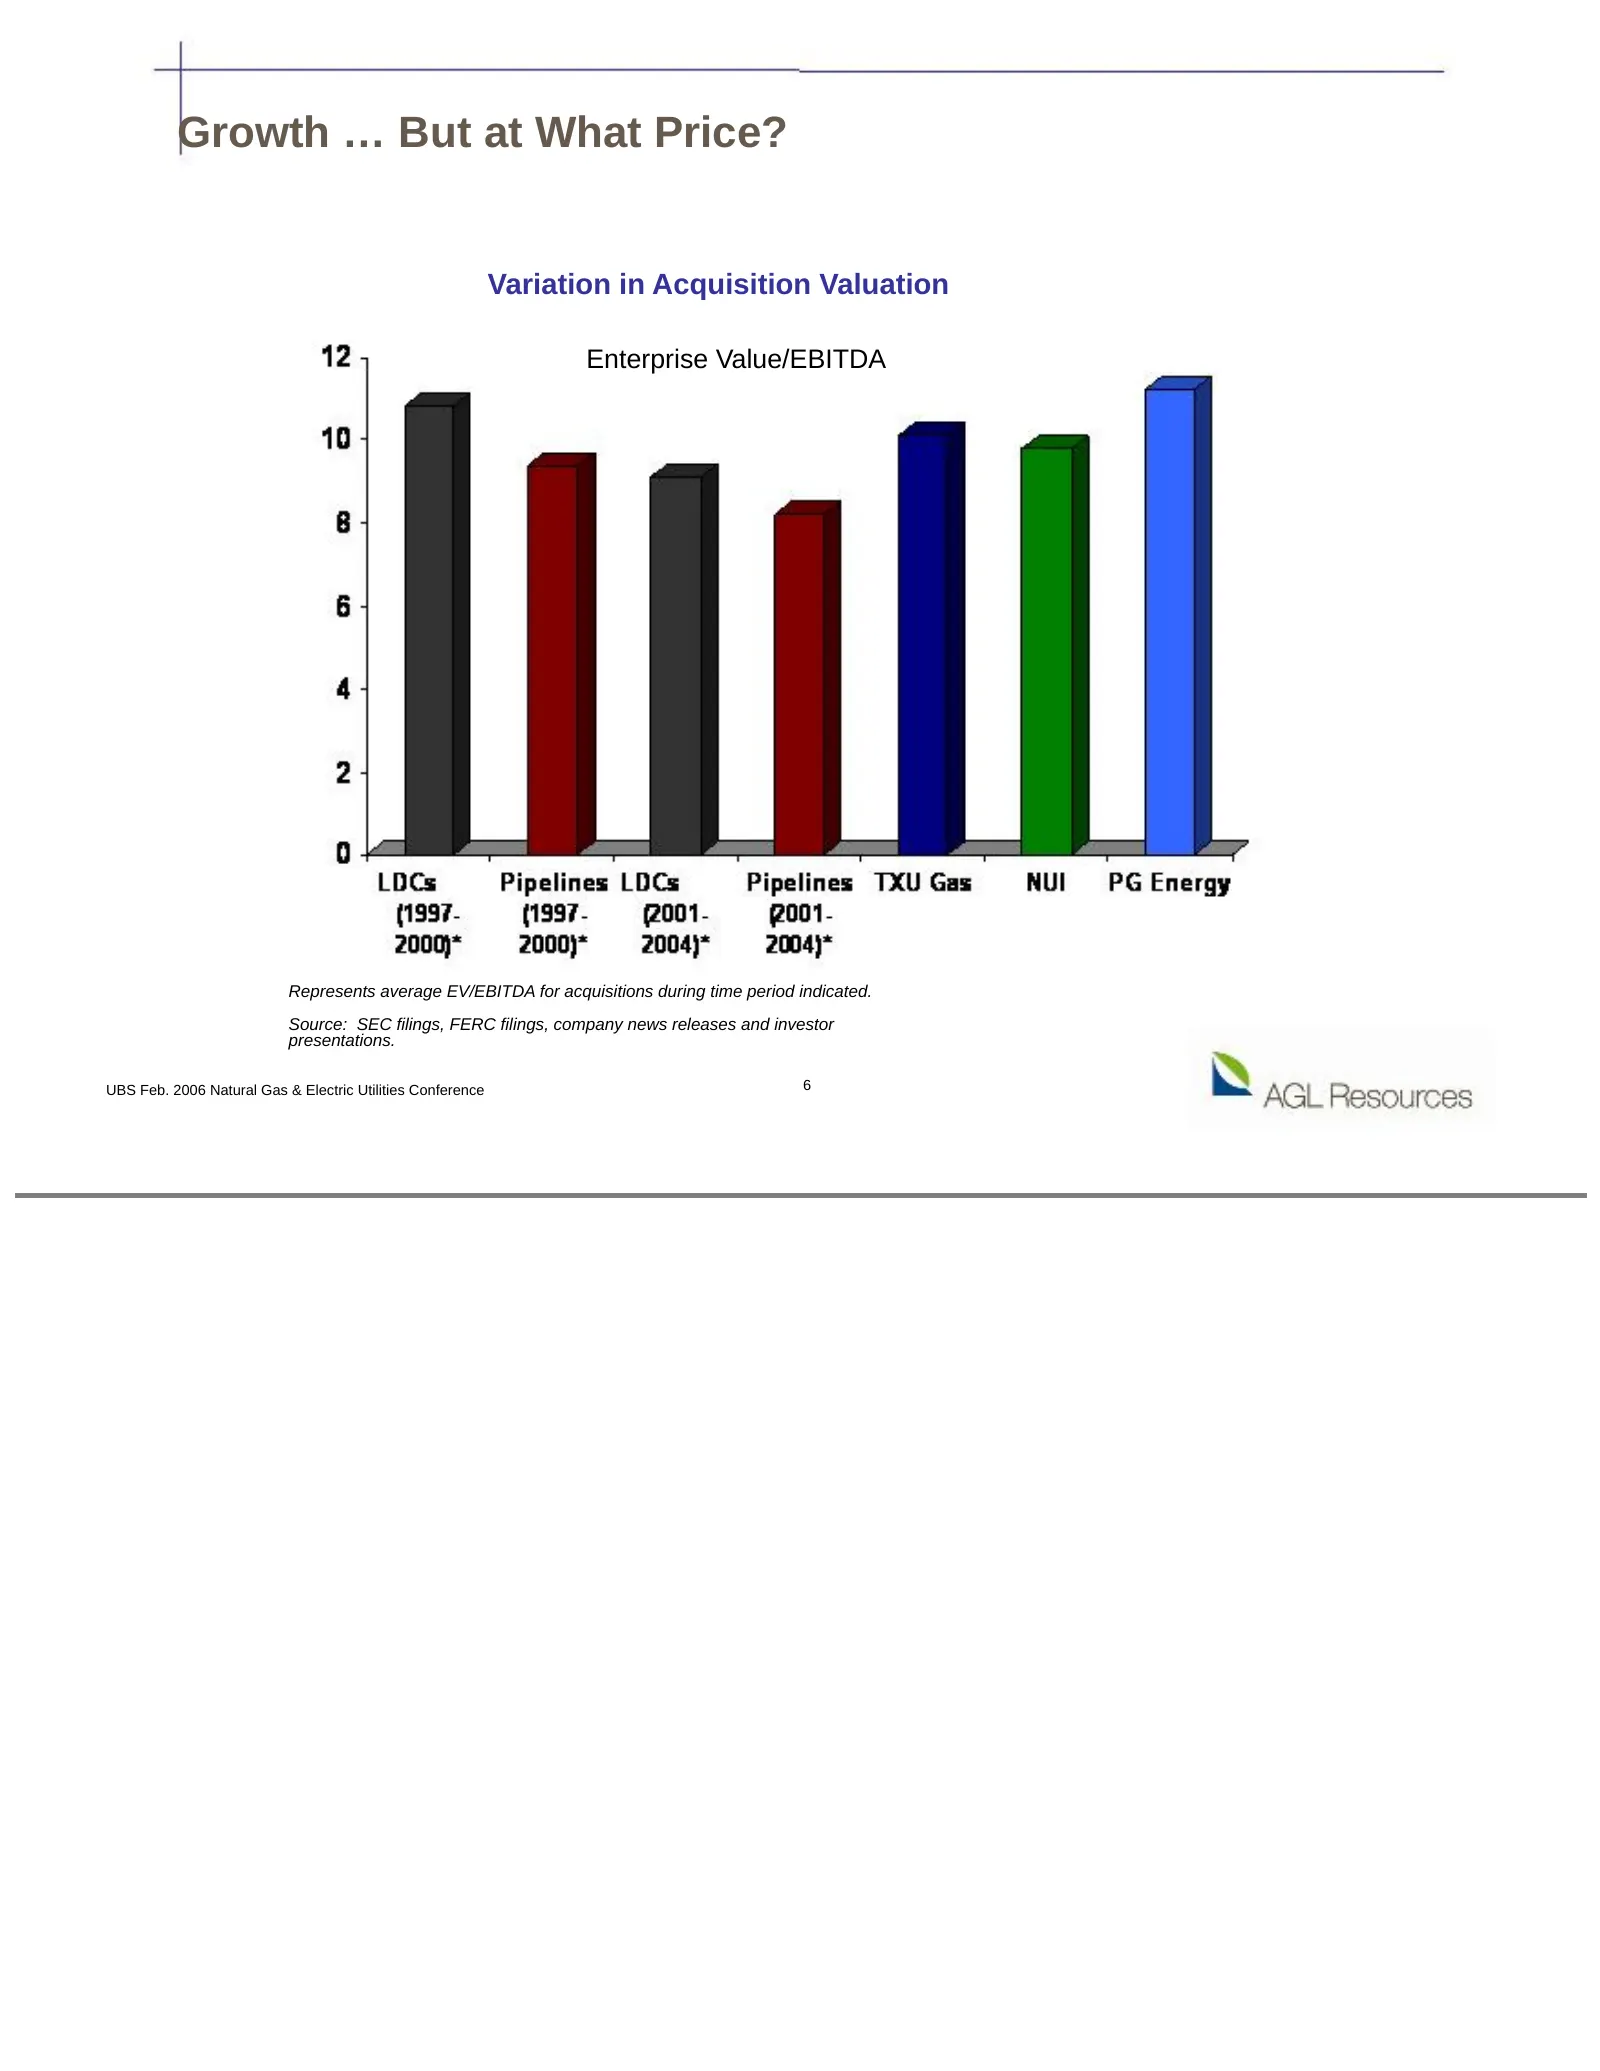
Growth … But at What Price? Variation in Acquisition Valuation Enterprise Value/EBITDA Represents average EV/EBITDA for acquisitions during time period indicated. Source: SEC filings, FERC filings, company news releases and investor presentations. UBS Feb. 2006 Natural Gas & Electric Utilities Confe
Slide 7: A Well-Executed Integration Strategy is Essential to Success
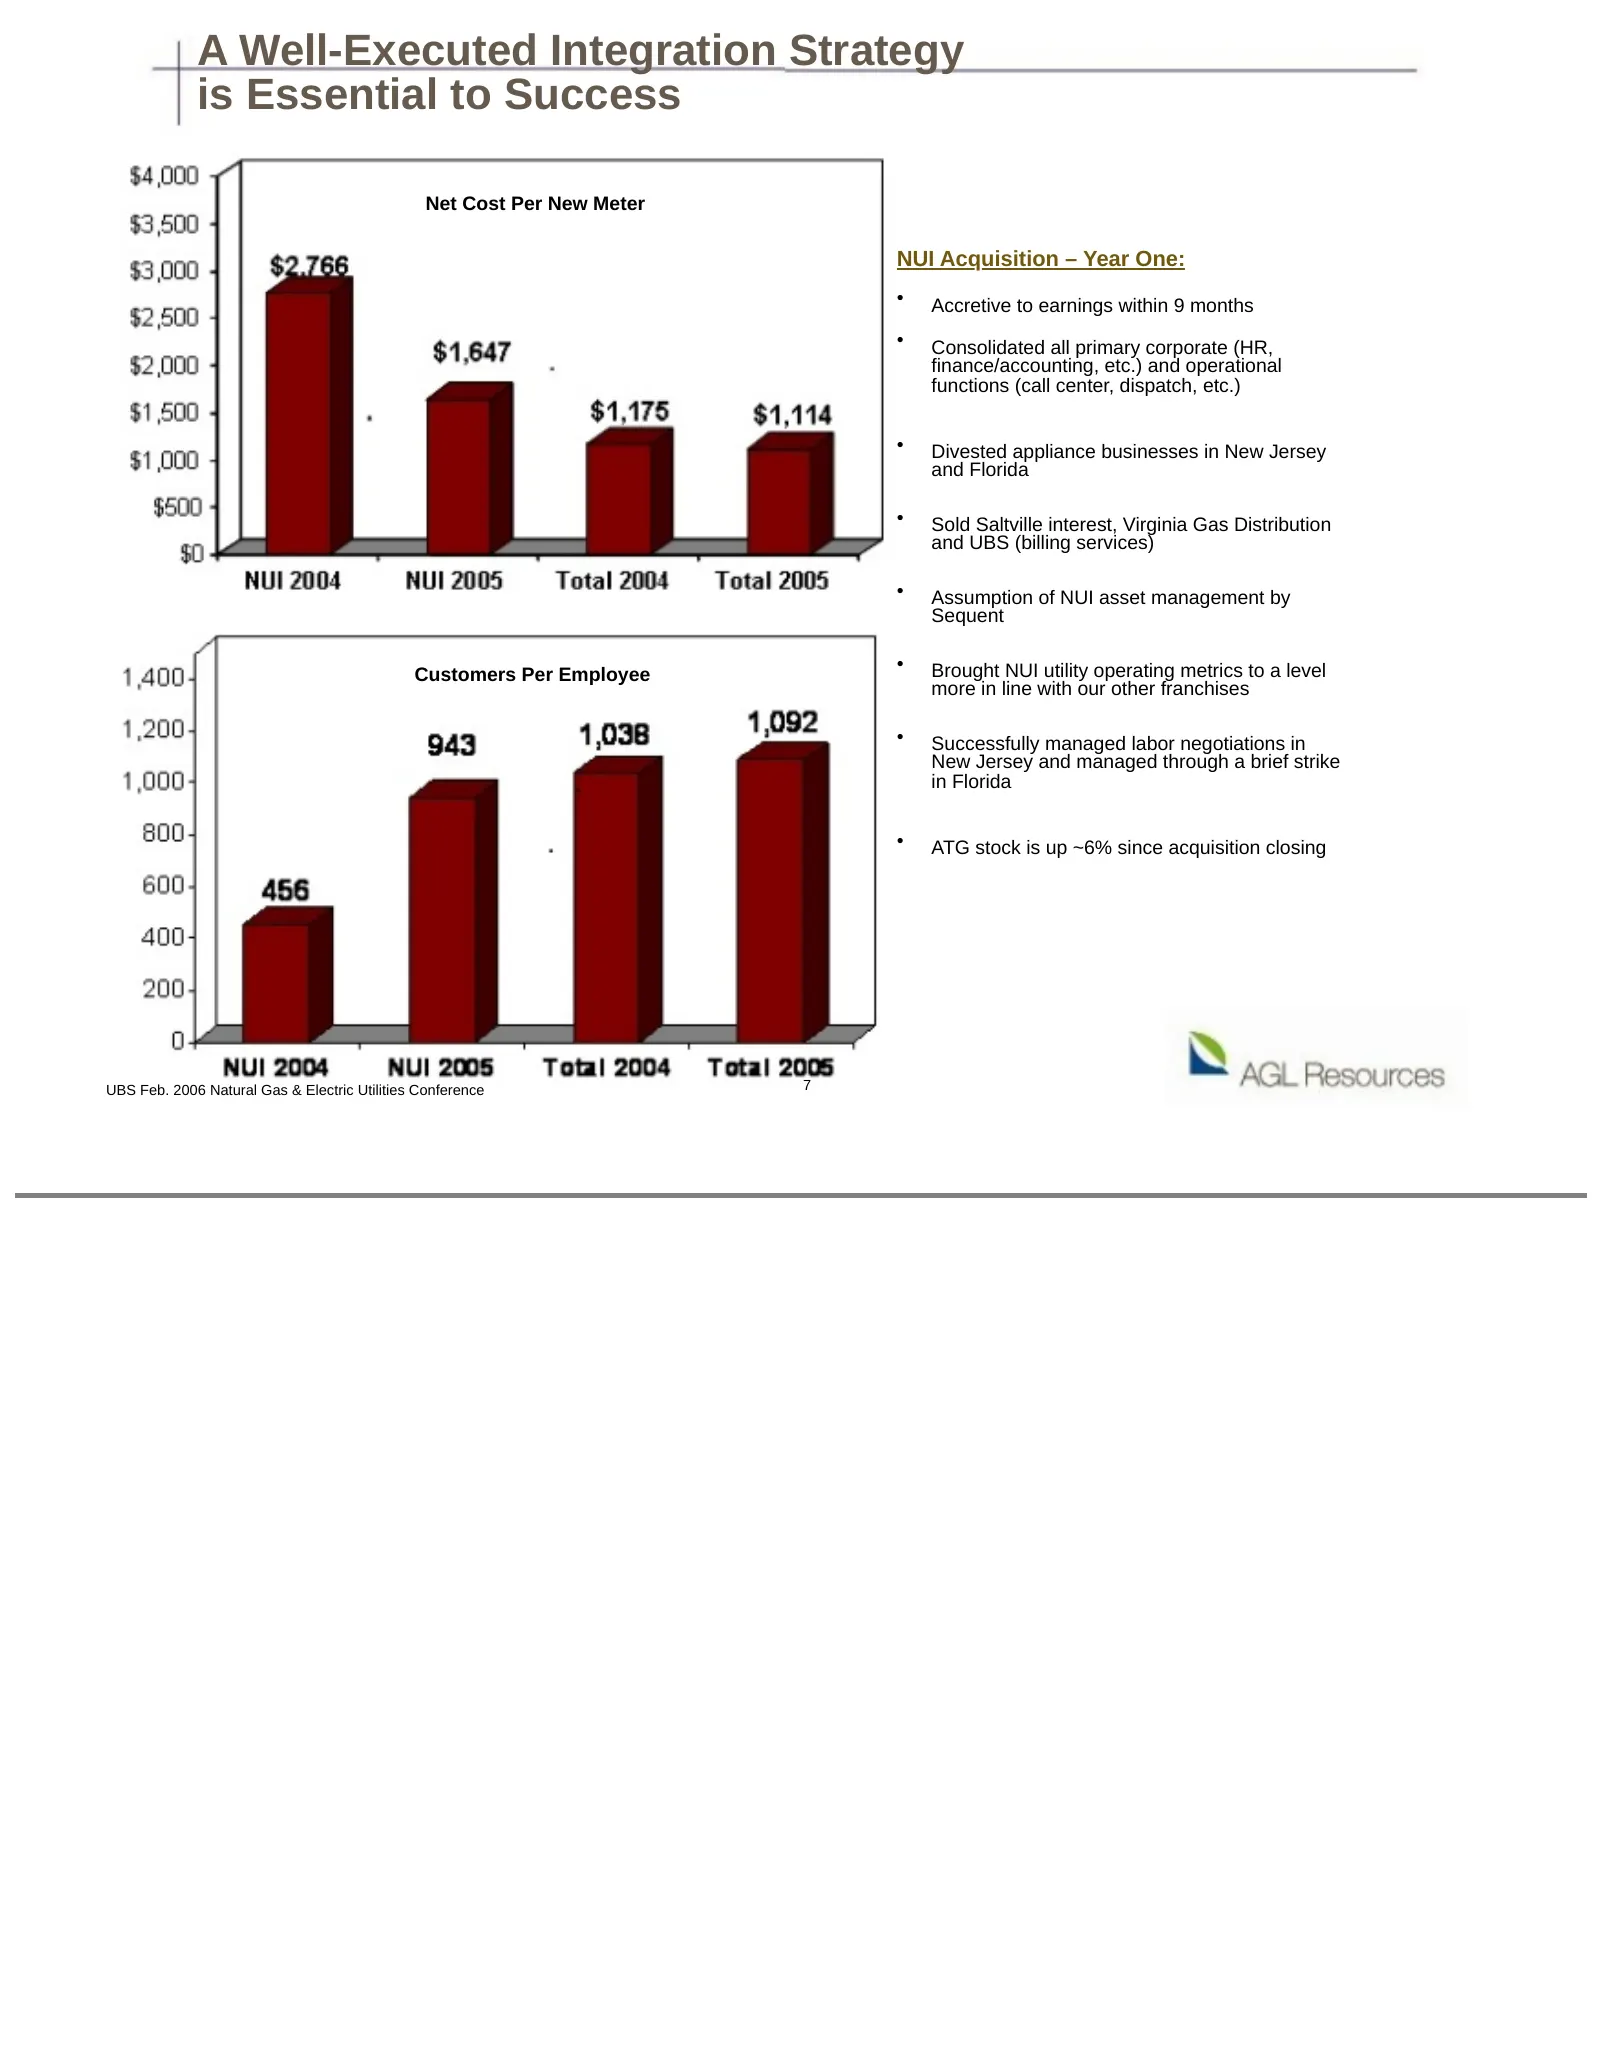
A Well-Executed Integration Strategy is Essential to Success Net Cost Per New Meter NUI Acquisition – Year One: • Accretive to earnings within 9 months • Consolidated all primary corporate (HR, finance/accounting, etc.) and operational functions (call center, dispatch, etc.) • Divested appliance bus
Slide 8: Investing In The Right Infrastructure
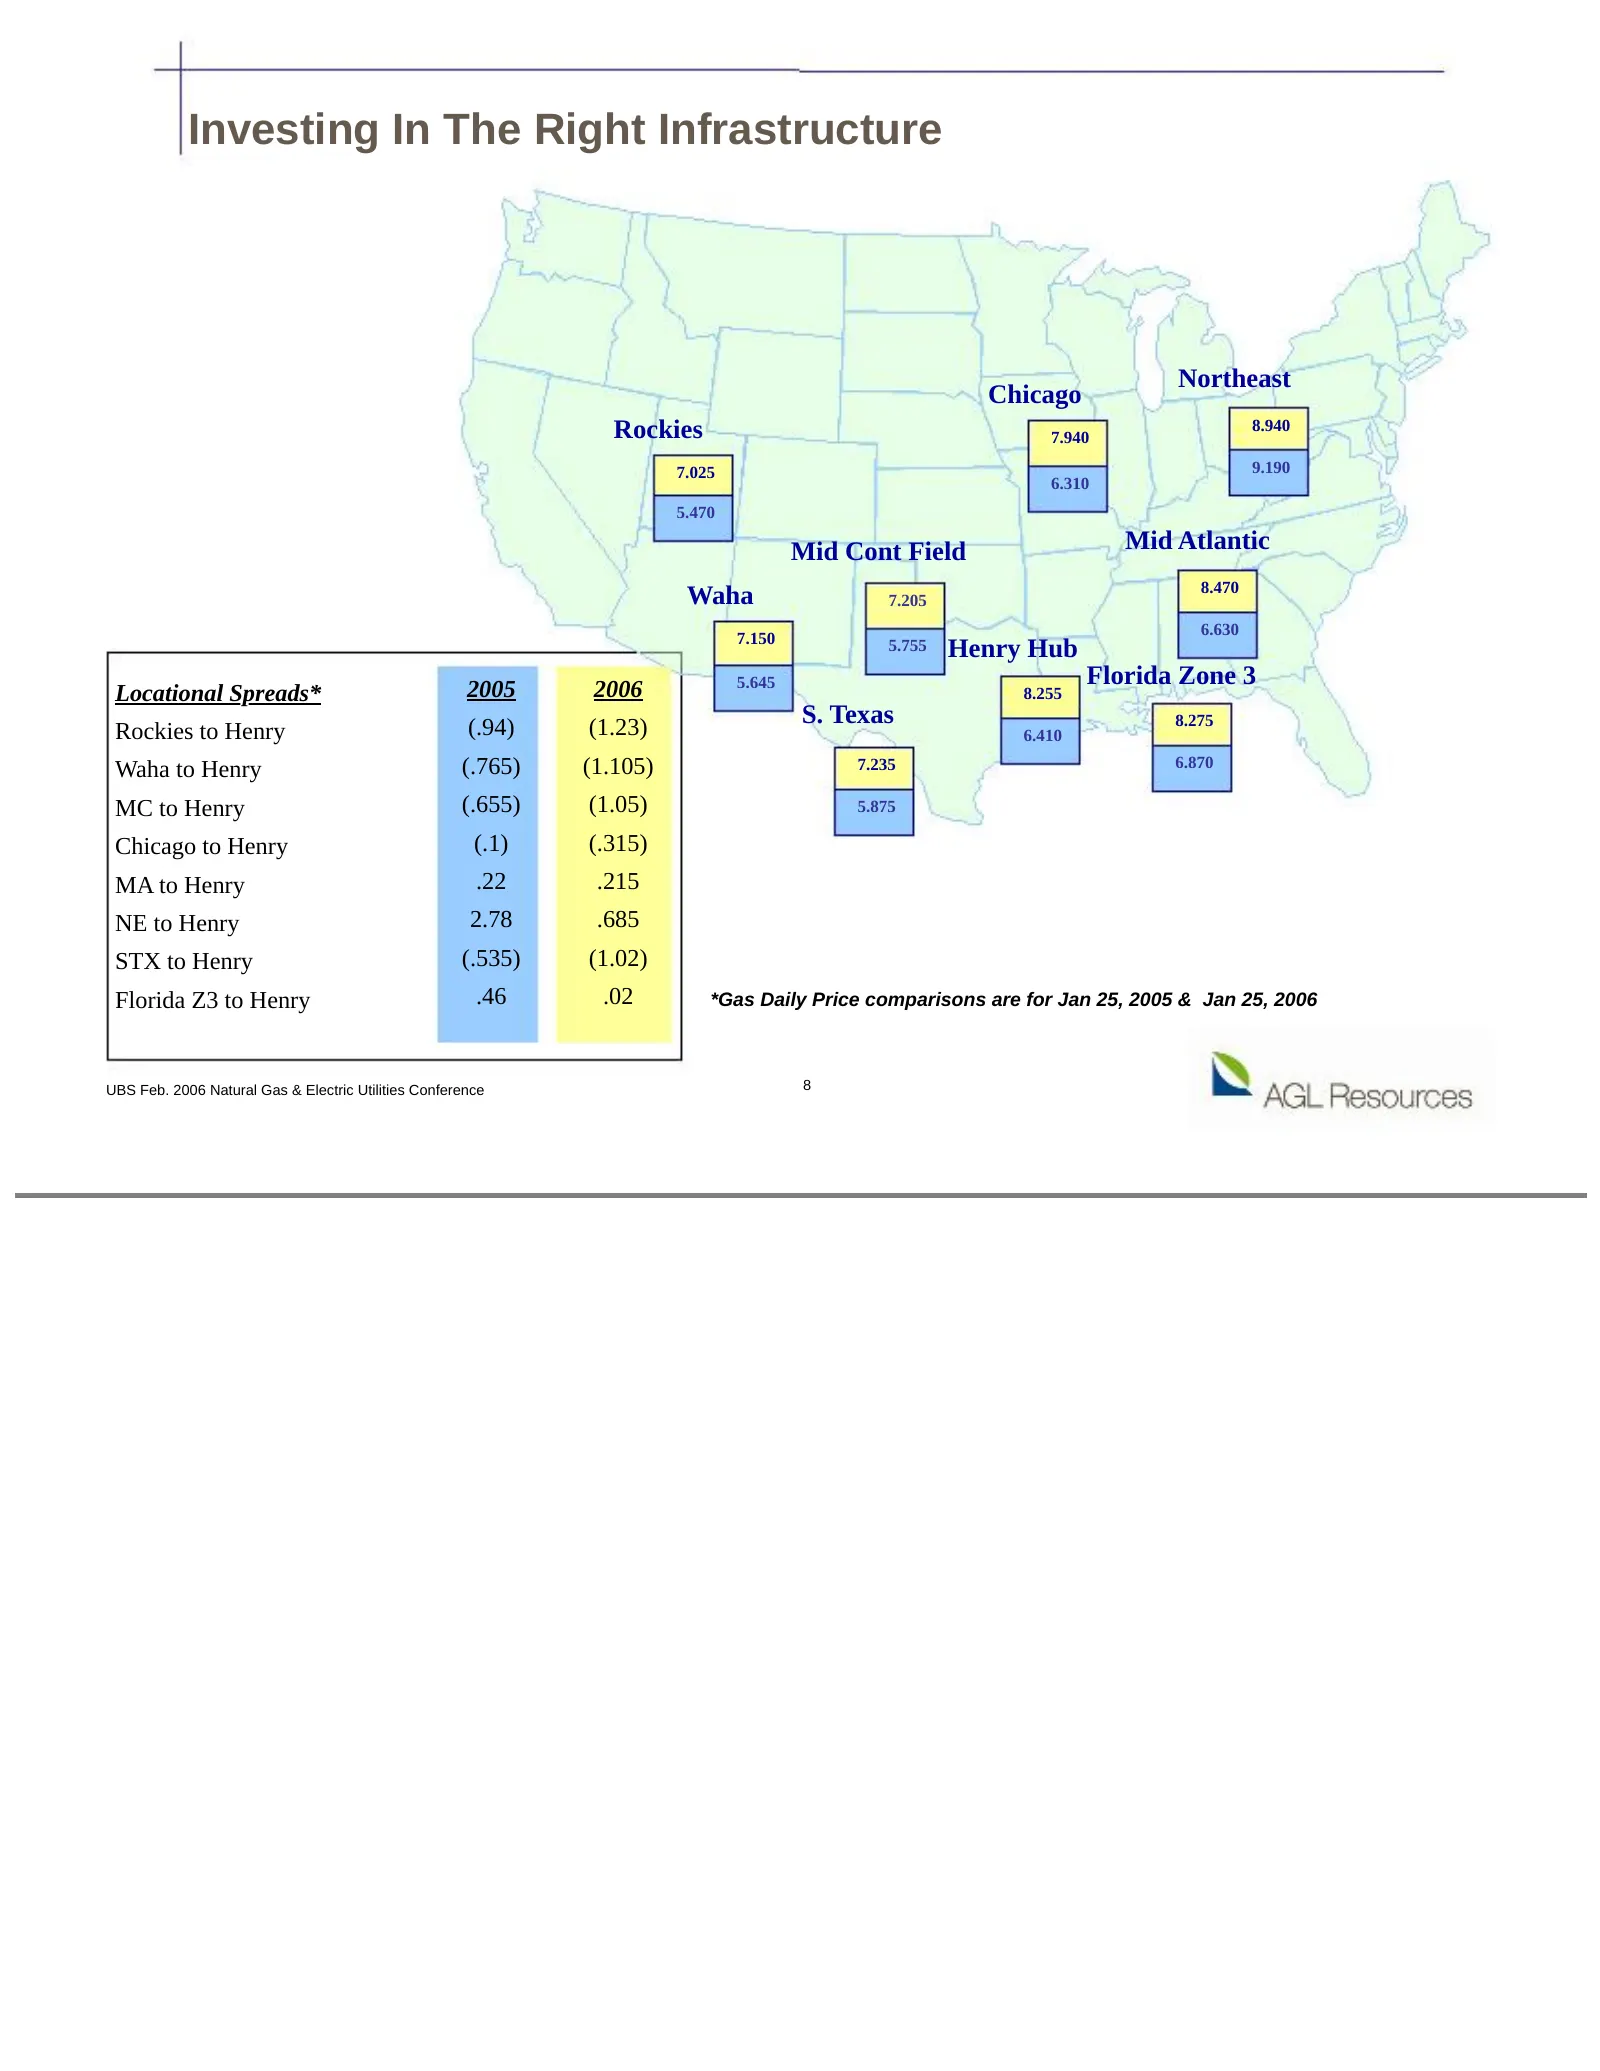
Investing In The Right Infrastructure Northeast Chicago Rockies 7.940 8.940 7.025 9.190 6.310 5.470 Mid Cont Field Mid Atlantic 8.470 Waha 7.205 6.630 7.150 5.755 Henry Hub 2005 2006 5.645 Florida Zone 3 Locational Spreads* 8.255 (.94) (1.23) S. Texas 8.275 Rockies to Henry 6.410 Waha to Henry (.765
Slide 9: Growth Will Require An Active Business Development Cycle
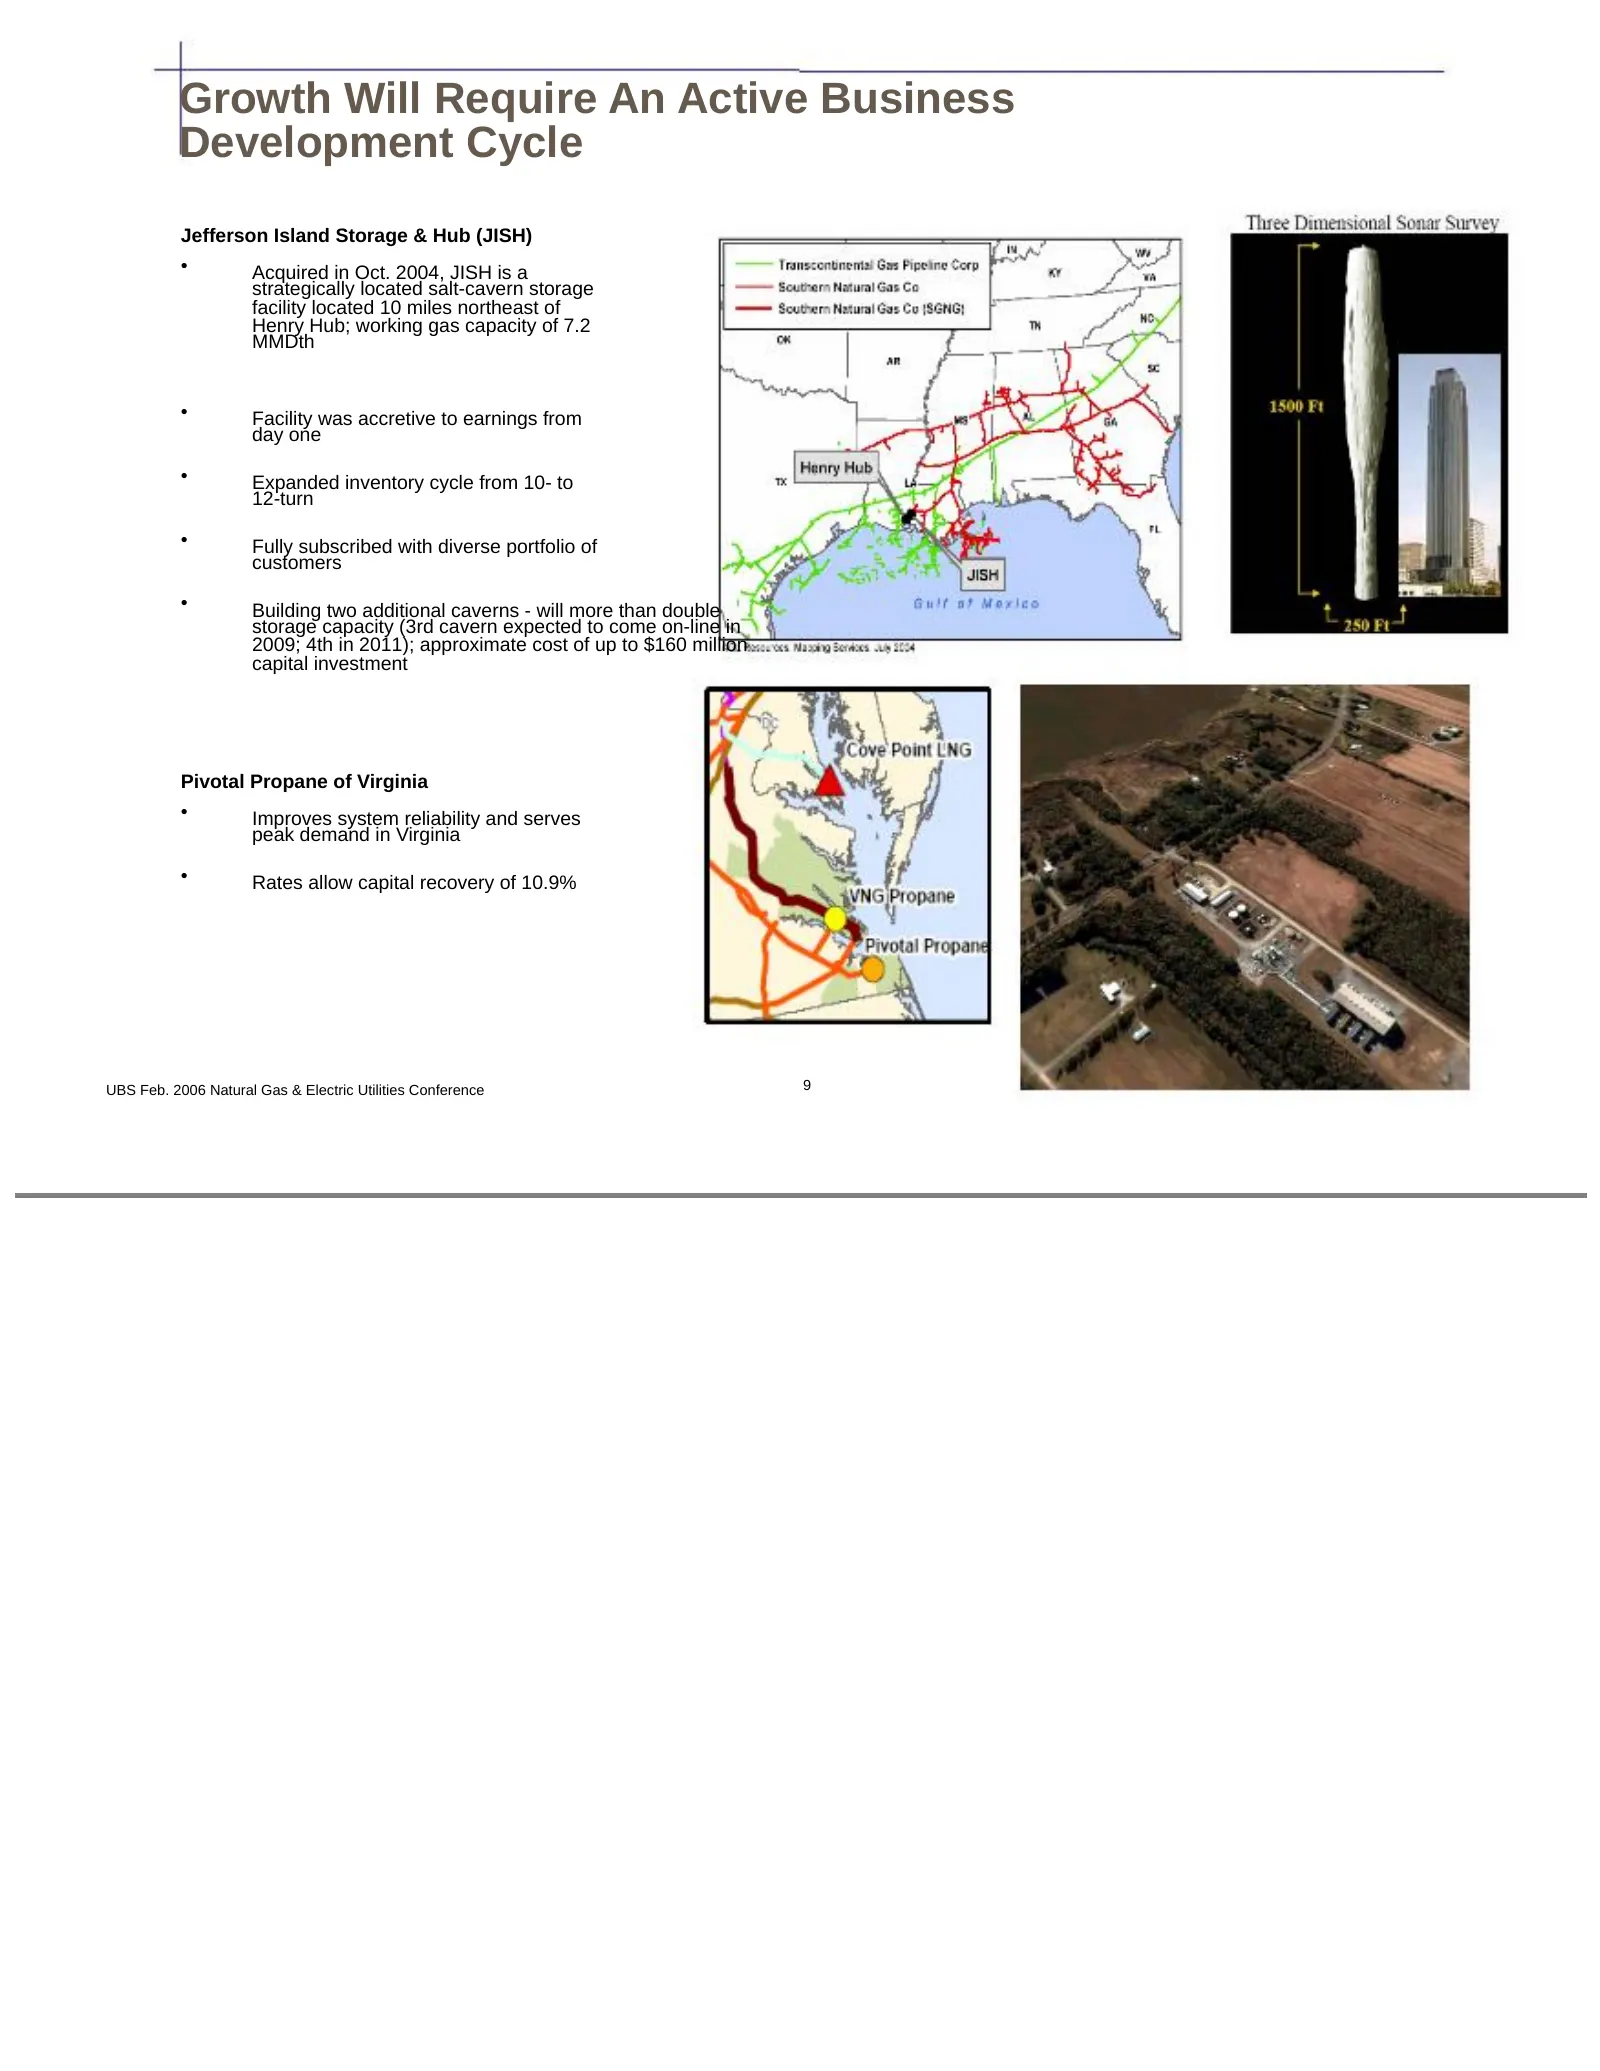
Growth Will Require An Active Business Development Cycle Jefferson Island Storage & Hub (JISH) • Acquired in Oct. 2004, JISH is a strategically located salt-cavern storage facility located 10 miles northeast of Henry Hub; working gas capacity of 7.2 MMDth • Facility was accretive to earnings from da
Slide 10: The Consolidation Growth Strategy
The Consolidation Growth Strategy • Creating cost savings through acquisitions – Creating workable regulatory compacts on the front end with state regulators – Delivering on integration, meeting milestones, and creating real value for customers and shareholders • The Future: “Business Process Excell
Slide 11: Execution on the Regulatory Front is Critical to Optimizing Returns
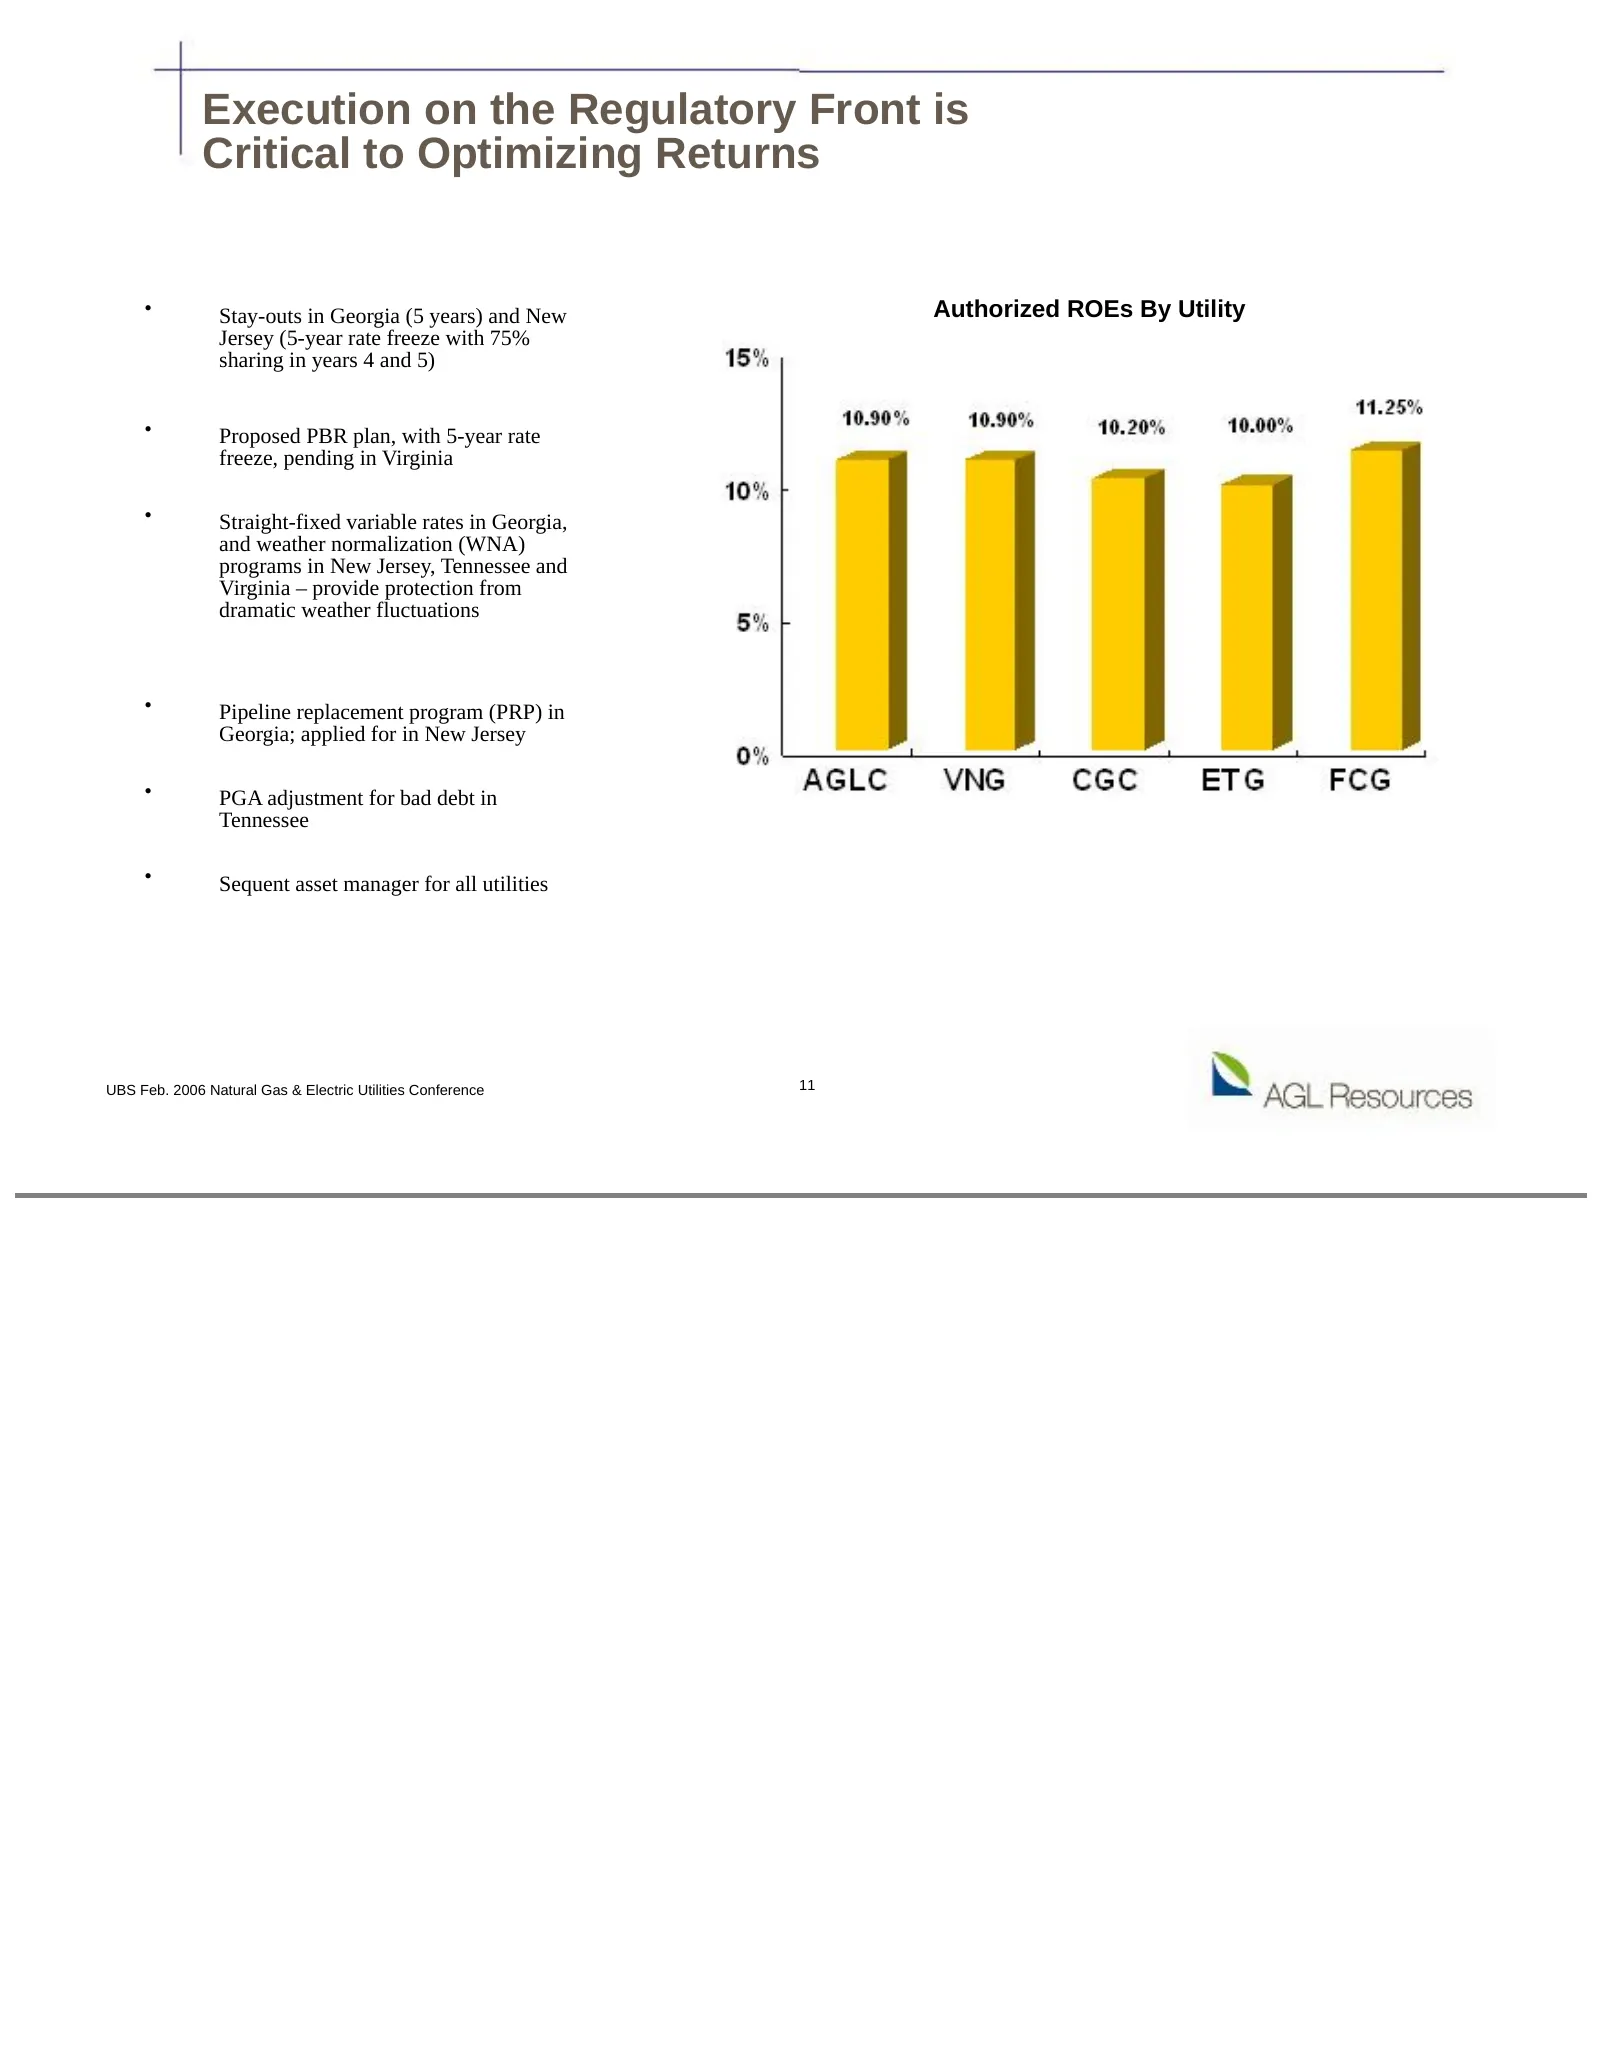
Execution on the Regulatory Front is Critical to Optimizing Returns • Stay-outs in Georgia (5 years) and New Authorized ROEs By Utility Jersey (5-year rate freeze with 75% sharing in years 4 and 5) • Proposed PBR plan, with 5-year rate freeze, pending in Virginia • Straight-fixed variable rates in G
Slide 12: Cash Flow to Fund Future Growth Initiatives
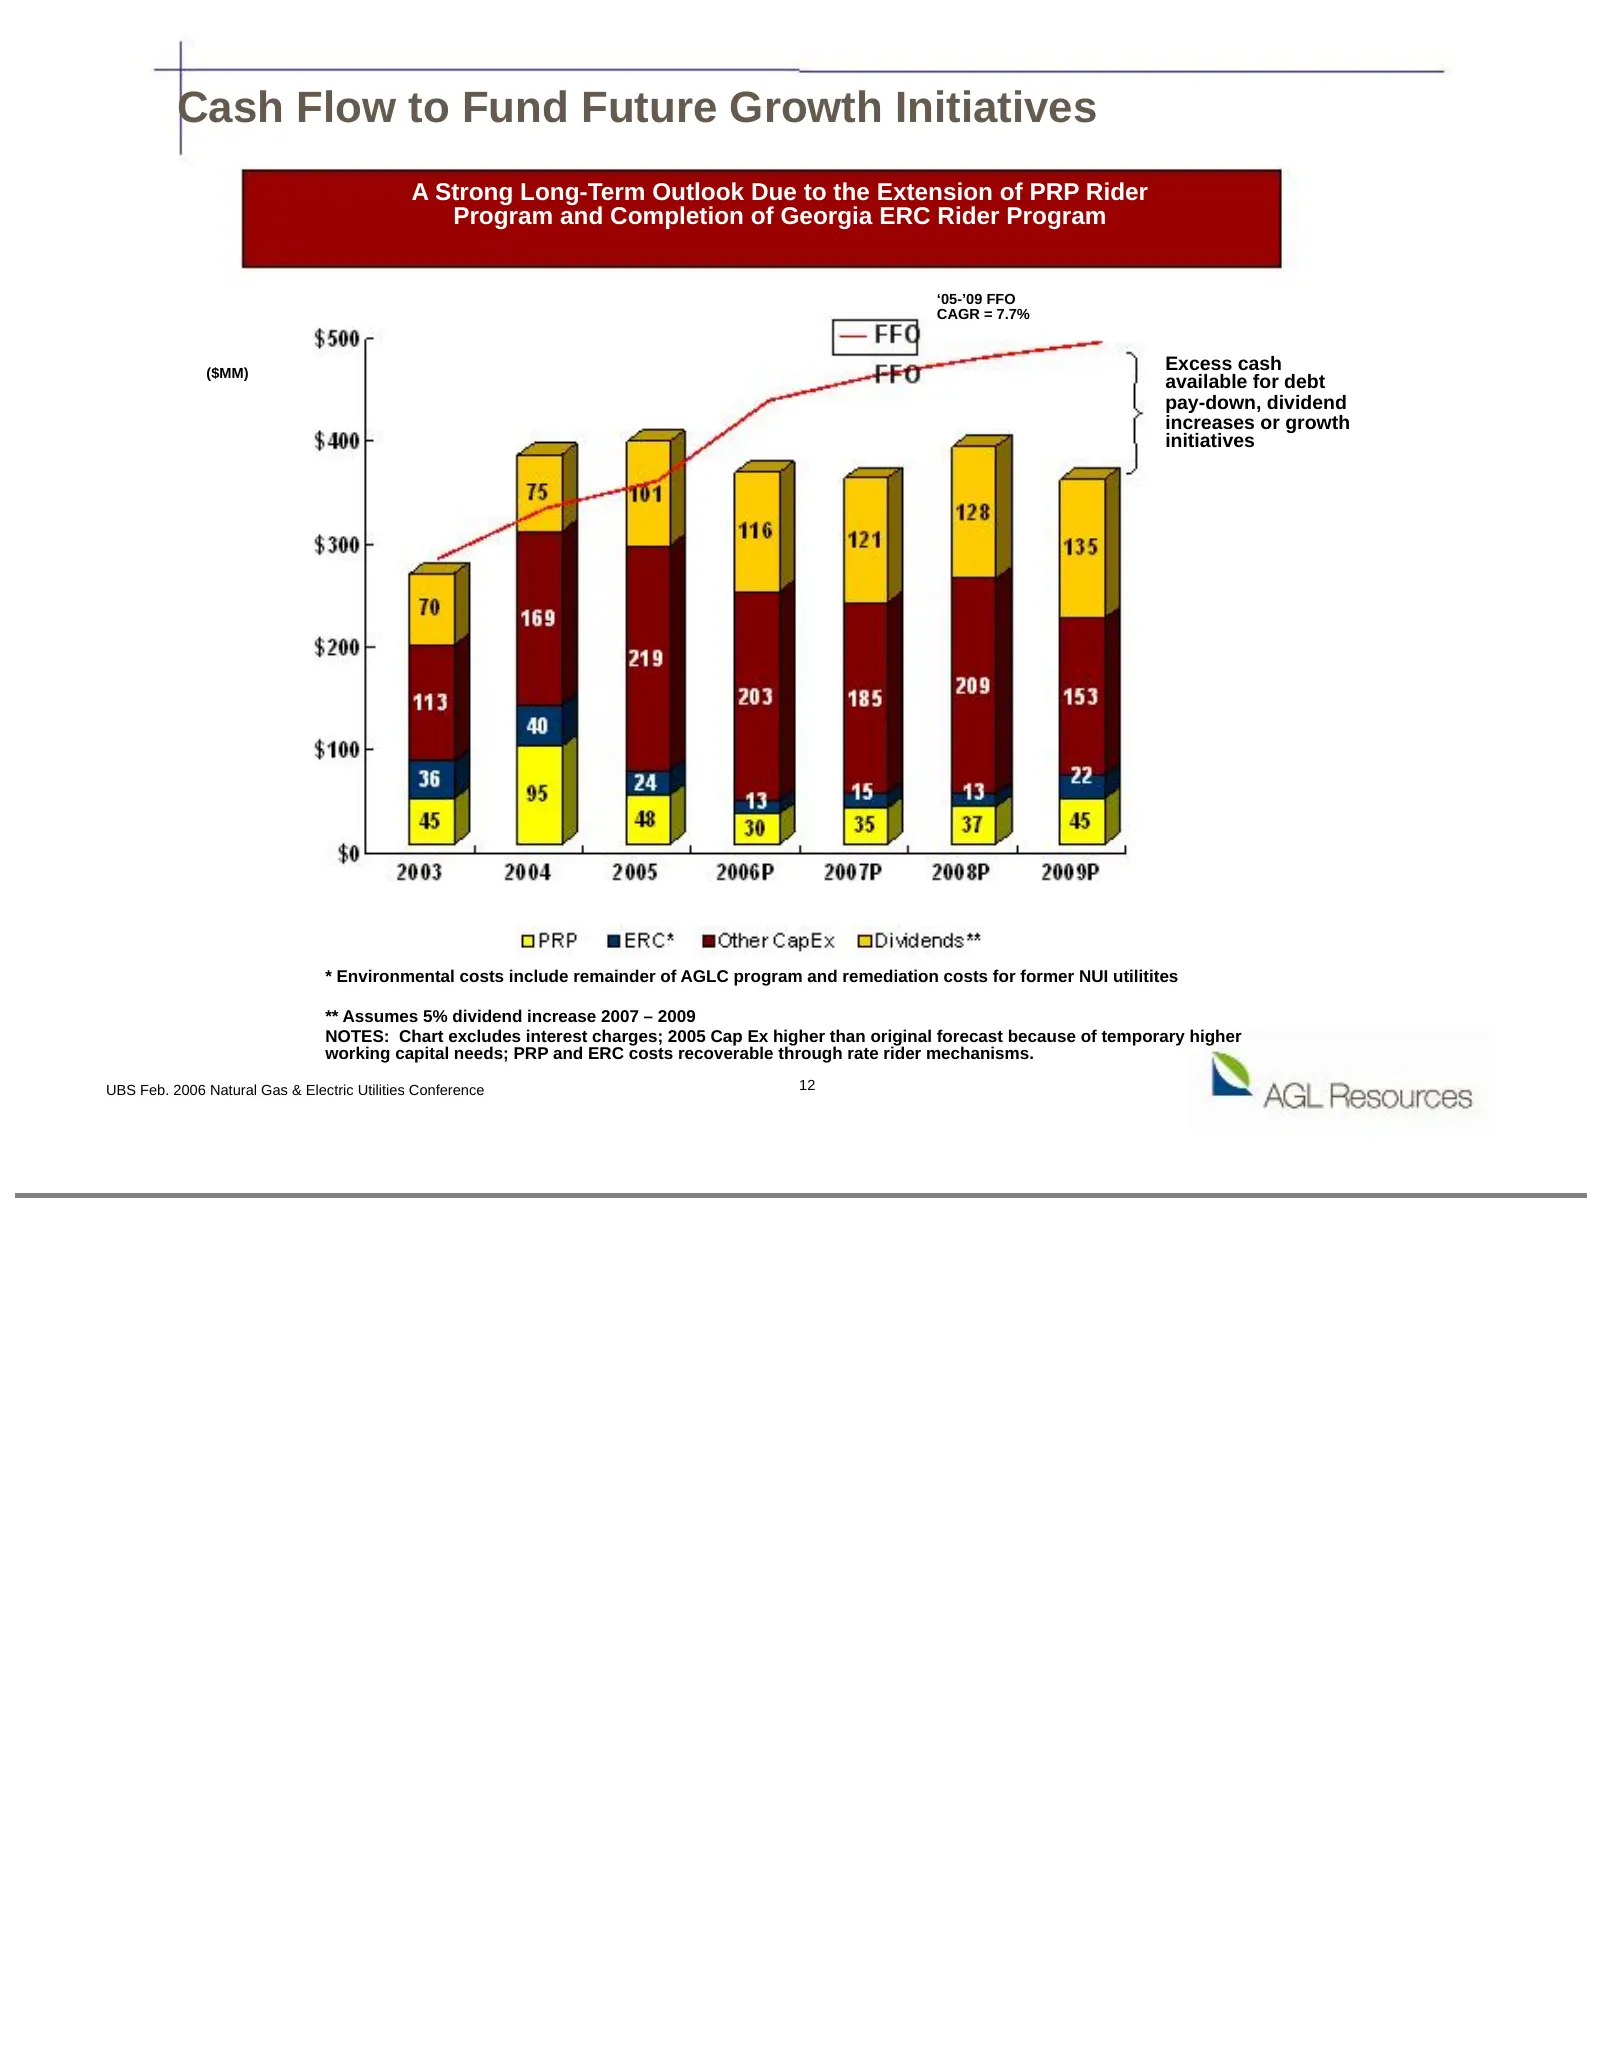
Cash Flow to Fund Future Growth Initiatives A Strong Long-Term Outlook Due to the Extension of PRP Rider Program and Completion of Georgia ERC Rider Program ‘05-’09 FFO CAGR = 7.7% ($MM) Excess cash available for debt pay-down, dividend increases or growth initiatives * Environmental costs include r
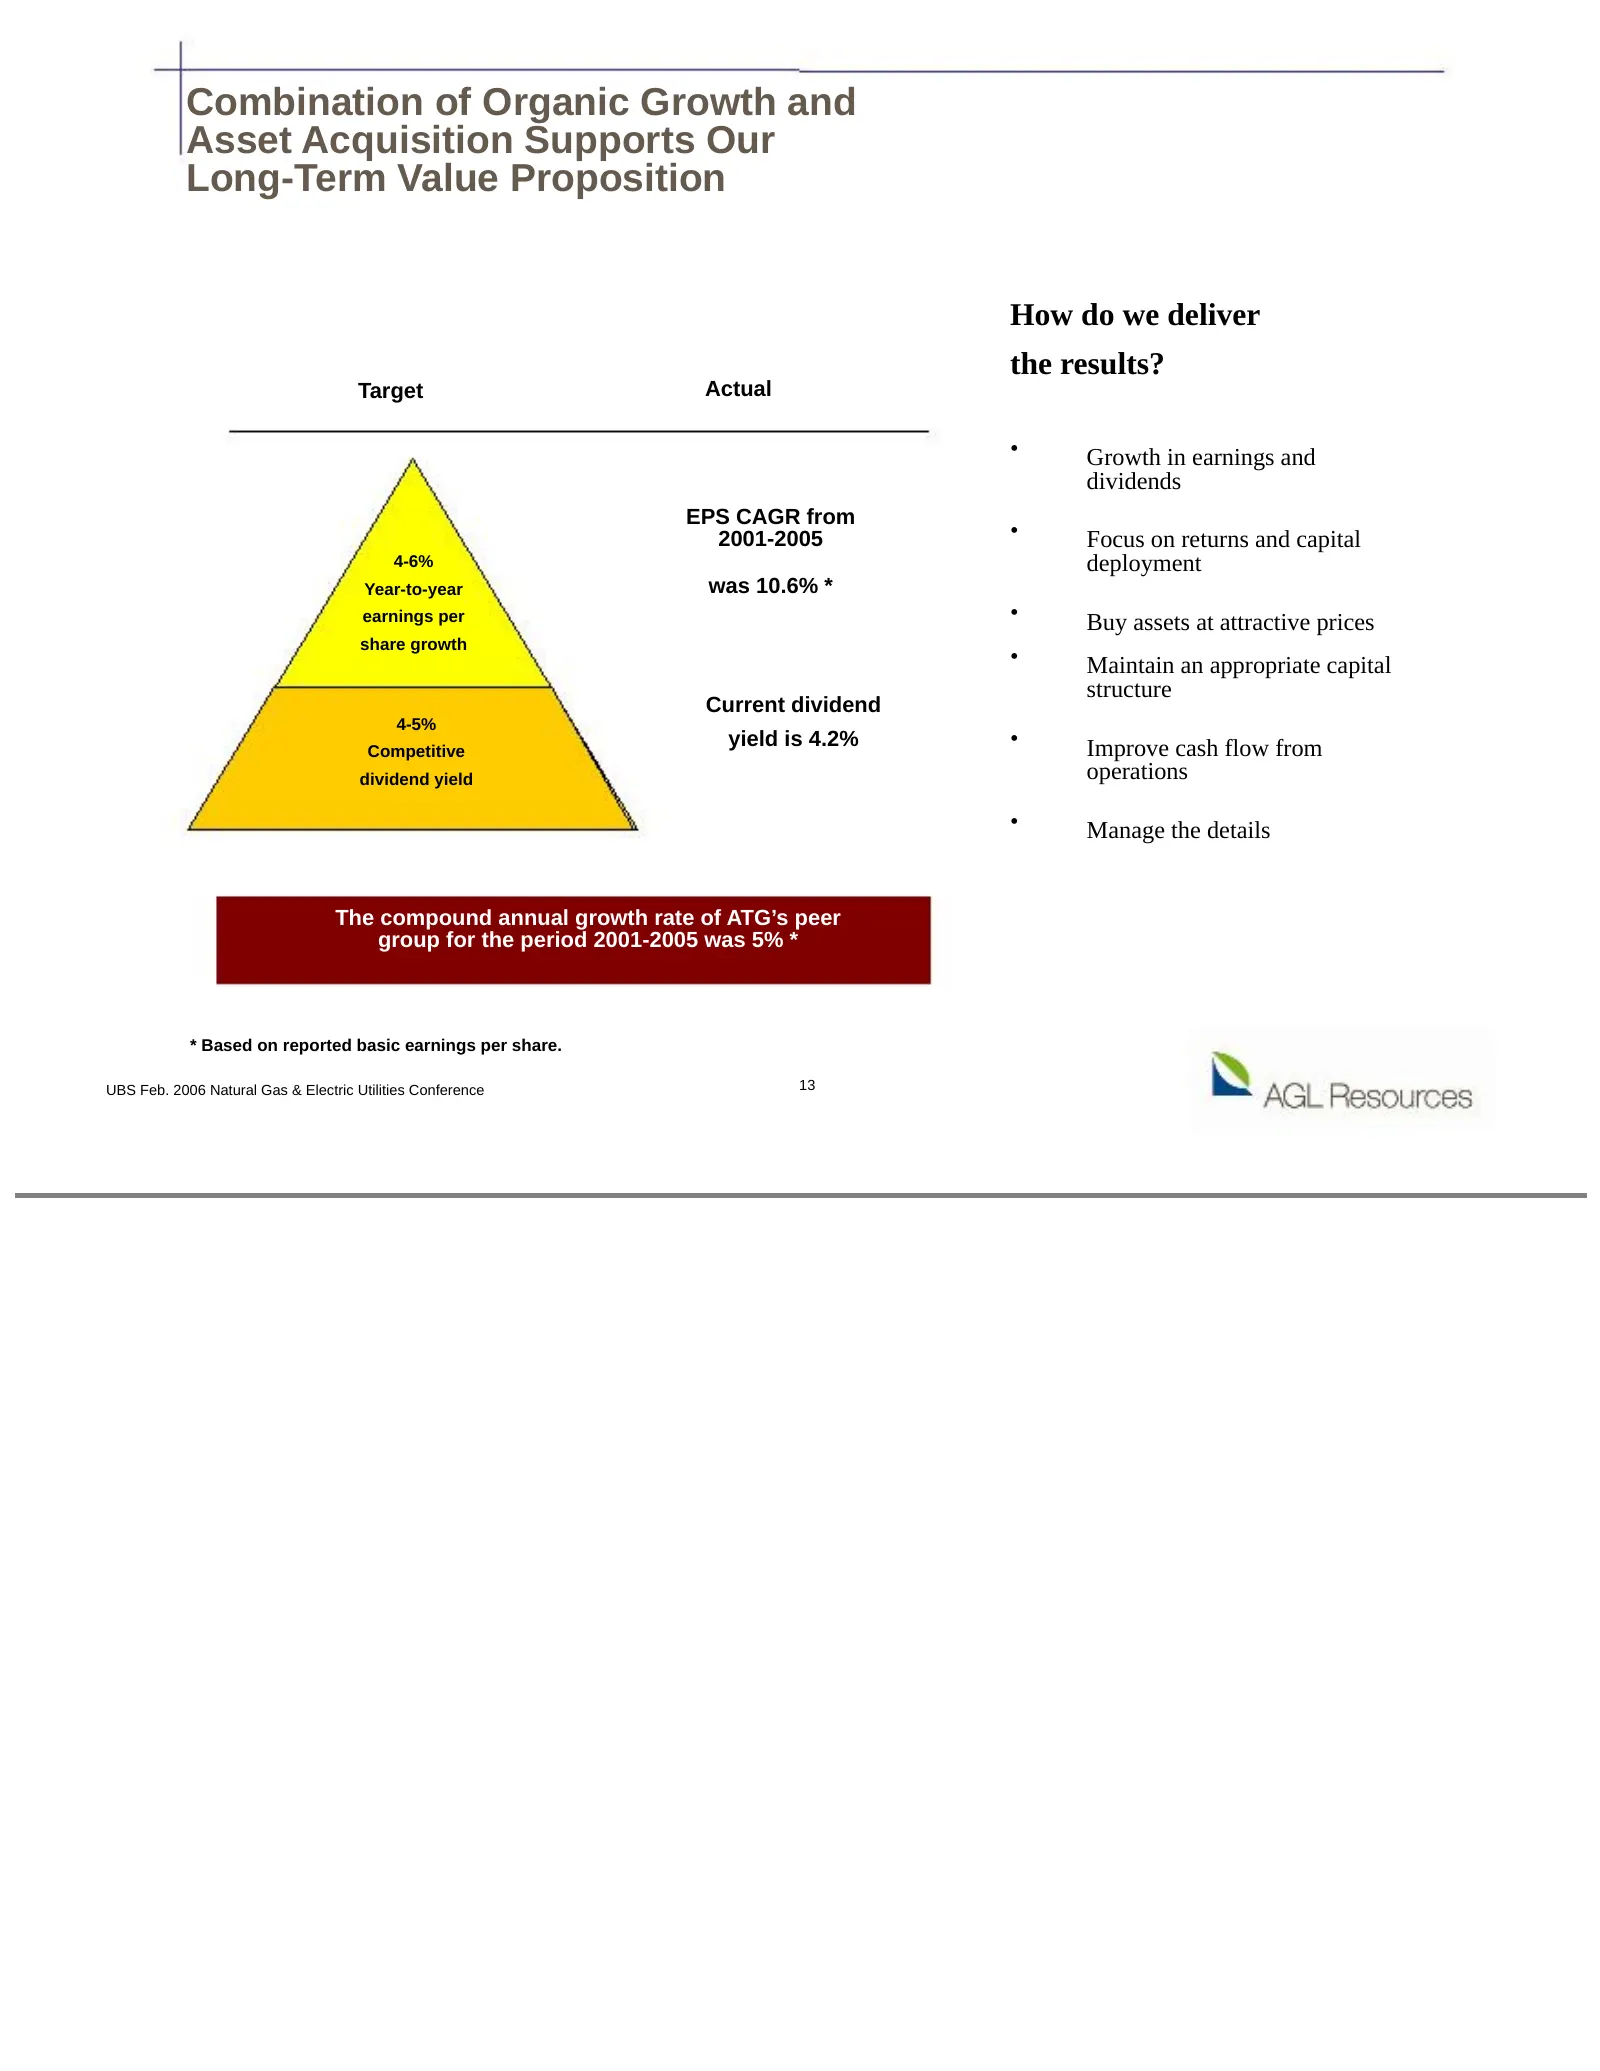
Slide 13: Combination of Organic Growth and Asset Acquisition Supports Our Long-Term Value Proposition
Combination of Organic Growth and Asset Acquisition Supports Our Long-Term Value Proposition How do we deliver the results? Target Actual • Growth in earnings and dividends EPS CAGR from 2001-2005 • Focus on returns and capital 4-6% deployment Year-to-year was 10.6% * earnings per • Buy assets at at
Slide 14: UBS Feb. 2006 Natural Gas & Electric Utilities Conference
UBS Feb. 2006 Natural Gas & Electric Utilities Conference 14

Slide 15
Source: SEC EDGAR · 8-K filed Feb 16, 2006
More decks from AGL Resources Inc
 Merger or Acquisition (August 2015)12 slides · Aug 24, 2015
 Investor Day (March 2015)89 slides · Mar 25, 2015
 Q4 2014 Earnings Presentation26 slides · Feb 12, 2015
 Q3 2014 Earnings Presentation24 slides · Nov 10, 2014
 Q2 2014 Earnings Presentation19 slides · Jul 30, 2014
 Q1 2014 Earnings Presentation19 slides · Apr 29, 2014