CYS Investments — Barclays Global Financial Services Conference 2013
24 slides from CYS Investments's conference presentation, Sep 10, 2013
Slide 1: Investment Outlook September 2013
Exhibit 99.1 Investment Outlook September - 2013 Kevin E. Grant, CFA Chief Executive Officer Barclays Global Financial Services Conference September 10, 2013
Slide 2: Forward Looking Statements
Forward Looking Statements This presentation contains forward-looking statements, within the meaning of Section 27A of the Securities Act of 1933, as amended, and Section 21E of the Securities Exchange Act of 1934, as amended, that are based on management’s beliefs and assumptions, current expectati
Slide 3: CYS Overview
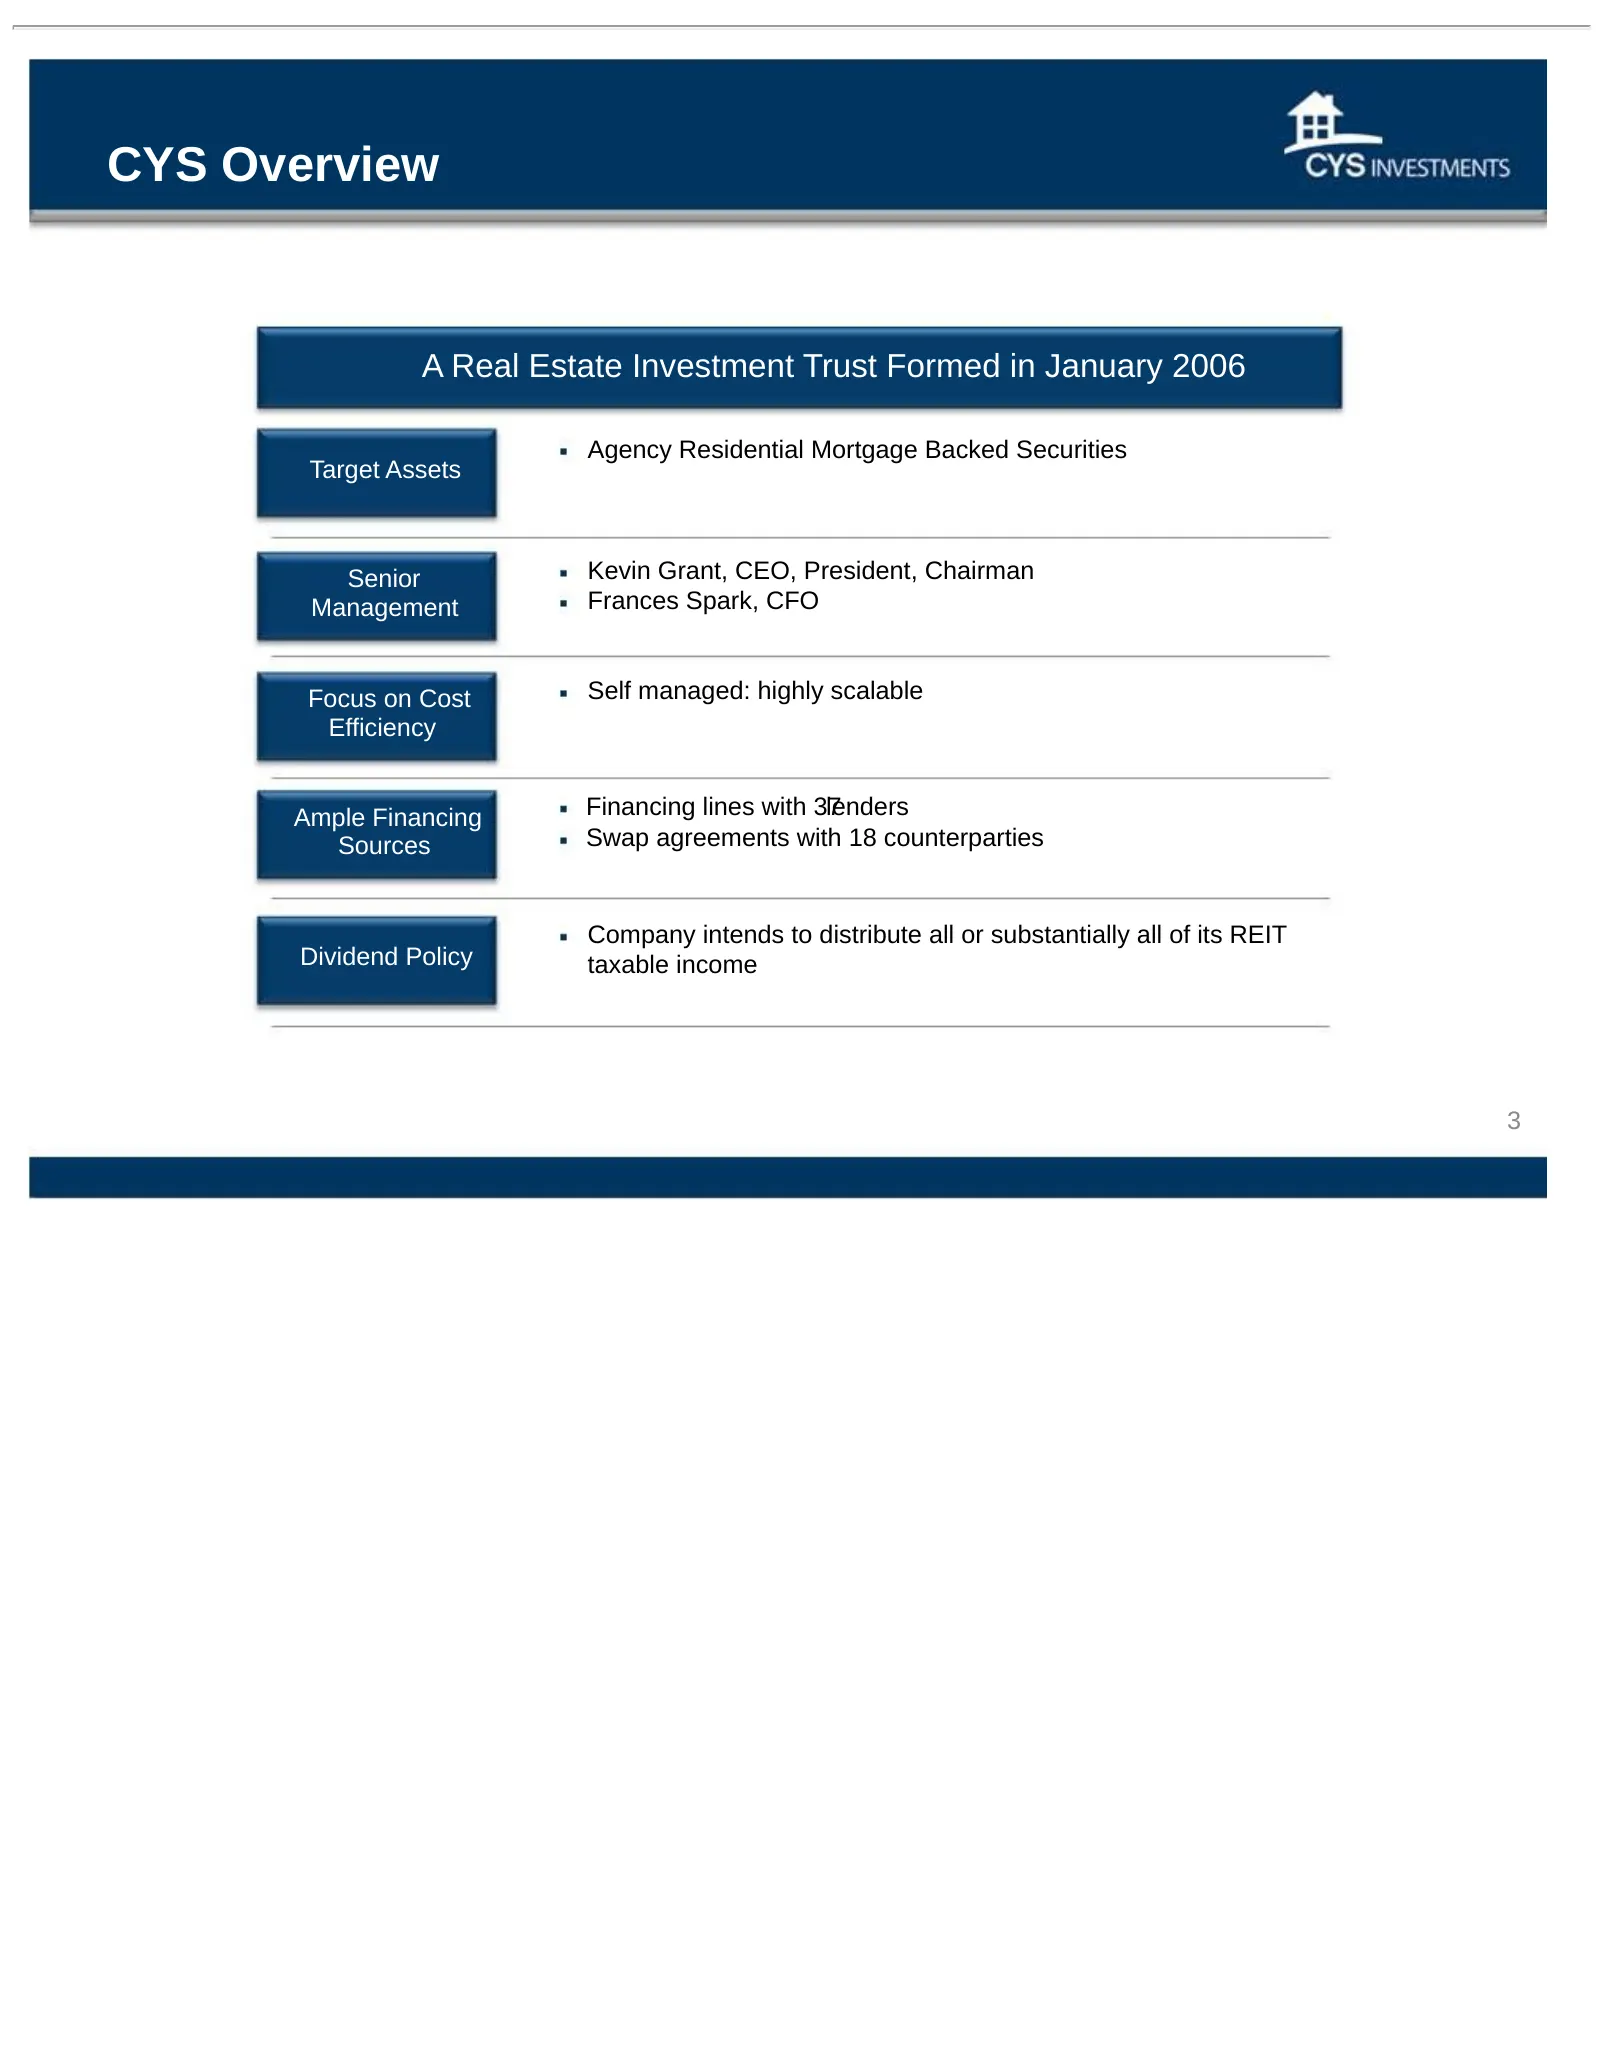
CYS Overview A Real Estate Investment Trust Formed in January 2006 Agency Residential Mortgage Backed Securities Target Assets Senior Kevin Grant, CEO, President, Chairman Management Frances Spark, CFO Focus on Cost Self managed: highly scalable Efficiency Ample Financing Financing lines with 37 len
Slide 4: Investment Environment: 15 Year Hedged vs. Unhedged
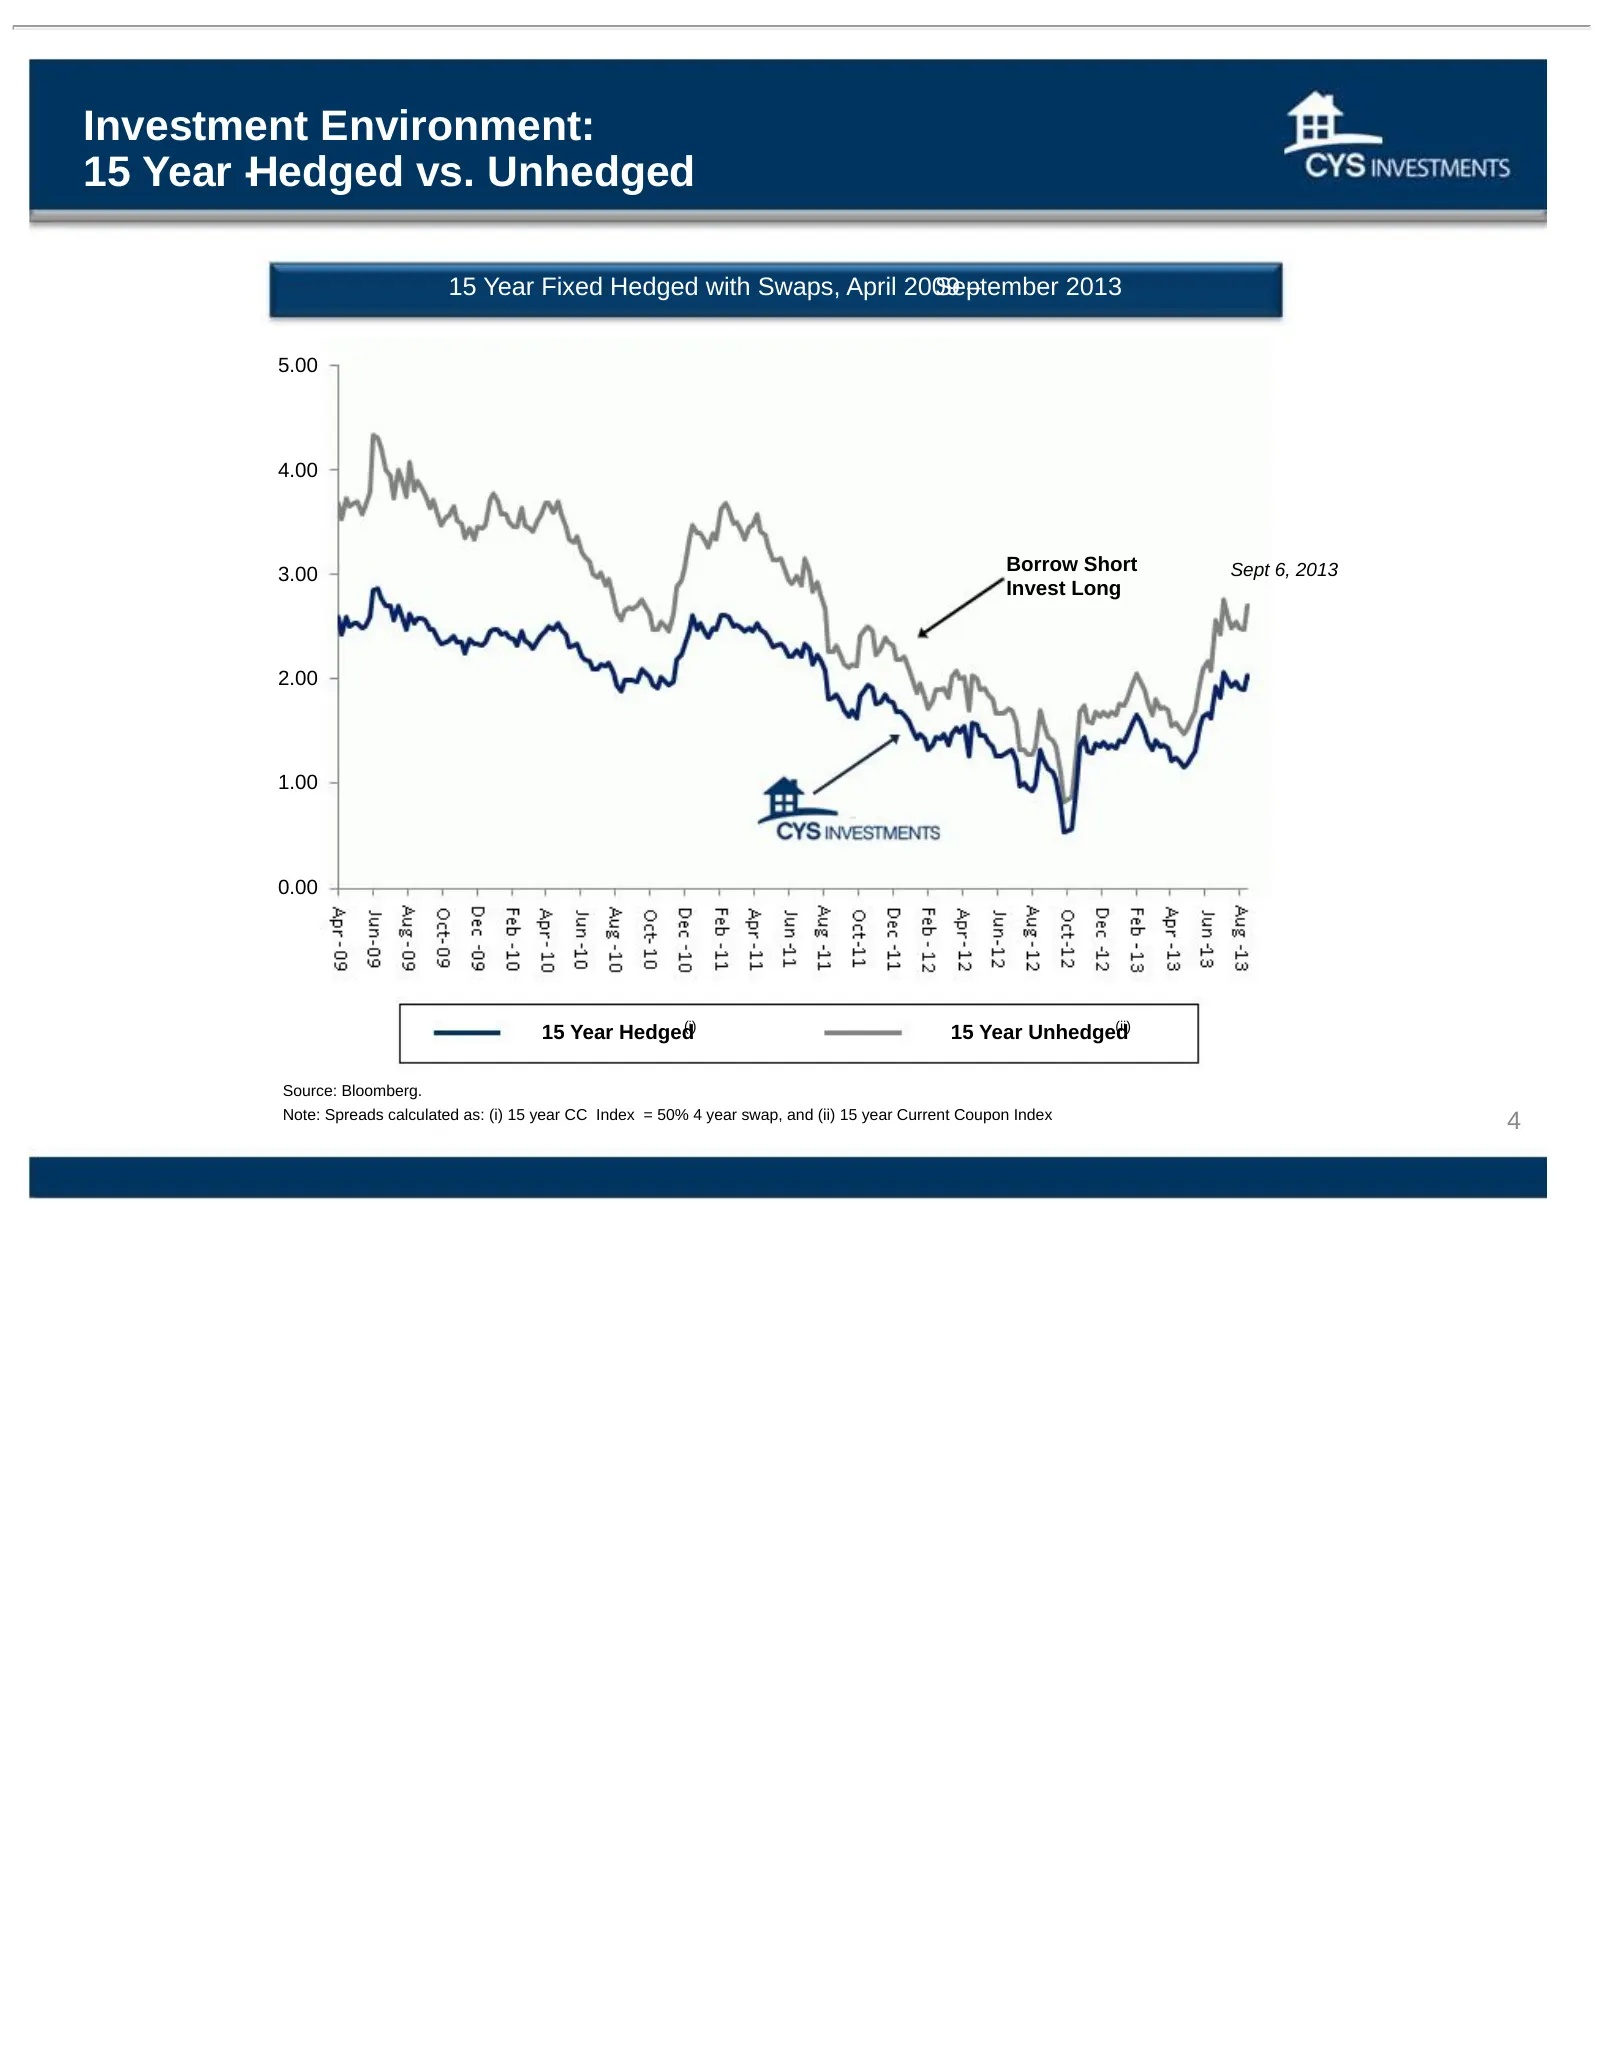
Investment Environment: 15 Year -Hedged vs. Unhedged 15 Year Fixed Hedged with Swaps, April 2009 September – 2013 5.00 4.00 3.00 Borrow Short Sept 6, 2013 Invest Long 2.00 1.00 0.00 (i) (ii) 15 Year Hedged 15 Year Unhedged Source: Bloomberg. Note: Spreads calculated as: (i) 15 year CC Index = 50% 4
Slide 5: Investment Environment: 30 Year Hedged vs. Unhedged
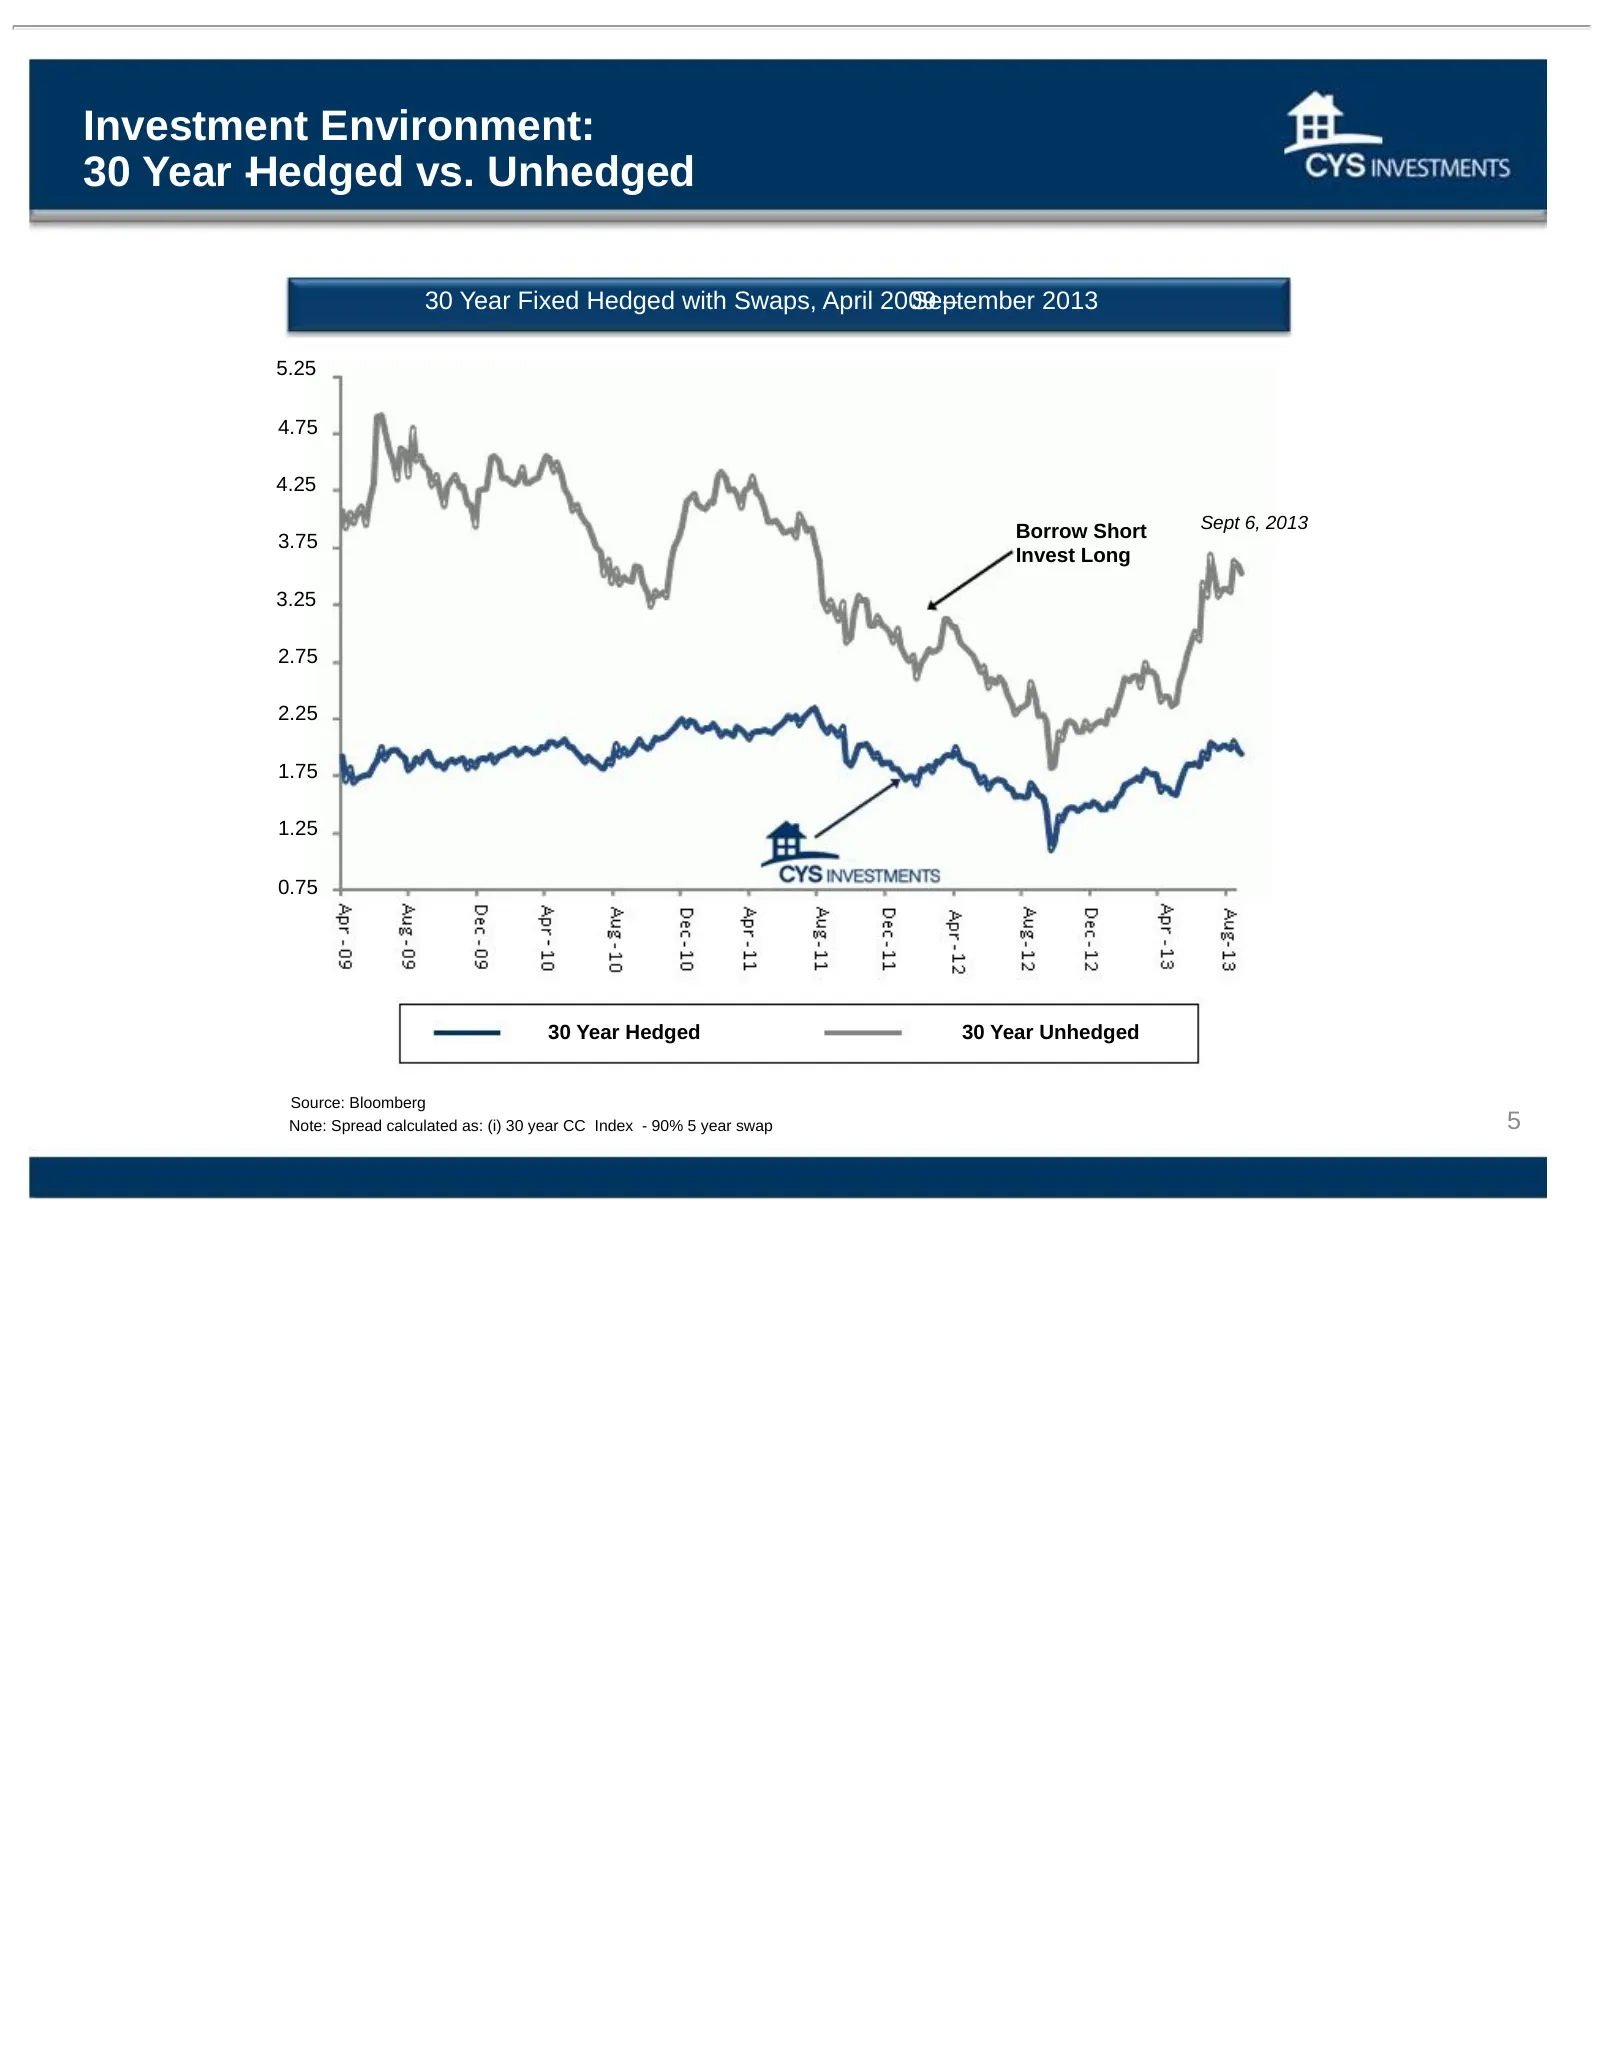
Investment Environment: 30 Year -Hedged vs. Unhedged 30 Year Fixed Hedged with Swaps, April 2009 September – 2013 5.25 4.75 4.25 Borrow Short Sept 6, 2013 3.75 Invest Long 3.25 2.75 2.25 1.75 1.25 0.75 30 Year Hedged 30 Year Unhedged Source: Bloomberg Note: Spread calculated as: (i) 30 year CC Index
Slide 6: 30 Year MBS Priced for Operation Taper
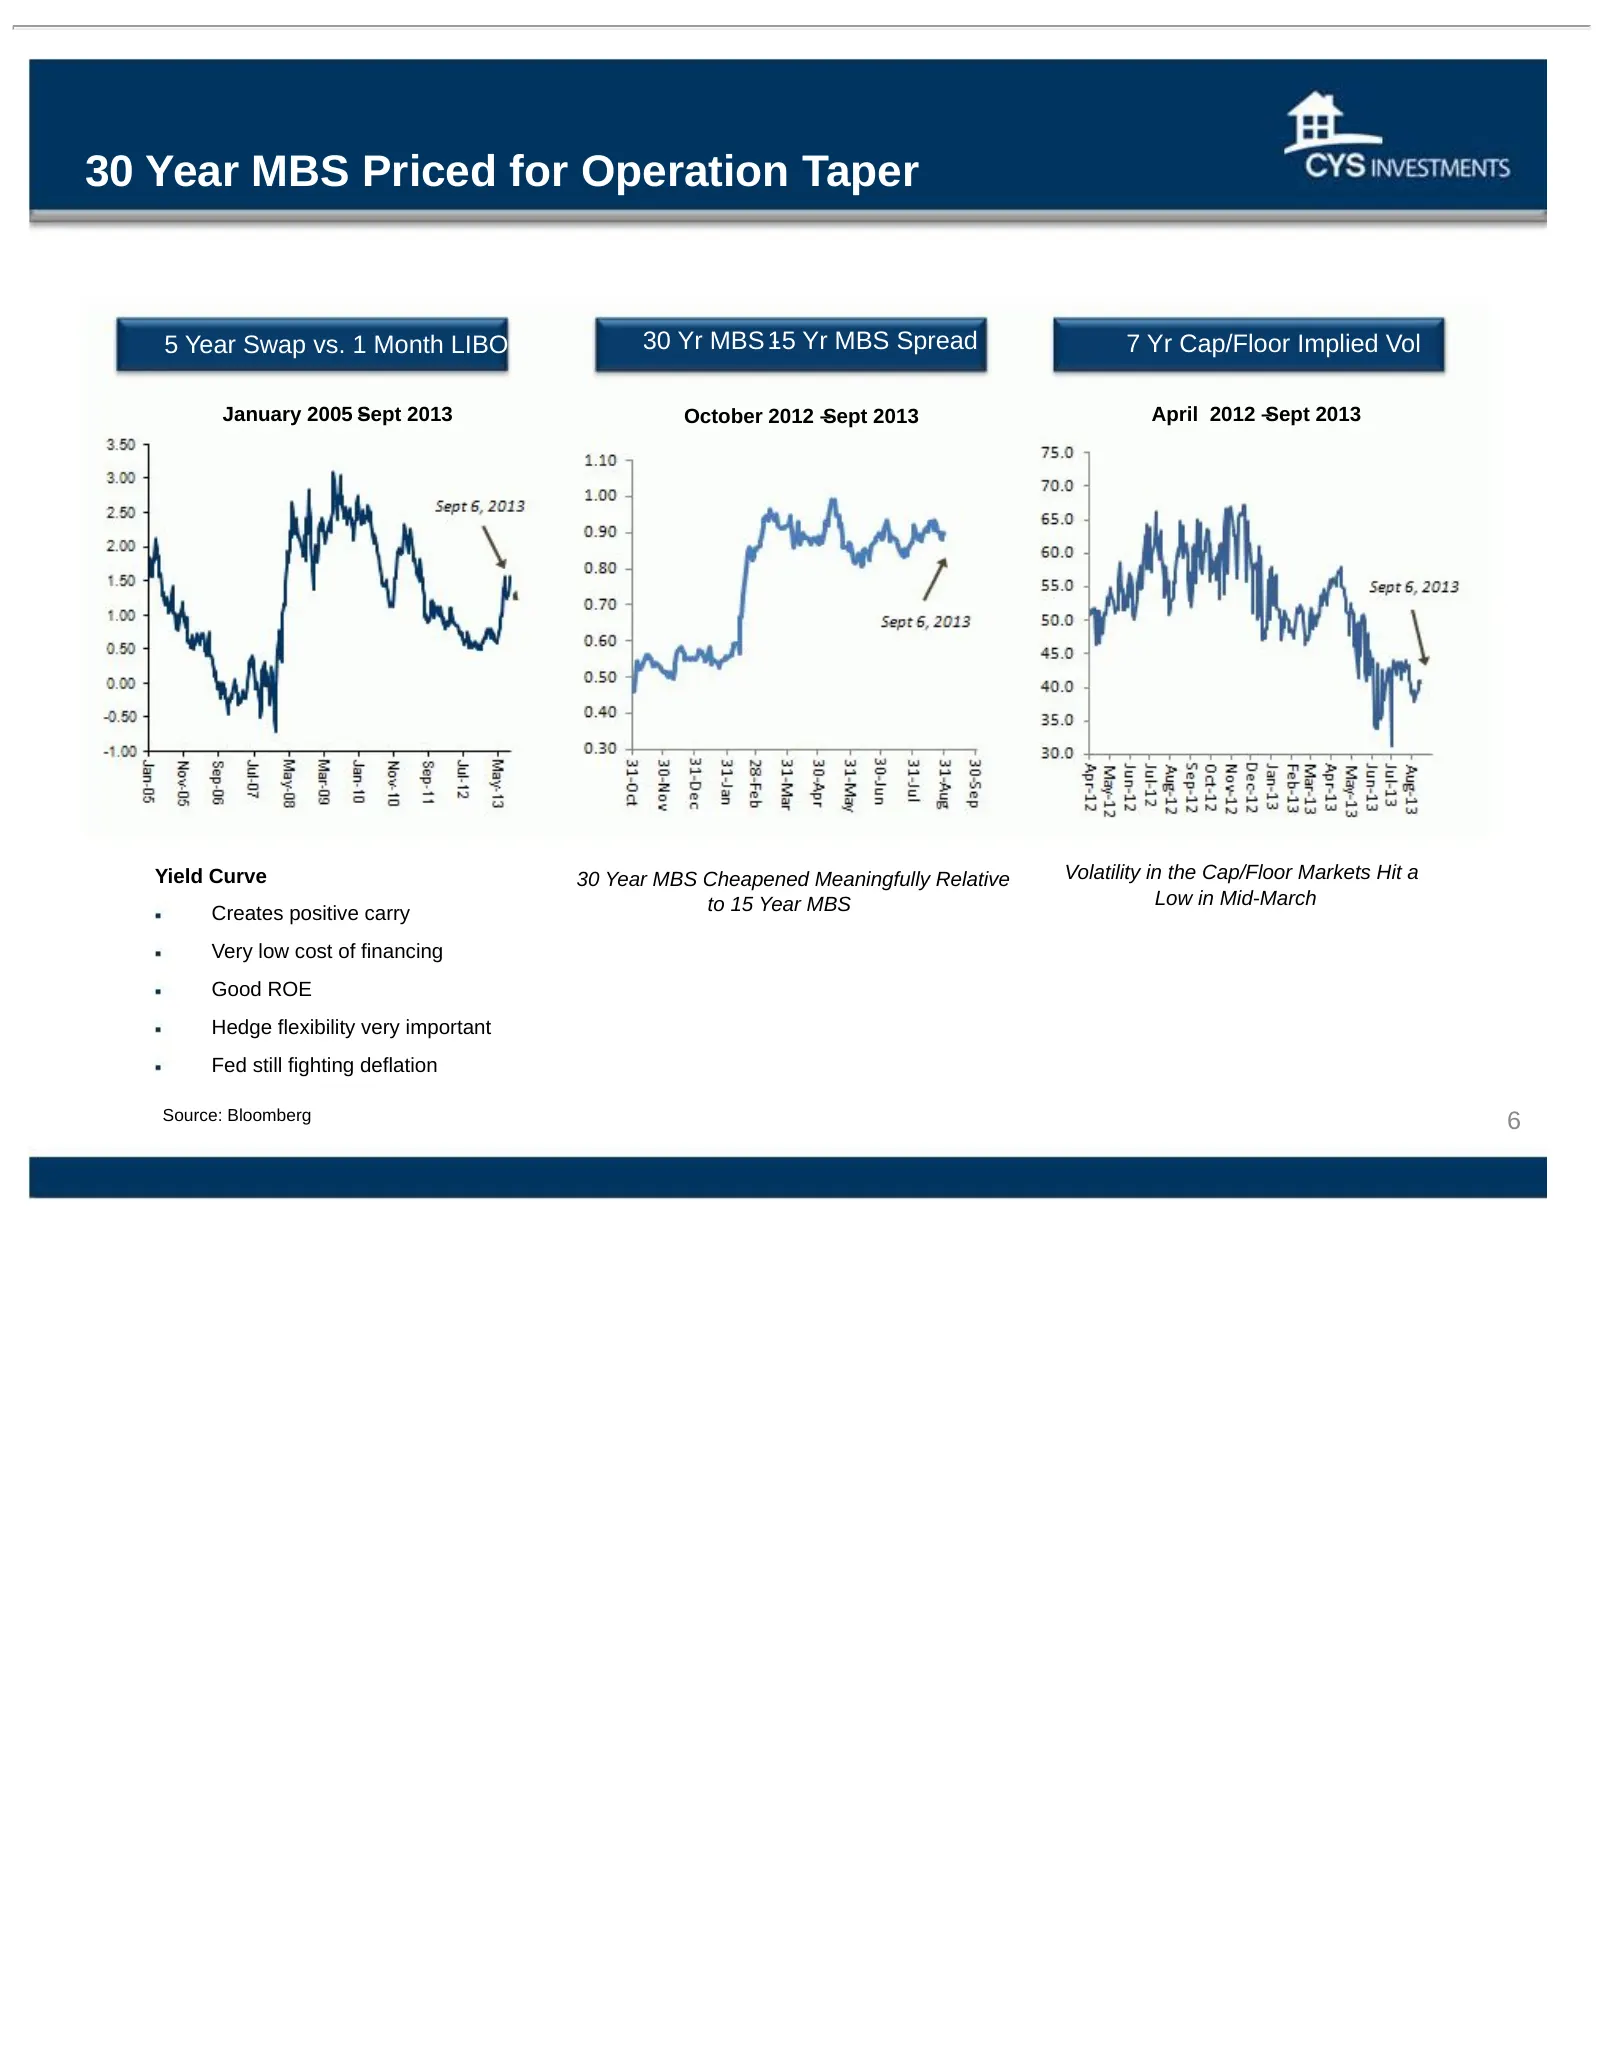
30 Year MBS Priced for Operation Taper 5 Year Swap vs. 1 Month LIBOR 30 Yr MBS 15 - Yr MBS Spread 7 Yr Cap/Floor Implied Vol January 2005 S – ept 2013 October 2012 –Sept 2013 April 2012 –Sept 2013 Yield Curve 30 Year MBS Cheapened Meaningfully Relative Volatility in the Cap/Floor Markets Hit a to 15
Slide 7: Actual Economic Performance: Sluggish vs. Fed Projections
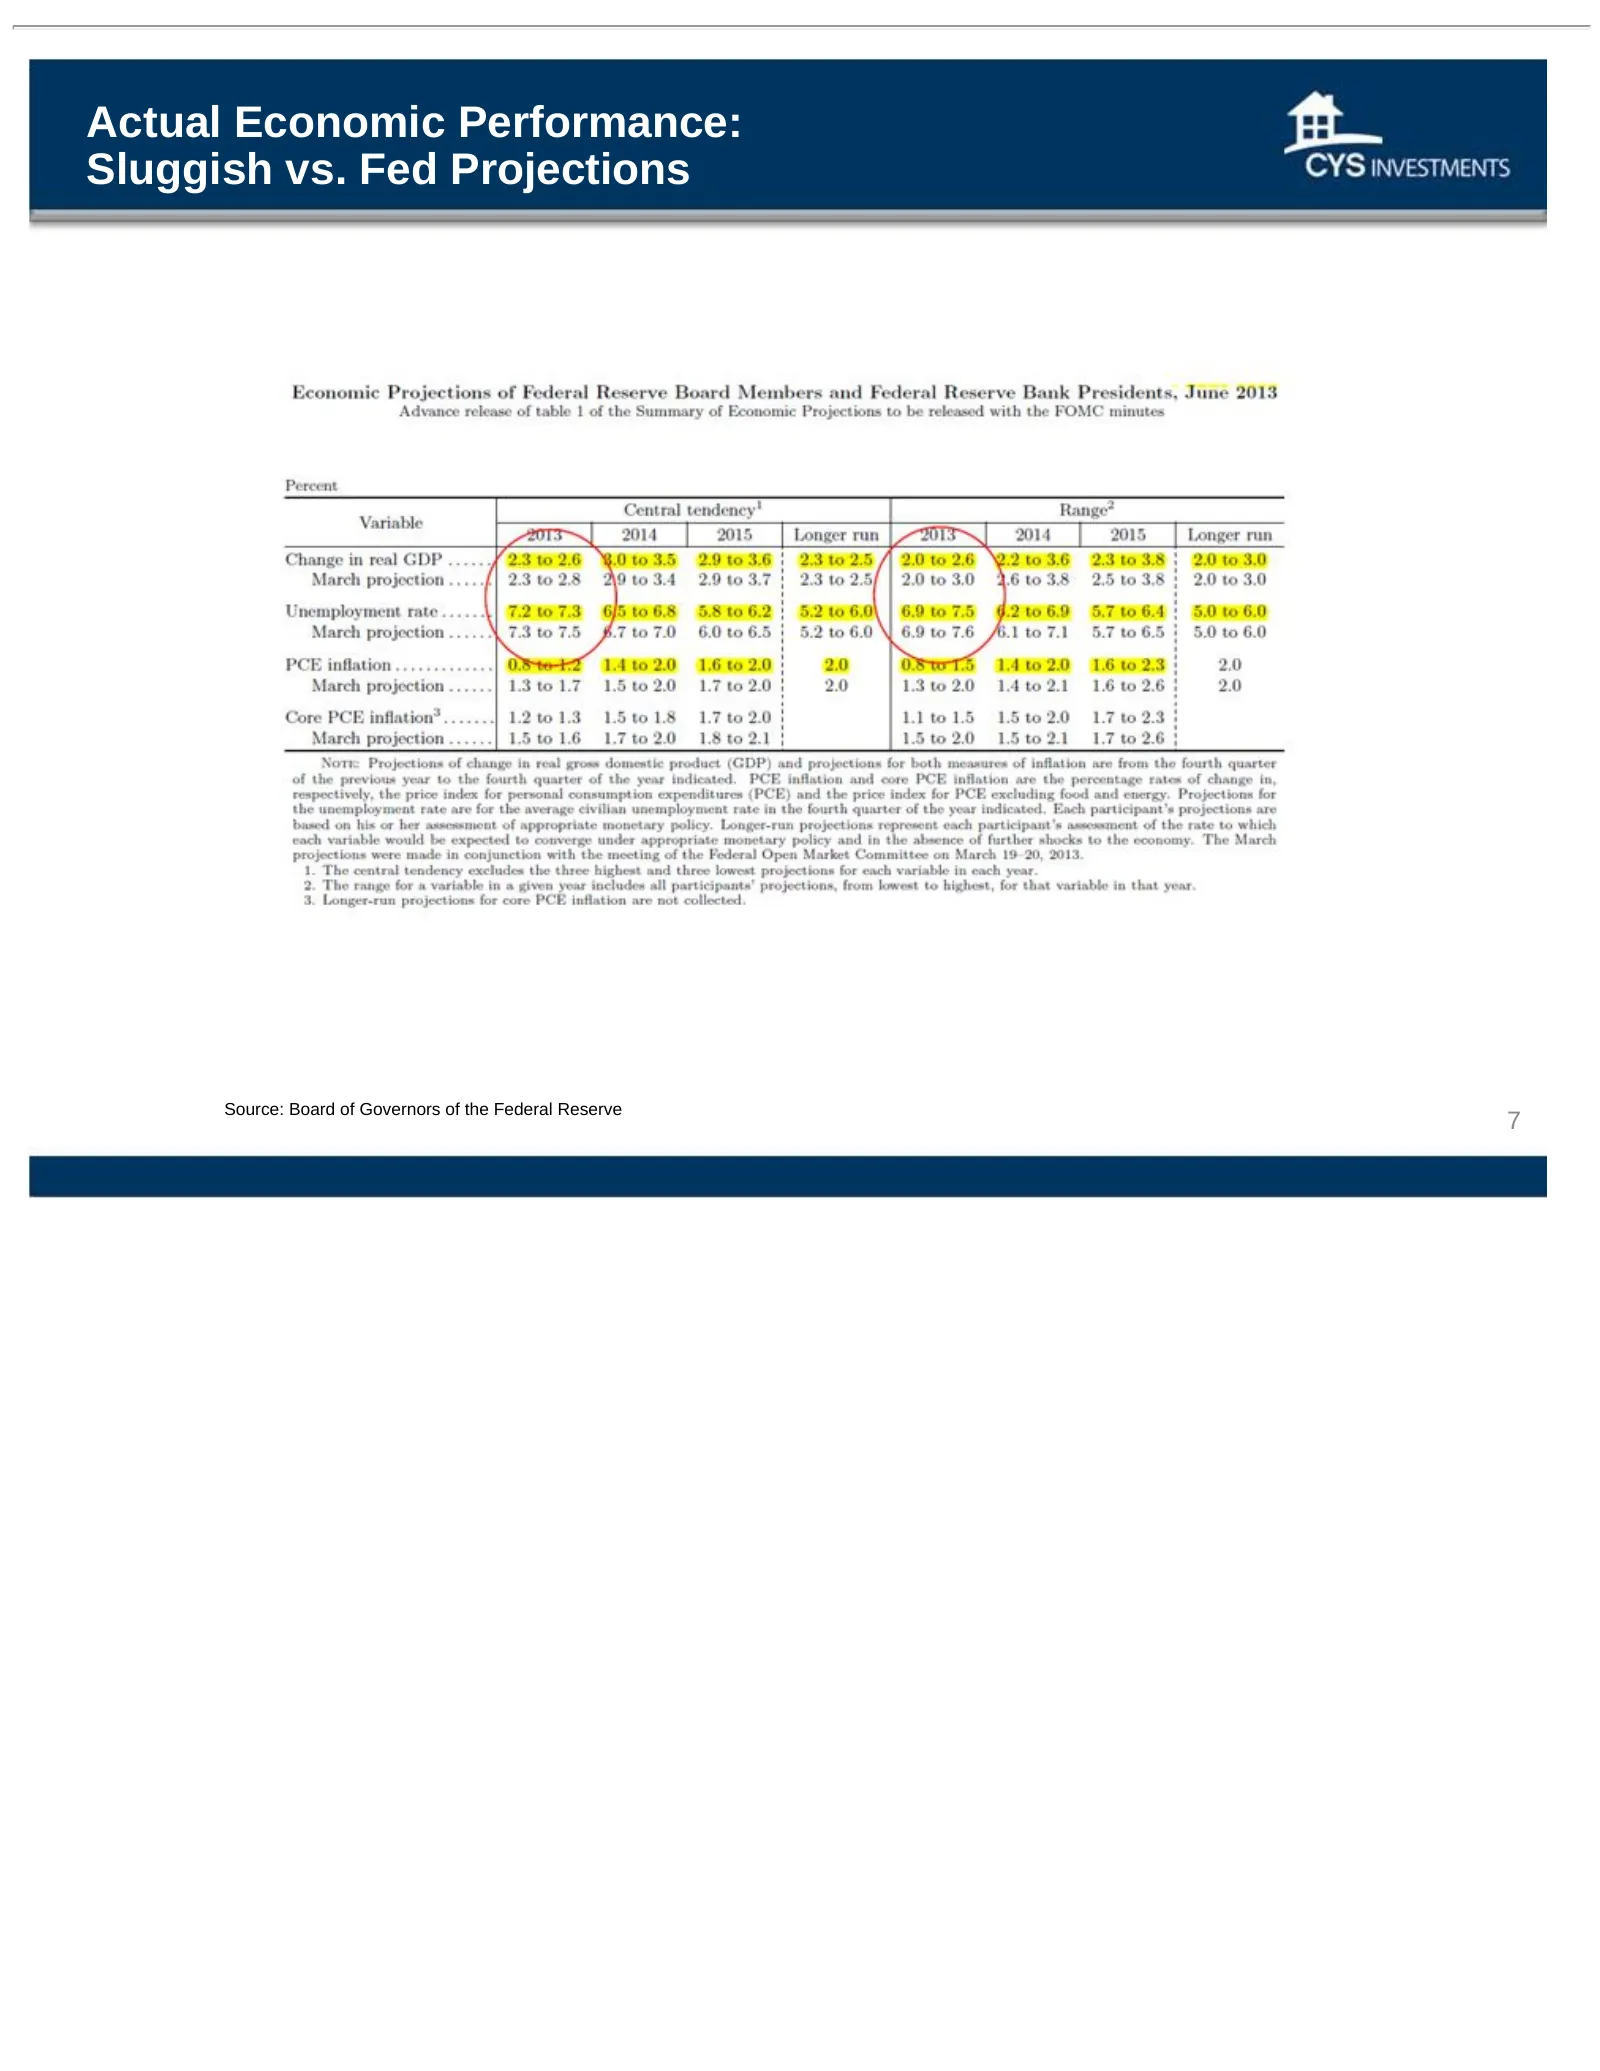
Actual Economic Performance: Sluggish vs. Fed Projections Source: Board of Governors of the Federal Reserve 7
Slide 8: Transition to a Normalized Yield Curve: Will the Fed's Forecast Pan Out?
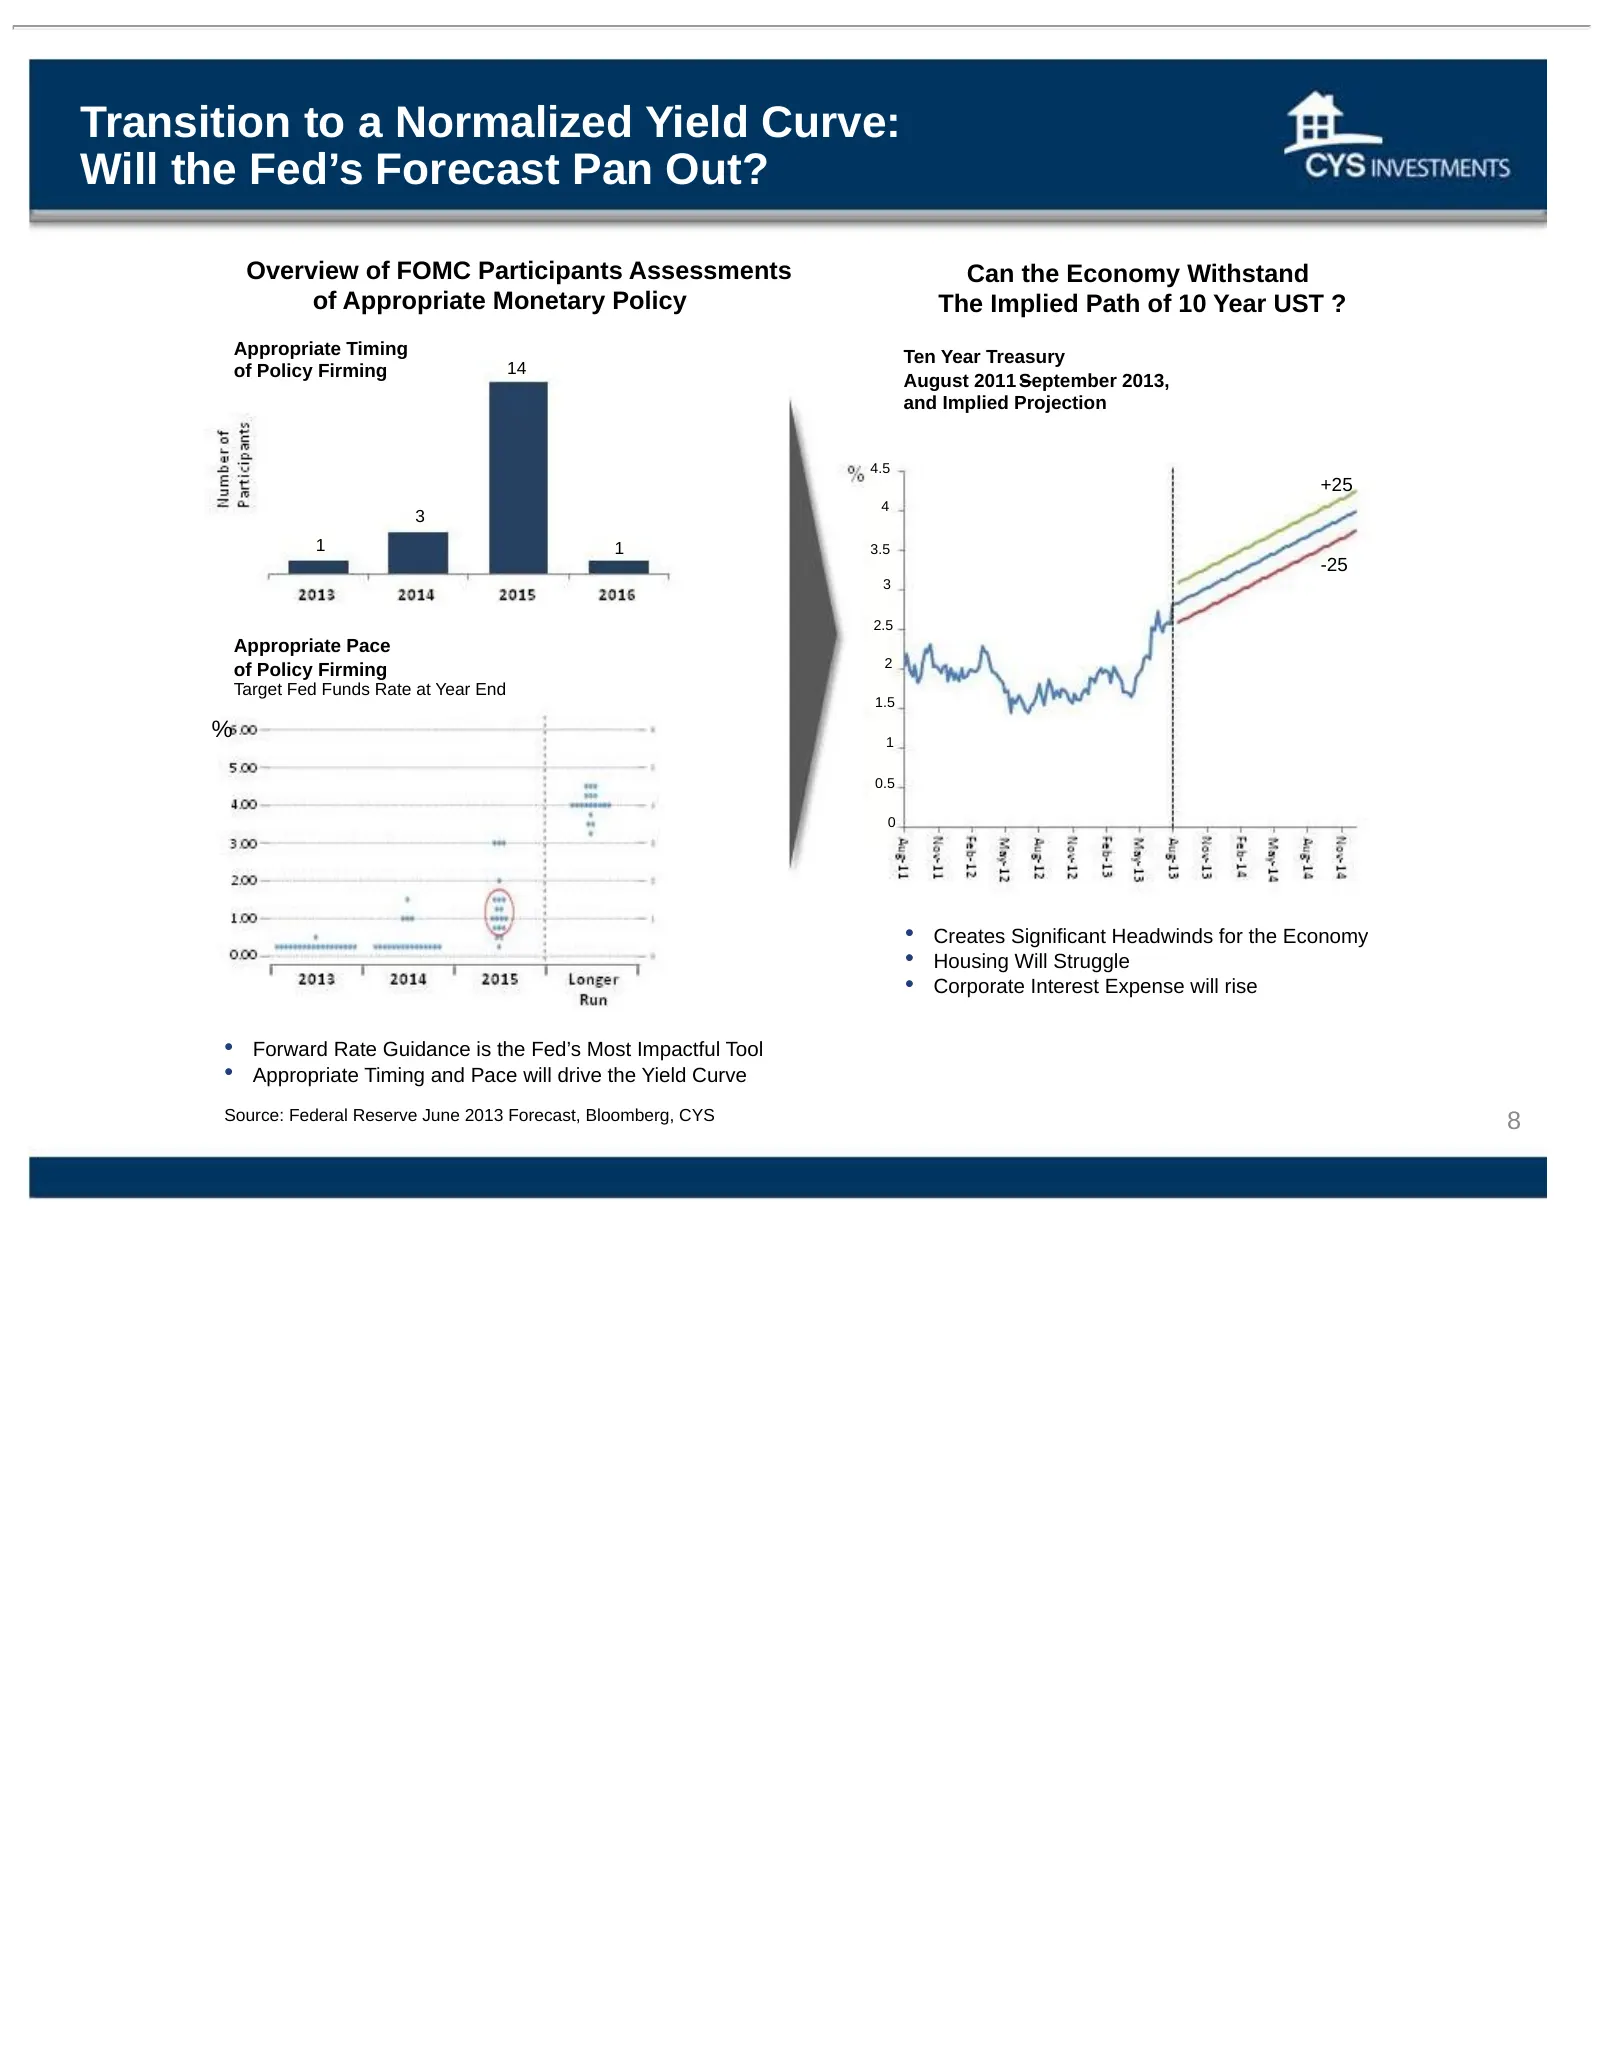
Transition to a Normalized Yield Curve: Will the Fed’s Forecast Pan Out? Overview of FOMC Participants Assessments Can the Economy Withstand of Appropriate Monetary Policy The Implied Path of 10 Year UST ? Appropriate Timing Ten Year Treasury of Policy Firming 14 August 2011 September – 2013, and Im
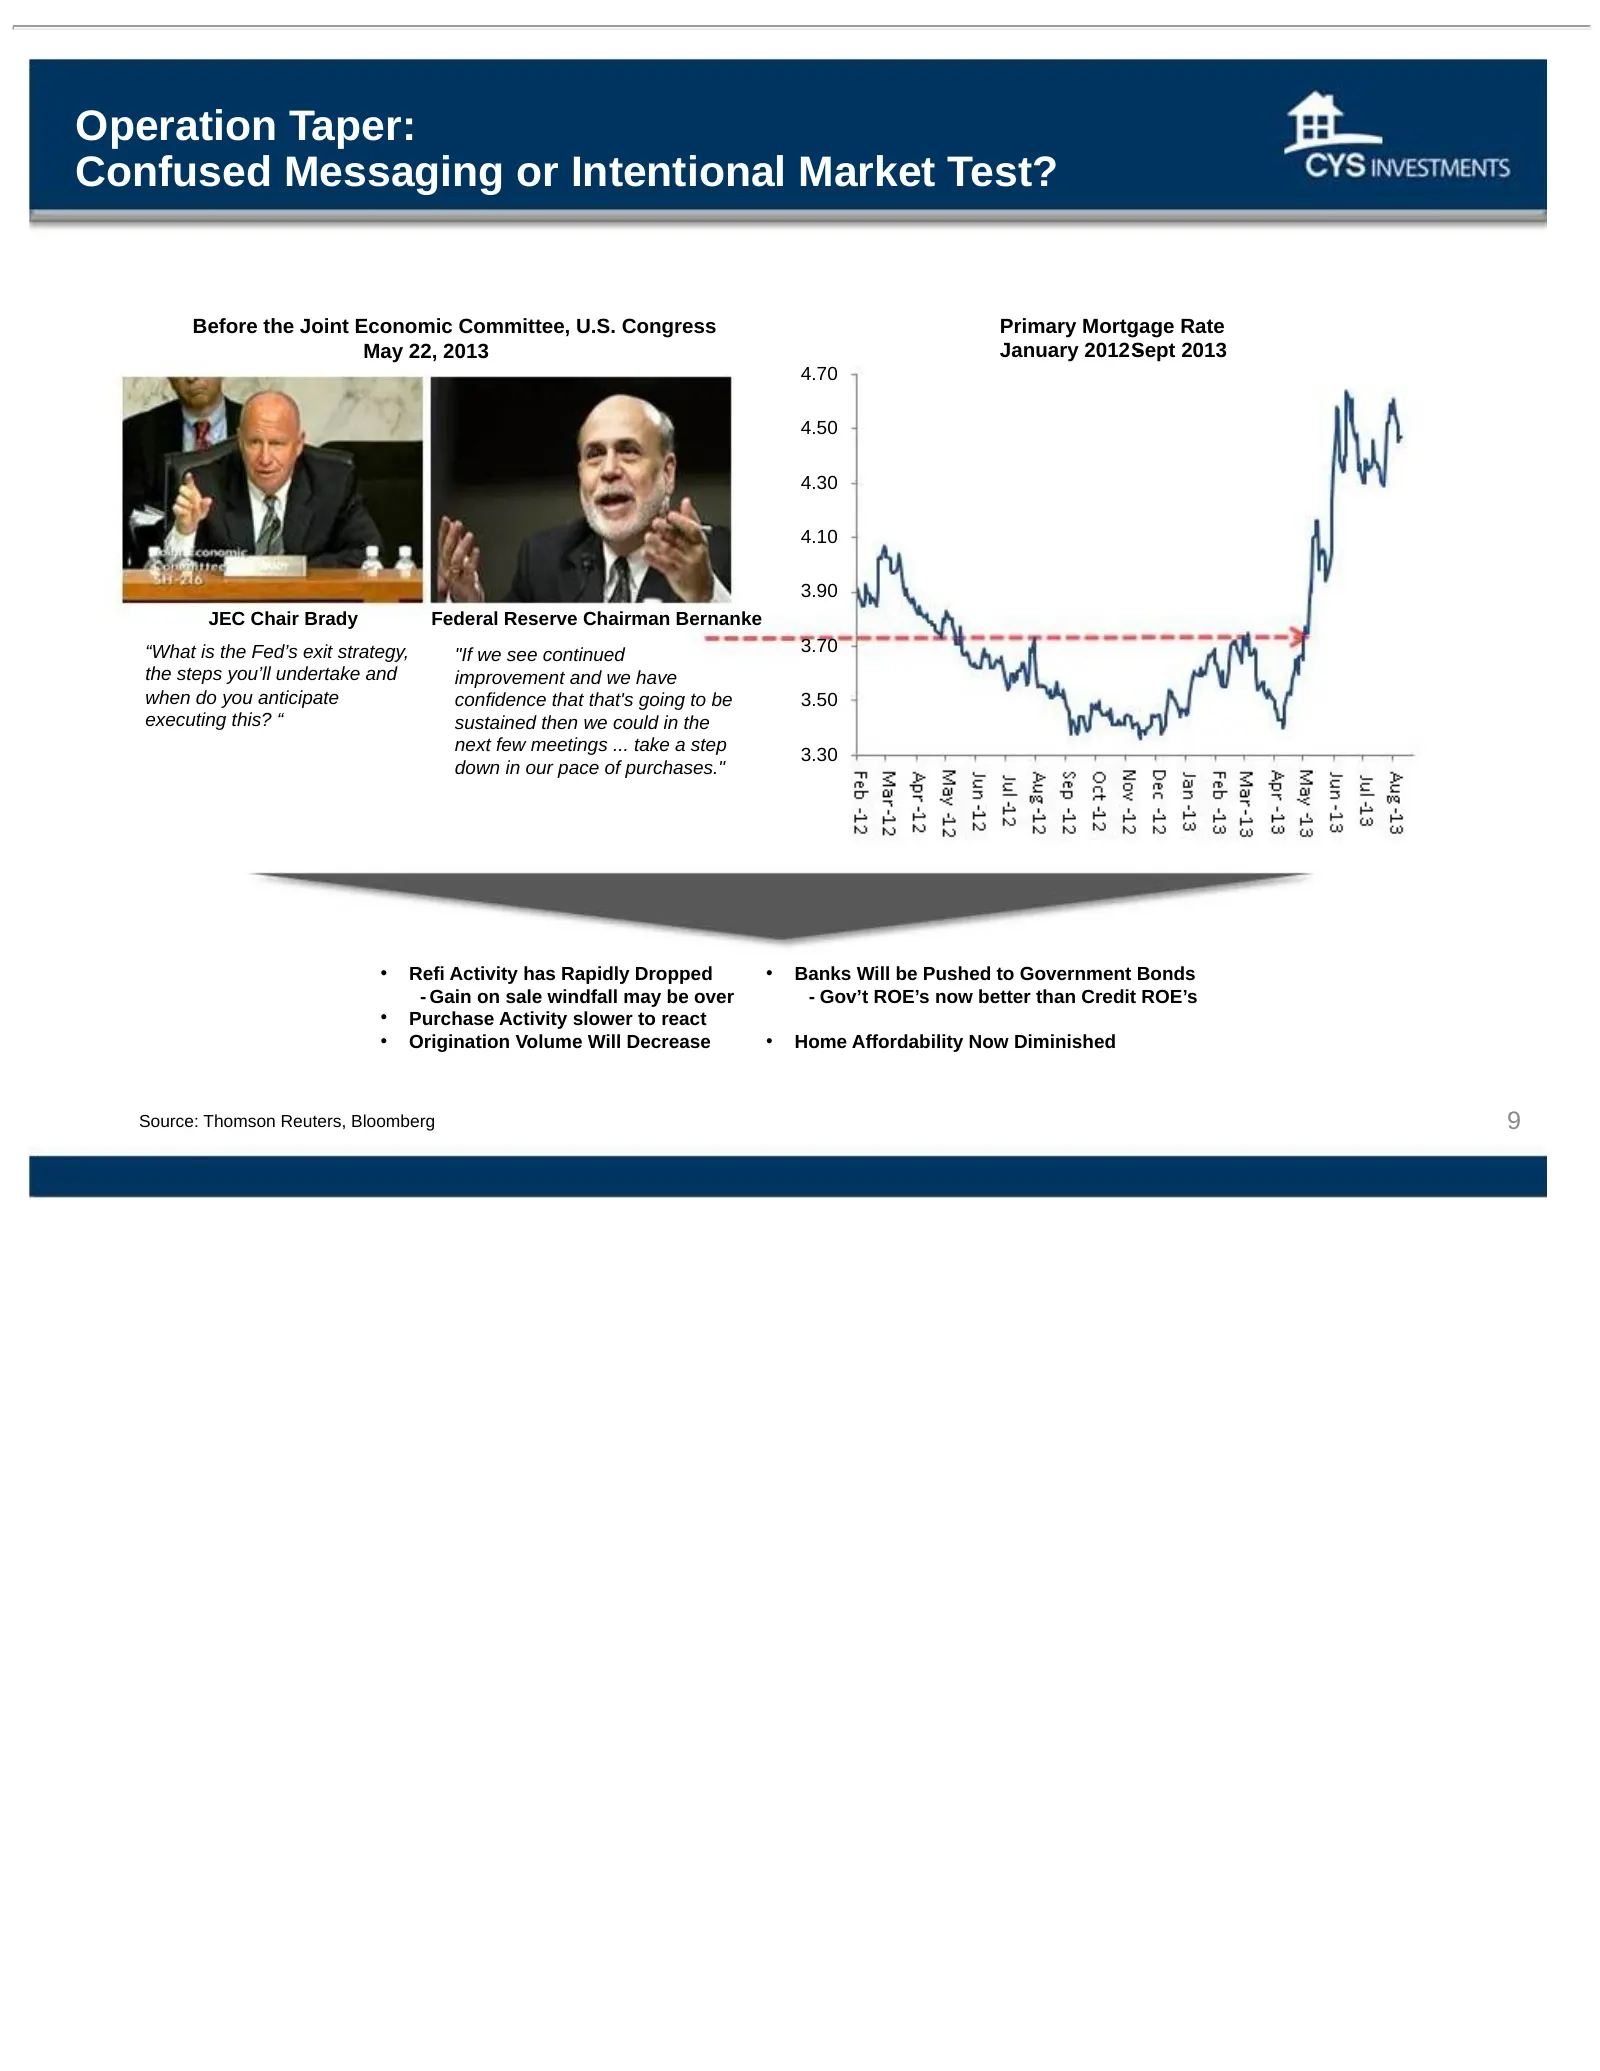
Slide 9: Operation Taper: Confused Messaging or Intentional Market Test?
Operation Taper: Confused Messaging or Intentional Market Test? Before the Joint Economic Committee, U.S. Congress Primary Mortgage Rate May 22, 2013 January 2012 Sept - 2013 4.70 4.50 4.30 4.10 3.90 JEC Chair Brady Federal Reserve Chairman Bernanke “What is the Fed’s exit strategy, "If we see conti
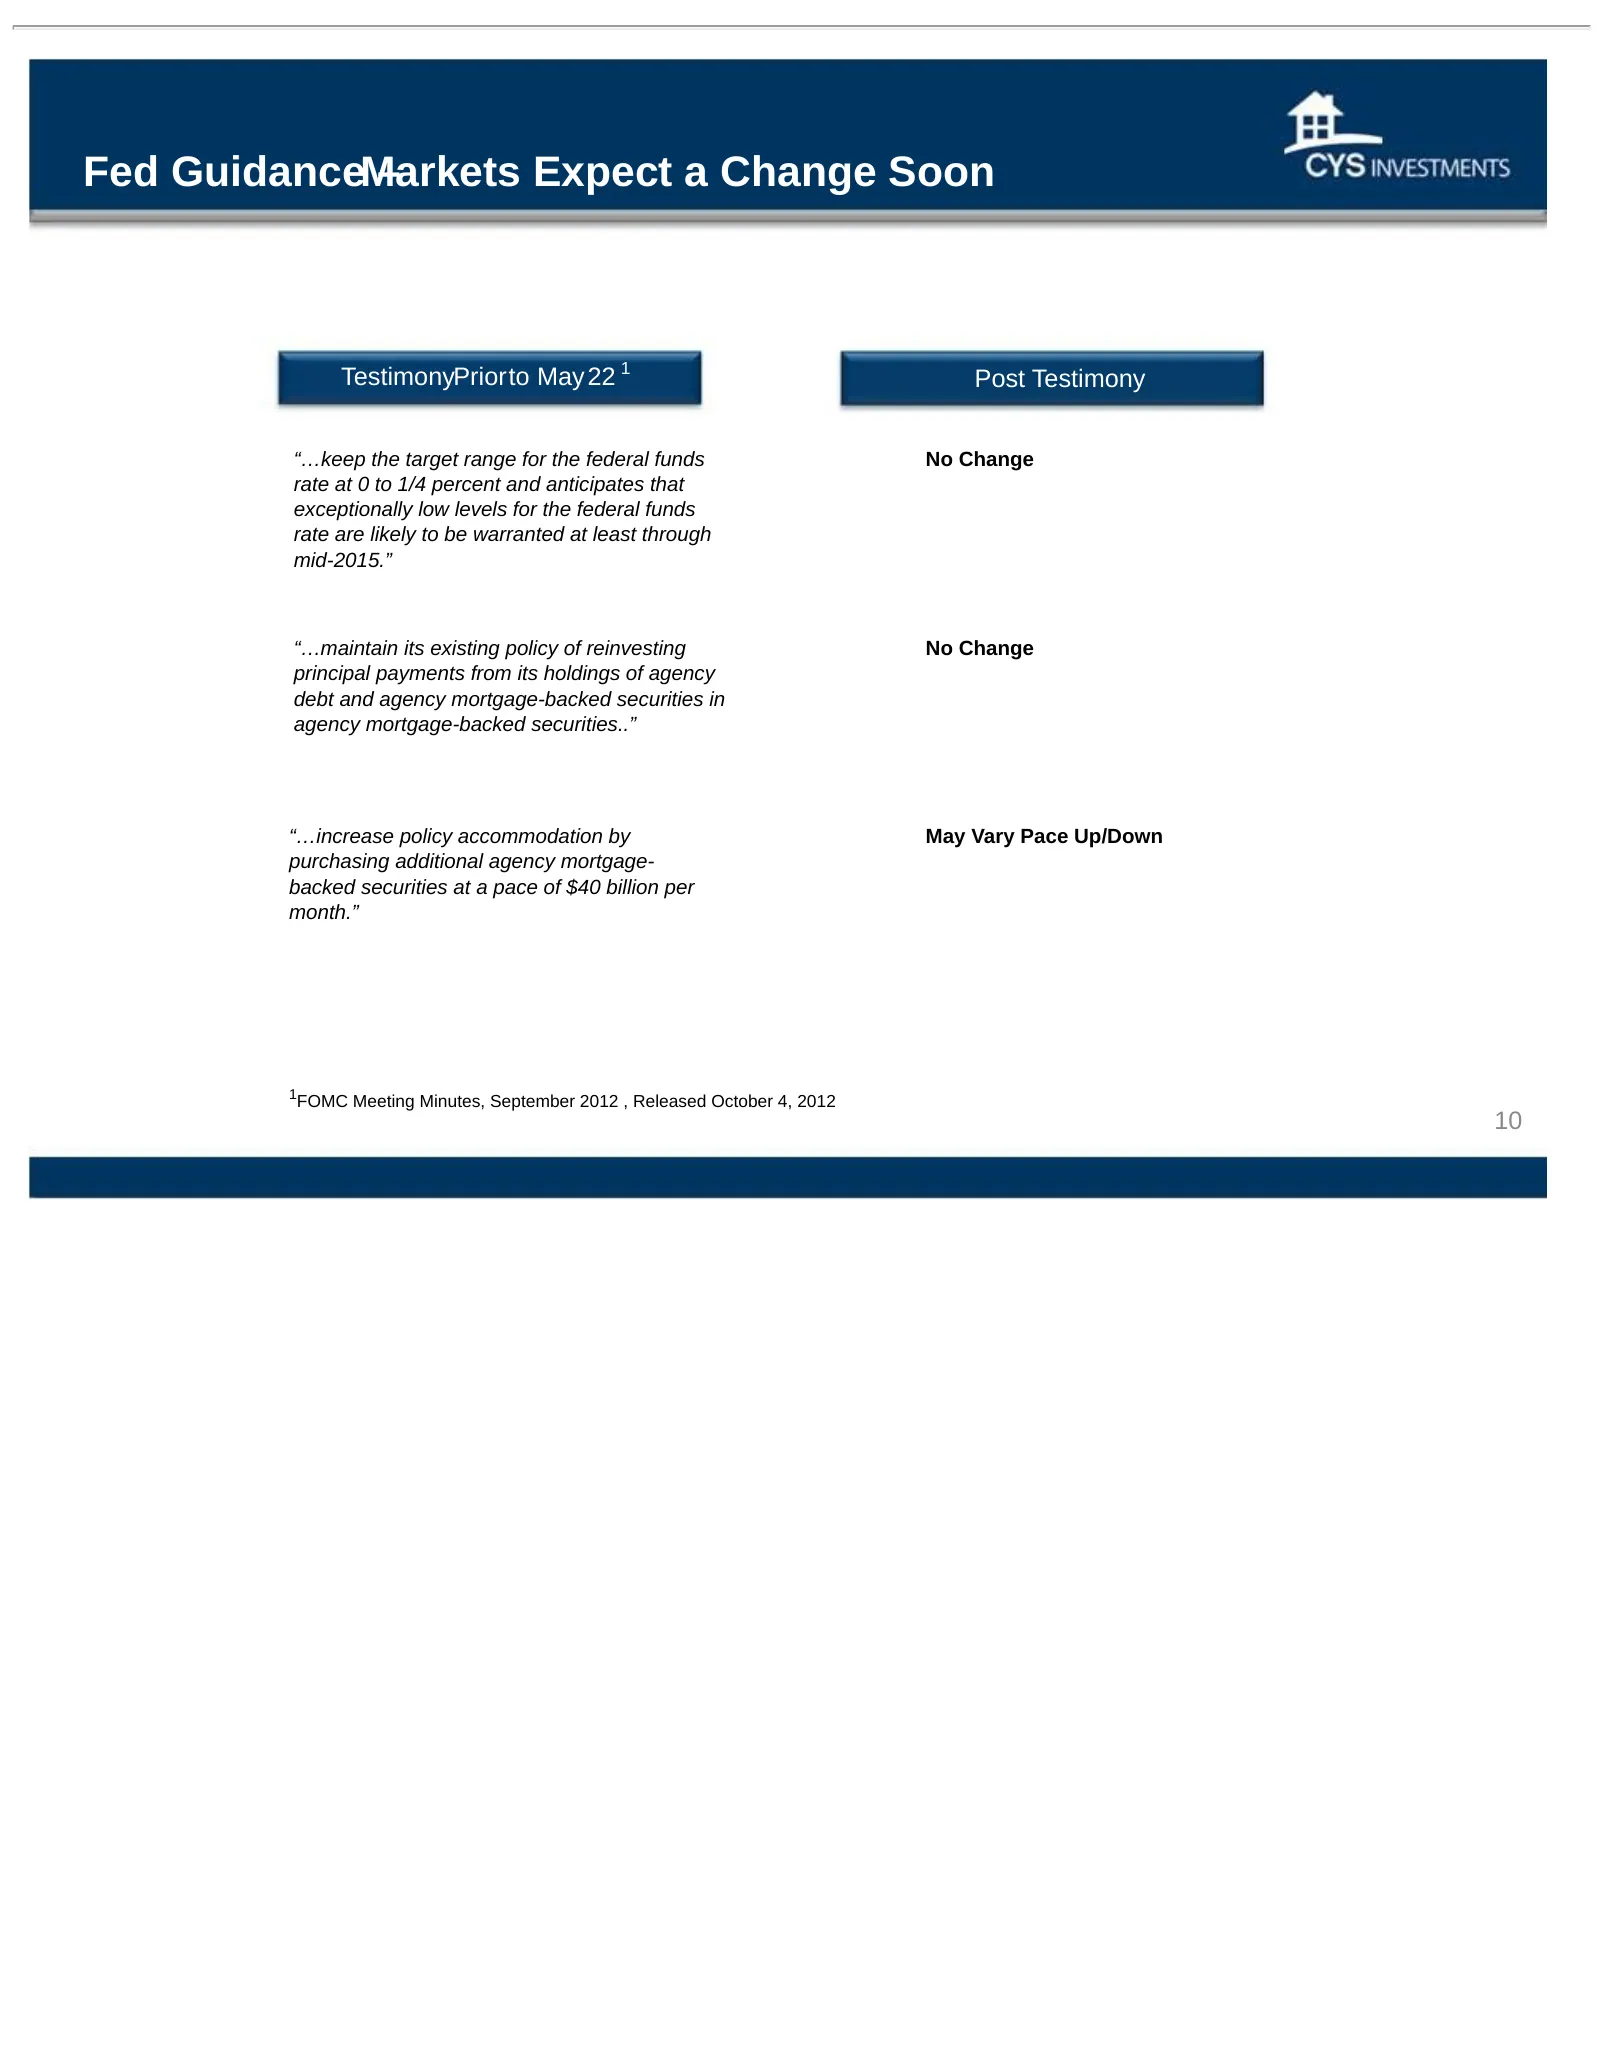
Slide 10: Fed Guidance Markets Expect a Change Soon
Fed GuidanceMarkets – Expect a Change Soon TestimonyPriorto May 22 1 Post Testimony “…keep the target range for the federal funds No Change rate at 0 to 1/4 percent and anticipates that exceptionally low levels for the federal funds rate are likely to be warranted at least through mid-2015.” “…maint
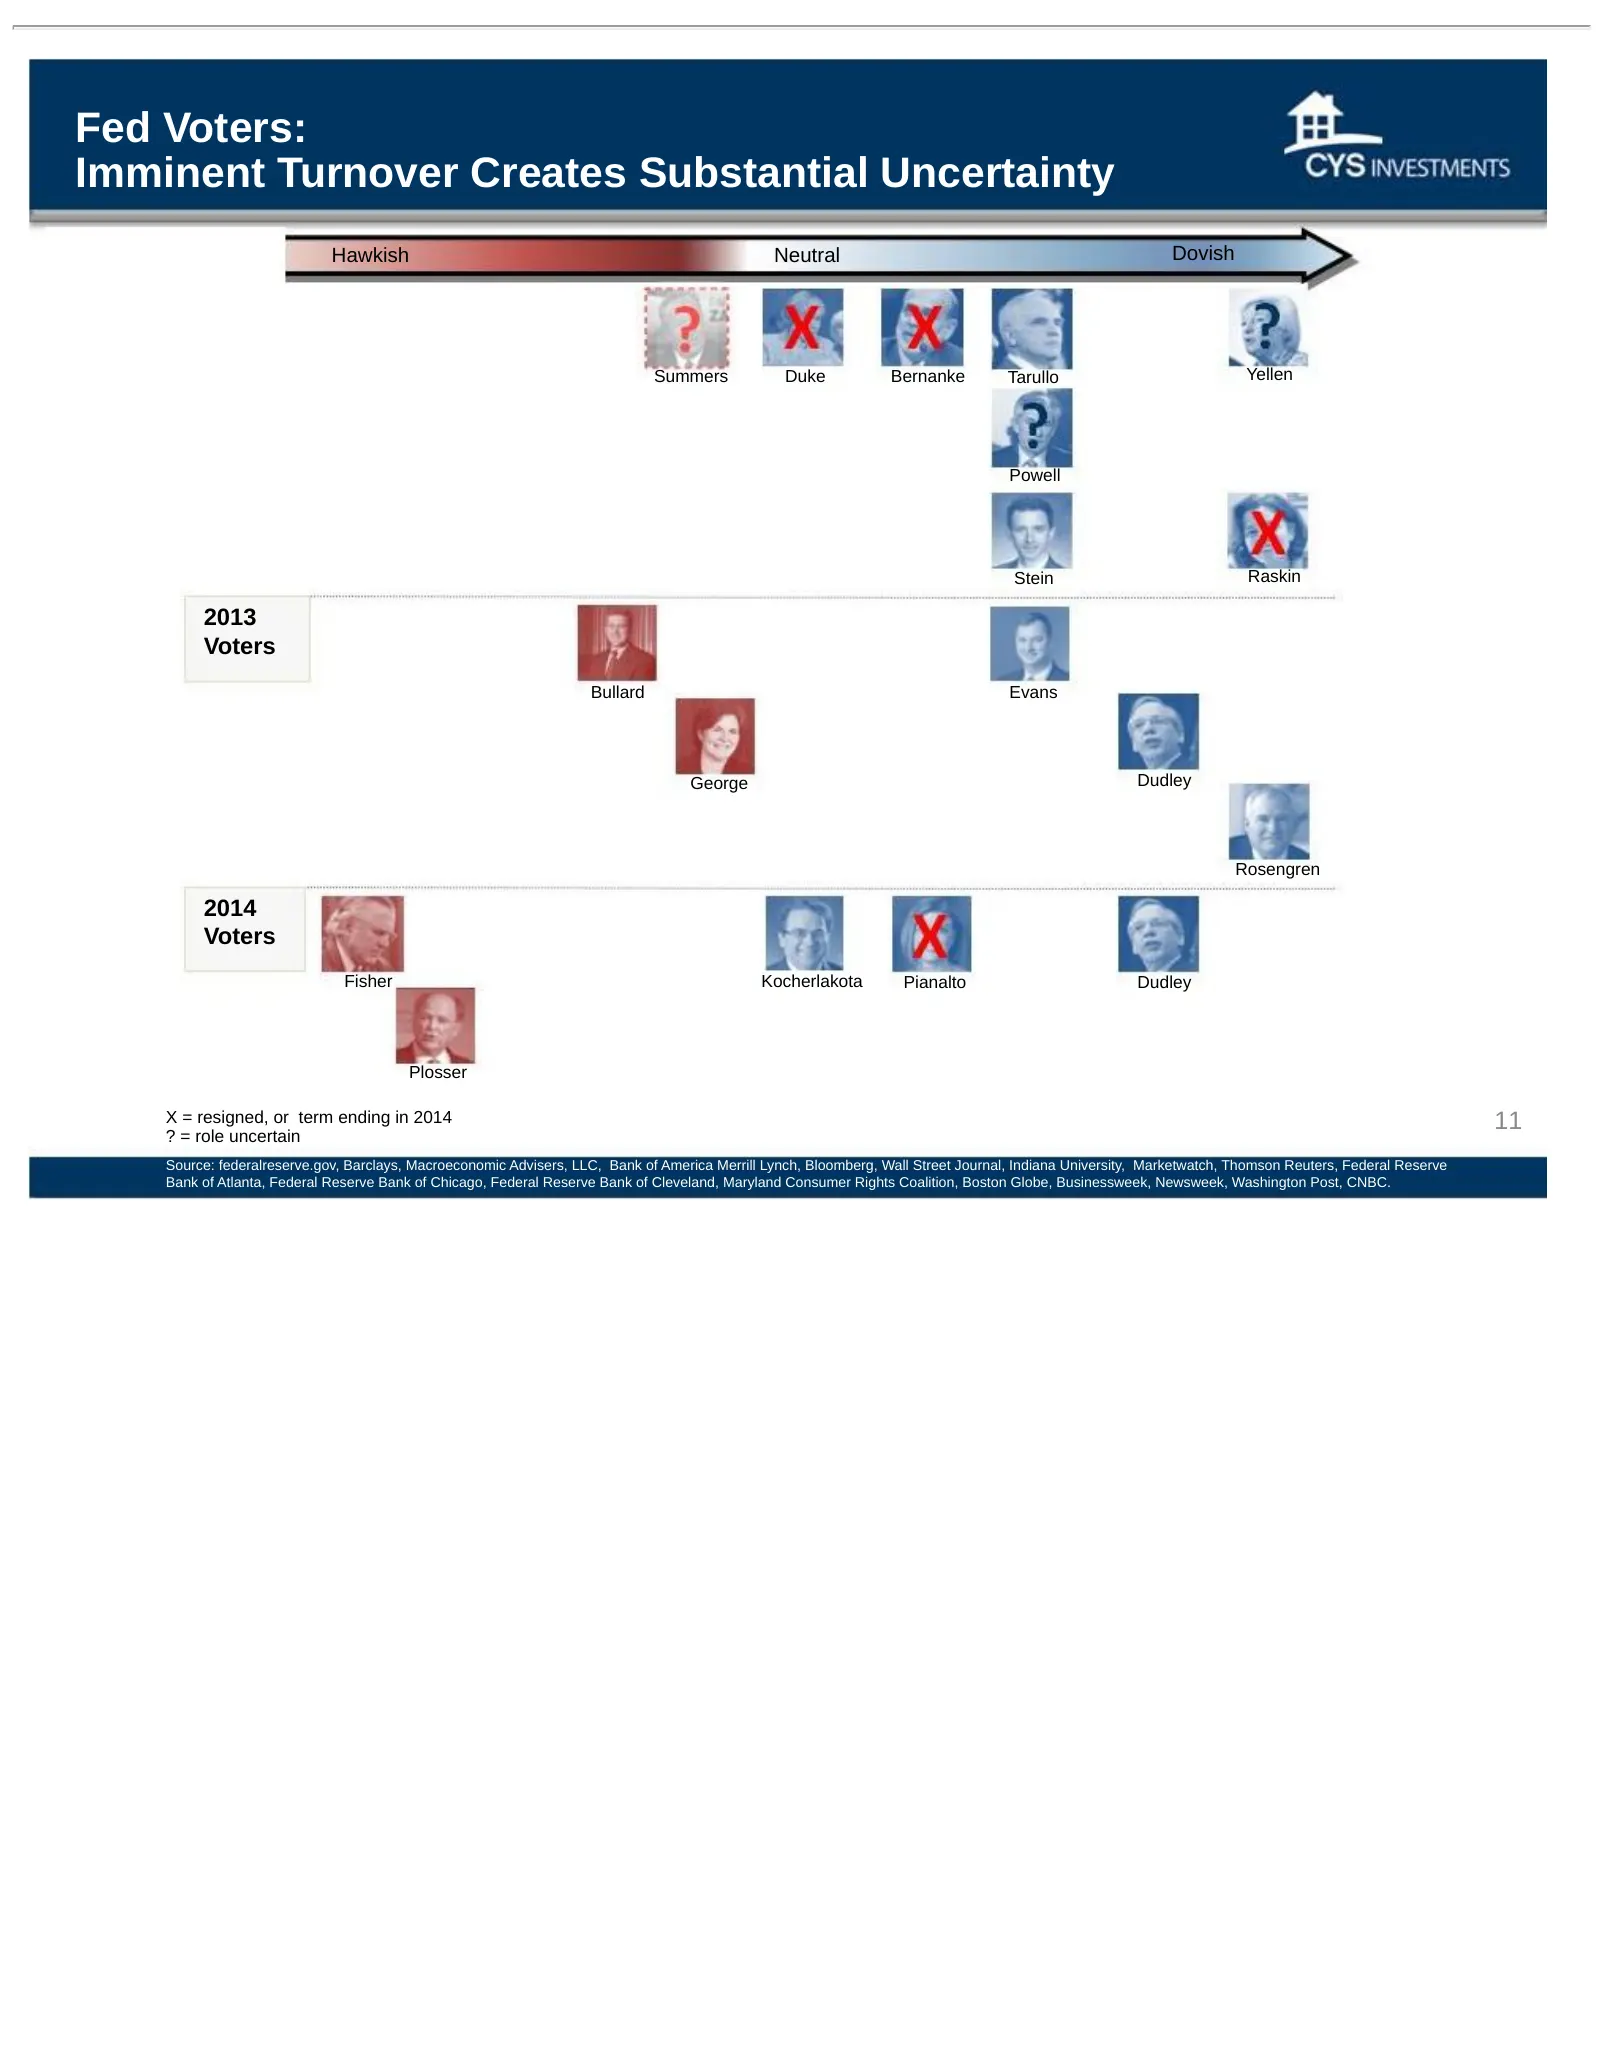
Slide 11: Fed Voters: Imminent Turnover Creates Substantial Uncertainty
Fed Voters: Imminent Turnover Creates Substantial Uncertainty Hawkish Neutral Dovish Summers Duke Bernanke Tarullo Yellen Powell Stein Raskin 2013 Voters Bullard Evans George Dudley Rosengren 2014 Voters Fisher Kocherlakota Pianalto Dudley Plosser X = resigned, or term ending in 2014 ? = role uncert
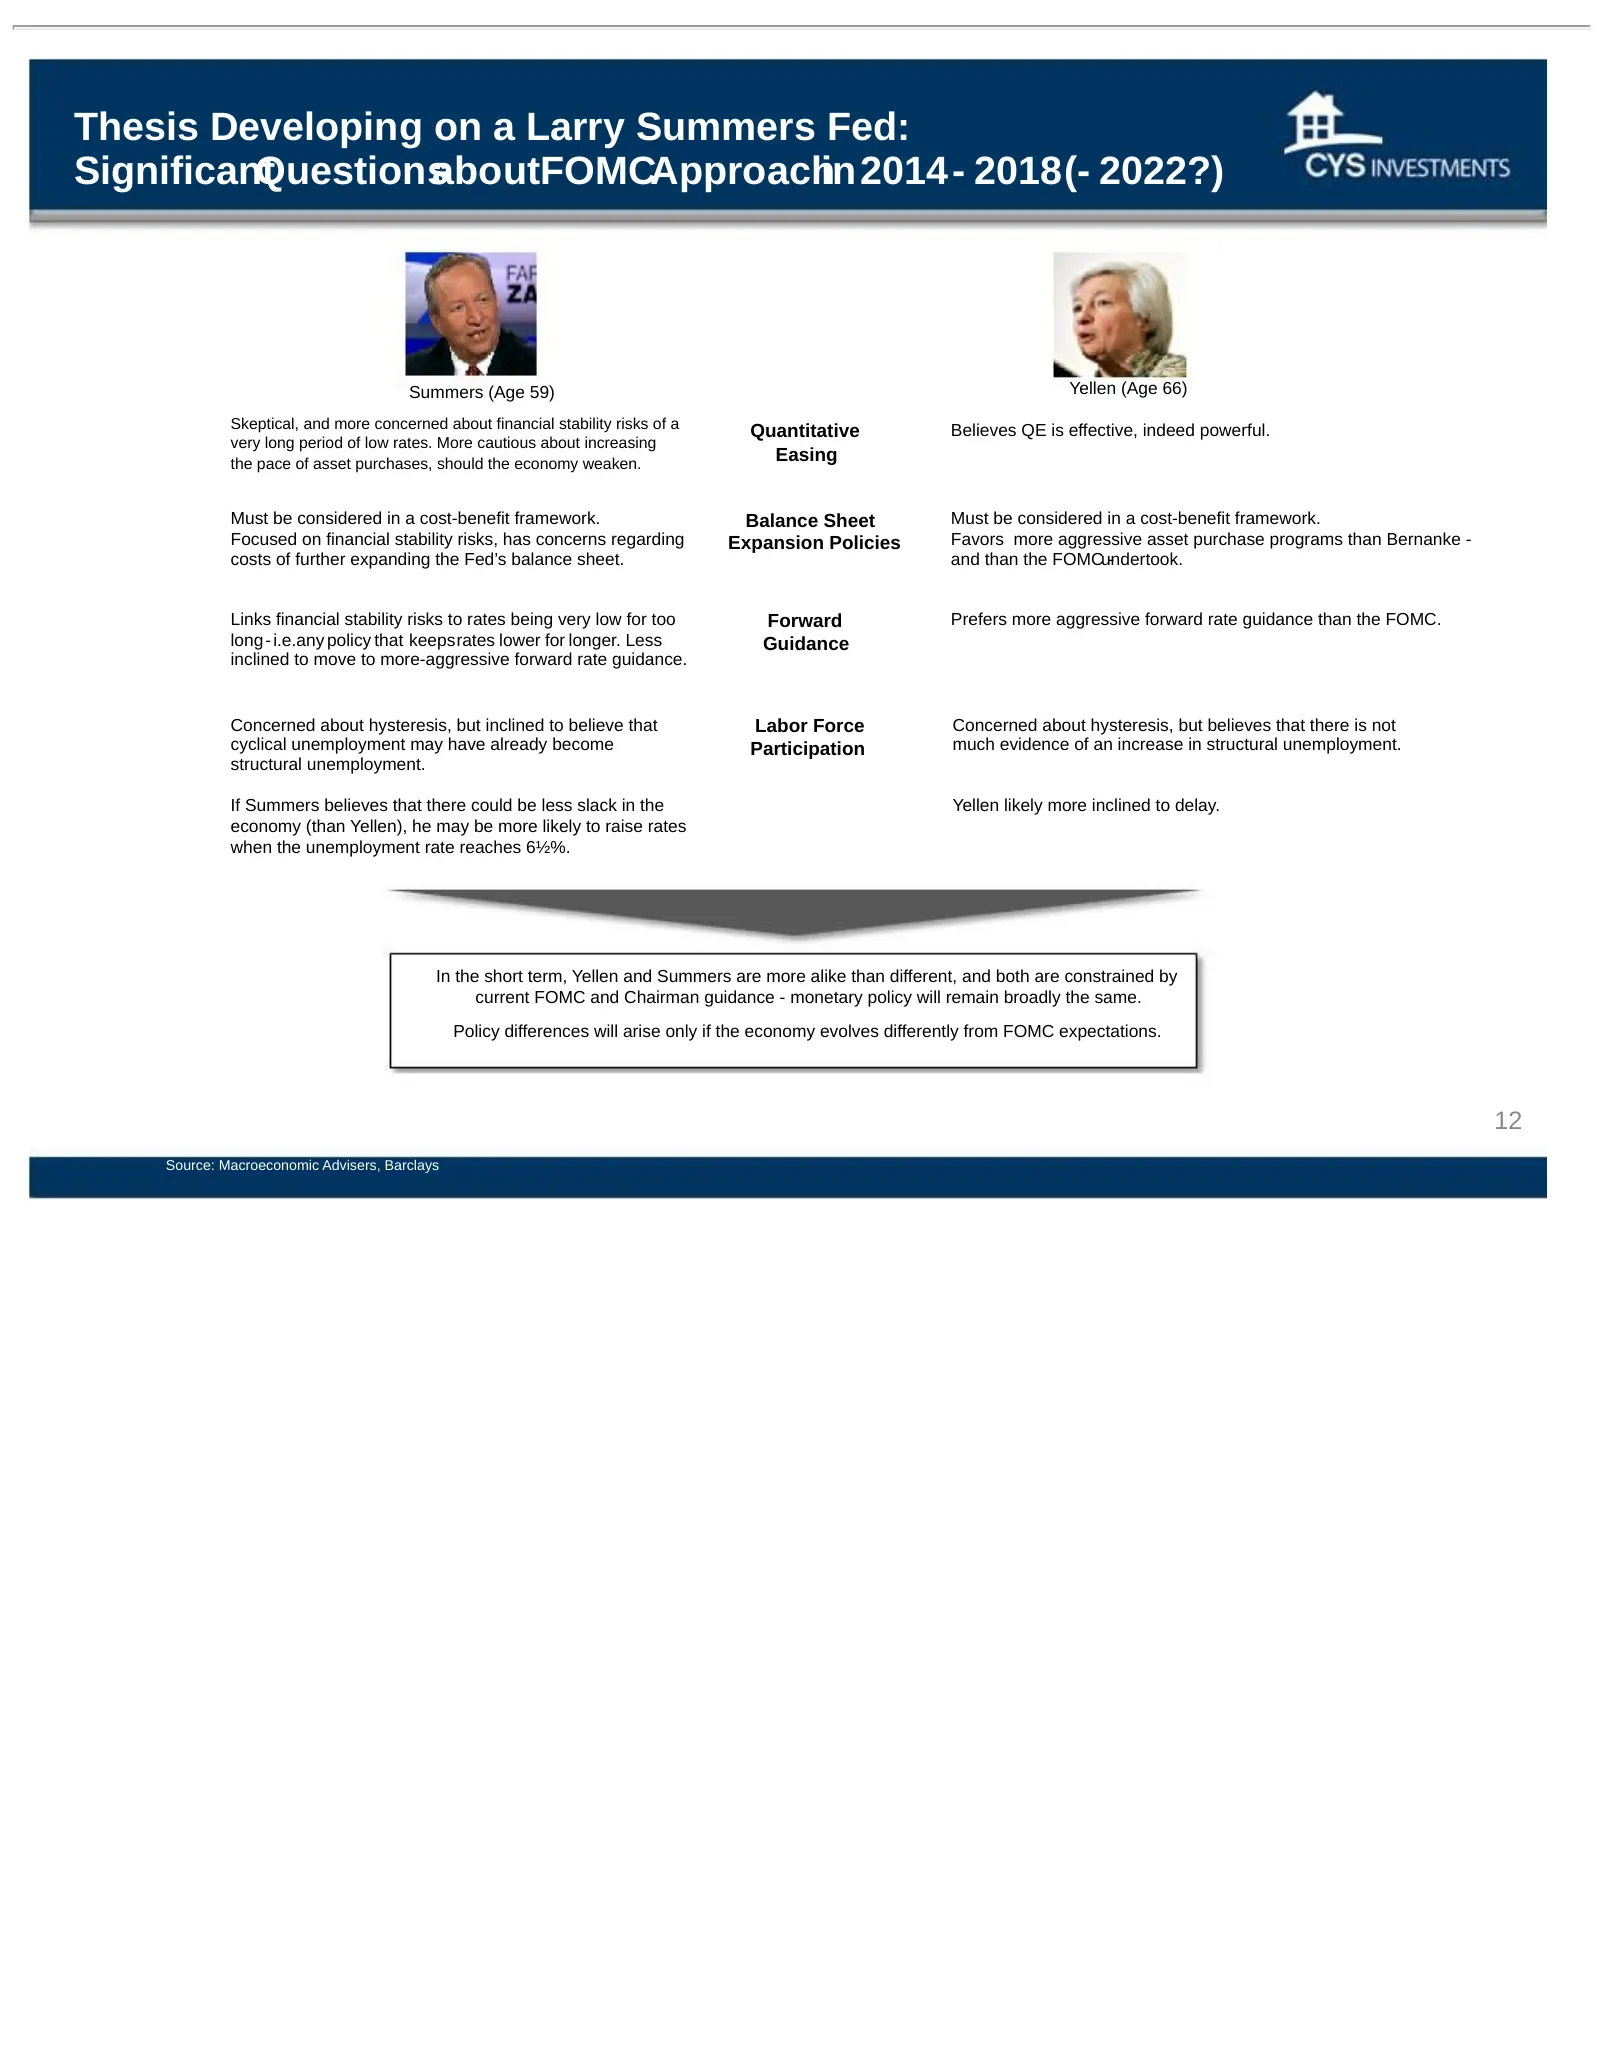
Slide 12: Thesis Developing on a Larry Summers Fed
Thesis Developing on a Larry Summers Fed: Significant QuestionsaboutFOMCApproachin 2014- 2018(- 2022?) Summers (Age 59) Yellen (Age 66) Skeptical, and more concerned about financial stability risks of a Quantitative Believes QE is effective, indeed powerful. very long period of low rates. More cauti
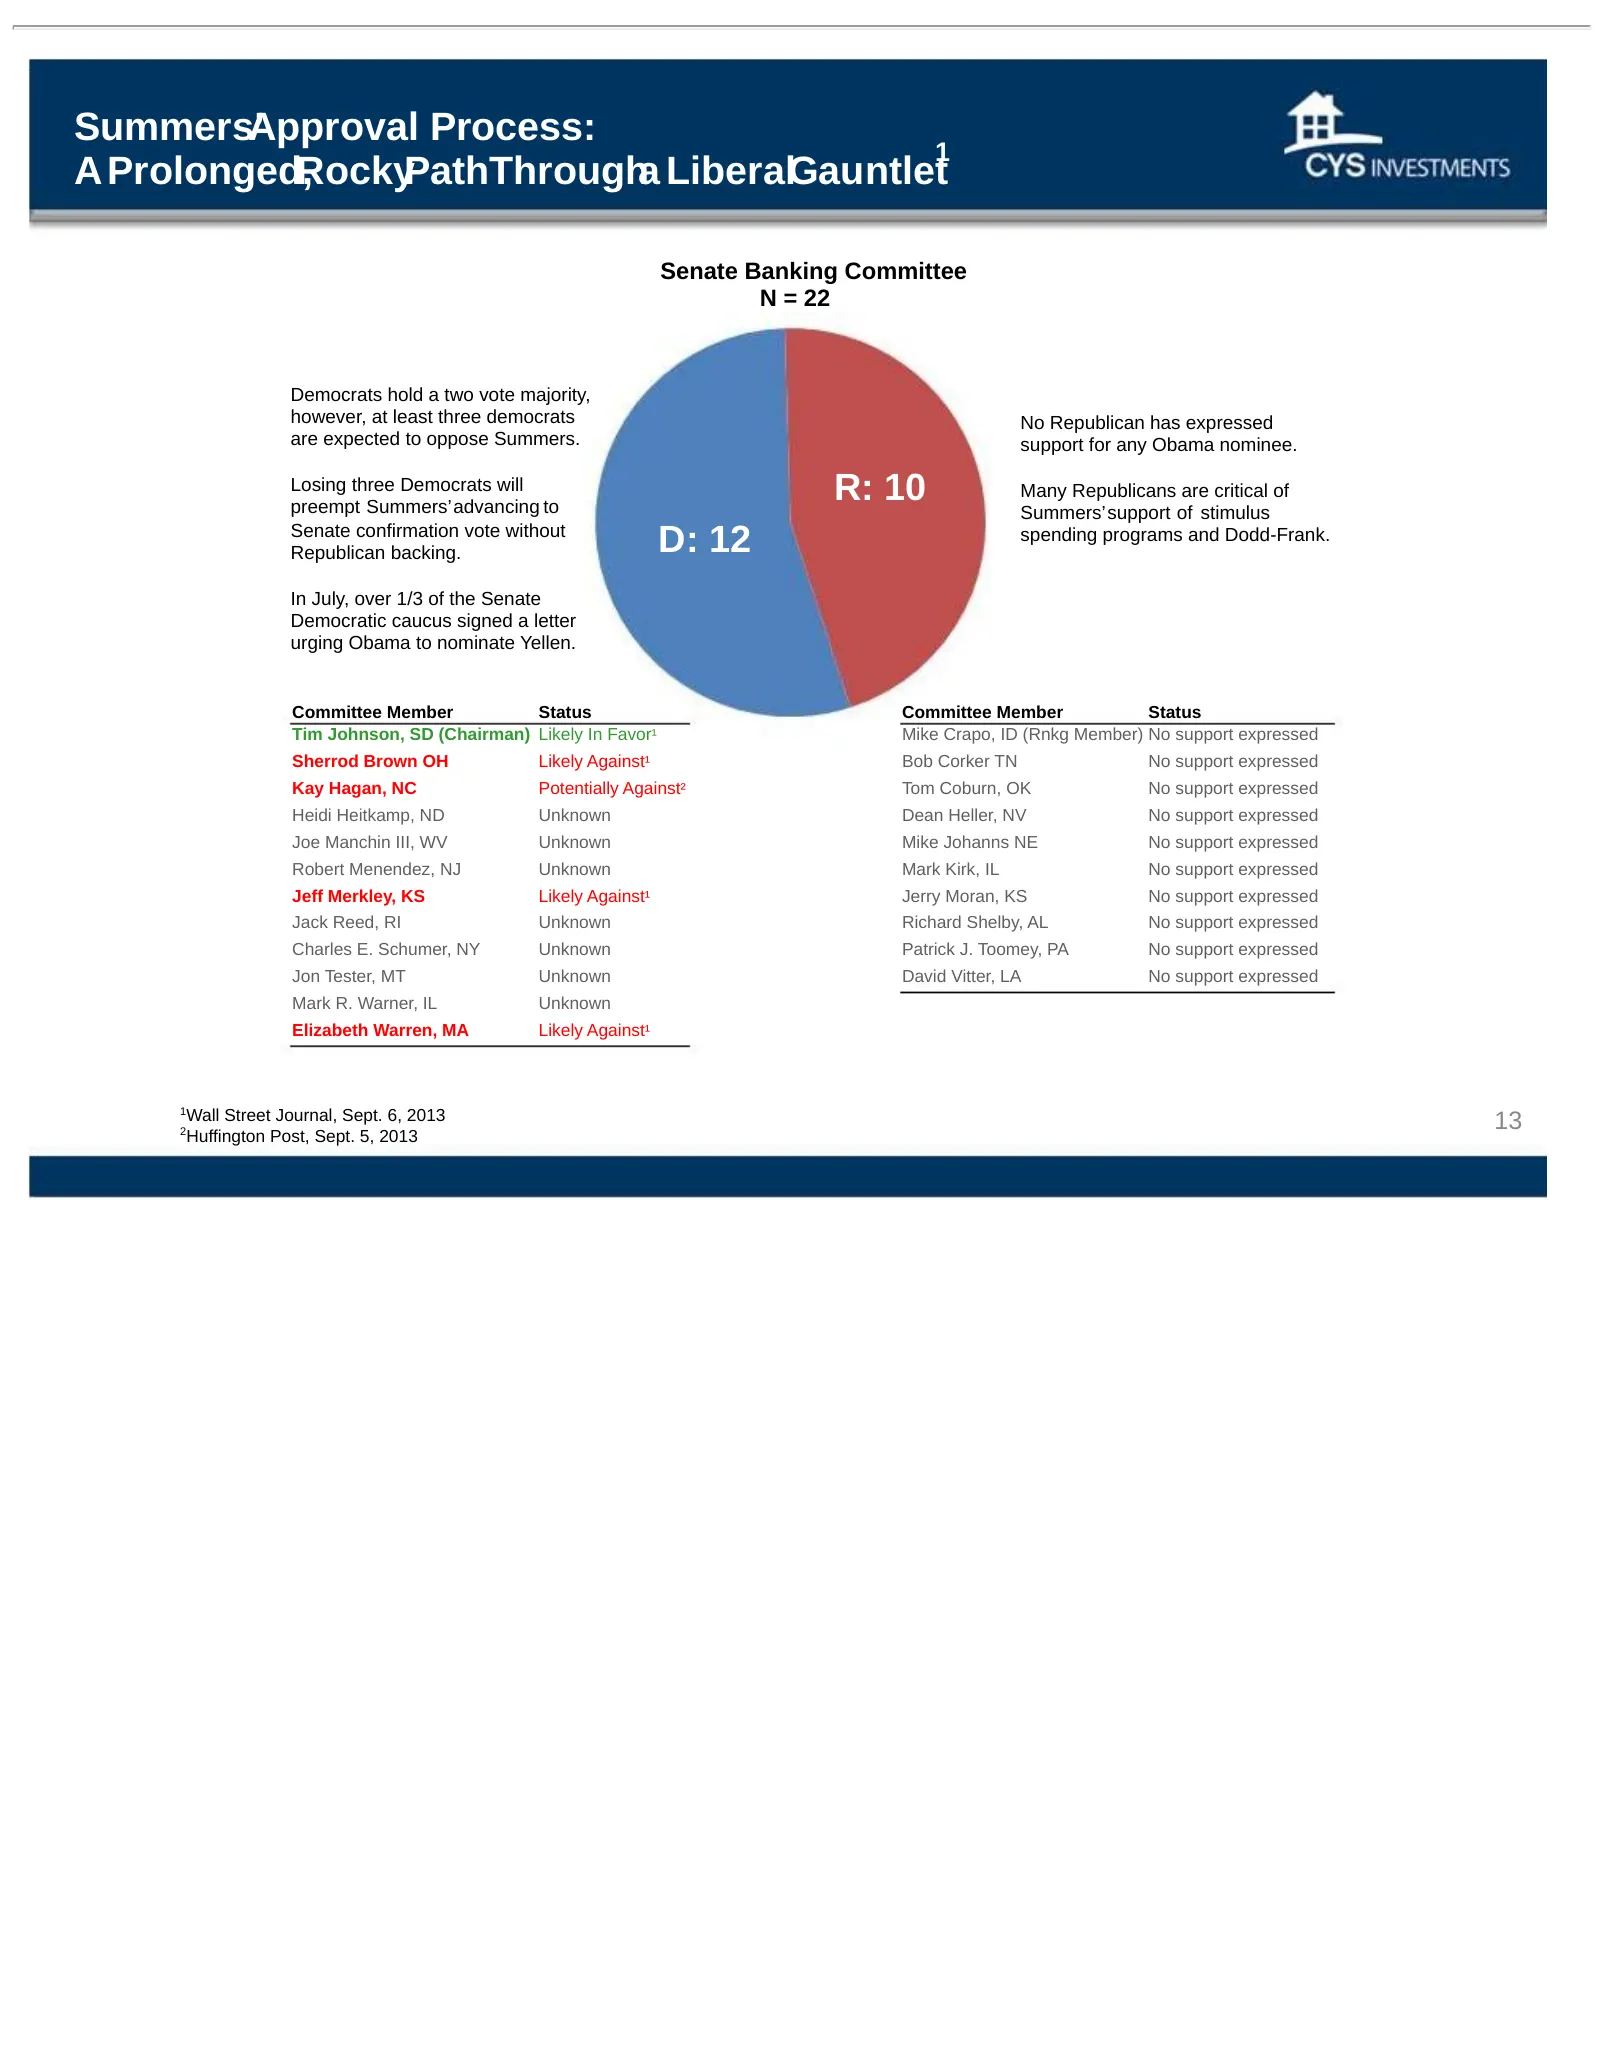
Slide 13: Summers' Approval Process: A Prolonged, Rocky Path
Summers’Approval Process: 1 A Prolonged,RockyPathThrougha LiberalGauntlet Senate Banking Committee N = 22 Democrats hold a two vote majority, however, at least three democrats No Republican has expressed are expected to oppose Summers. support for any Obama nominee. Losing three Democrats will preem
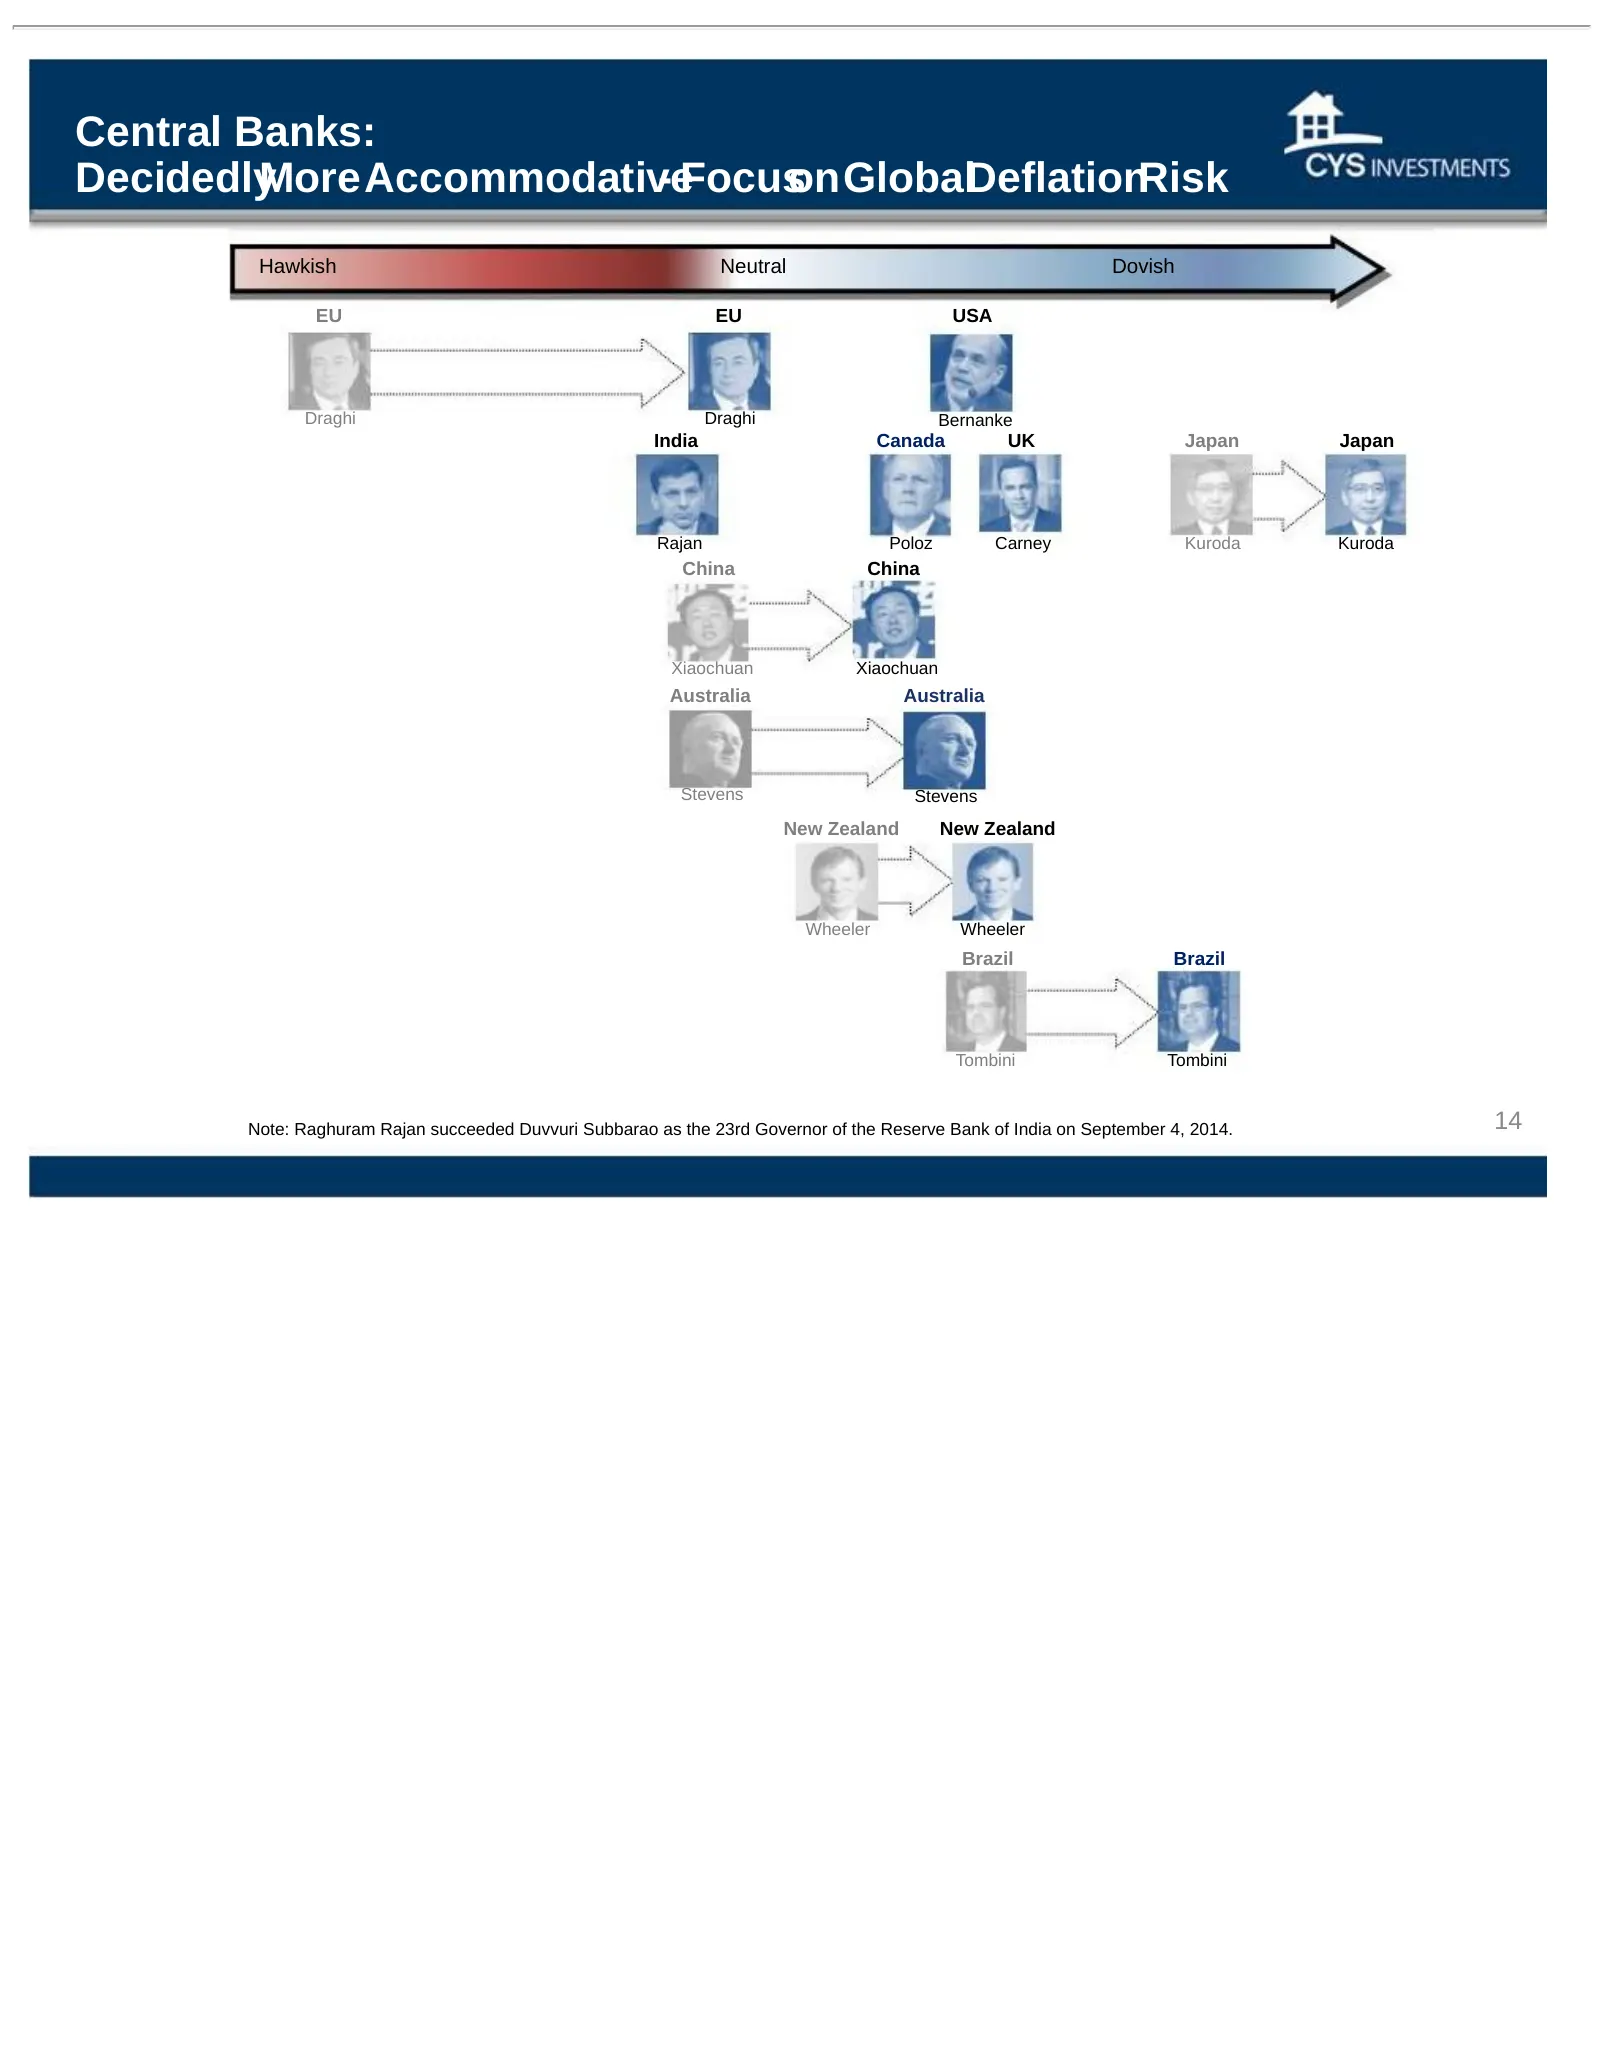
Slide 14: Central Banks: Decidedly More Accommodative
Central Banks: DecidedlyMoreAccommodative - FocusonGlobalDeflationRisk Hawkish Neutral Dovish EU EU USA Draghi Draghi Bernanke India Canada UK Japan Japan Rajan Poloz Carney Kuroda Kuroda China China Xiaochuan Xiaochuan Australia Australia Stevens Stevens New Zealand New Zealand Wheeler Wheeler Braz
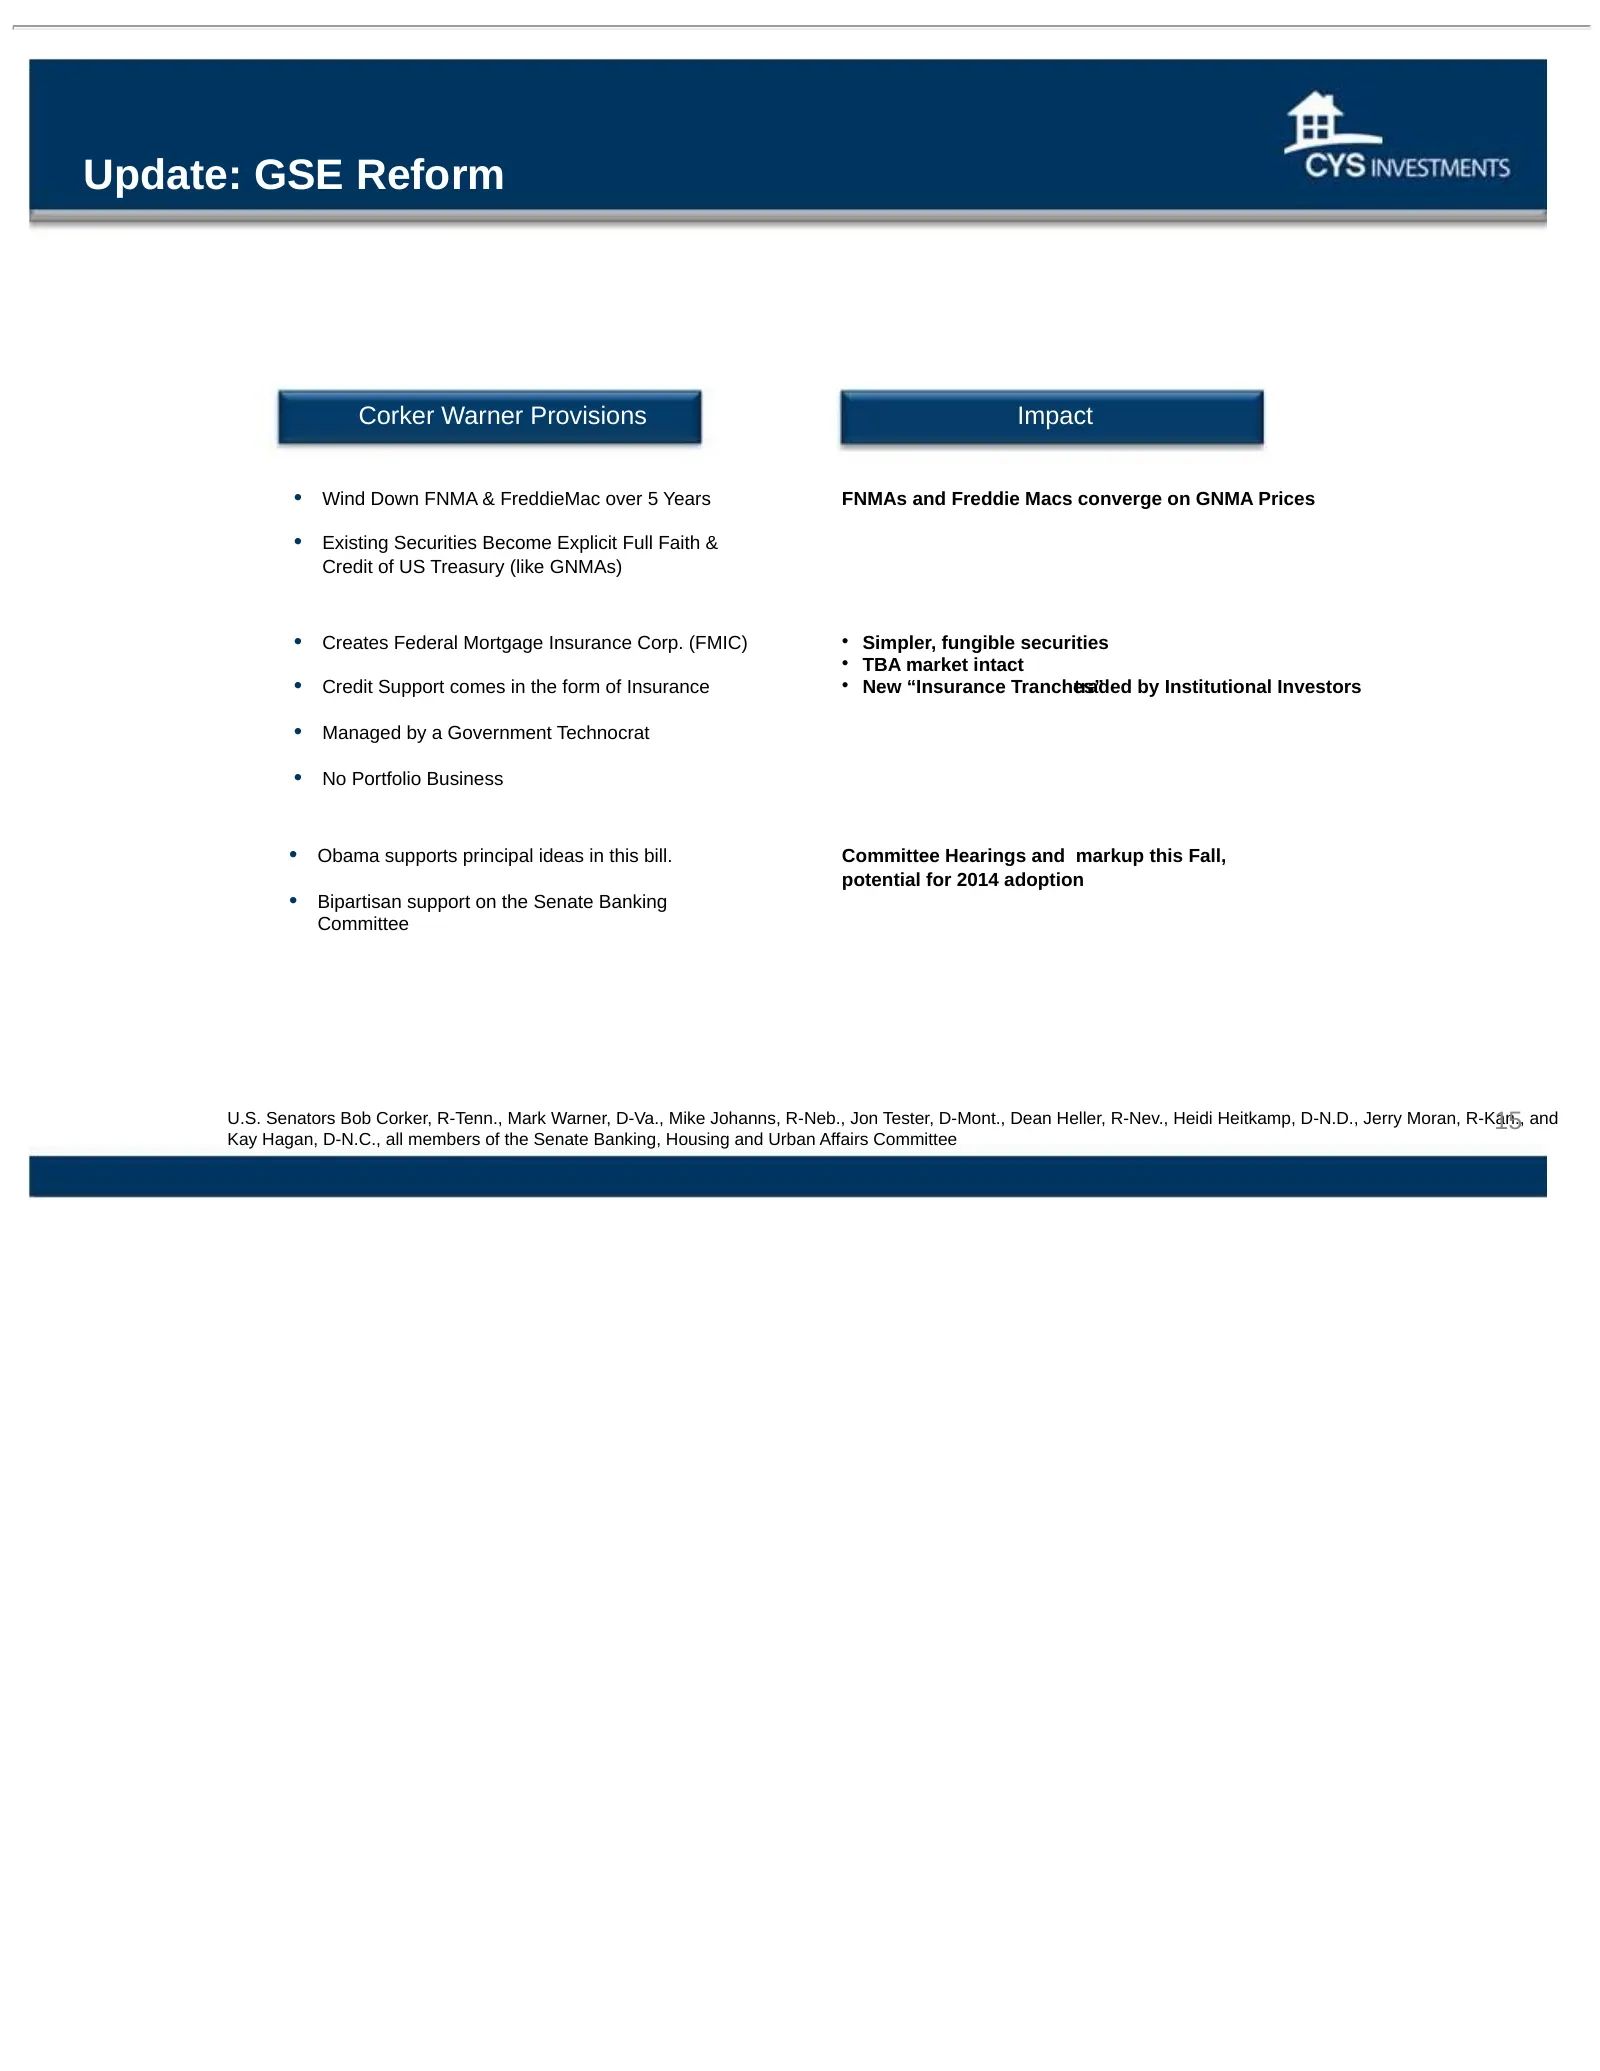
Slide 15: Update: GSE Reform
Update: GSE Reform Corker Warner Provisions Impact • Wind Down FNMA & FreddieMac over 5 Years FNMAs and Freddie Macs converge on GNMA Prices • Existing Securities Become Explicit Full Faith & Credit of US Treasury (like GNMAs) • Creates Federal Mortgage Insurance Corp. (FMIC) • Simpler, fungible sec
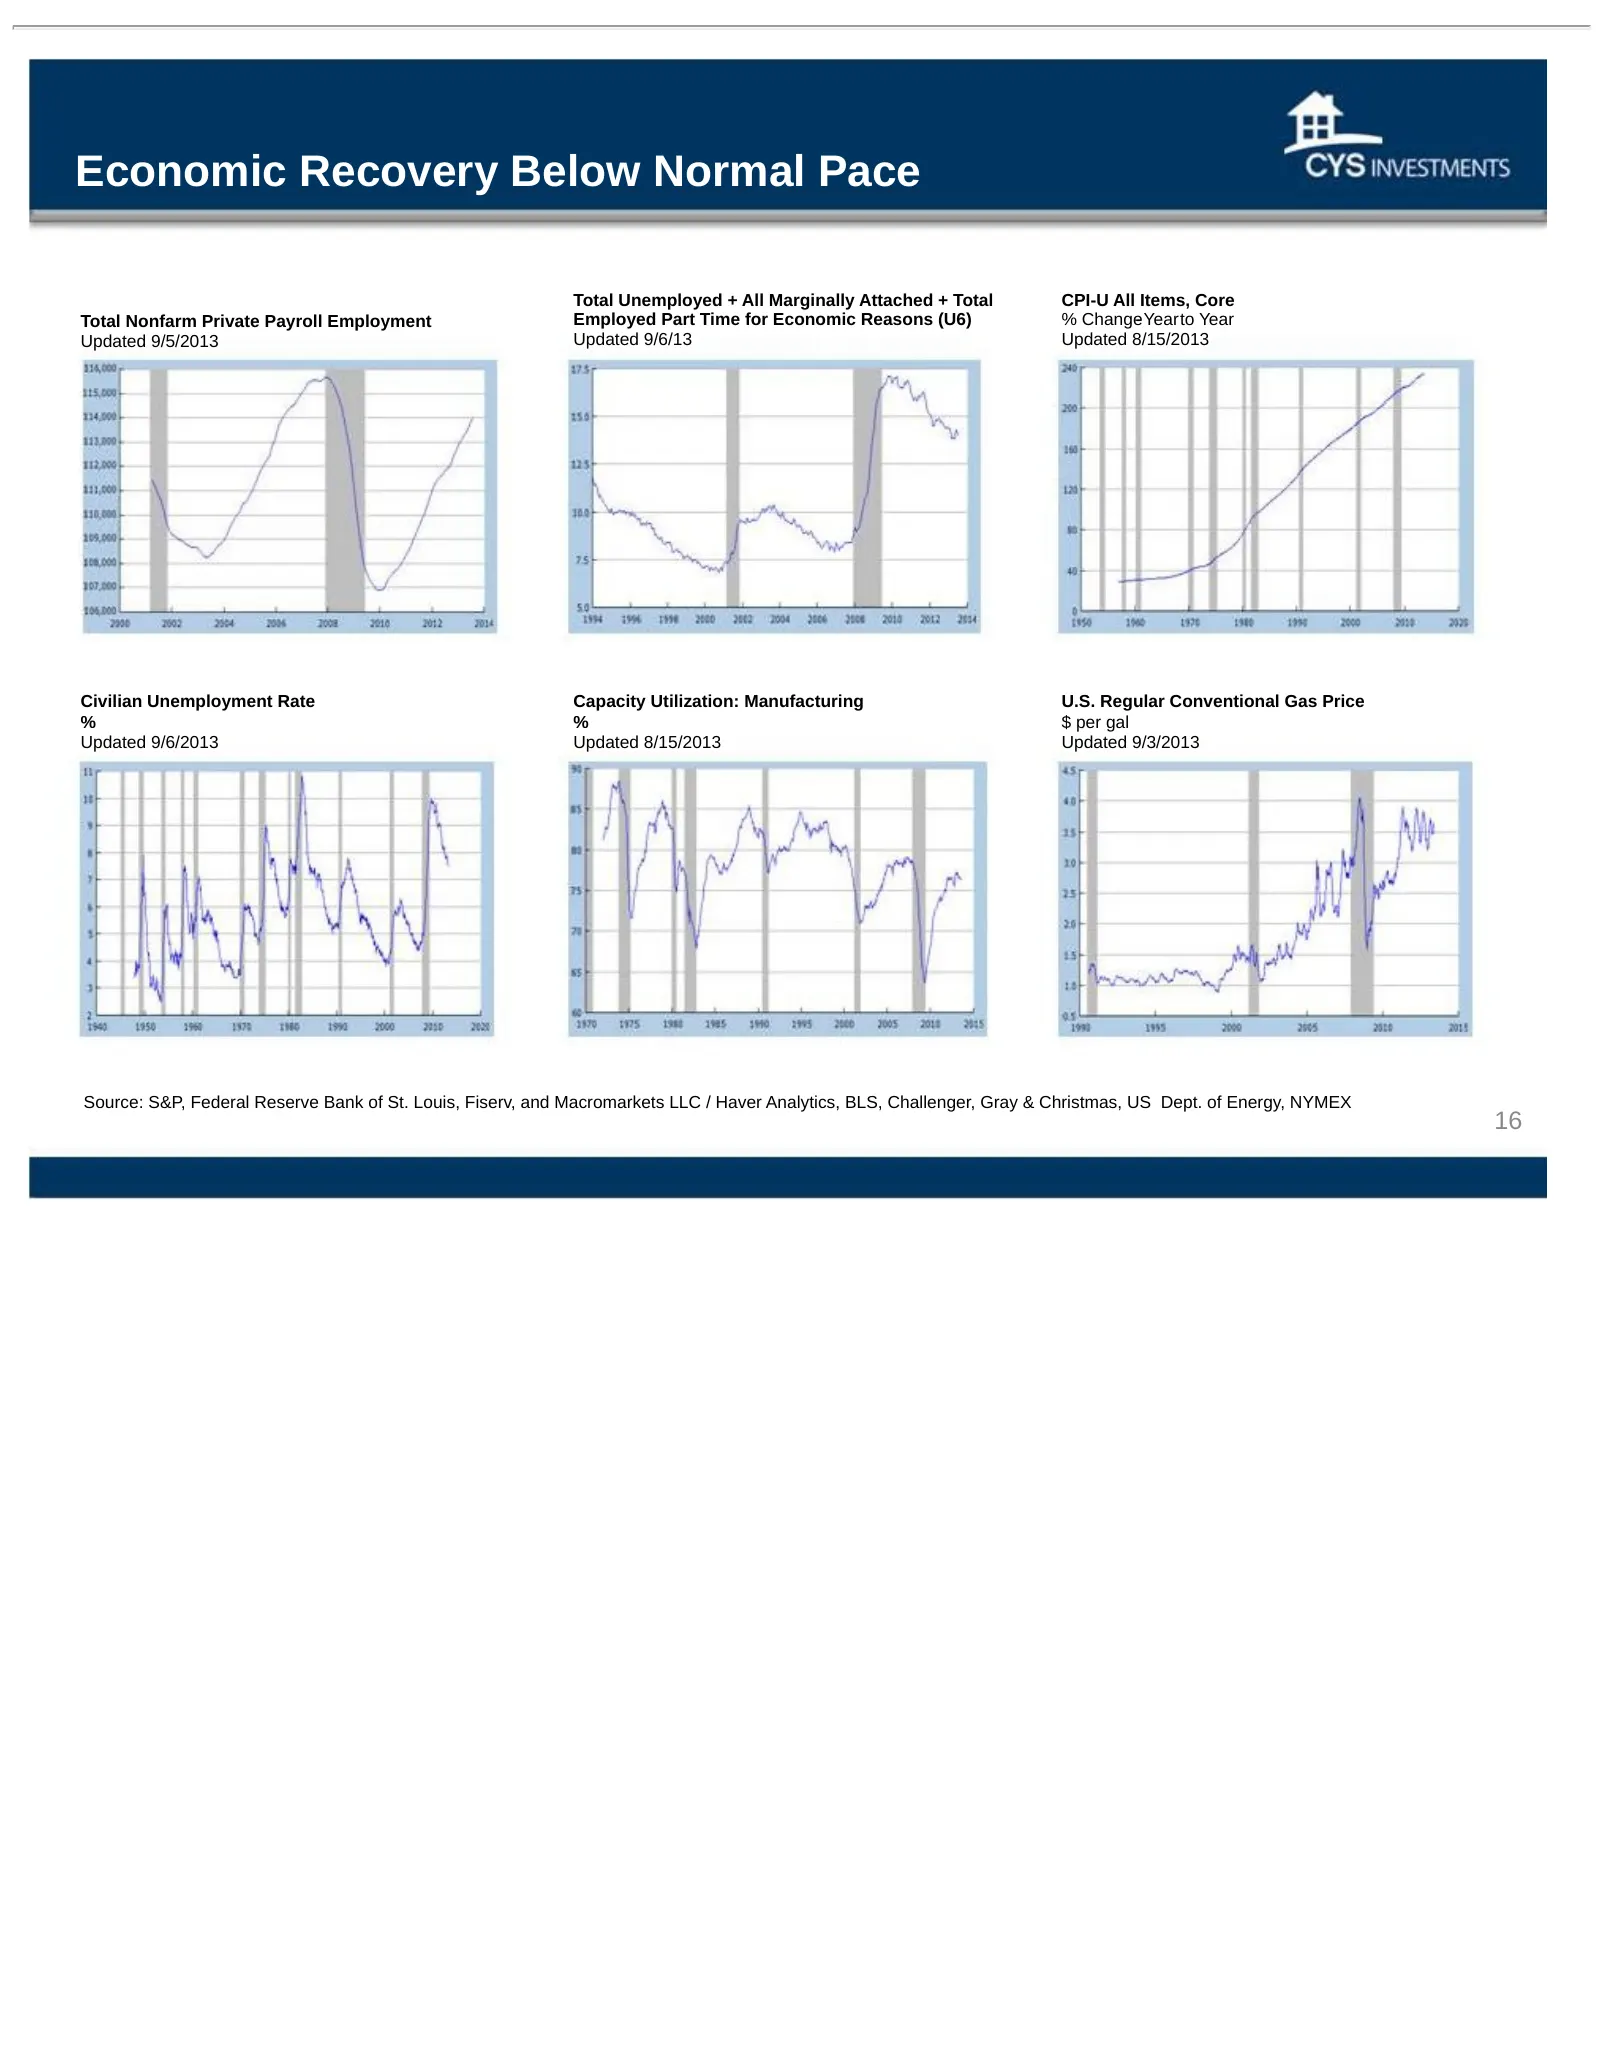
Slide 16: Economic Recovery Below Normal Pace
Economic Recovery Below Normal Pace Total Unemployed + All Marginally Attached + Total CPI-U All Items, Core Total Nonfarm Private Payroll Employment Employed Part Time for Economic Reasons (U6) % Change- Yearto Year Updated 9/5/2013 Updated 9/6/13 Updated 8/15/2013 Civilian Unemployment Rate Capaci
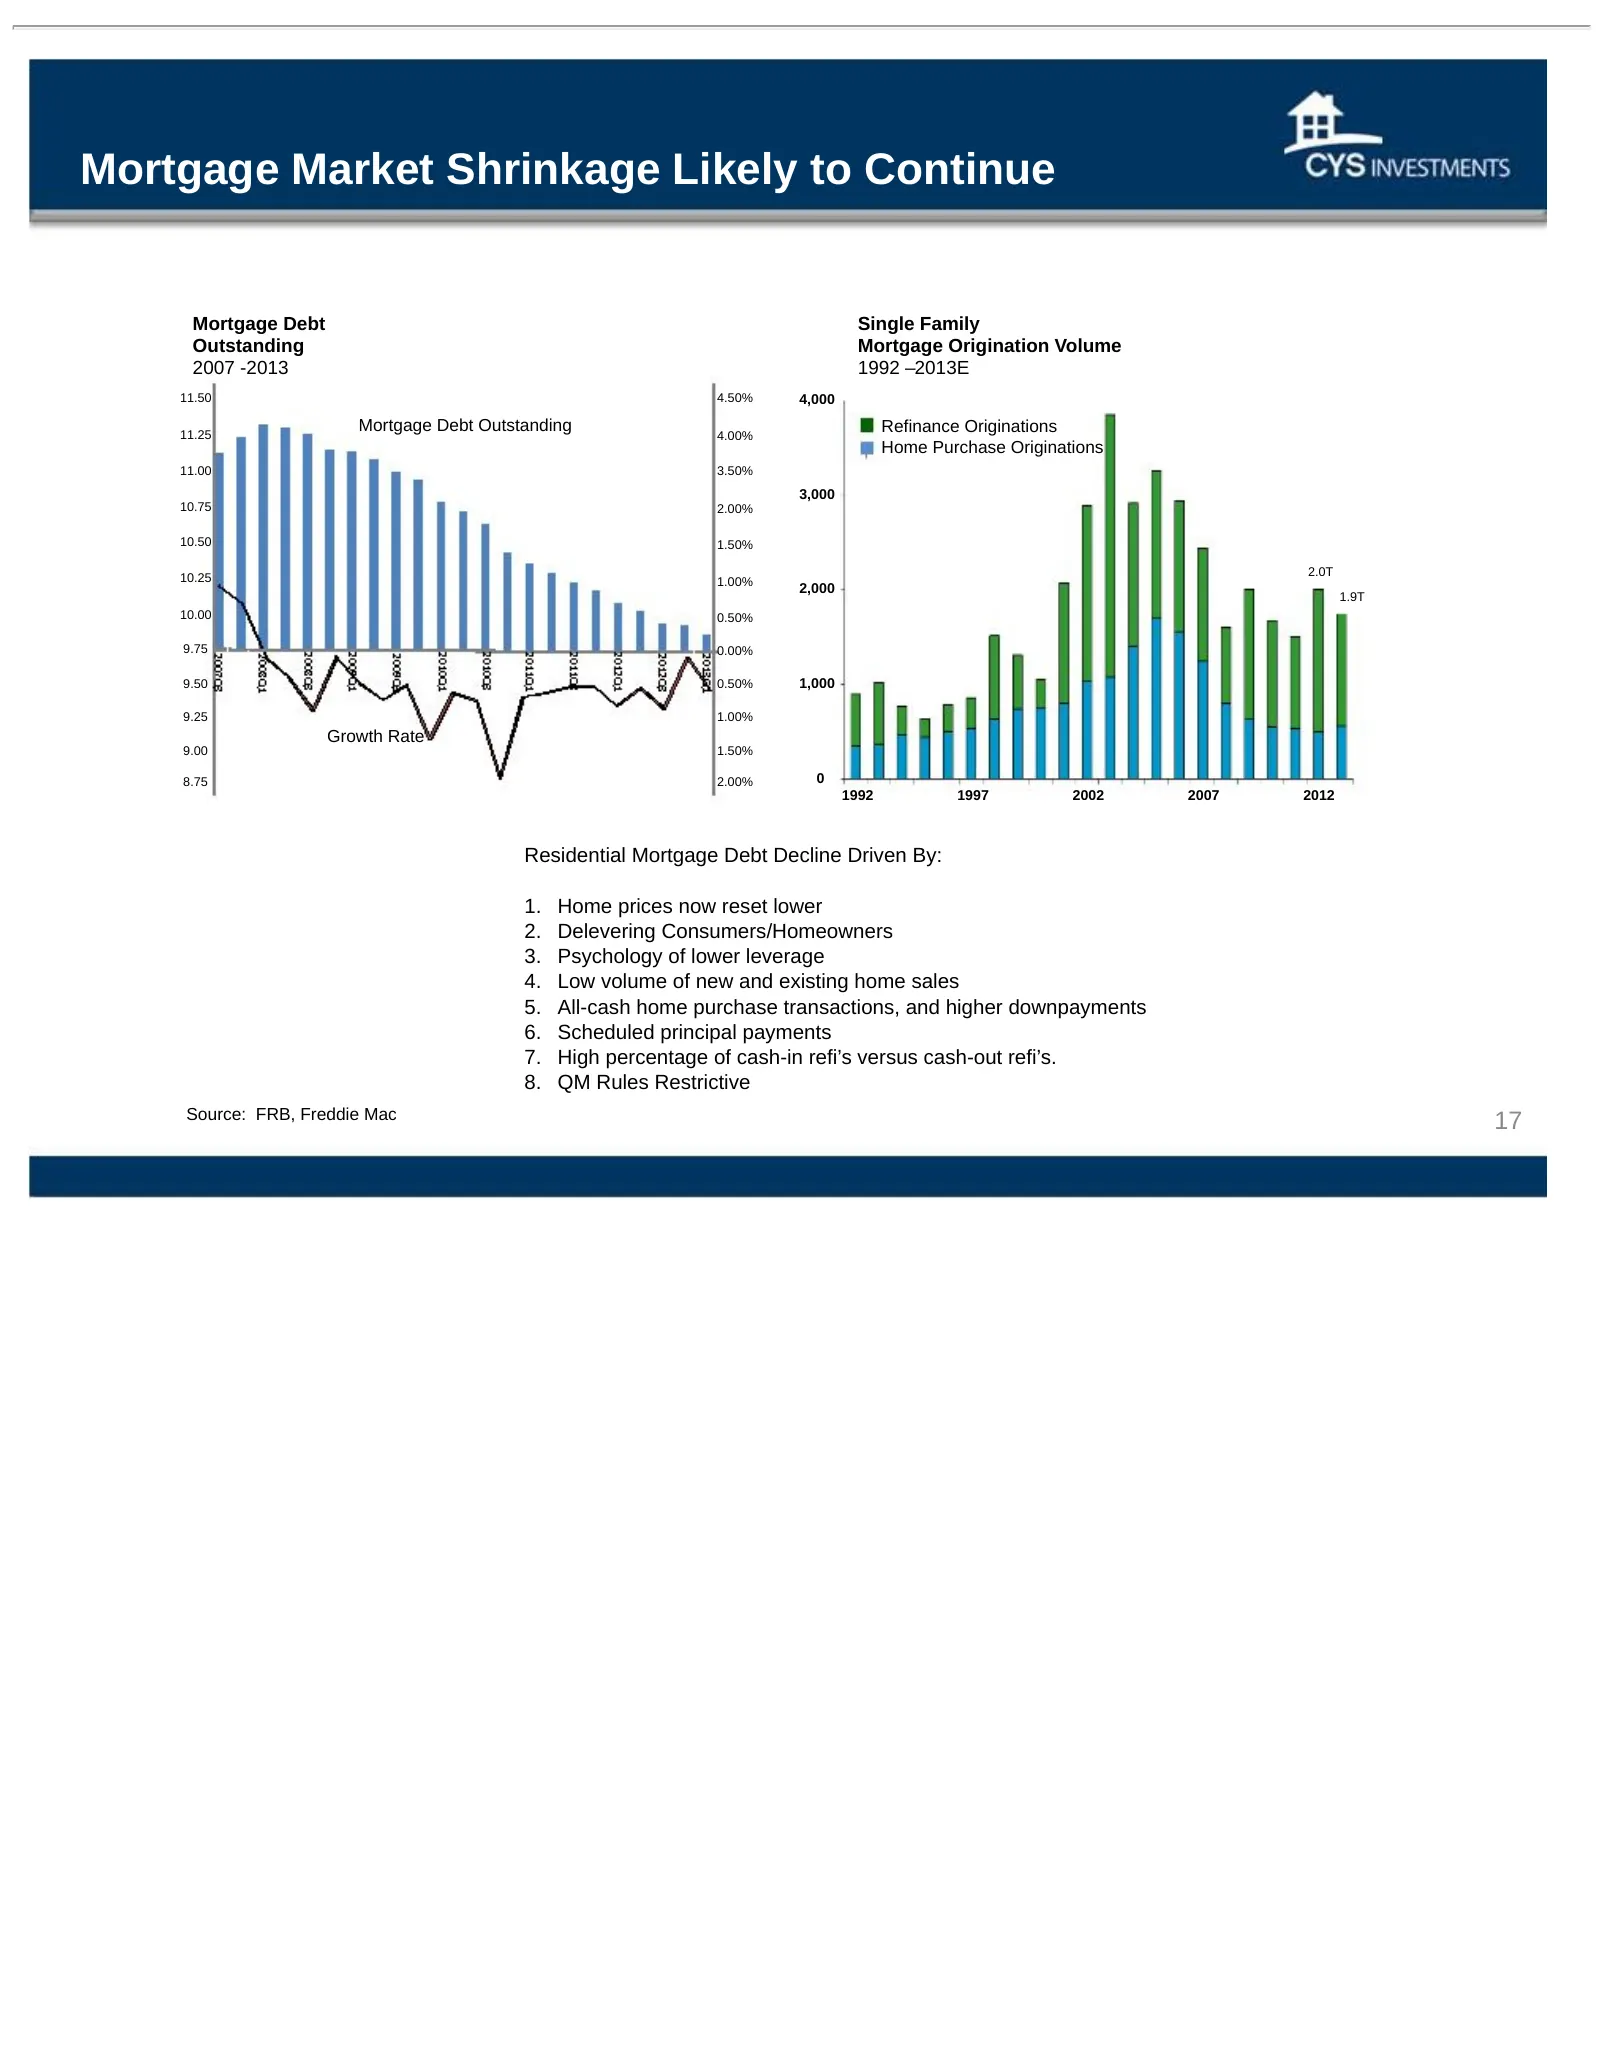
Slide 17: Mortgage Market Shrinkage Likely to Continue
Mortgage Market Shrinkage Likely to Continue Mortgage Debt Single Family Outstanding Mortgage Origination Volume 2007 -2013 1992 –2013E 11.50 4.50% 4,000 11.25 Mortgage Debt Outstanding Refinance Originations 4.00% Home Purchase Originations 11.00 3.50% 3,000 10.75 2.00% 10.50 1.50% 2.0T 10.25 1.00%
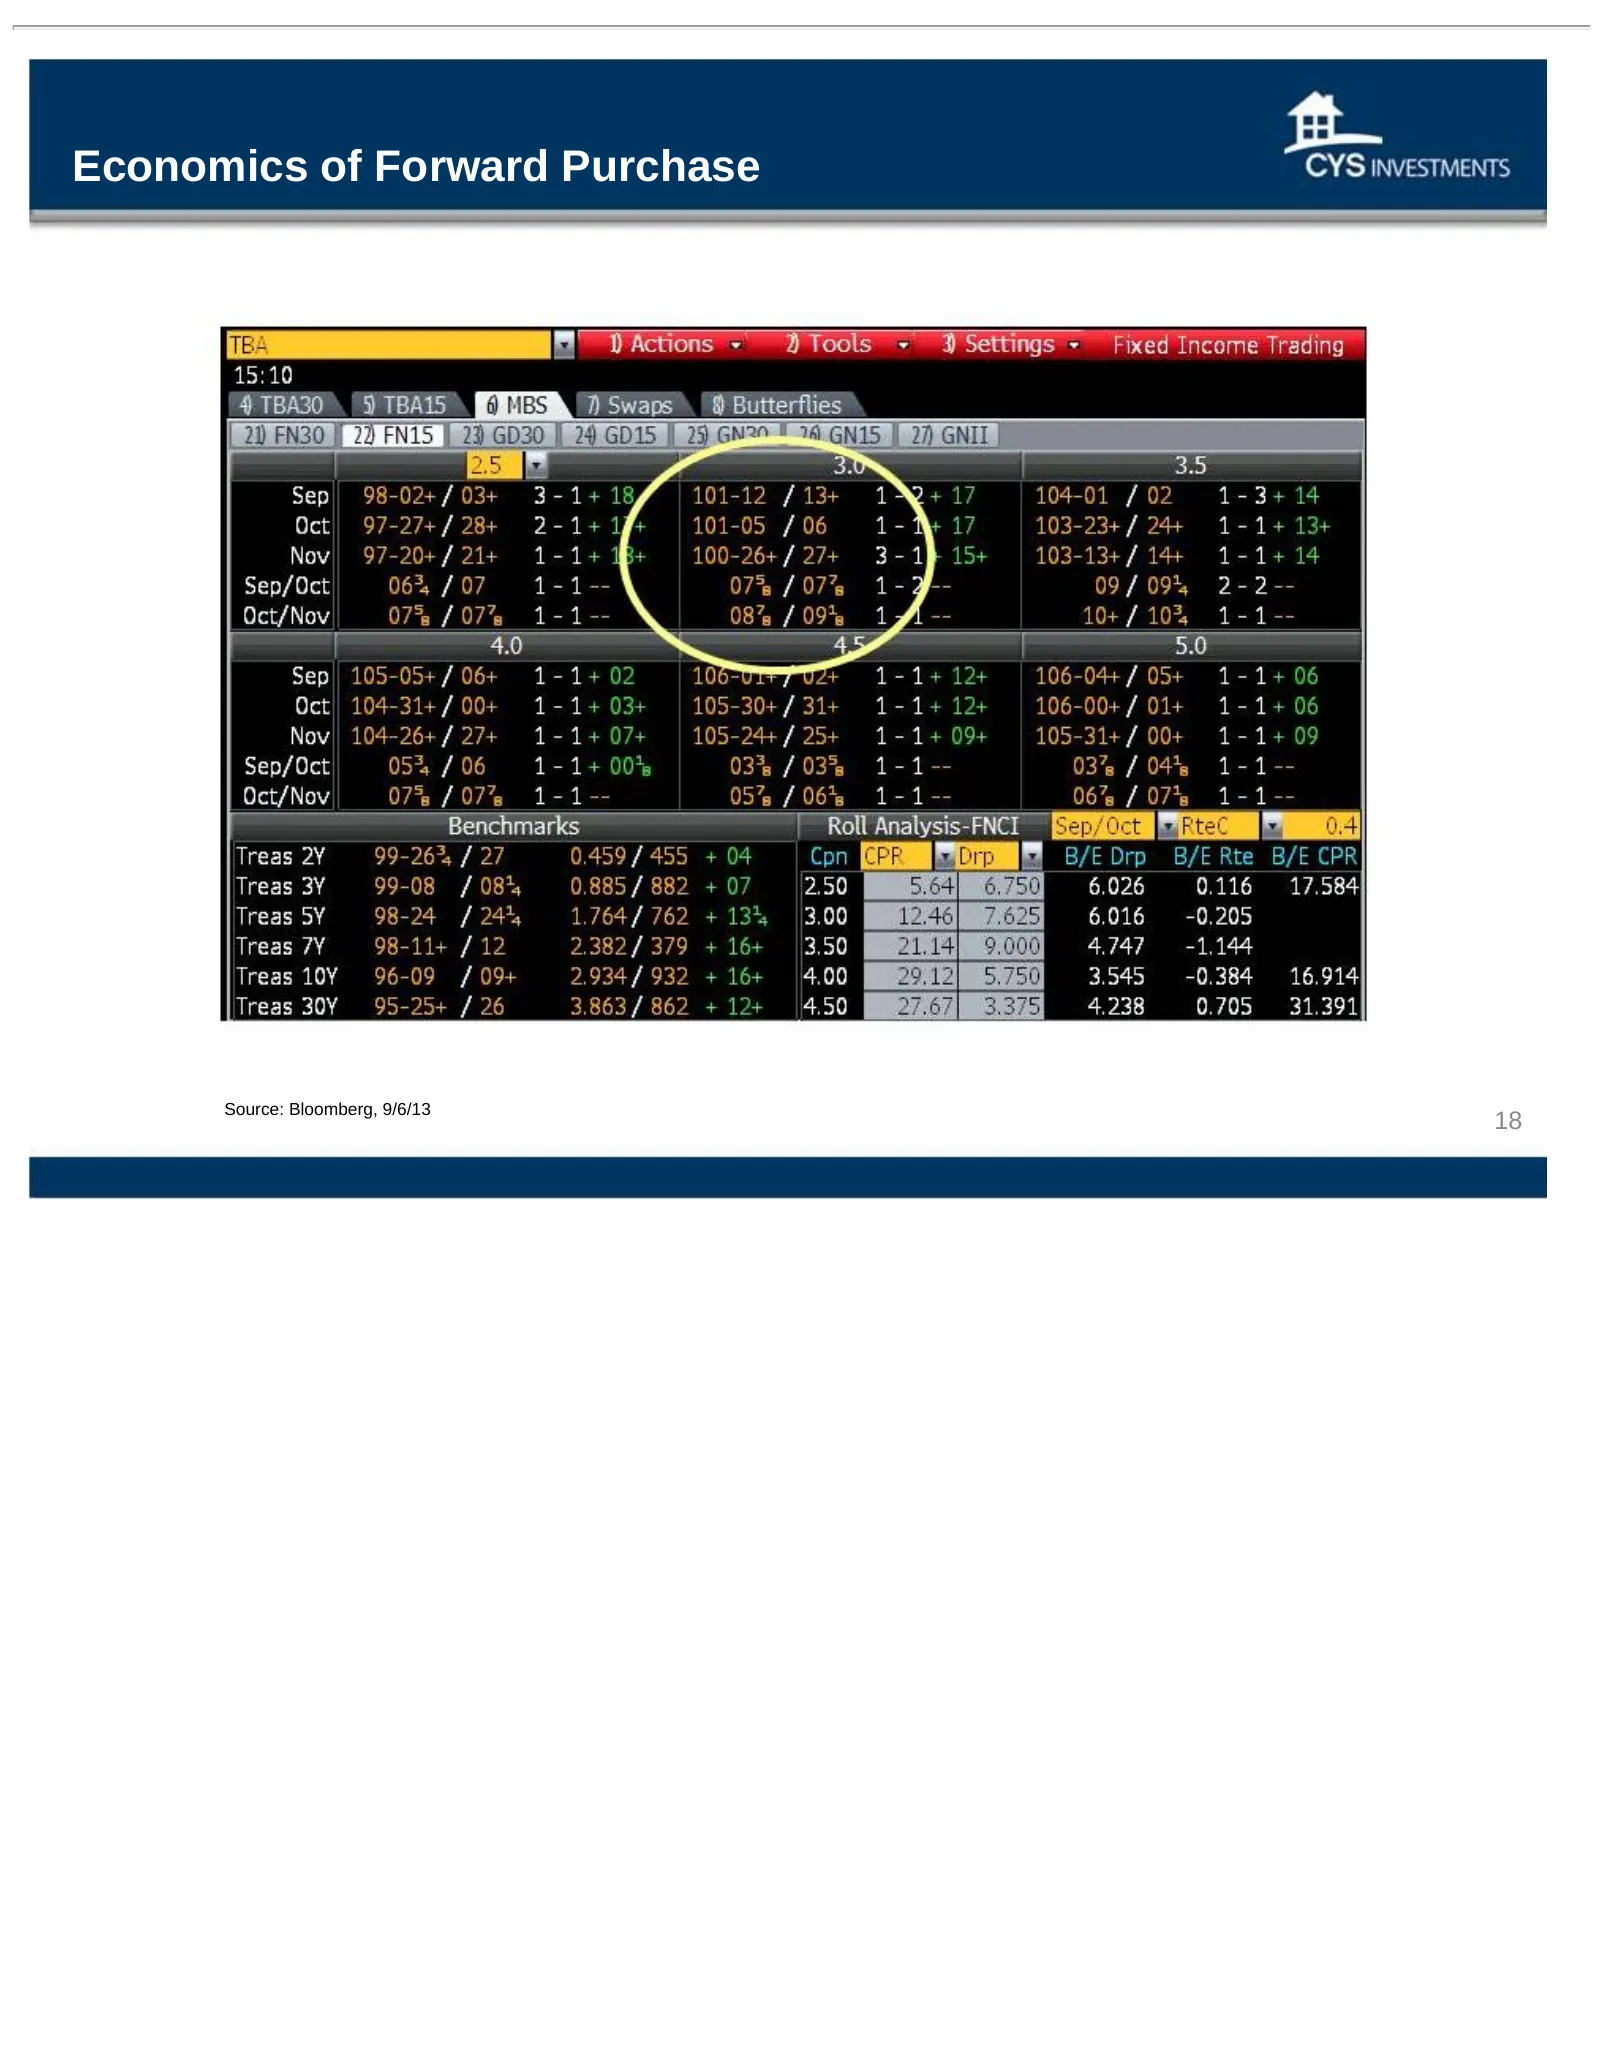
Slide 18: Economics of Forward Purchase
Economics of Forward Purchase Source: Bloomberg, 9/6/13 18
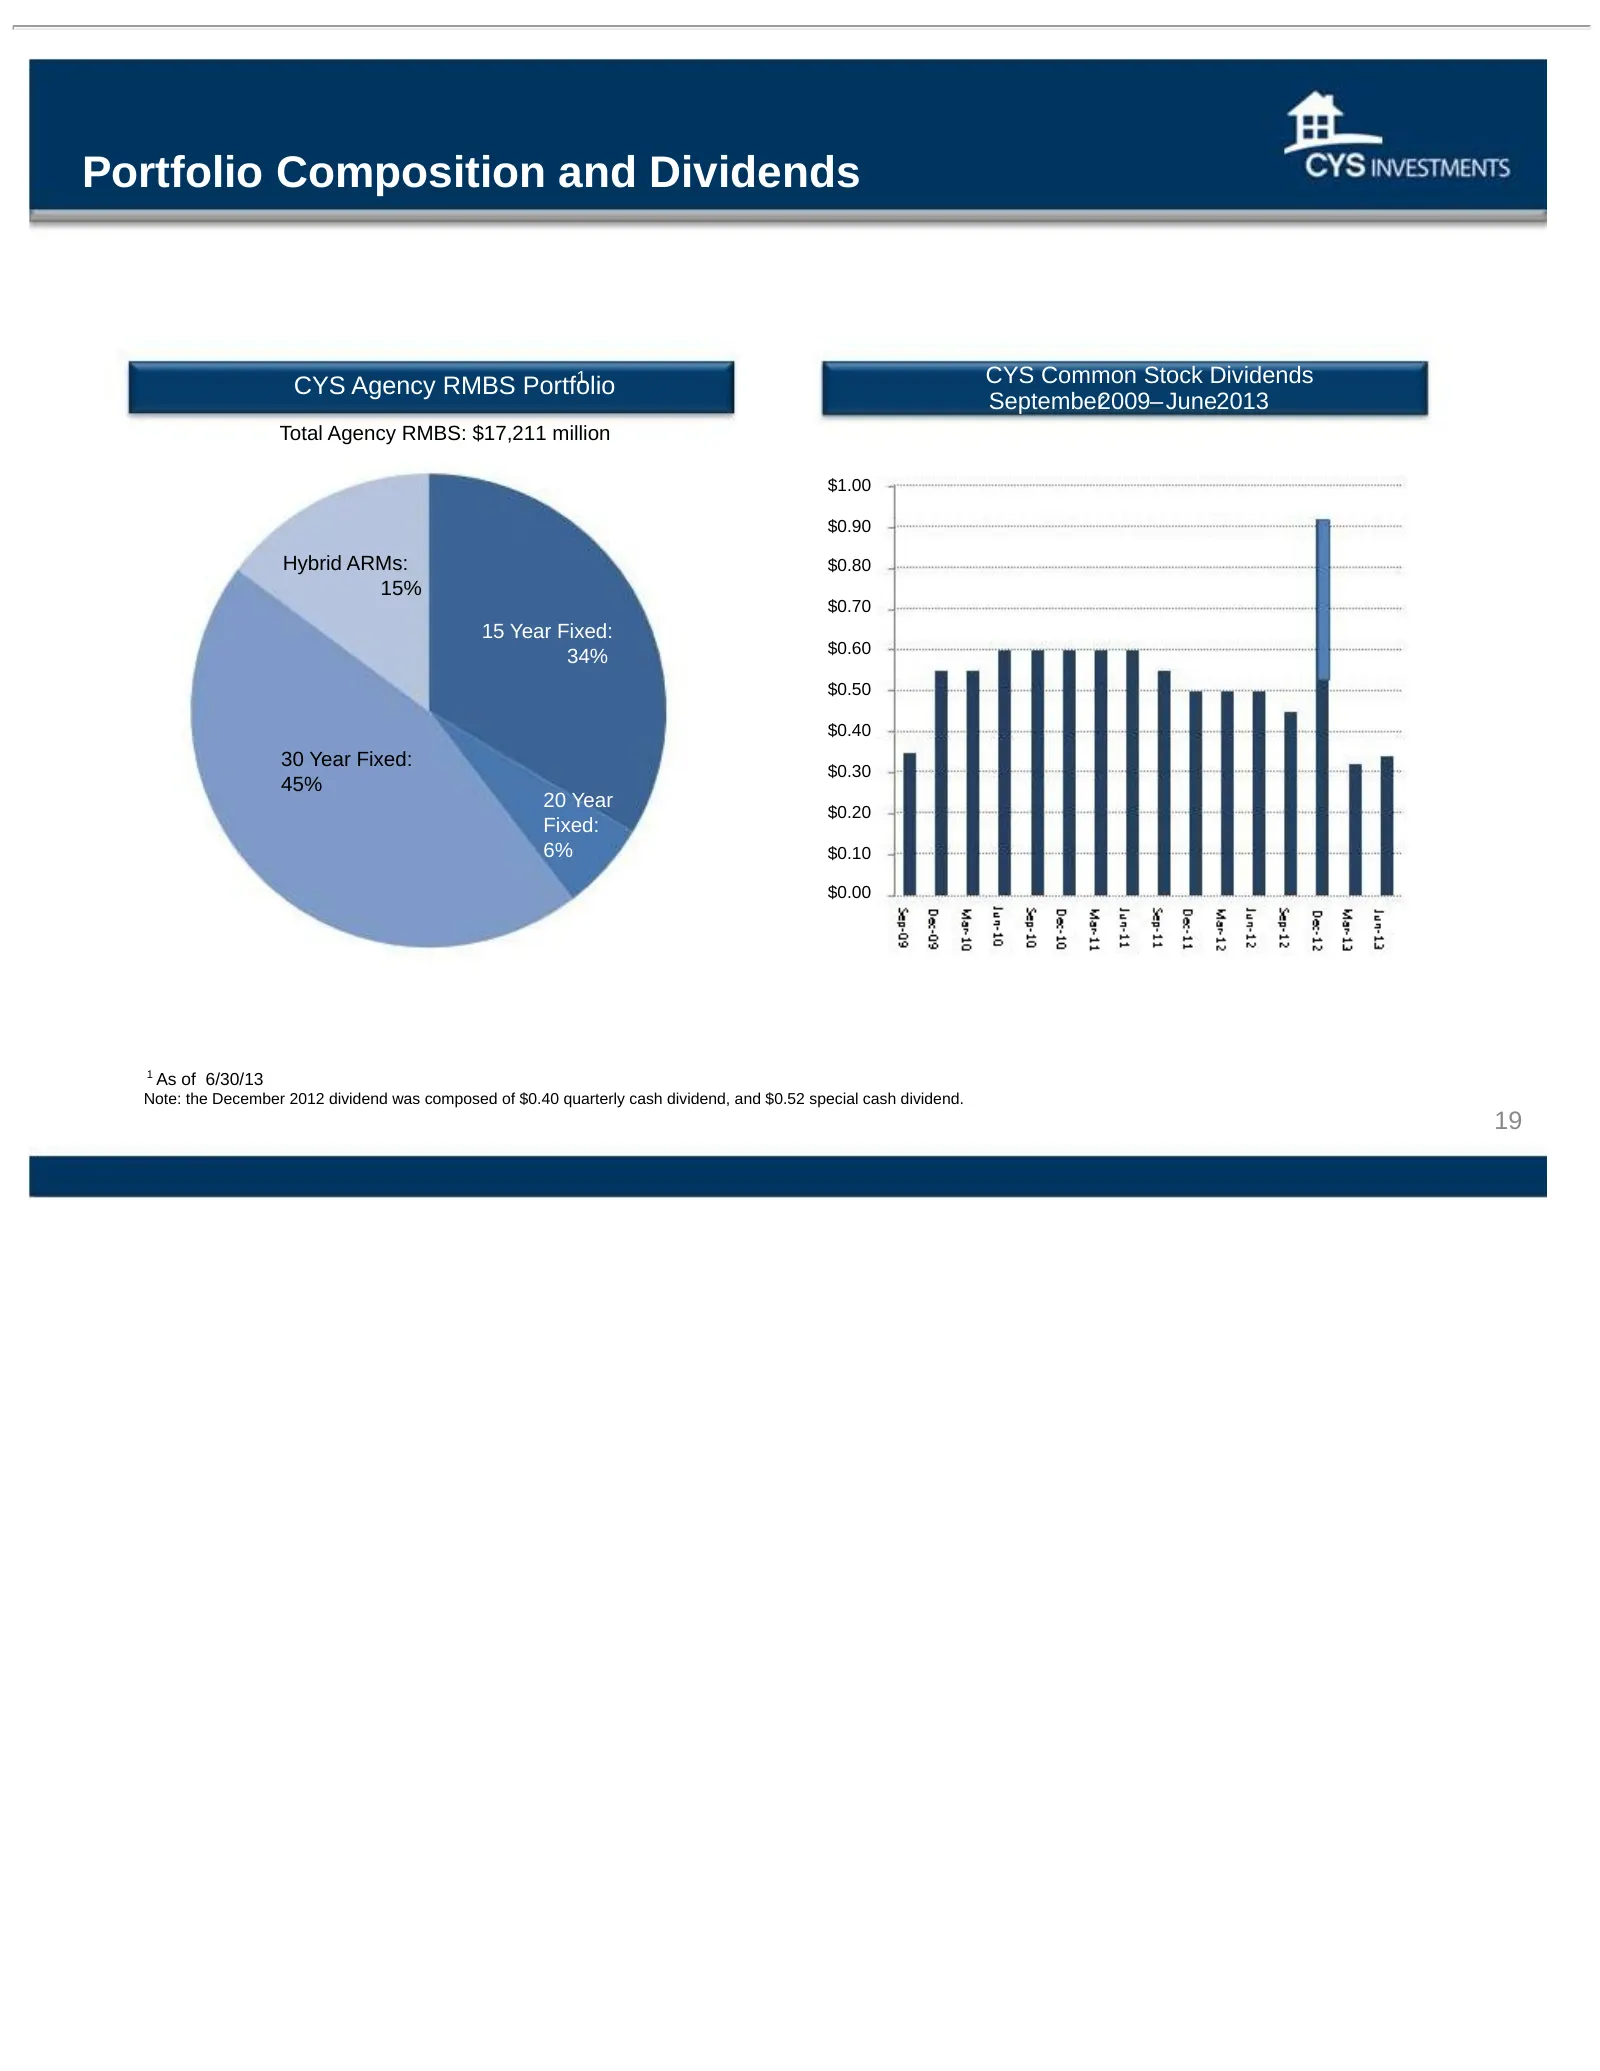
Slide 19: Portfolio Composition and Dividends
Portfolio Composition and Dividends 1 CYS Agency RMBS Portfolio CYS Common Stock Dividends September2009– June2013 Total Agency RMBS: $17,211 million $1.00 $0.90 Hybrid ARMs: $0.80 15% $0.70 15 Year Fixed: $0.60 34% $0.50 $0.40 30 Year Fixed: $0.30 45% 20 Year $0.20 Fixed: 6% $0.10 $0.00 1 As of 6/3
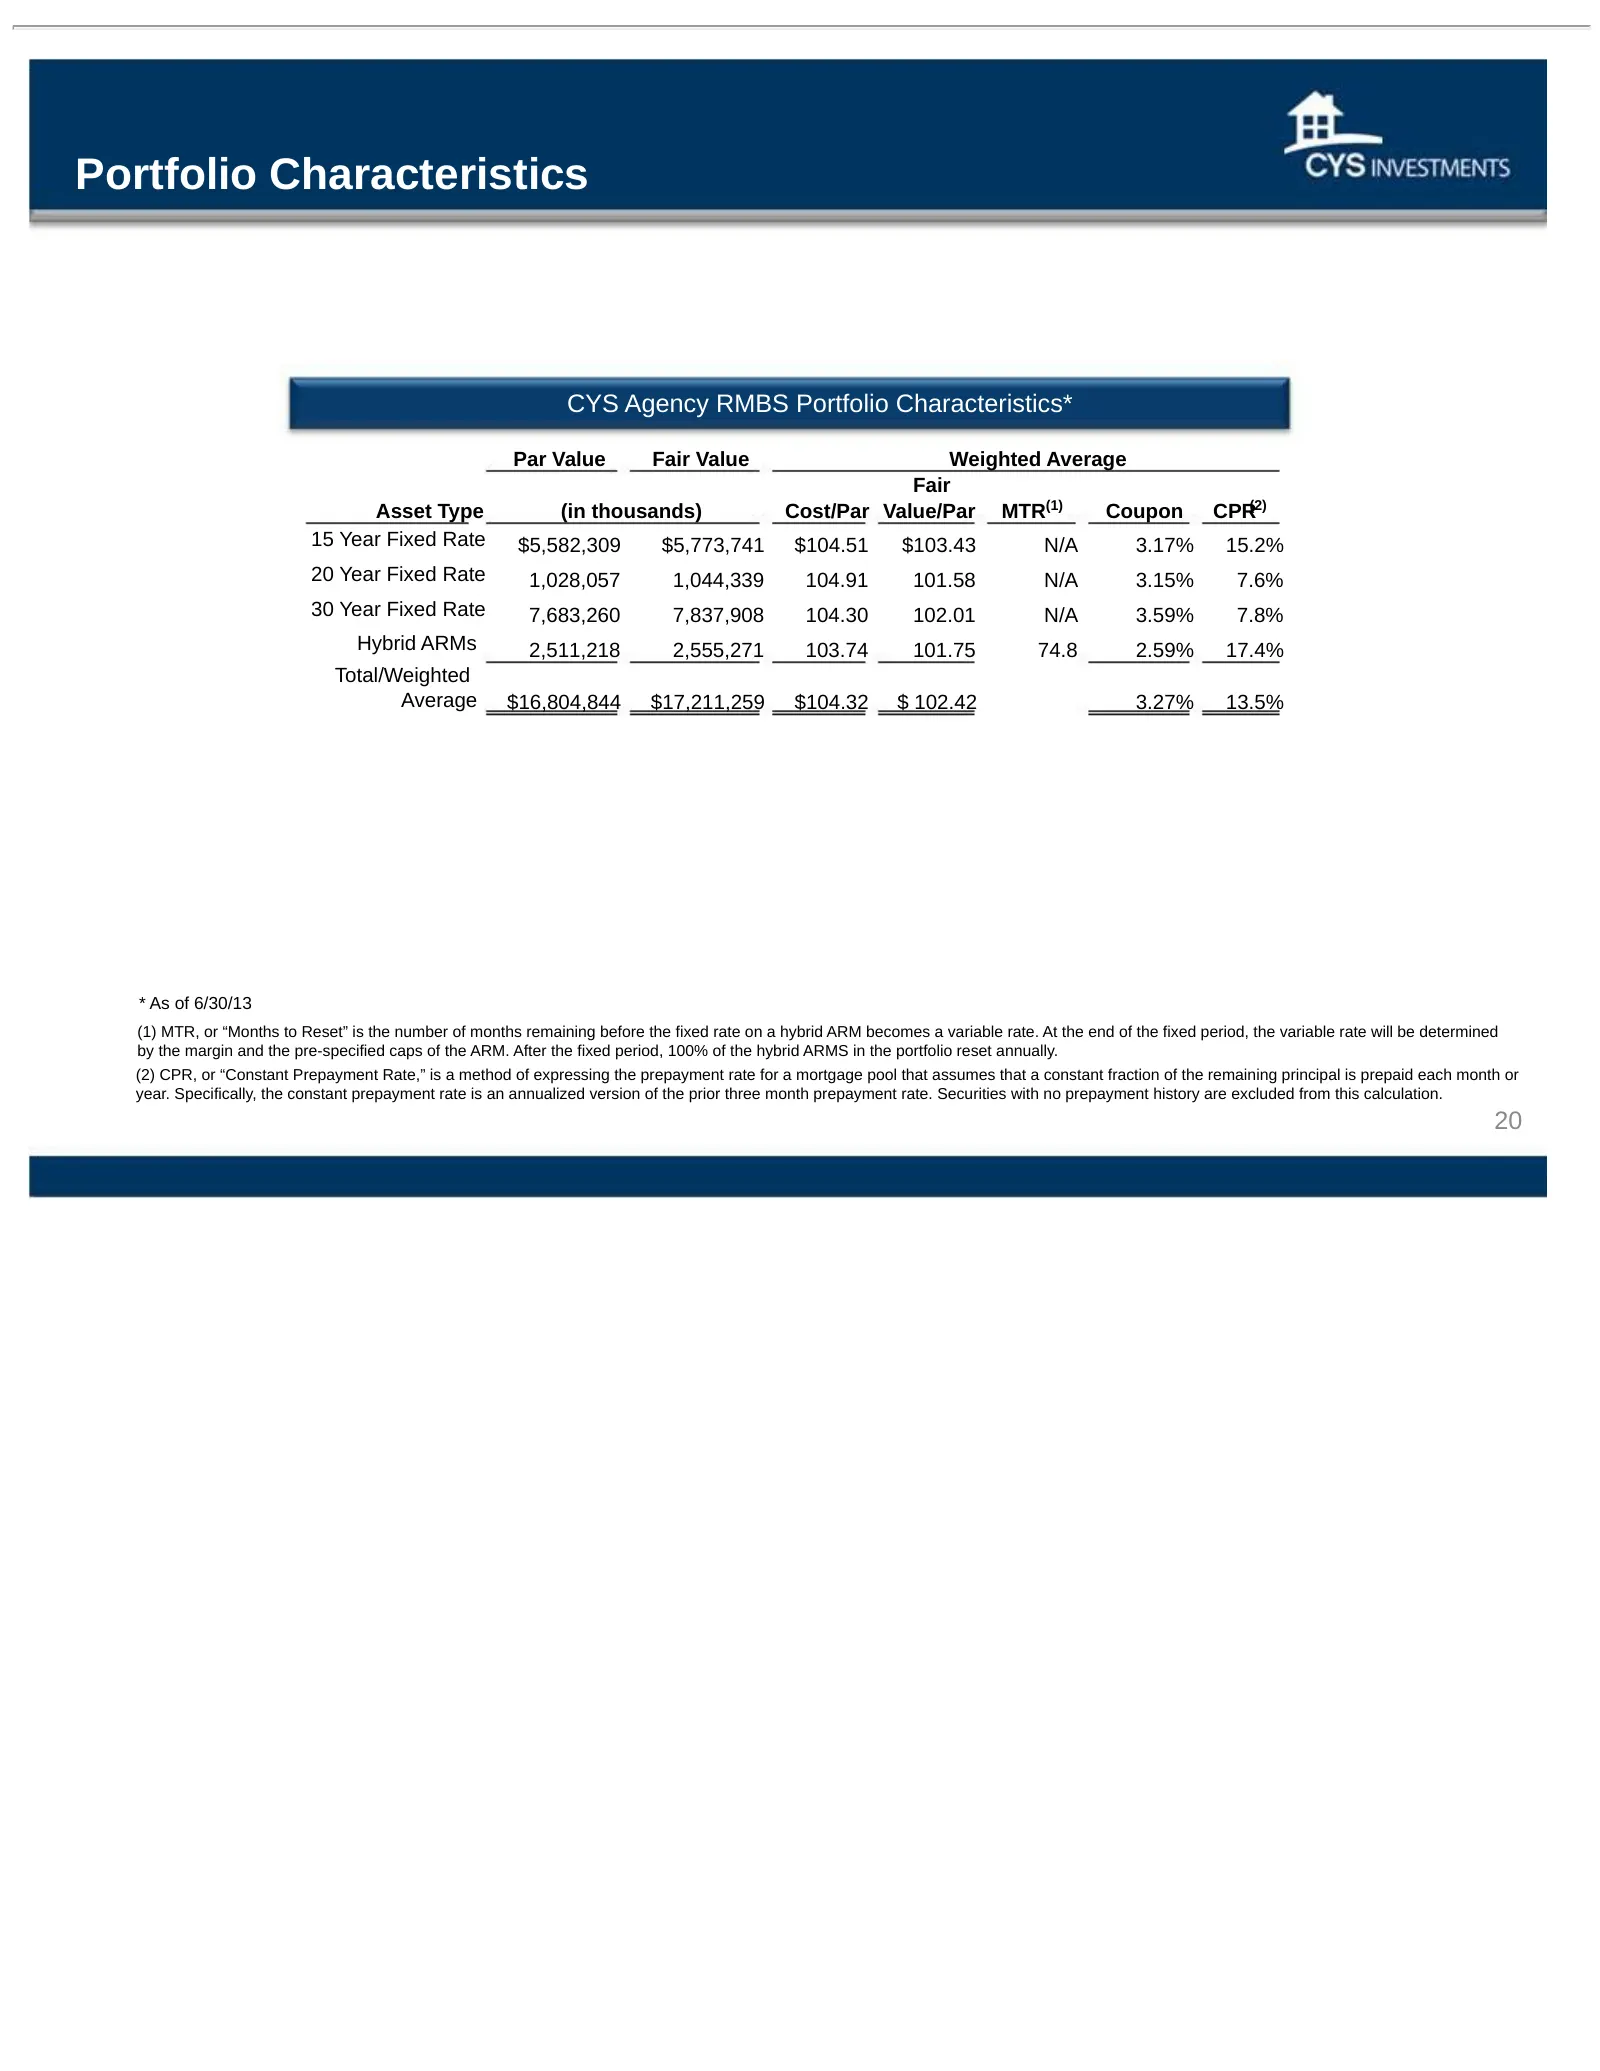
Slide 20: Portfolio Characteristics
Portfolio Characteristics CYS Agency RMBS Portfolio Characteristics* Par Value Fair Value Weighted Average Fair Asset Type (in thousands) Cost/Par Value/Par MTR(1) Coupon CPR(2) 15 Year Fixed Rate $5,582,309 $5,773,741 $104.51 $103.43 N/A 3.17% 15.2% 20 Year Fixed Rate 1,028,057 1,044,339 104.91 101
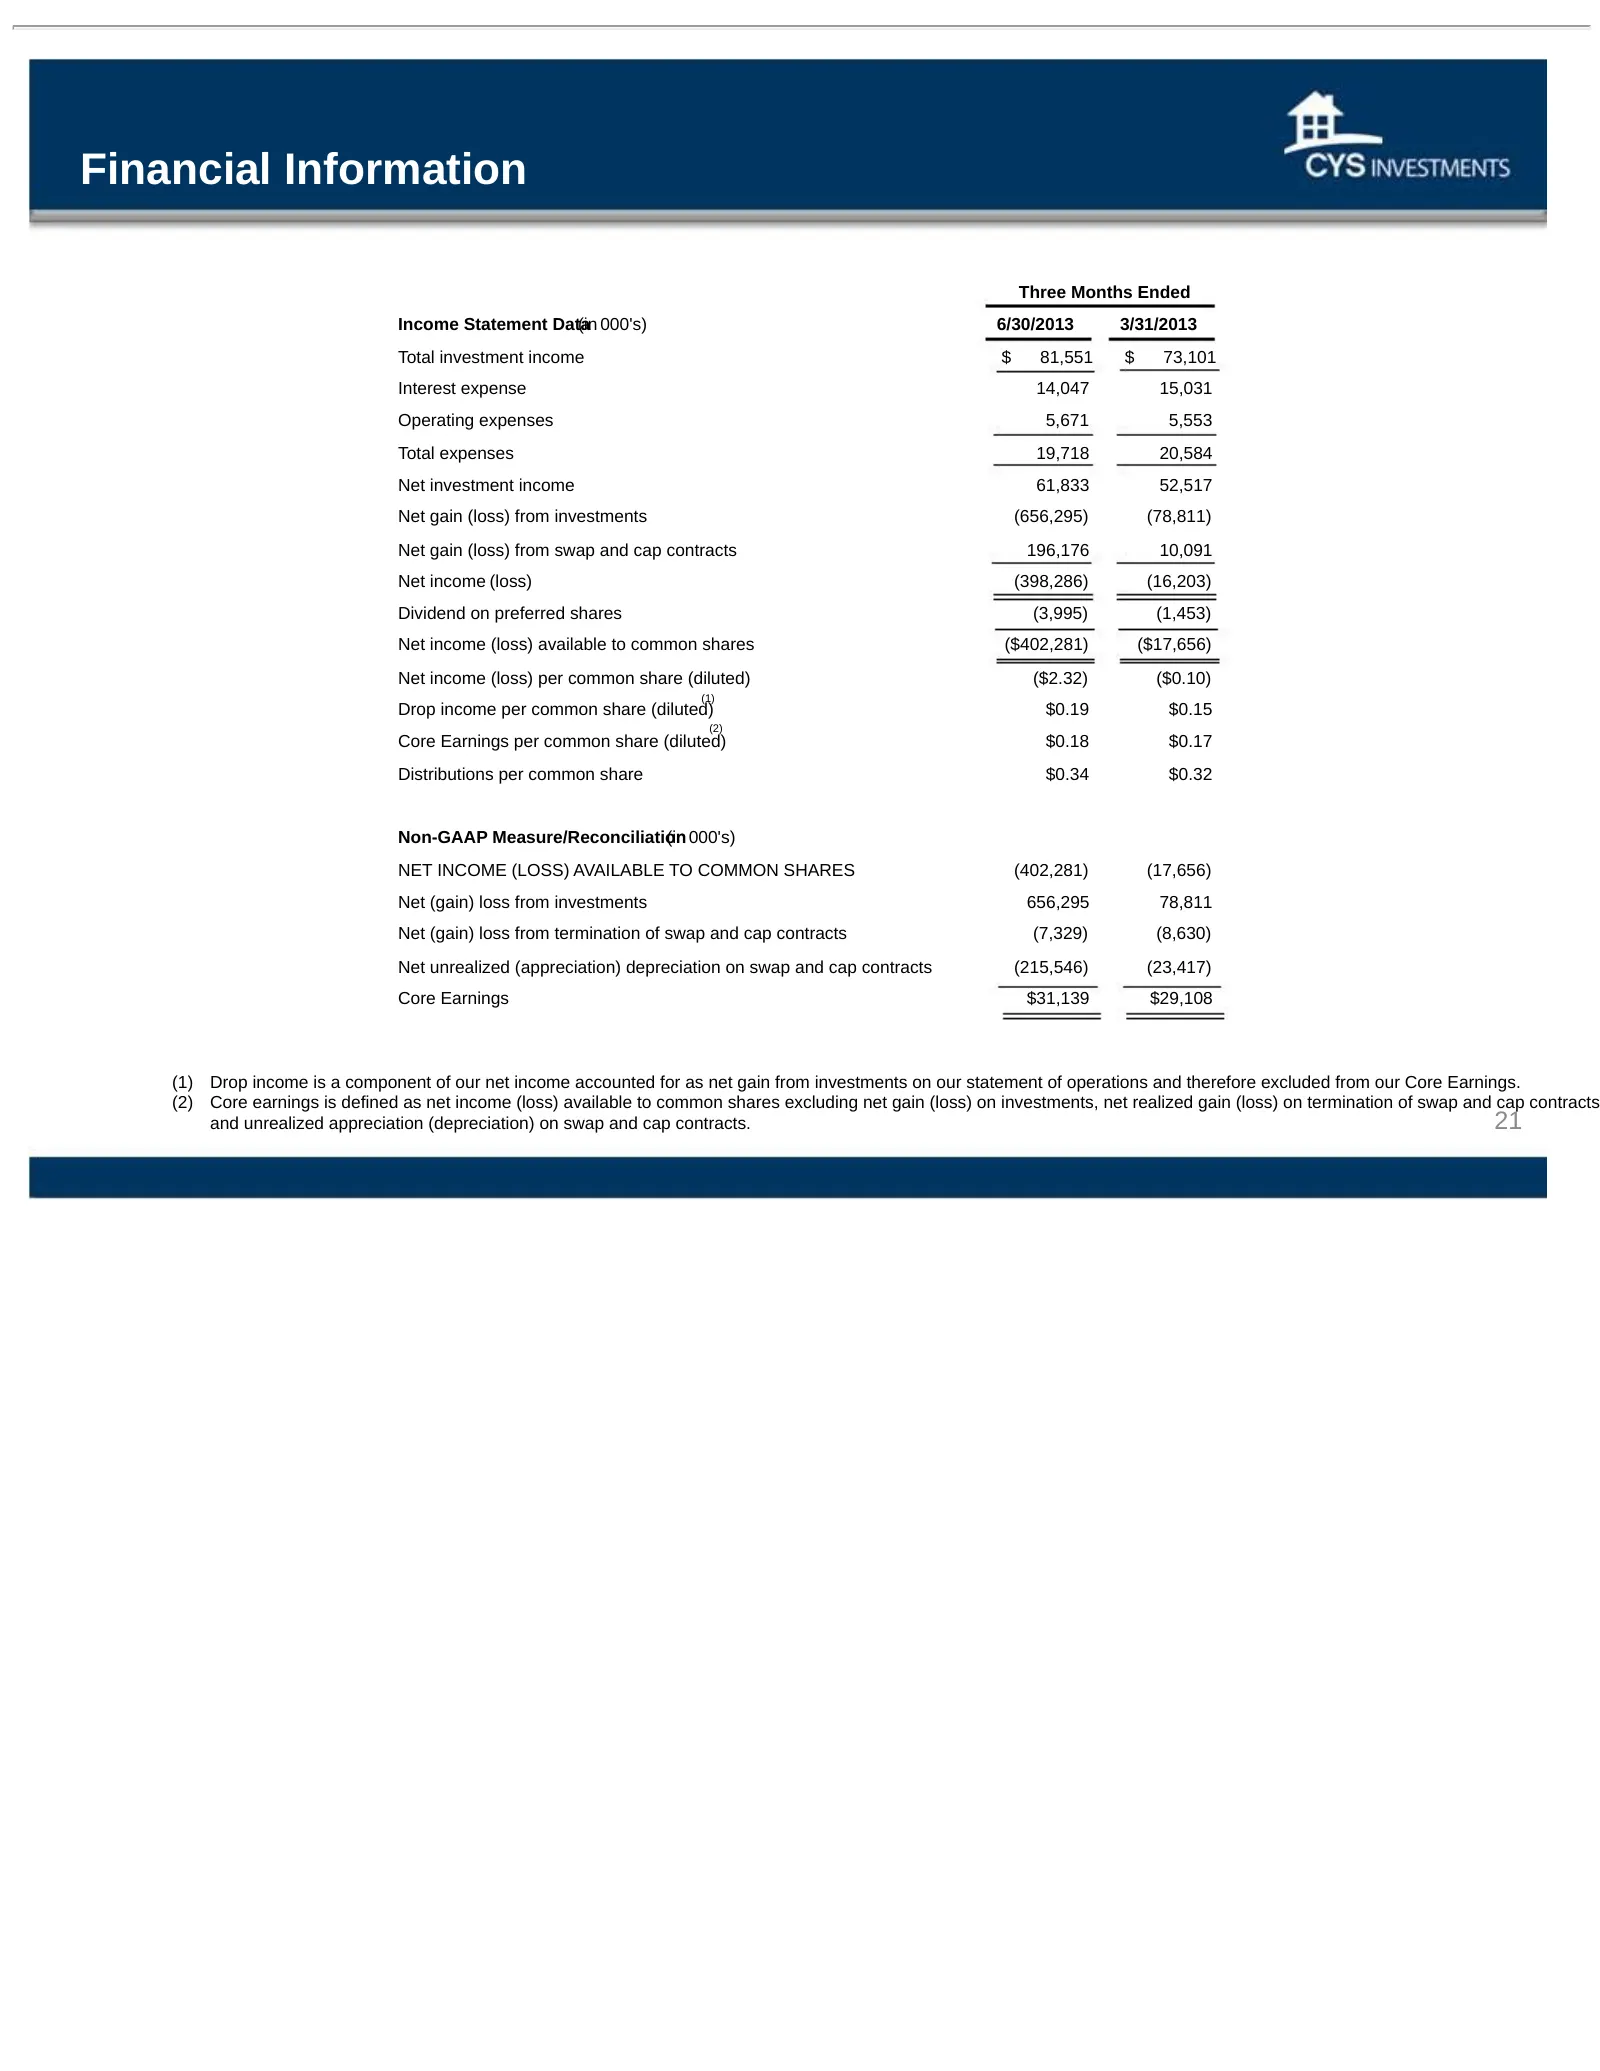
Slide 21: Financial Information
Financial Information Three Months Ended Income Statement Data (in 000's) 6/30/2013 3/31/2013 Total investment income $ 81,551 $ 73,101 Interest expense 14,047 15,031 Operating expenses 5,671 5,553 Total expenses 19,718 20,584 Net investment income 61,833 52,517 Net gain (loss) from investments (656
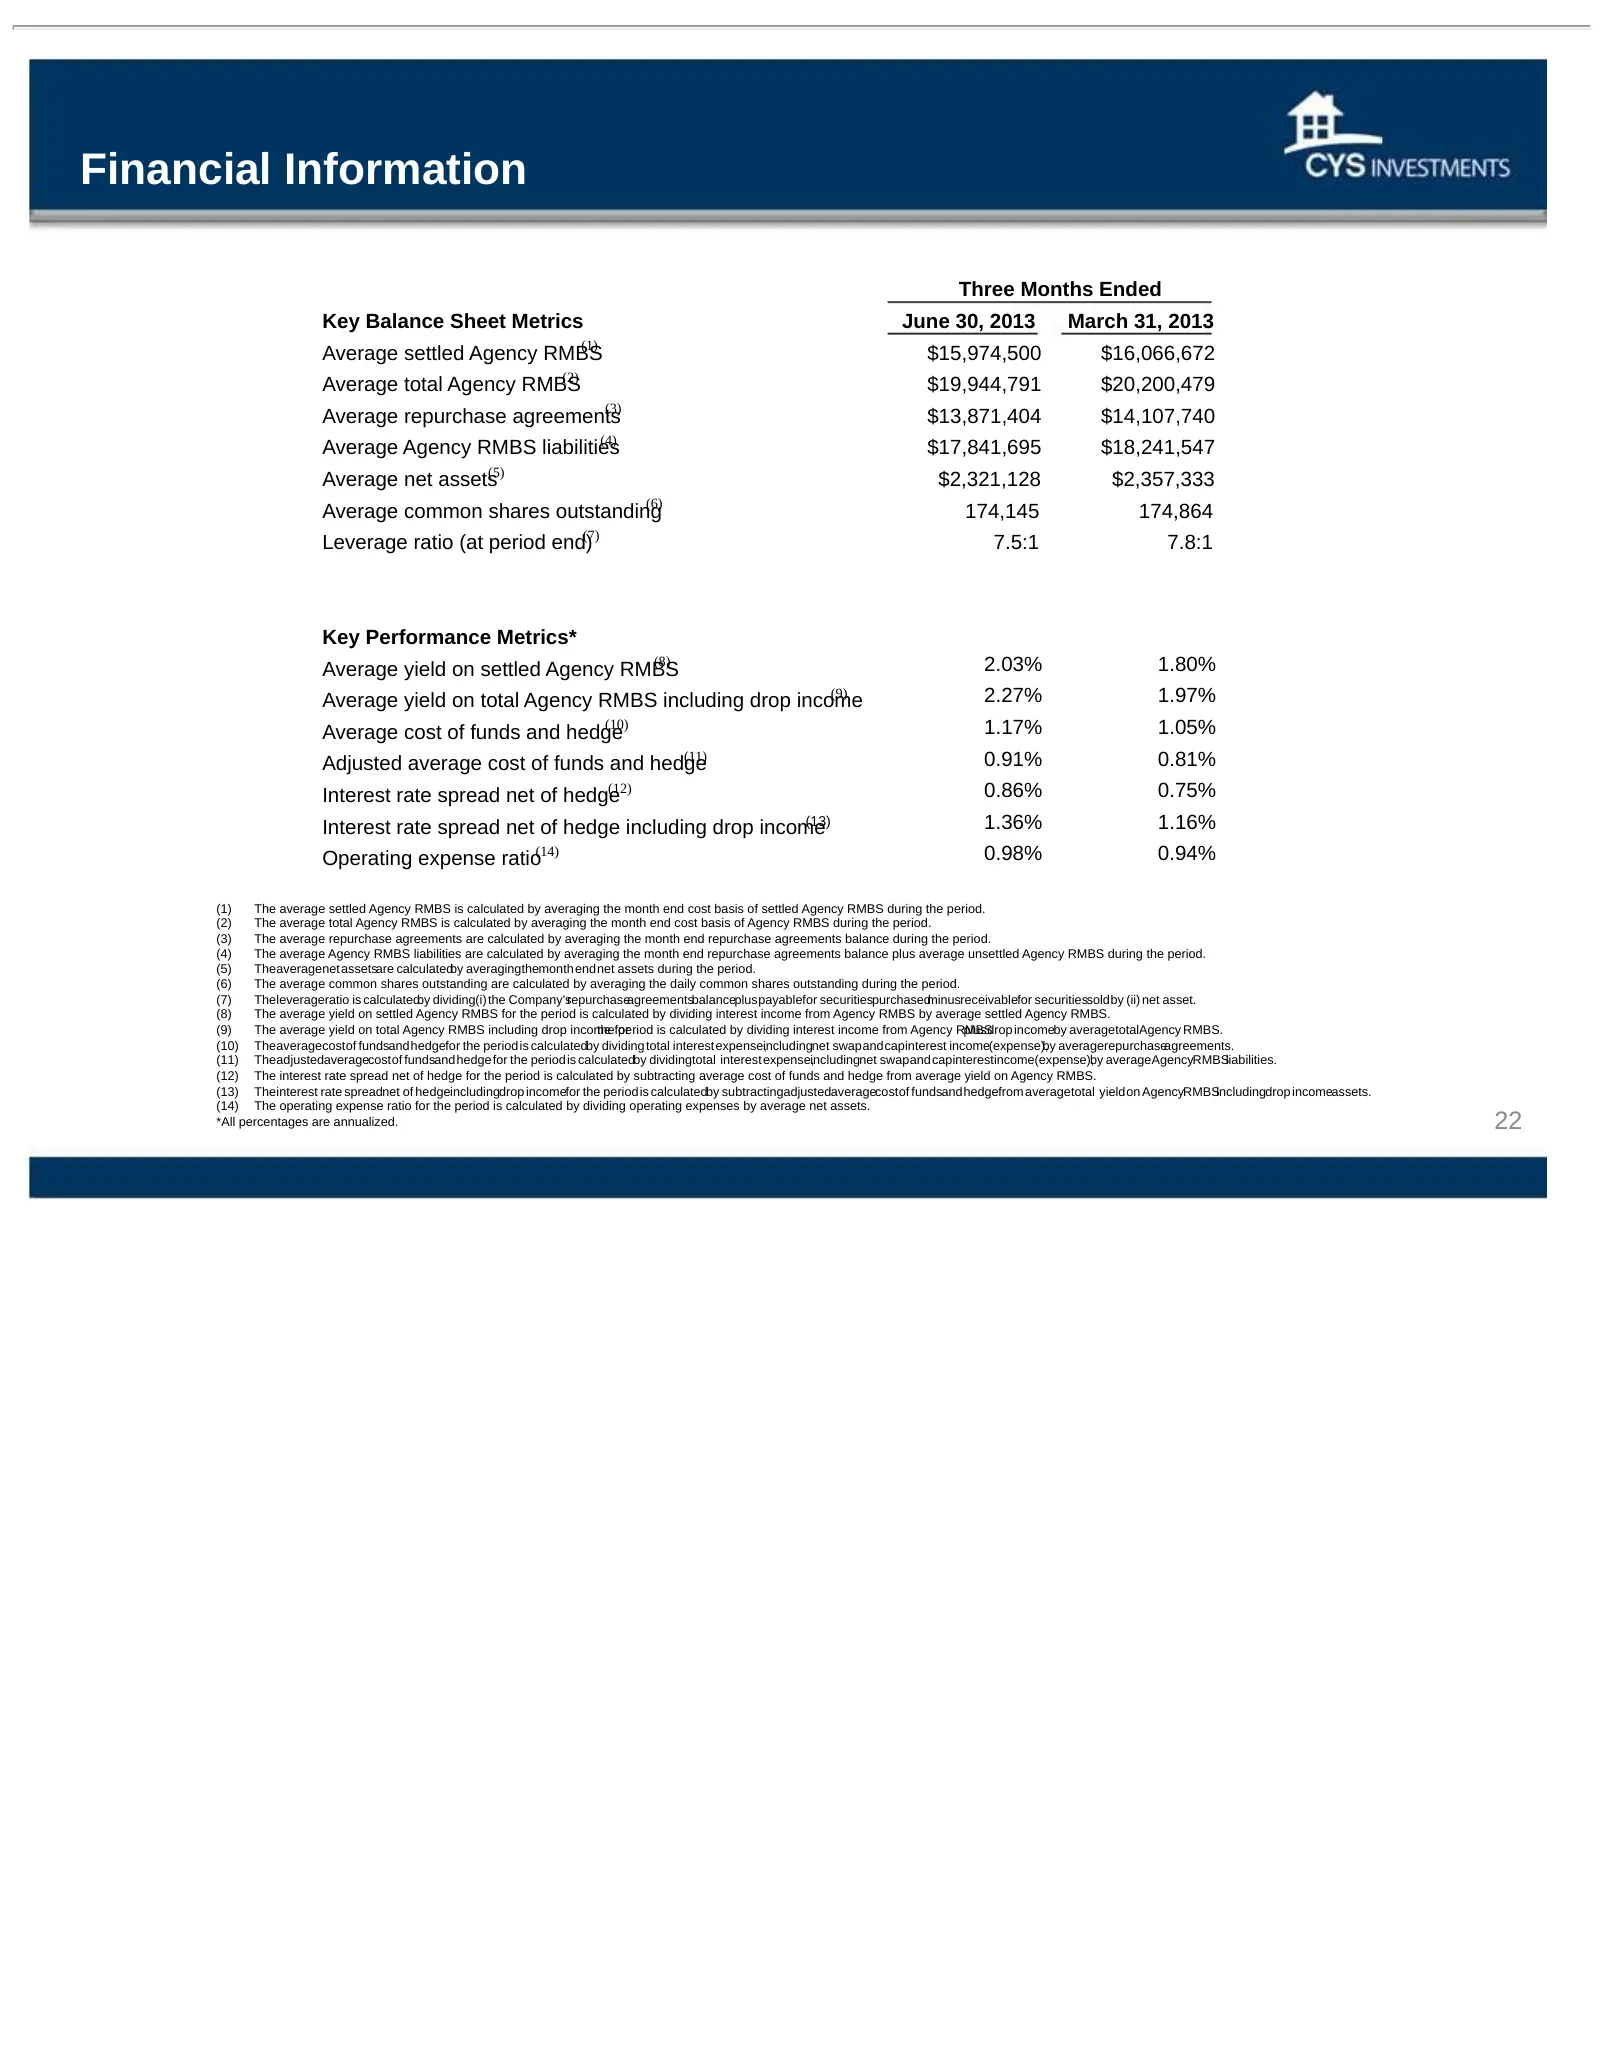
Slide 22: Financial Information
Financial Information Three Months Ended Key Balance Sheet Metrics June 30, 2013 March 31, 2013 (1) Average settled Agency RMBS $15,974,500 $16,066,672 (2) Average total Agency RMBS $19,944,791 $20,200,479 (3) Average repurchase agreements $13,871,404 $14,107,740 (4) Average Agency RMBS liabilities
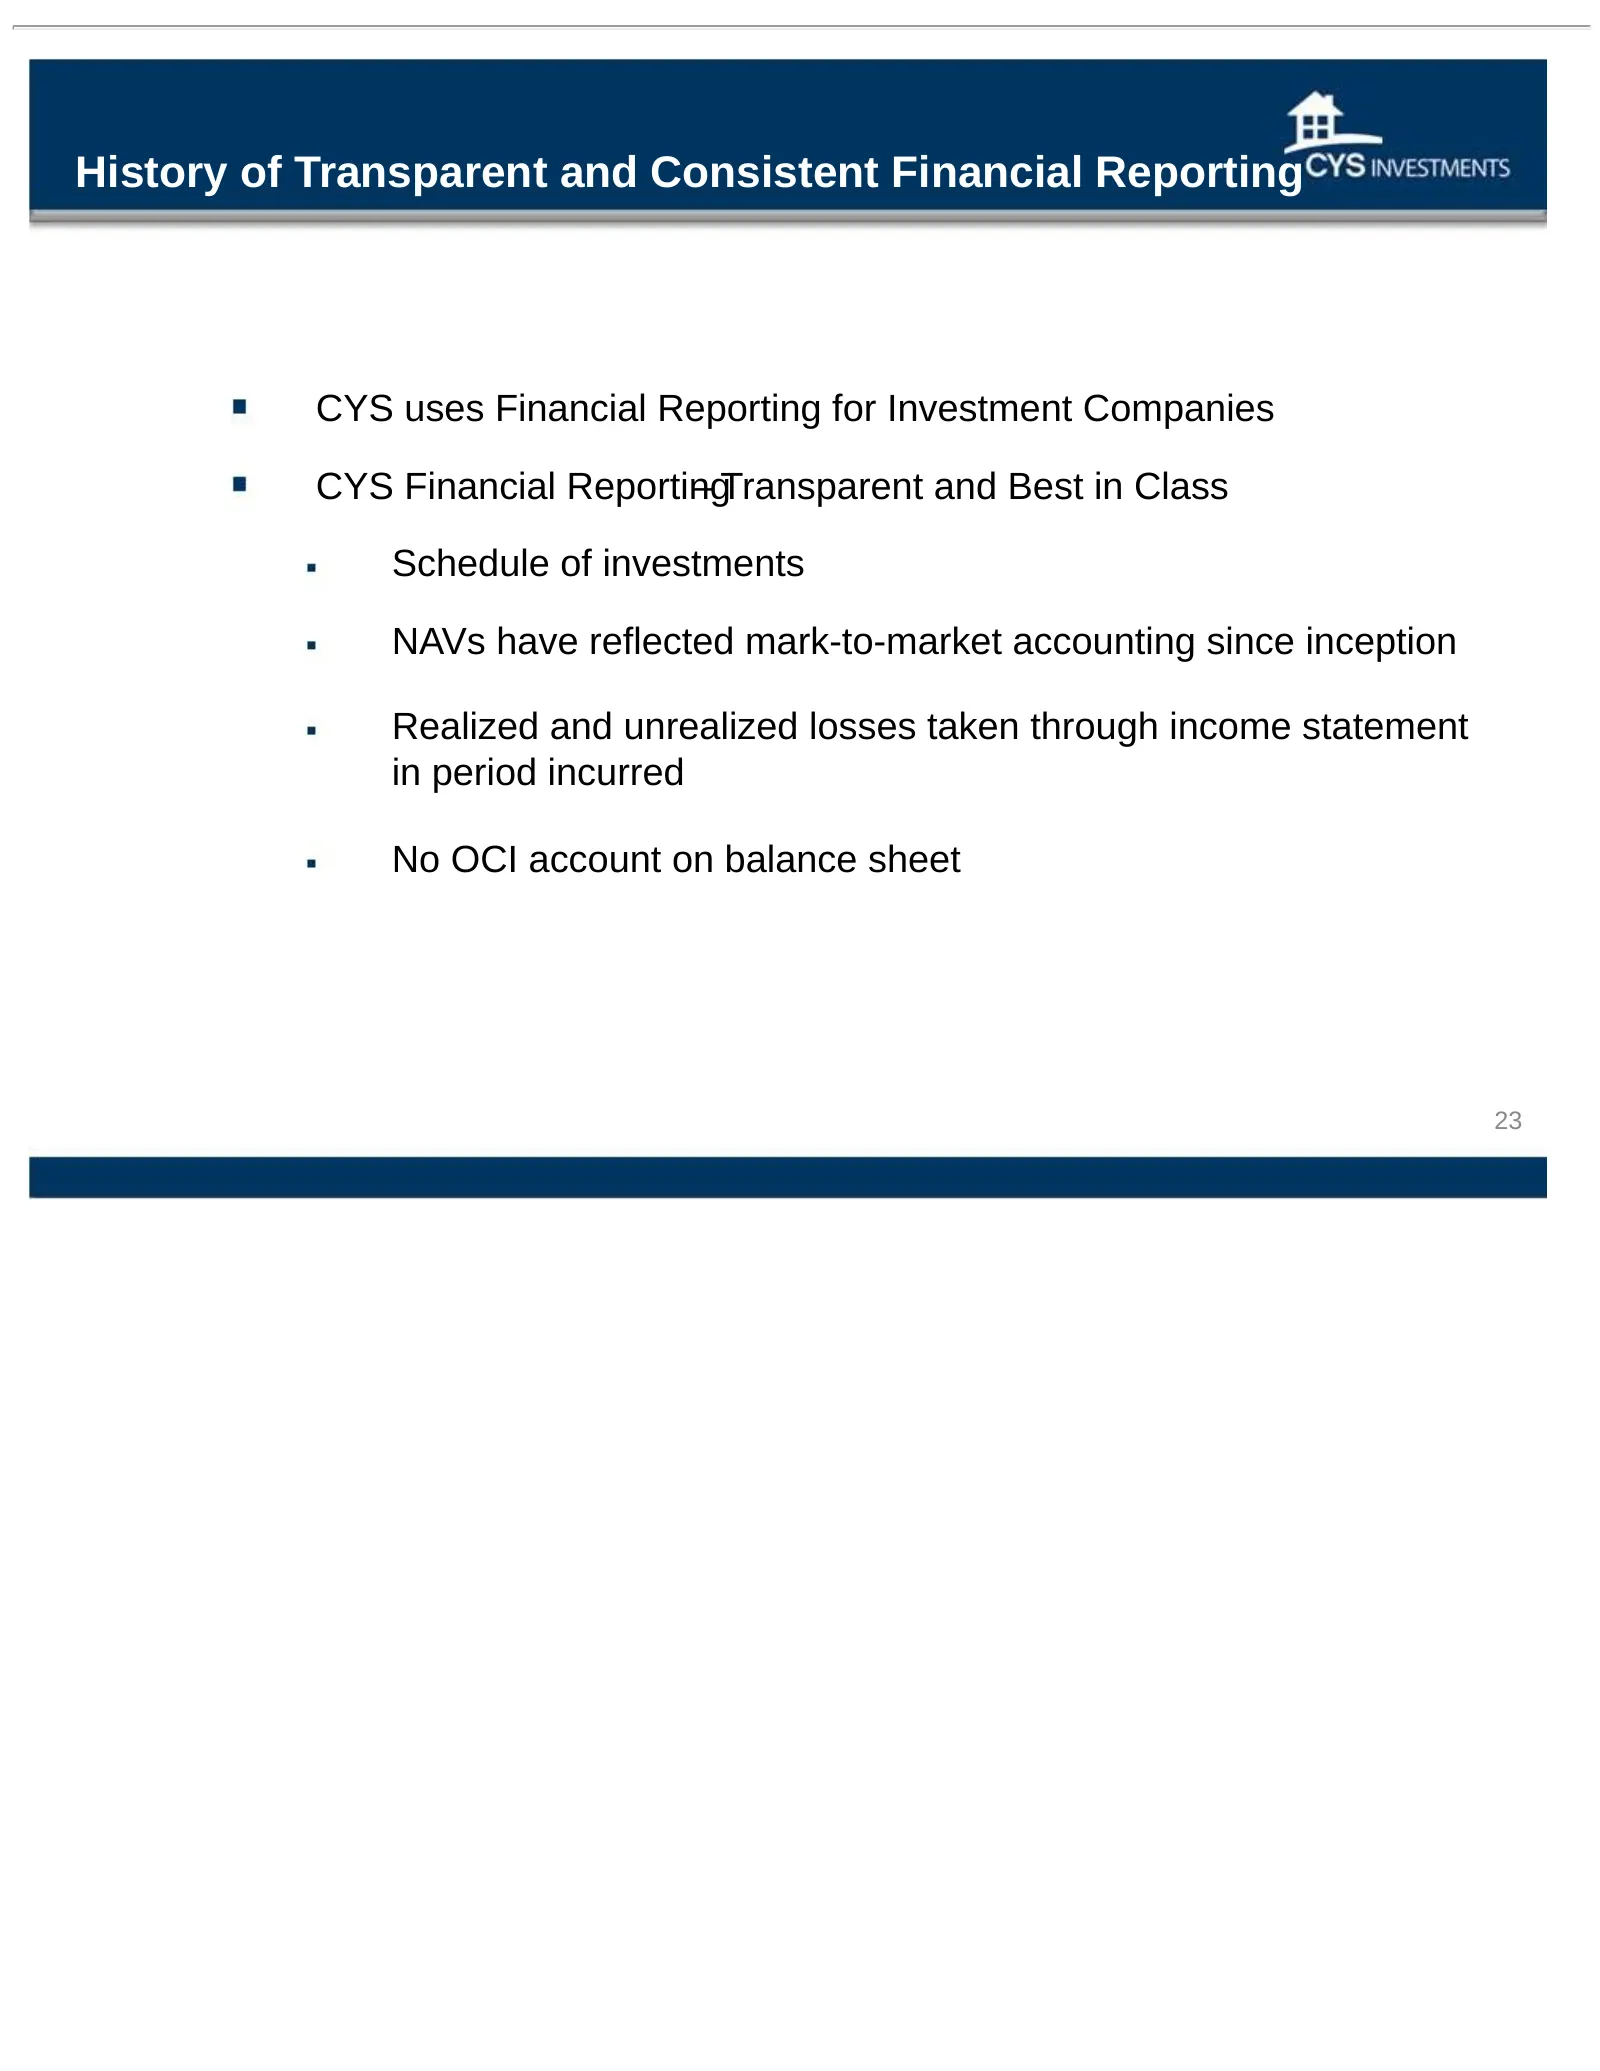
Slide 23: History of Transparent and Consistent Financial Reporting
History of Transparent and Consistent Financial Reporting CYS uses Financial Reporting for Investment Companies CYS Financial Reporting – Transparent and Best in Class Schedule of investments NAVs have reflected mark-to-market accounting since inception Realized and unrealized losses taken through i
Slide 24: Investment Outlook September 2013
Investment Outlook September - 2013 Kevin E. Grant, CFA Chief Executive Officer Barclays Global Financial Services Conference September 10, 2013
Source: SEC EDGAR · 8-K filed Sep 10, 2013
More decks from CYS Investments Inc
 Merger or Acquisition (April 2018)12 slides · Apr 26, 2018
 Barclays Global Financial Services Conference 201724 slides · Sep 11, 2017
 JMP Securities Financial Services and Real Estate Conference 201624 slides · Sep 27, 2016
 Barclays Global Financial Services Conference 201624 slides · Sep 12, 2016
 Proxy Contest (May 2016)8 slides · May 4, 2016
 JMP Securities Financial Services and Real Estate Conference 201522 slides · Sep 21, 2015