KNBT Bancorp — Mid-Atlantic Conference, November 7-8, 2005, Philadelphia
31 slides from KNBT Bancorp's conference presentation, Nov 7, 2005
Slide 1: KNBT Bancorp, Inc. Mid-Atlantic Conference 2005
KNBT Bancorp, Inc. Mid-Atlantic 2005 November 7 th – 8 th Philadelphia, Pennsylvania

Slide 2: Forward-looking statements
The information contained in this presentation may contain forward-looking statements (as defined in the Securities Exchange Act of 1934 and the regulations thereunder) which are not historical facts or as to KNBT Bancorp, Inc. (“KNBT” or the “Holding Company”) management’s intentions, plans, belief

Slide 3: Company Profile
Company Profile § Corporation organized in 2003 § Headquartered in Bethlehem, Pennsylvania § Total assets of $3.1 billion § Keystone Nazareth Bank & Trust is a subsidiary of KNBT Bancorp, Inc. § Largest local community bank serving the Greater Lehigh Valley and Northeast Regions in Pennsylvania § br

Slide 4: The History of KNBT
The History of KNBT § Stock-form successor to Keystone Savings Bank § Mutual-to-stock conversion completed on 10/31/2003 § Conversion raised $202.0 million in capital § Simultaneously acquired First Colonial Group, Inc. § $600 million bank holding company § Headquartered in Northampton County, PA

Slide 5: Technology Initiatives Since Conversion
§ Technology § Installed FISERV CBS platform to execute growth strategy § Upgraded branch/teller system to Windows based platform § Modernized telecommunication systems Initiatives Since Conversion

Slide 6: Initiatives Since Conversion: Dividends and Repurchases
Initiatives Since Conversion § Dividends § April 2004 $.05 per share § April 2005 $.06 per share § October 2005 $.07 per share § Implemented a Stock Repurchase Program § October 2004: Authorized repurchase of 3.1 million shares completed in the third quarter of 2005 § July 2005: Authorized repurchas

Slide 7: Initiatives Since Conversion: Acquisitions
Initiatives Since Conversion § Acquisitions: § Oakwood Financial Corp., November 2004 § Caruso Benefits Group, Inc., April 2005 § Northeast Pennsylvania Financial, May 2005

Slide 8: Oakwood Financial Corp.
Oakwood Financial Corp. § Full-service brokerage firm § Operates as KNBT Securities § Provides a full menu of securities brokerage, insurance and investment advisory products/services § Transaction completed November, 2004 § Purchase price $650,000

Slide 9: Caruso Benefits Group, Inc.
Caruso Benefits Group, Inc. § Operates as a subsidiary of KNBT § Specializes in employee benefits management with an emphasis on group medical, life and disability § Transaction completed in April, 2005

Slide 10: Caruso Benefits Group, Inc. Purchase Terms
Caruso Benefits Group, Inc. § Purchase price $28 million § $20 million paid at closing § $8 million payable over 3 years contingent on Caruso meeting income levels § Transaction is expected to enhance fee income by approximately $5 million annually § $.03 per share accretive to earnings, first full

Slide 11: Northeast Pennsylvania Financial Corp.
Northeast Pennsylvania Financial Corp. § $800 million thrift holding company headquartered in Hazleton, PA § Transaction completed in May, 2005 § Purchase price $90.0 million § Price of $23 per share, 50% stock /50% cash

Slide 12: Northeast Pennsylvania Financial Corp. Franchise
§ full service community offices in the Counties of Monroe, Carbon, Luzerne, Columbia and Schuylkill § $425 million in core deposits § $380 million in loans § $175 million in trust assets Northeast Pennsylvania Financial Corp.

Slide 13: Northeast Pennsylvania Financial Corp. Integration
Northeast Pennsylvania Financial Corp. § Successful integration of operations and systems conversion all completed first business day following acquisition § Surpassed 15% in merger cost efficiencies § Higgins Insurance subsidiary § Provides commercial, property and casualty, and employee benefit li
Slide 14: KNBT Market
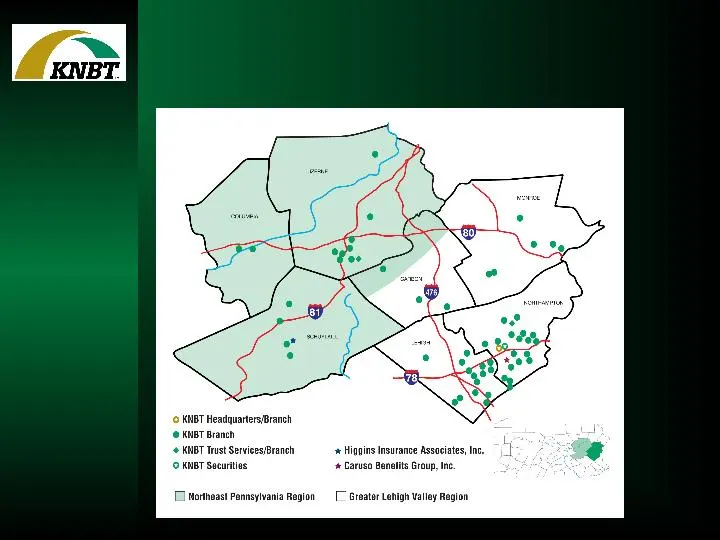
KNBT Market

Slide 15: Deposit Market Share
Deposit Market Share As of June 2005 (Sources FDIC) PA County KNBT Ranking Northampton 21.12% Lehigh 7.63% Carbon 8.30% Monroe 4.32% Luzerne 4.11% Schuylkill 5.94% Columbia 4.46% KNBT Market

Slide 16: KNBT Market
* Source: Morning Call 7/ 17/ 05, Lehigh Valley Metro Area: Northampton, Lehigh, Carbon Counties in PA and Warren County in NJ, based on 2000 U.S. Census. KNBT Market* § The Lehigh Valley metro statistical area is the third largest in population in Pennsylvania § Lehigh Valley is ranked third in pop

Slide 17: Financial Highlights Third Quarter
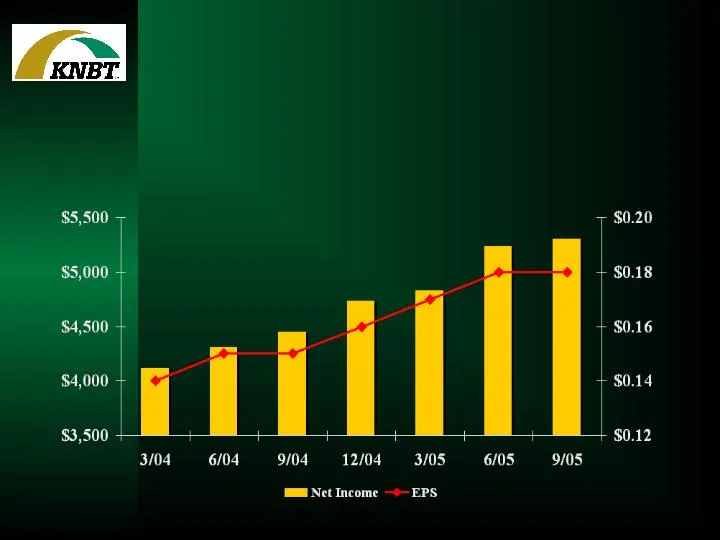
Third Quarter 2005 2004 Change Net Income (000) $5,306 $4,447 19% Earnings per share $0.18 $0.15 20% Dividends per share $0.07 $0.05 40% Return on Average Assets 0.68% 0.81% -16% Return on Average Equity 5.30% 4.68% 13% Efficiency Ratio 63.52% 64.97% -2% Equity to Assets 12.36% 16.83% -27% Tangible
Slide 18: Net Income and Earnings Per Share
$ in thousands Net Income and Earnings Per Share
Slide 19: Net Interest Income and Net Interest Margin
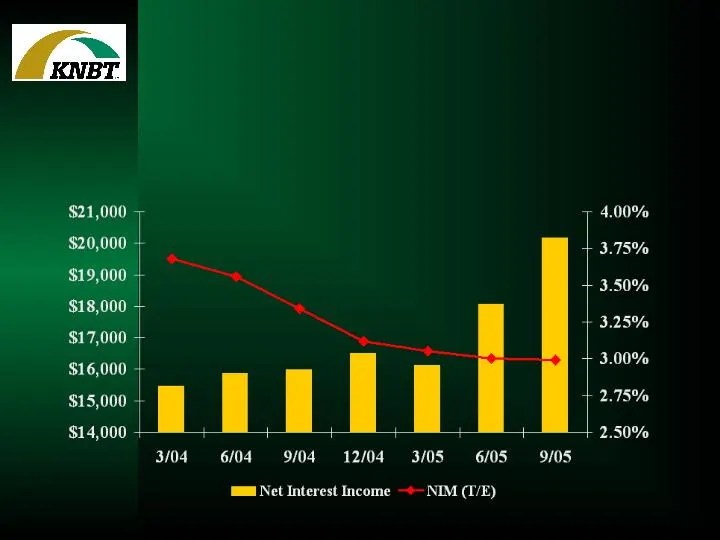
$ in thousands Net Interest Income and Net Interest Margin (T/E)
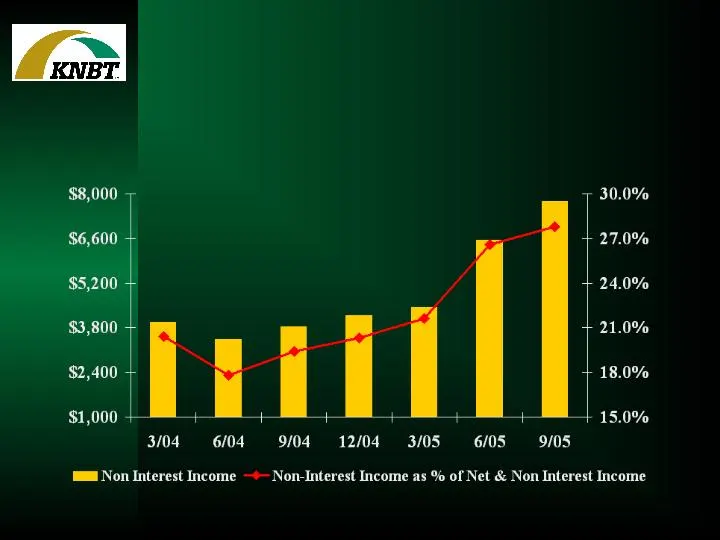
Slide 20: Non-Interest Income
$ in thousands Non-Interest Income
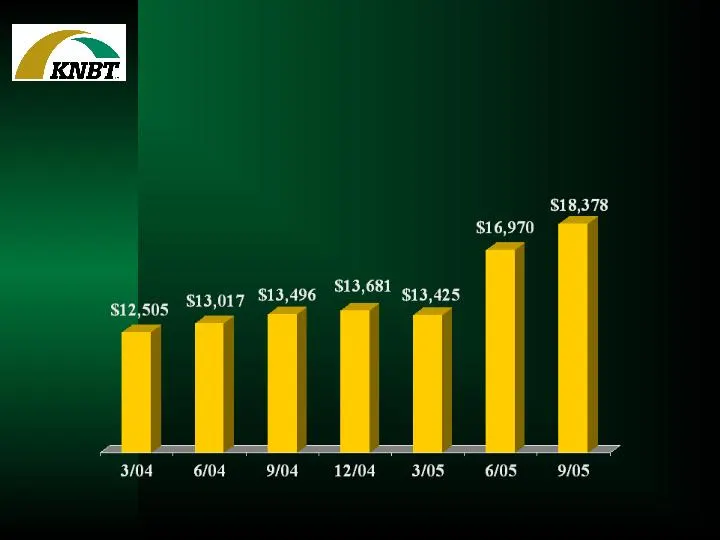
Slide 21: Non-Interest Expense
$ in thousands Non-Interest Expense

Slide 22: Balance Sheet
$ in thousands except per share data At Sept. 30, 2005 % of Assets Net Loans $1,451,609 47% Securities 1,256,913 40% Goodwill and Other Intangible Assets 132,904 4% Total Assets 3,122,402 100% Core Deposits 1,028,874 33% Total Deposits 1,780,003 57% FHLB Advances 814,408 26% Shareholders’ Equity 385
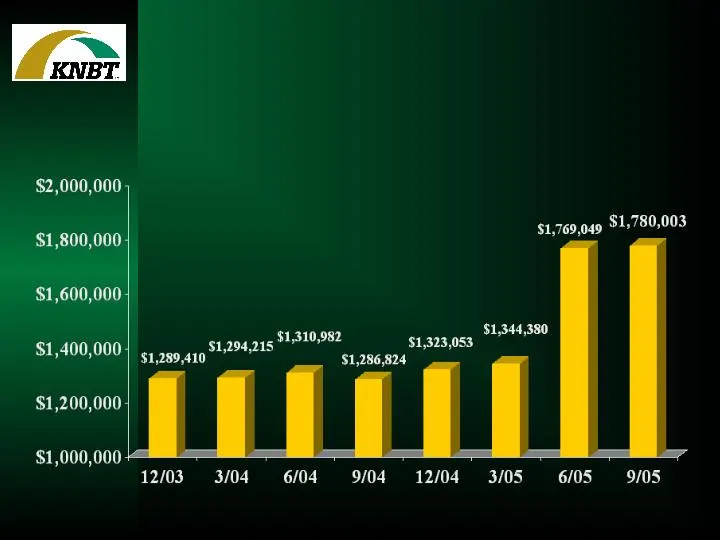
Slide 23: Total Deposits
$ in thousands Total Deposits
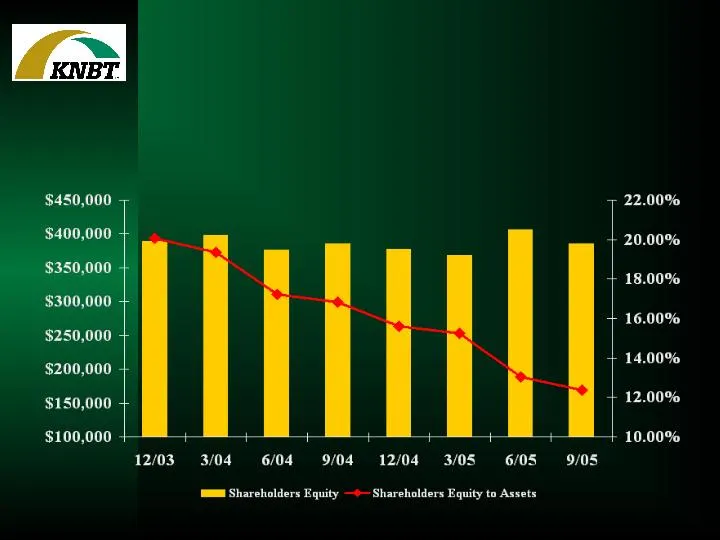
Slide 24: Shareholders' Equity
$ in thousands Shareholders’ Equity
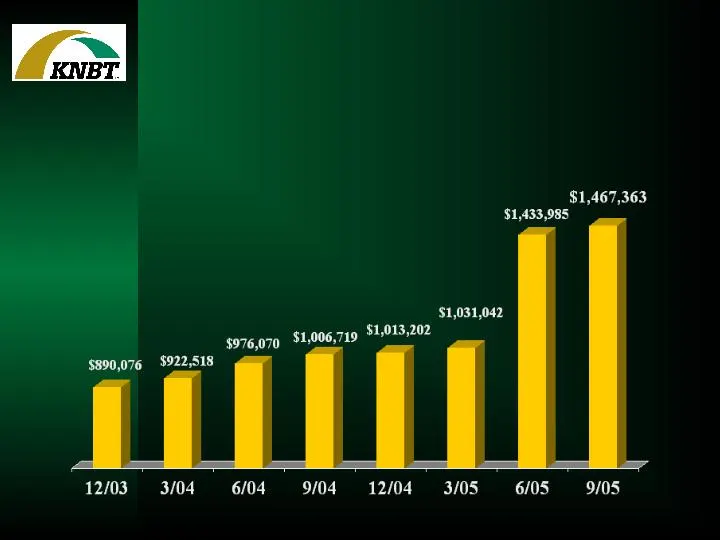
Slide 25: Total Gross Loans
$ in thousands Total Gross Loans

Slide 26: Composition of Loans
Sept. 30 2005 June 30, 2005 Sept. 30 2004 Commercial $ 506,669 481,540 327,688 Mortgage 469,760 461,694 380,604 Consumer 490,934 490,751 298,427 Total Gross Loans $1,467,363 $1,433,985 $1,006,719 $ in thousands Composition of Loans
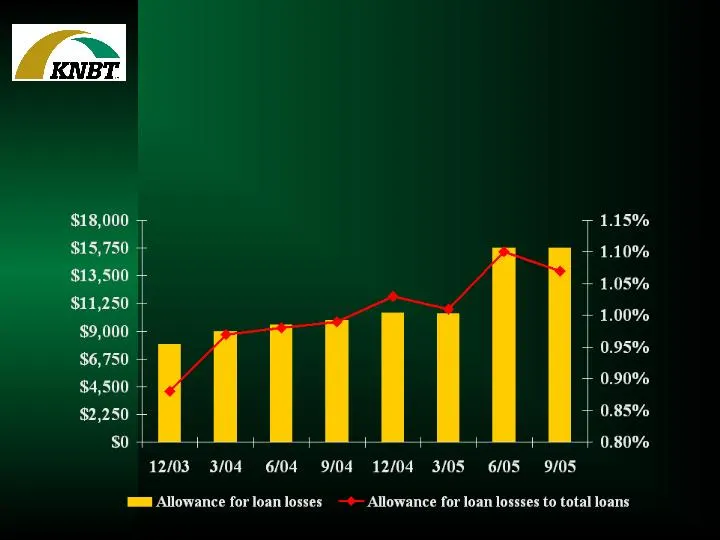
Slide 27: Asset Quality: Allowance for Loan Losses
$ in thousands Asset Quality Allowance for Loan Losses
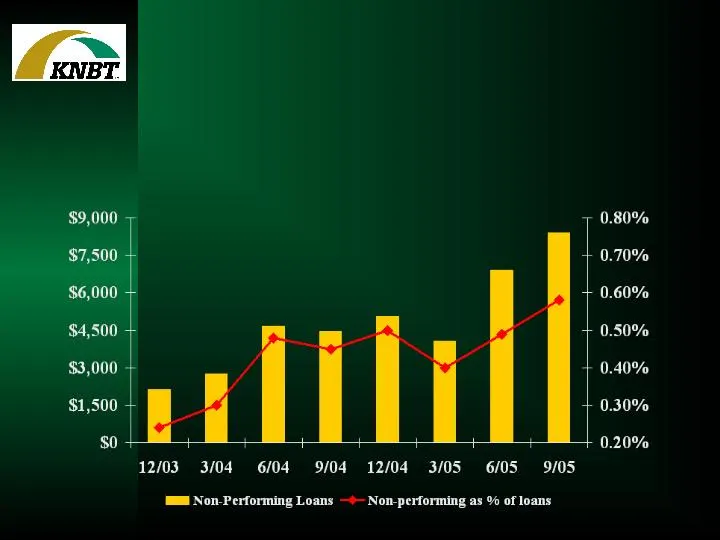
Slide 28: Asset Quality: Total Non-Performing Loans
$ in thousands Asset Quality Total Non-Performing Loans

Slide 29: Management Team
Scott V. Fainor President & Chief Executive Officer Eugene T. Sobol Senior EVP, Chief Financial Officer & Treasurer John T. Andreacio EVP, Regional President, Northeast Region Deborah R. Goldsmith EVP, Retail Lending/Admin. Sandra L. Bodnyk EVP, Chief Risk Officer David B. Kennedy EVP, Regional Pres

Slide 30: Goals for Success
Goals for Success § Grow core deposit relationships § Grow and diversify loan portfolio § Grow and diversify fee income § Franchise expansion through organic growth, de novo branching and bank and non-bank acquisitions
Slide 31: Banking, Insurance, Investments
BANKING INSURANCE INVESTMENTS KNBT. sus:
Source: SEC EDGAR · 8-K filed Nov 7, 2005
More decks from KNBT Bancorp Inc
 Bank Director Magazine "Acquire or Be Acquired" Conference 200810 slides · Jan 28, 2008
 Q4 2007 Earnings Presentation7 slides · Jan 22, 2008
 Sandler O'Neill & Partners East Coast Financial Services Conference (November 2007)32 slides · Nov 13, 2007
 Q3 2007 Earnings Presentation9 slides · Oct 16, 2007
 Investor Presentation (August 2007)25 slides · Aug 8, 2007
 Shareholder Meeting (May 2007)20 slides · May 3, 2007