Bridge Capital — Shareholder Meeting (May 2009)
47 slides from Bridge Capital's shareholder meeting presentation, May 22, 2009

Slide 1: 9th Annual Shareholders Meeting
CAPITAL HOLDINGS 9" Annual Shareholders Meeting May 21, 2009 Daniel P. Myers Allan C. Kramer, M.D. BRIDGE CAPITAL HOLDINGS President Chairman NASDAQ: BENK Chief Executive Officer BRIDGECAPITALHGLDINGS.cOM
Slide 2: Forward Looking Statements
Forward Looking Statements Certain matters discussed herein constitute forward-looking statements within the meaning of the Private Securities Litigation Reform Act of 1995, and are subject to the safe harbors created by that Act. Forward-looking statements describe future plans, strategies, and exp

Slide 3: Chairman's Presentation
CAPITAL HOLDINGS be) 8 aa ma. 7 | es z eo 2 A a CHAIRMAN’S i PRESENTATION BRIDGE CAPITAL HOLDINGS Allan C. Kramer, M.D. NASD. K Chairman BRIDGECAPITALHOLDINGS, COM
Slide 4: Board of Directors
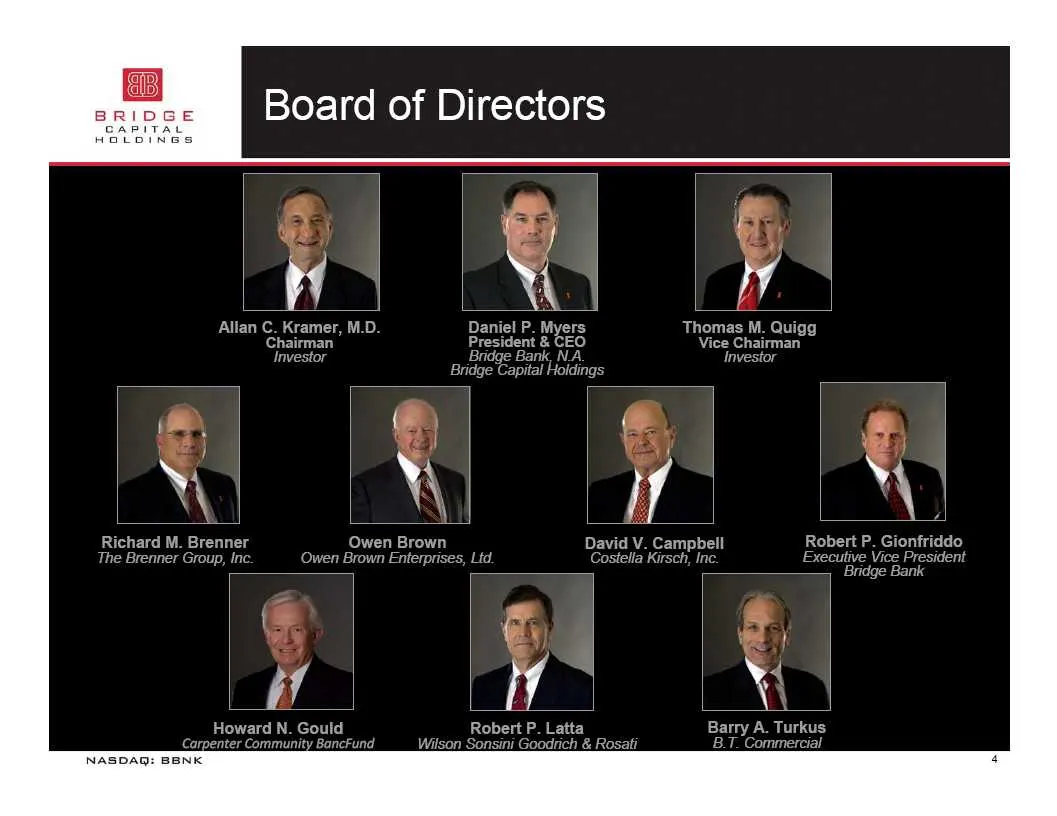
Allan C. Kramer, M.D. Chairman Daniel P. Myers pet & CEO Thomas M. Quigg Vice Chairman Investor t ‘\ Owen Brown Brown Enterprises, Richard M. Brenner The Brenner Group, Inc. Owen Robert P. Gionfriddo David V. Campbell Executive Vice President Costella Kirsch, Inc. il Bridge Bank Howard N. Gould ‘omm

Slide 5: Board of Directors (continued)
Margaret M. Bradshaw Robert P. Kenneth B. Silveira Allen G. Williams Jeannie Ki Ruval NASDAQ: BBNK
Slide 6: Shareholder Briefing
™~ @ SHAREHOLDER X BRIEFING Daniel P. Myers BRIDGE CAPITAL HOLDINGS President NASD: K Chief Executive Officer
Slide 7: Presentation Segments
BRIDGE CAPITAL Presentation Segments Environment & Perspective Tough Decisions/Decisive Actions Financial Results Equity Performance Financial Strength & Positioning Looking Ahead So Ff SOLS
Slide 8: Environment & Perspective
reas Environment & Perspective Extraordinary Actions In An Extraordinary Year
Slide 9: "Unprecedented and Inconceivable"
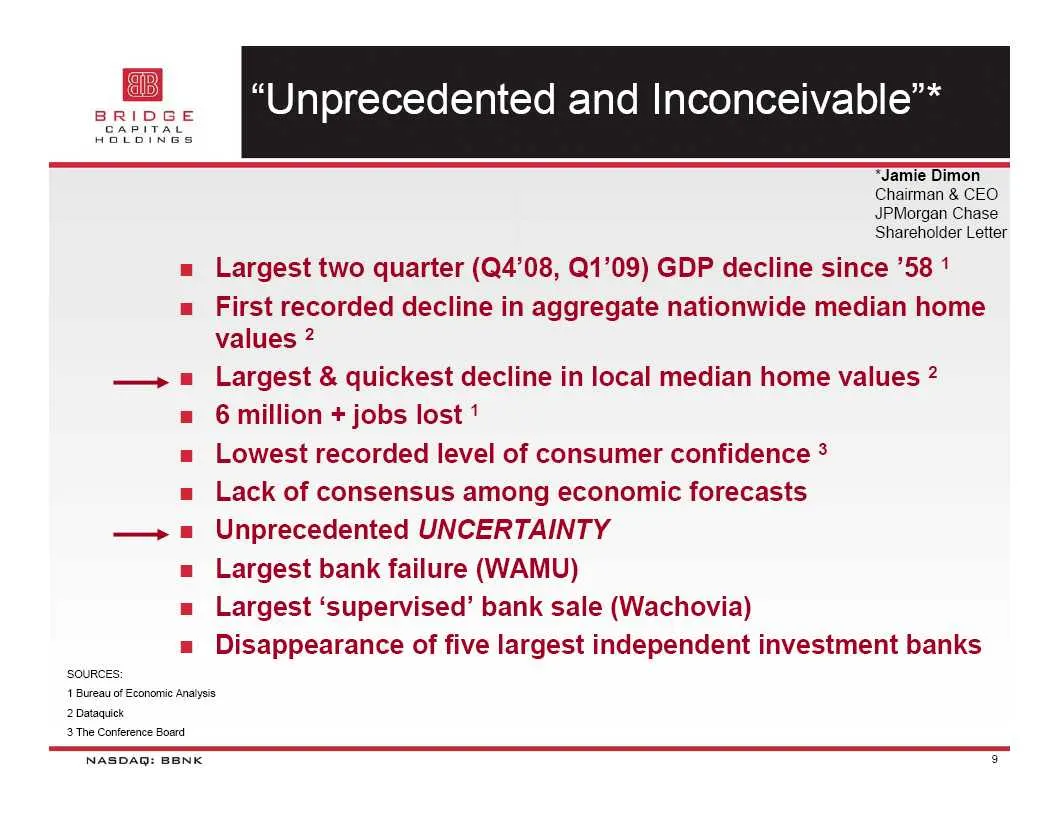
“Unprecedented and Inconceivable”* ‘SOURCES: 1 Bureau of Economie Analysis 2 Dataquick 3 The Conference Board NASDAQ: BBNK =Jamie Dimon Chairman & CEO JPMorgan Chase Shareholder Letter Largest two quarter (Q4’08, Q1’09) GDP decline since ’58 ' First recorded decline in aggregate nationwide median ho
Slide 10: Extraordinary Environment, Decisive Actions
few &xtraordinary Environment DECISIVE ACTIONS NASDAQ: BBNK
Slide 11: Tough Decisions/Decisive Actions
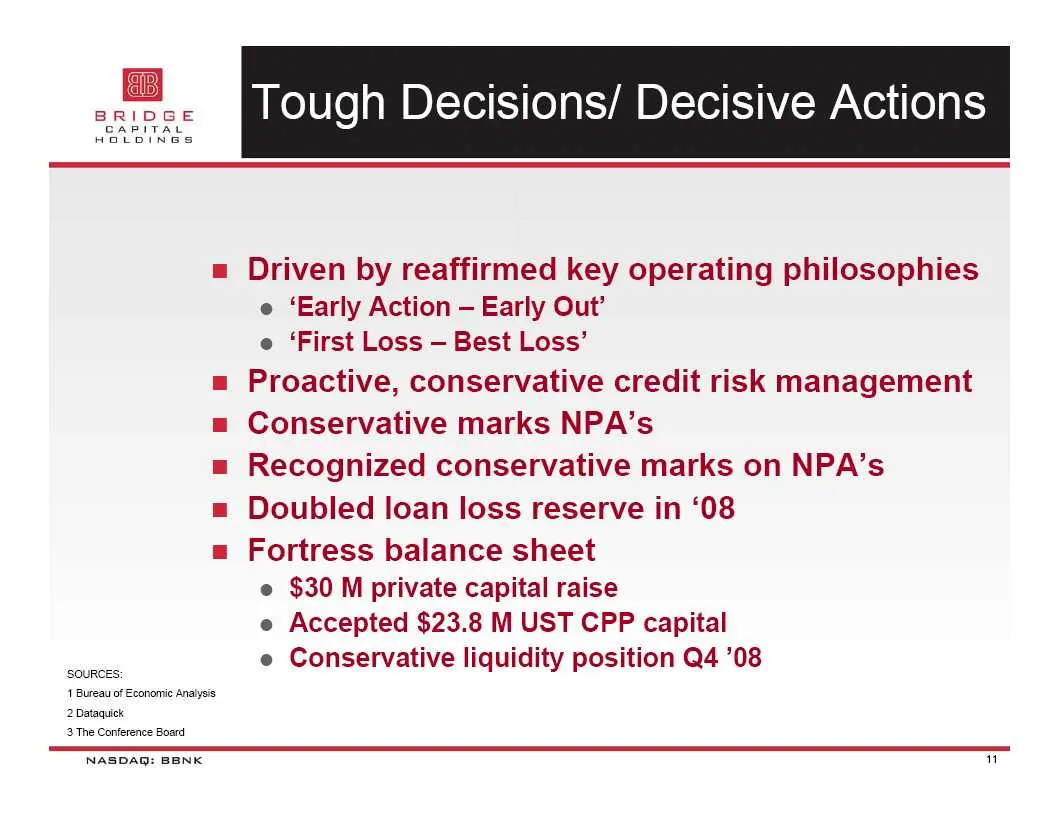
Tough Decisions/ Decisive Actions = Driven by reaffirmed key operating philosophies e ‘Early Action — Early Out’ e ‘First Loss — Best Loss’ Proactive, conservative credit risk management Conservative marks NPA’s Recognized conservative marks on NPA’s Doubled loan loss reserve in ‘08 Fortress balance
Slide 12: Financial Results
BRIDGE CAPITAL NASDAQ: BBNK FINANCIAL RESULTS
Slide 13: Proactive Credit Risk Management
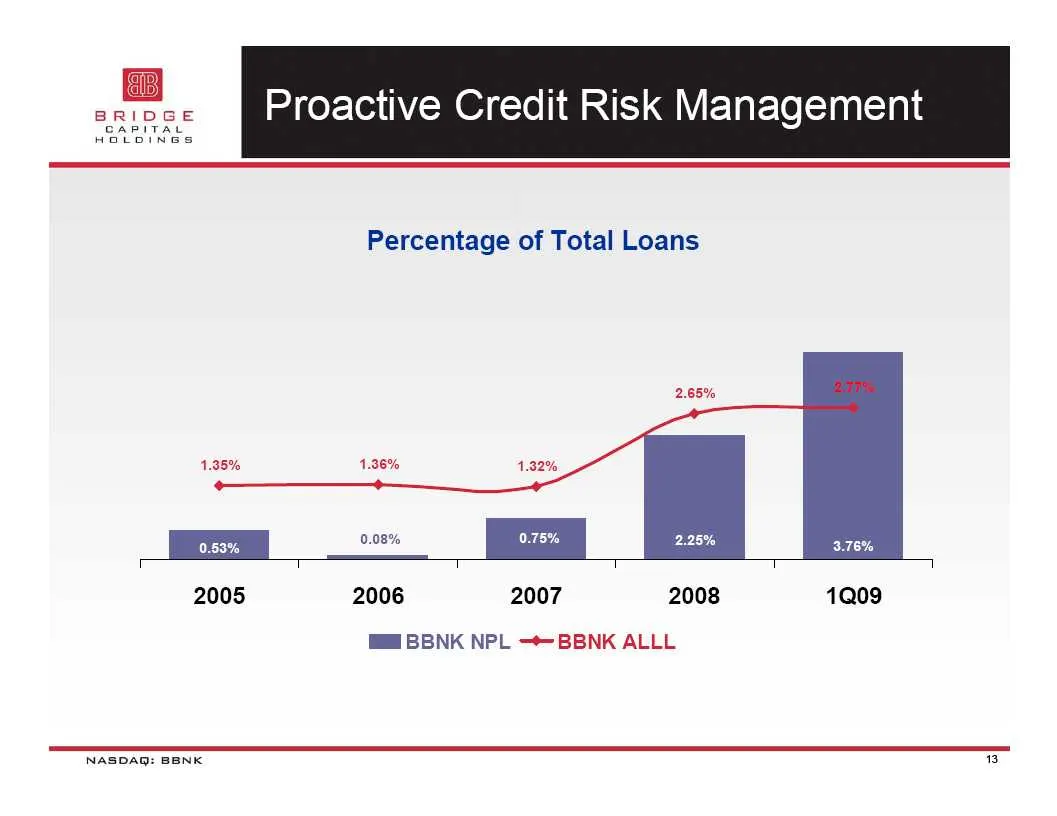
Proactive Credit Risk Management Percentage of Total Loans 1.35% | oss% | 0.08% 0.75% 2005 2006 2007 2008 1Q09 Wl BBNK NPL -BBNK ALLL NASDAQ: BBNK 3
Slide 14: Proactive Credit Risk Management
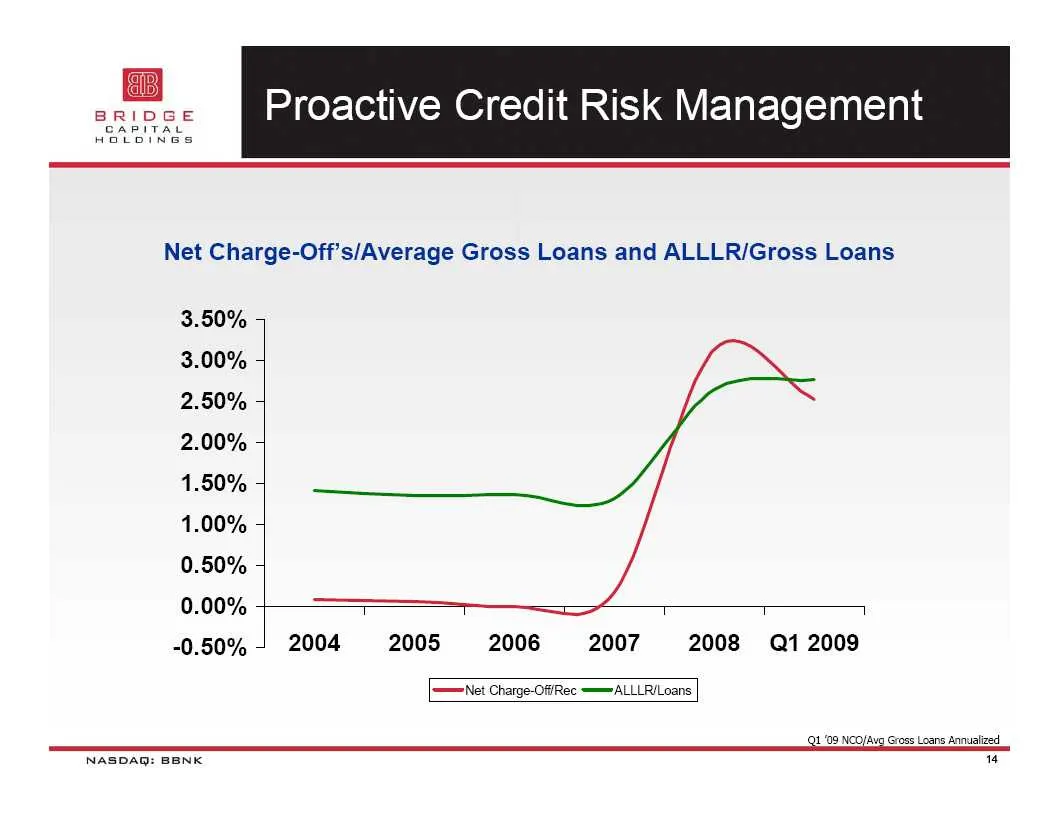
Proactive Credit Risk Management Net Charge-Off’s/Average Gross Loans and ALLLR/Gross Loans 3.50% 5 3.00% 5 2.50% 5 2.00% 5 1.50% + 1.00% + 0.50% + 0.00% T T T 1 -0.50% - 2004 2005 2006 2007 2008 Q1 2009 [Net Charge-OffRec —=ALLLRILoans {9109 NoOjAug Gross Loans Annualized NASDAQ: BBNK 4
Slide 15: Net income and earnings per diluted share
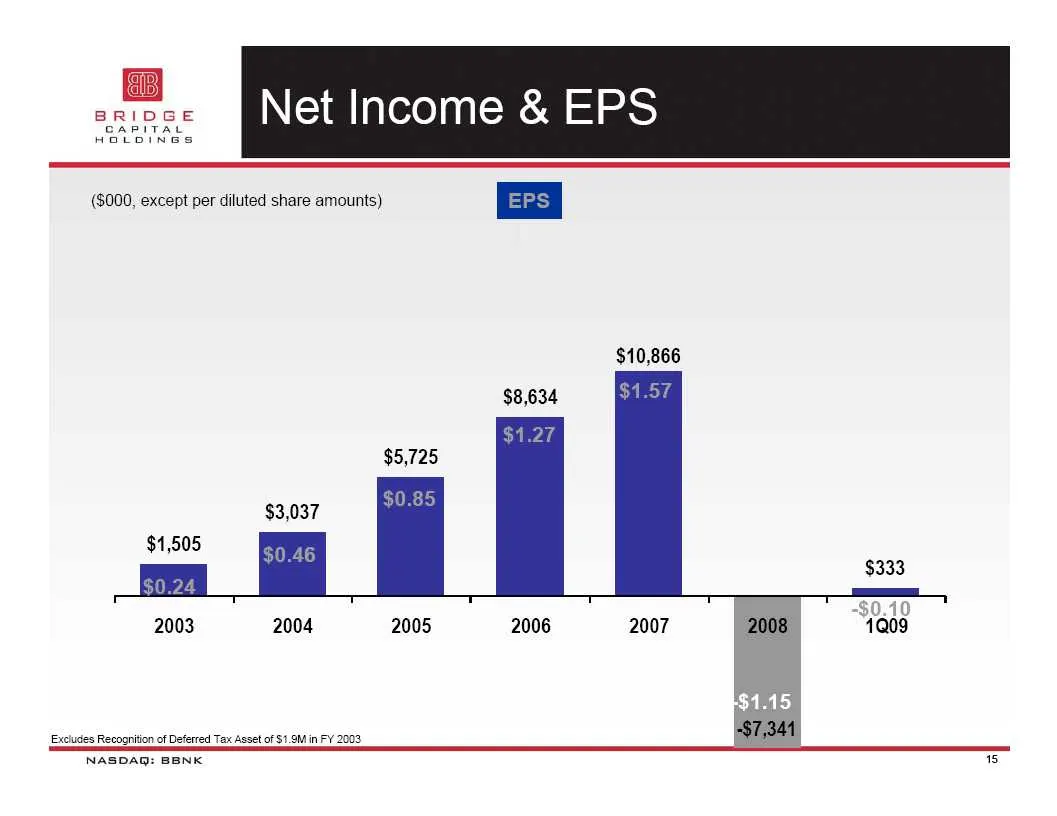
(8000, except per diluted share amounts) $10,866 $8,634 2005 2006 2007 Excludes Recognition of Deferred Tax Asset of $1.9M in FY 2002 NASDAQ: BBNK 1S
Slide 16: Pre-tax, Pre-provision Operating Income
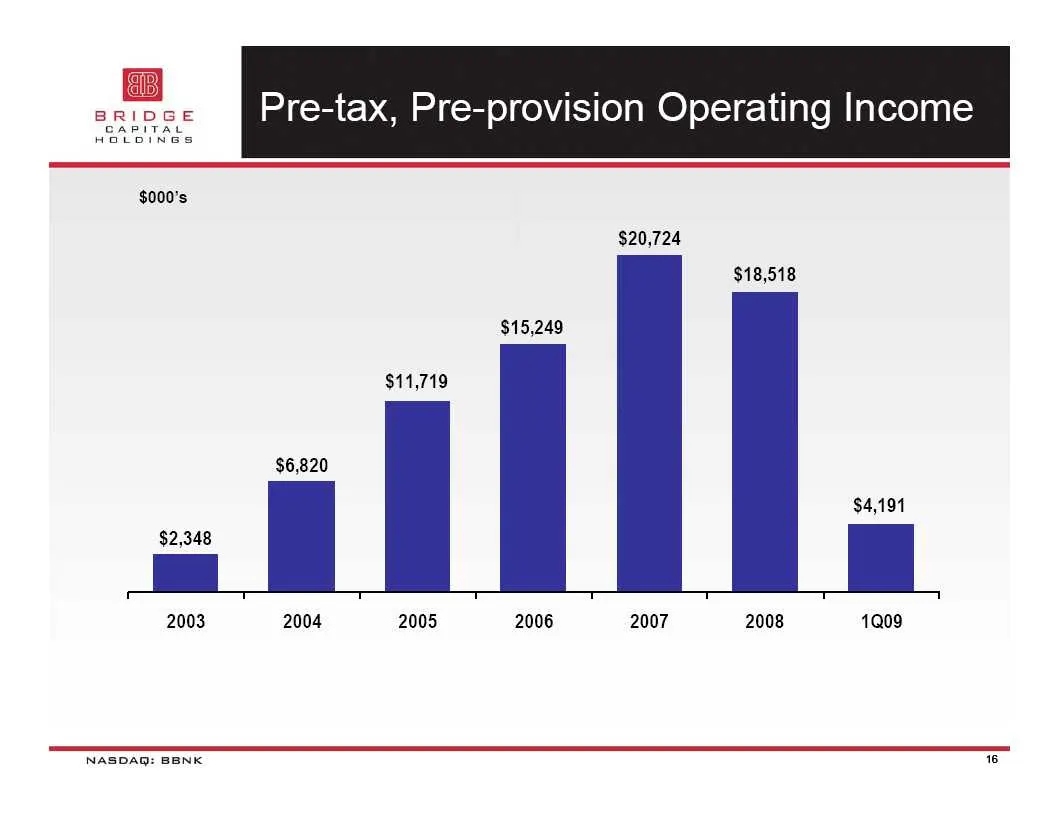
Pre-tax, Pre-provision Operating Income $20,724 $18,518 $15,249 $11,719 $6,820 $4,191 = LI] 2003 2004 2005 2006 2007 2008 1Q09 NASDAQ: BBNK 16
Slide 17: Equity Performance
BRIDGE CAPITAL NASDAQ: BBNK EQUITY PERFORMANCE
Slide 18: Commercial Bank Profit Trend
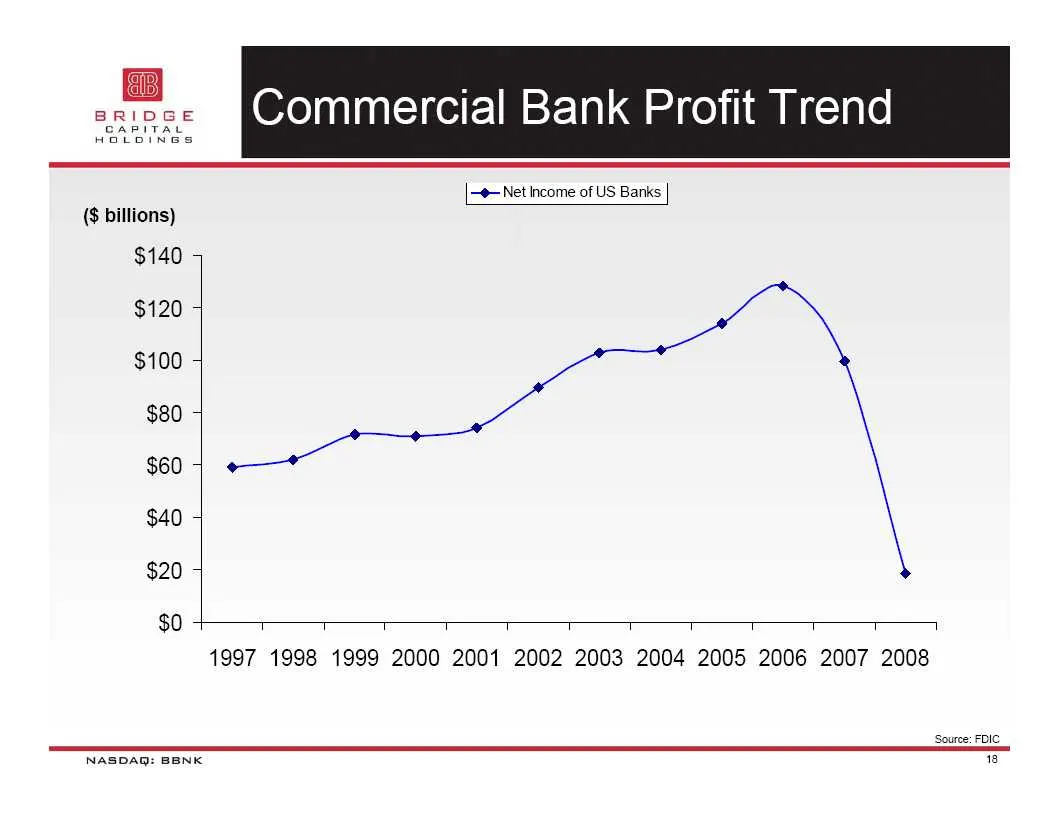
Commercial Bank Profit Trend ($ billions) $140 5 $120 5 $100 + $80 + $60 7 $40 7 $20 4 $0 —@ Net Income of US Banks NASDAQ: BBNK 1997 1998 1999 2000 2001 2002 2003 2004 2005 2006 2007 2008 Source: FDIC 8
Slide 19: BBNK - One Year Stock Price Performance
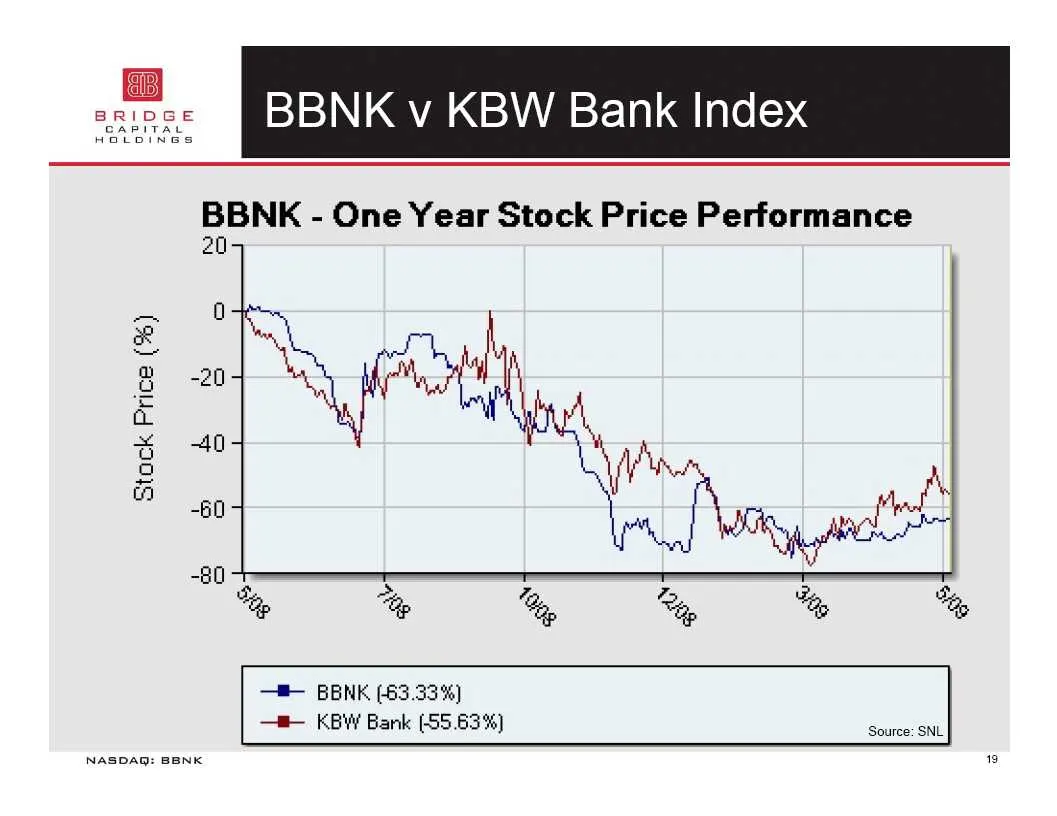
BBNK - One Year Stock Price Performance 20 o Stock Price (94) % % By, Pa, % % = BBNK (63.33%) =~ KBW Bank (55.63%) Source! SNL NasDal GQ: BBNK 19
Slide 20: BBNK Performance - Peer Analysis
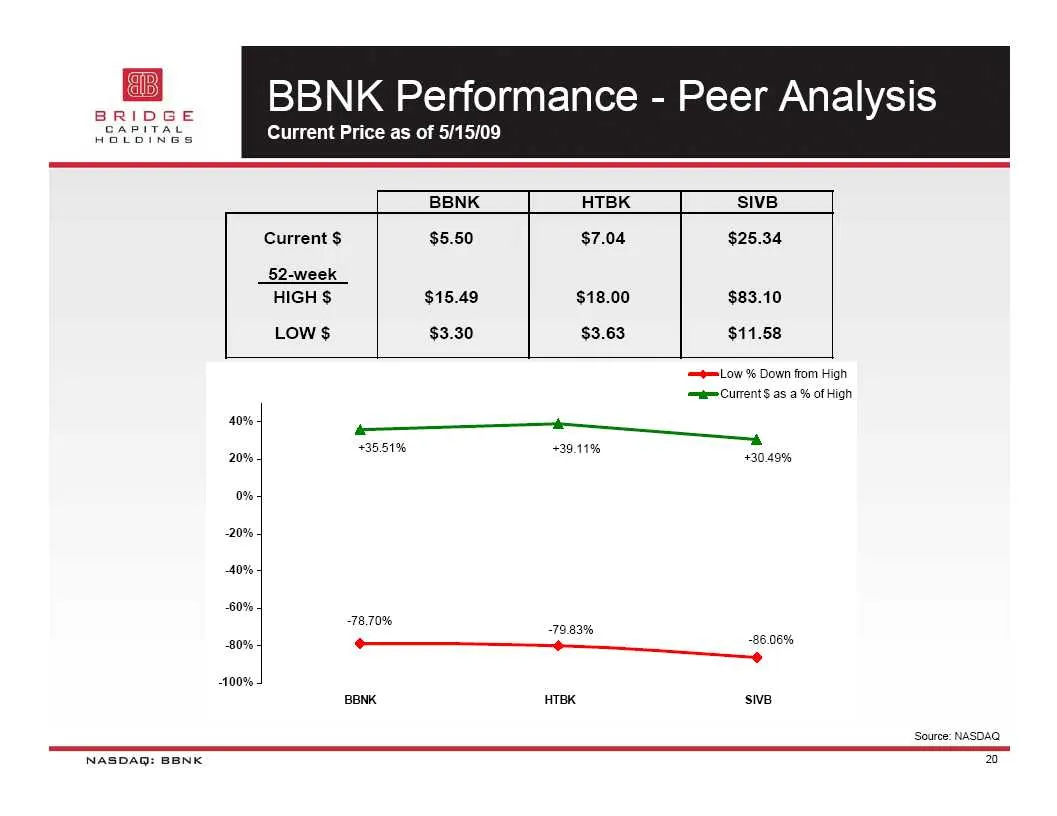
BBNK Performance - Peer Analysis Current Price as of 5/15/09 BBNK HTBK SIVB Current $ $5.50 $7.04 $25.34 52-week HIGH $ $15.49 $18.00 $83.10 Low $ $3.30 $3.63 $11.58 =e Low % Down from High =e Curent as a% of High +35.51% +39.11% 20% +30.49% o% 20% 40% 50% “Tae 73.83% . 20% a el 100% BENK TAK sive S
Slide 21: BBNK Price/Book Value
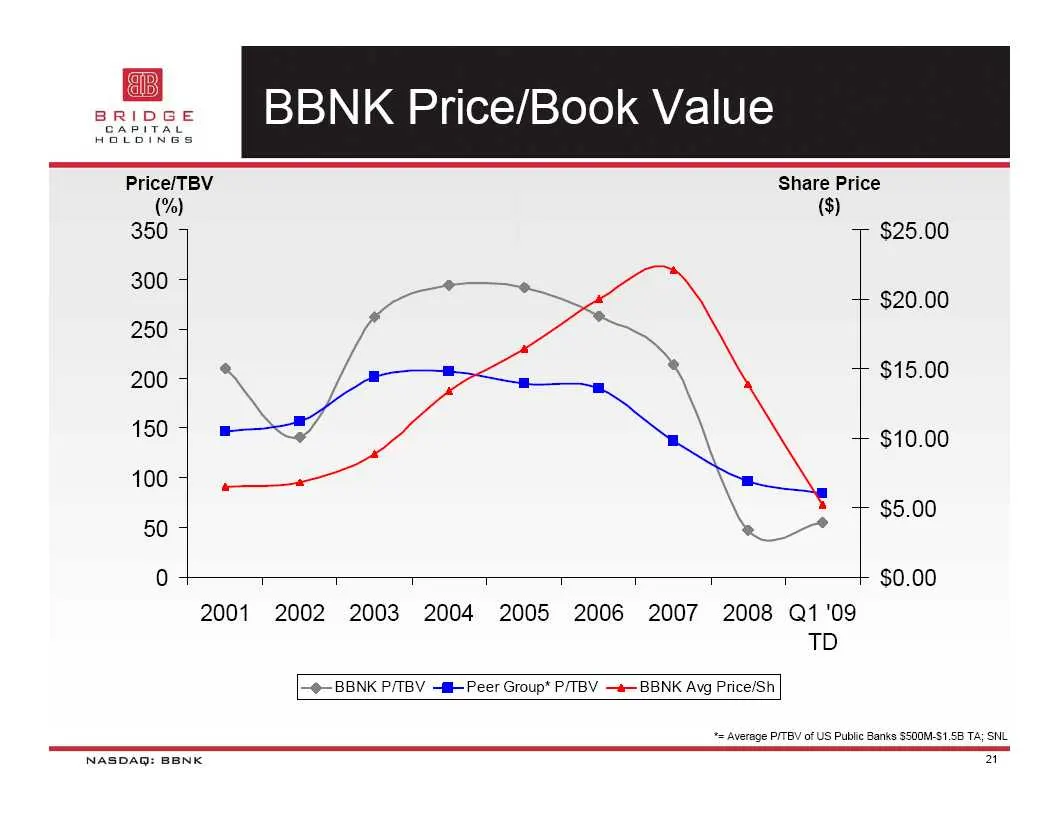
BBNK Price/Book Value Price/TBV Share Price (%) ($) 350 4 7 $25.00 300 5 + $20.00 250 + 200 4 + $15.00 150 5 + $10.00 100 5 + $5.00 50 5 0 T T T T T T T T $0.00 2001 2002 2003 2004 2005 2006 2007 2008 Q1'09 TD —@—BBNK P/TBV -™- Peer Group* P/TBV —a—BBNK Avg Price/Sh *= Average P/TBV of US Public Ban
Slide 22: Shares Traded by NASDAQ Listing Tier
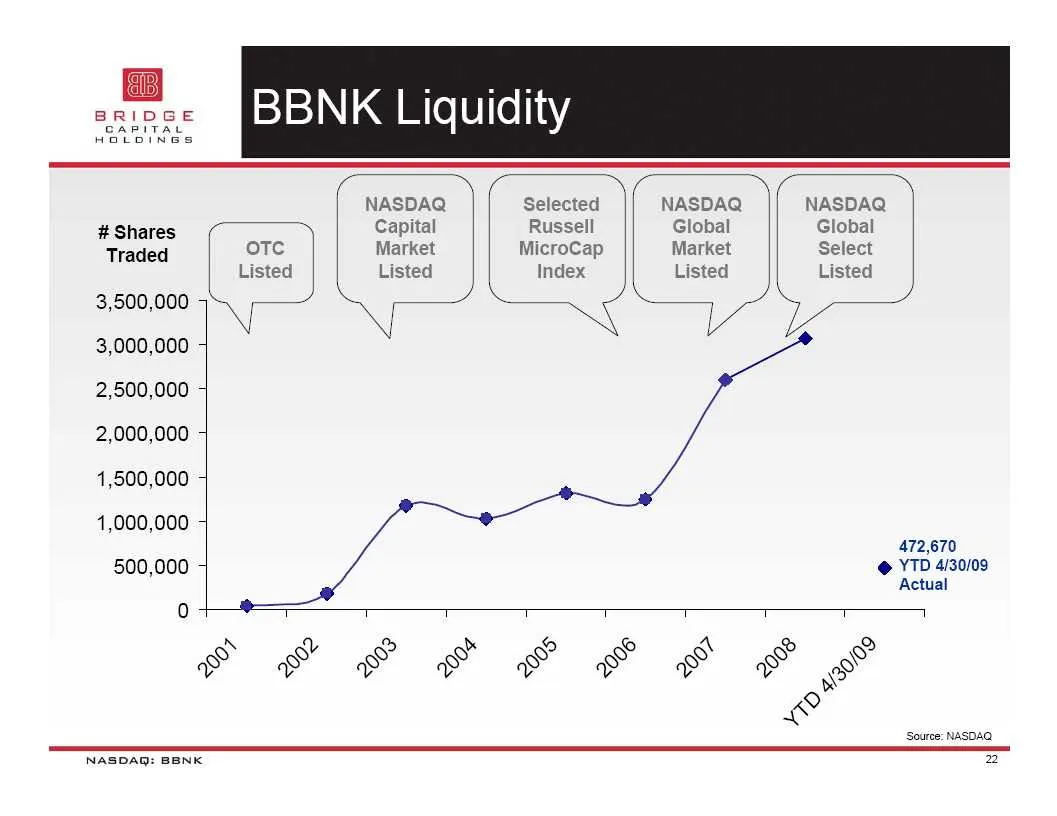
NASDAQ Selected NASDAQ NASDAQ # Shares Capital Russell Global Global Traded oTc Market MicroCap Market Select Listed Listed Index Listed Listed 3,500,000 5 \) v i ee 3,000,000 + 2,500,000 + 2,000,000 + 1,500,000 - 1,000,000 472,670 500,000 + @ YTD 4/30/09 Actual ie} T T T T T T T T 1 yy Vv we) “a <a
Slide 23: Financial Strength & Positioning
FINANCIAL STRENGTH & POSITIONING NASDAQ: BBNK
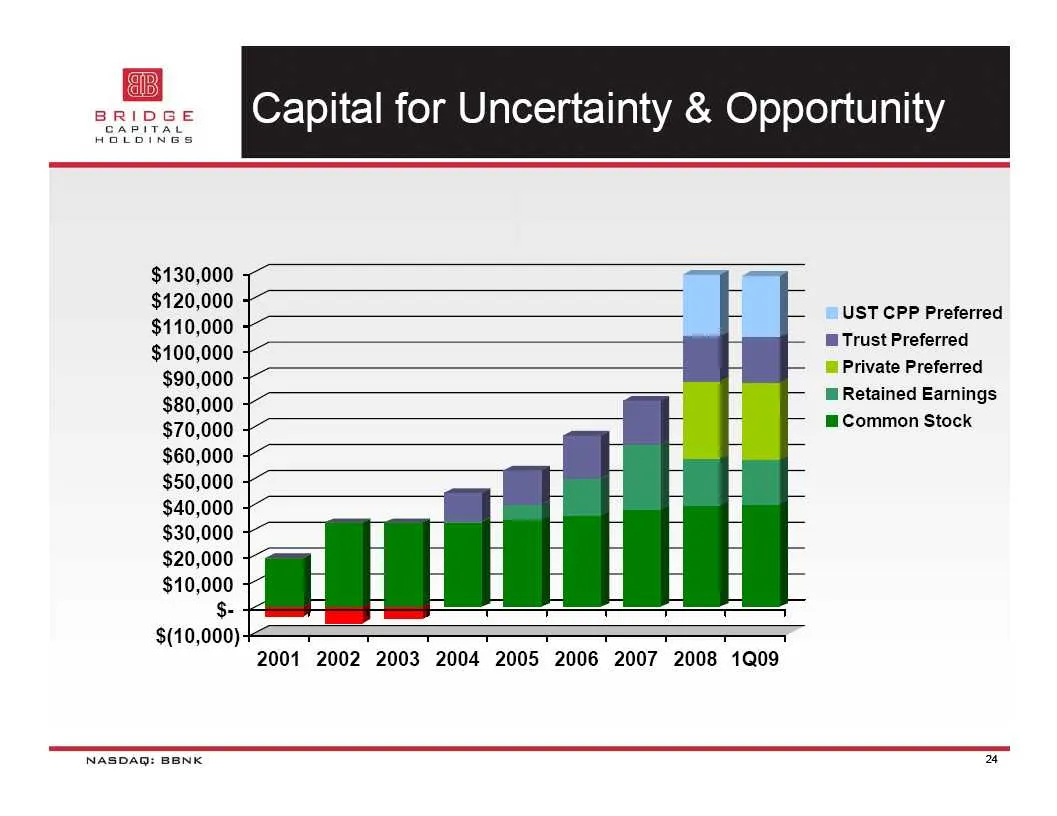
Slide 24: Capital for Uncertainty & Opportunity
Capital for Uncertainty & Opportunity $130,000 $120,000 $110,000 $100,000 $90,000 $80,000 $70,000 $60,000 $50,000 $40,000 $30,000 $20,000 $10,000 $- $(10,000)4— 2001 2002 2003 2004 2005 2006 2007 2008 1Q09 UST CPP Preferred | Trust Preferred @ Private Preferred @ Retained Earnings lm Common Stock NA
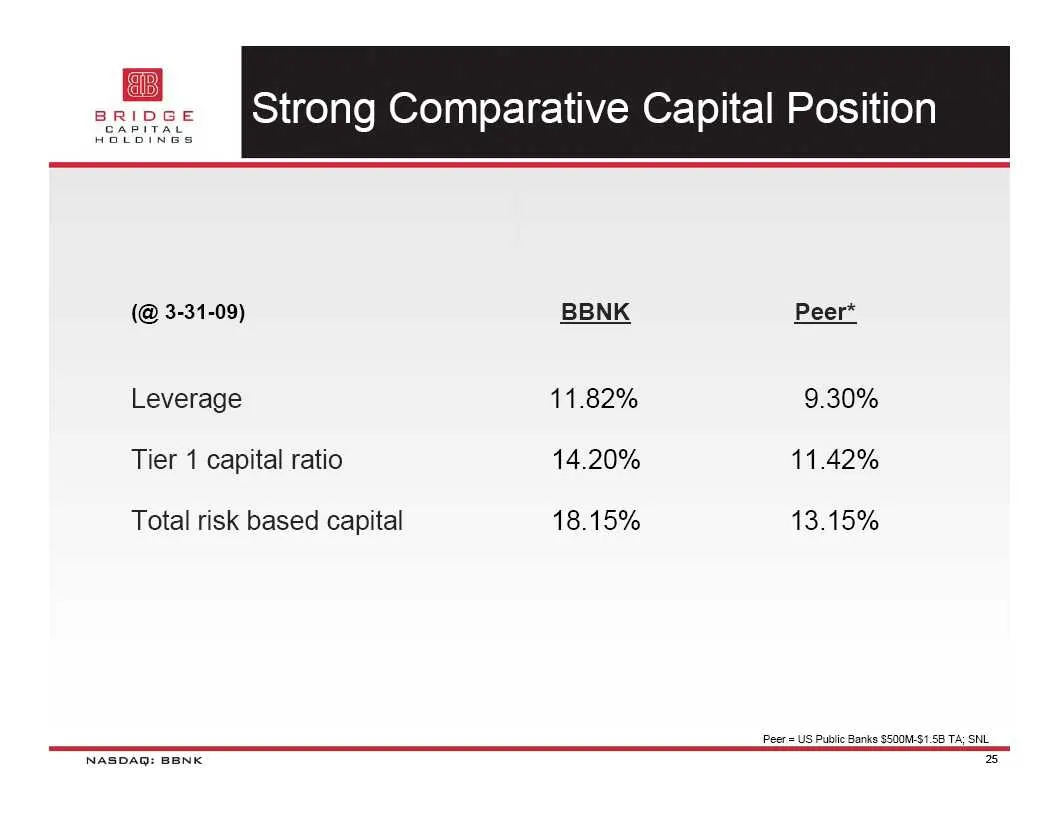
Slide 25: Strong Comparative Capital Position
Strong Comparative Capital Position (@ 3-31-09) Leverage Tier 1 capital ratio Total risk based capital NASDAQ: BBNK BBNK 11.82% 14.20% 18.15% Peer* 9.30% 11.42% 13.15% Peer = US Public Banks $S00M-S1.SB TA; SNL 25
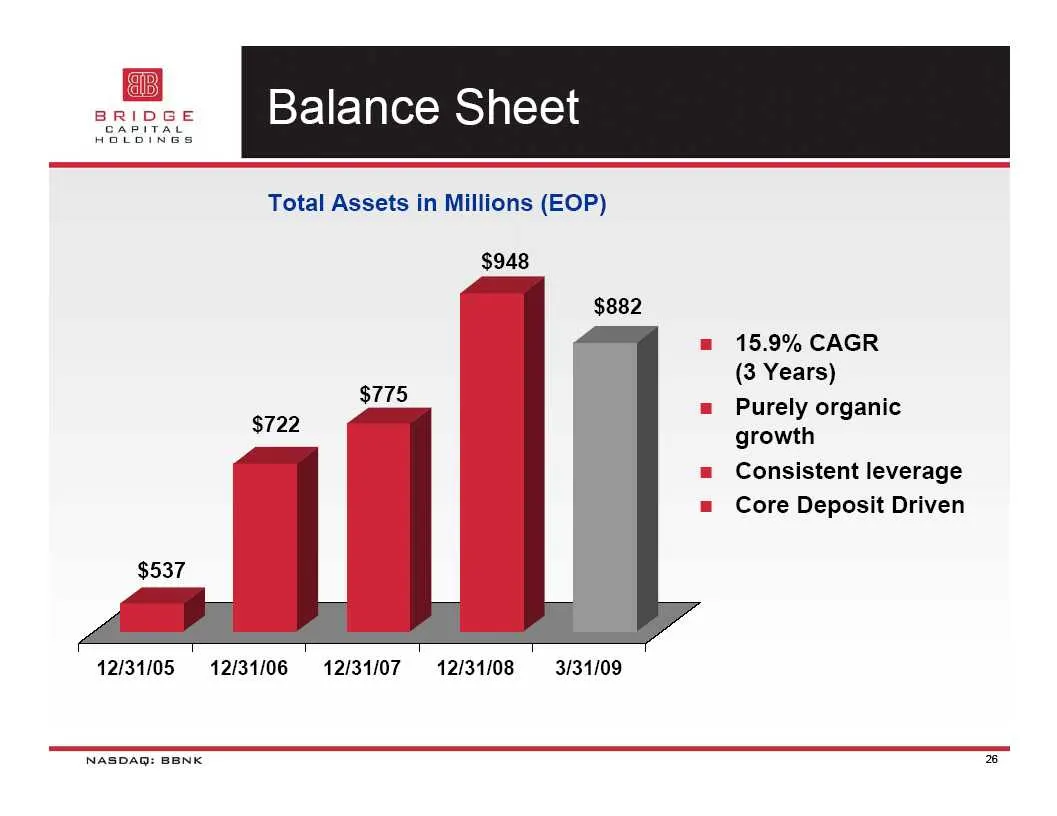
Slide 26: Balance Sheet
Balance Sheet Total Assets in Millions (EOP) $948 15.9% CAGR (3 Years) Purely organic growth Consistent leverage Core Deposit Driven 12/31/05 = 12/34/06 = 12/34/07 — 12/34/08 3/31/09 NASDAQ: BBNK
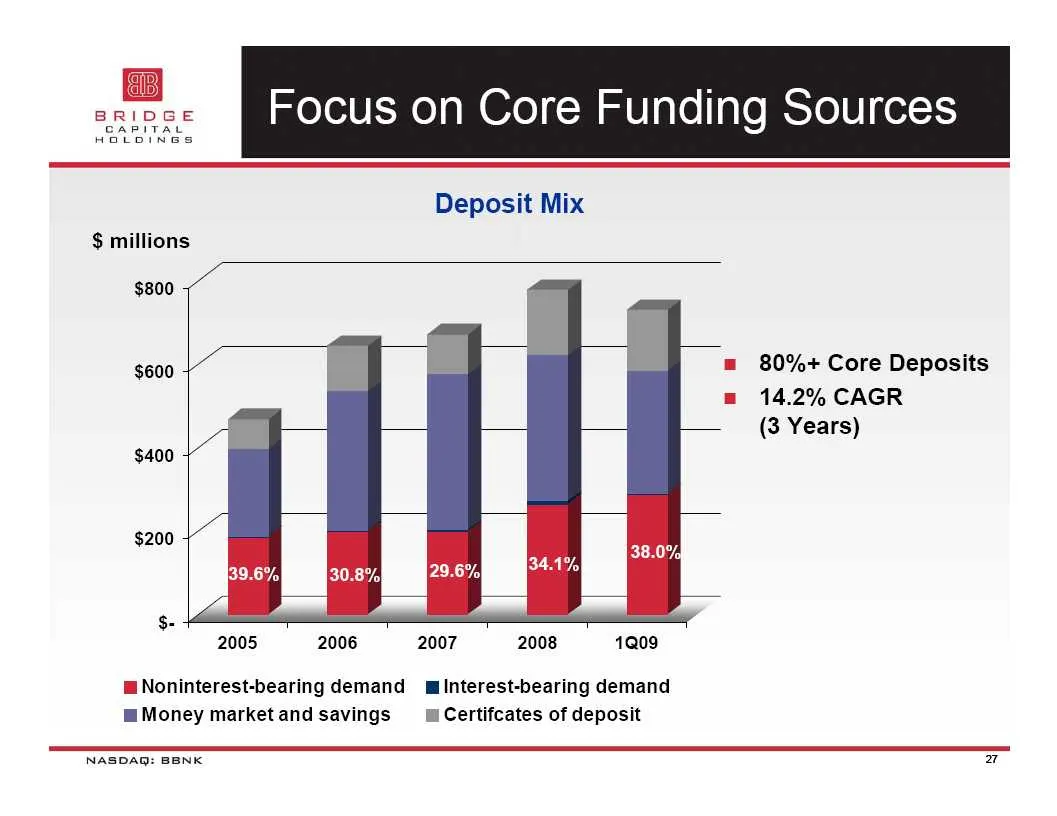
Slide 27: Deposit composition
$ millions $800 $600 $400 $200 $- 2005 2006 2007 2008 1Q09 @Noninterest-bearing demand mlinterest-bearing demand mMoney marketand savings im Certifcates of deposit m 80%+ Core Deposits = 14.2% CAGR (3 Years) NASDAQ: BBNK
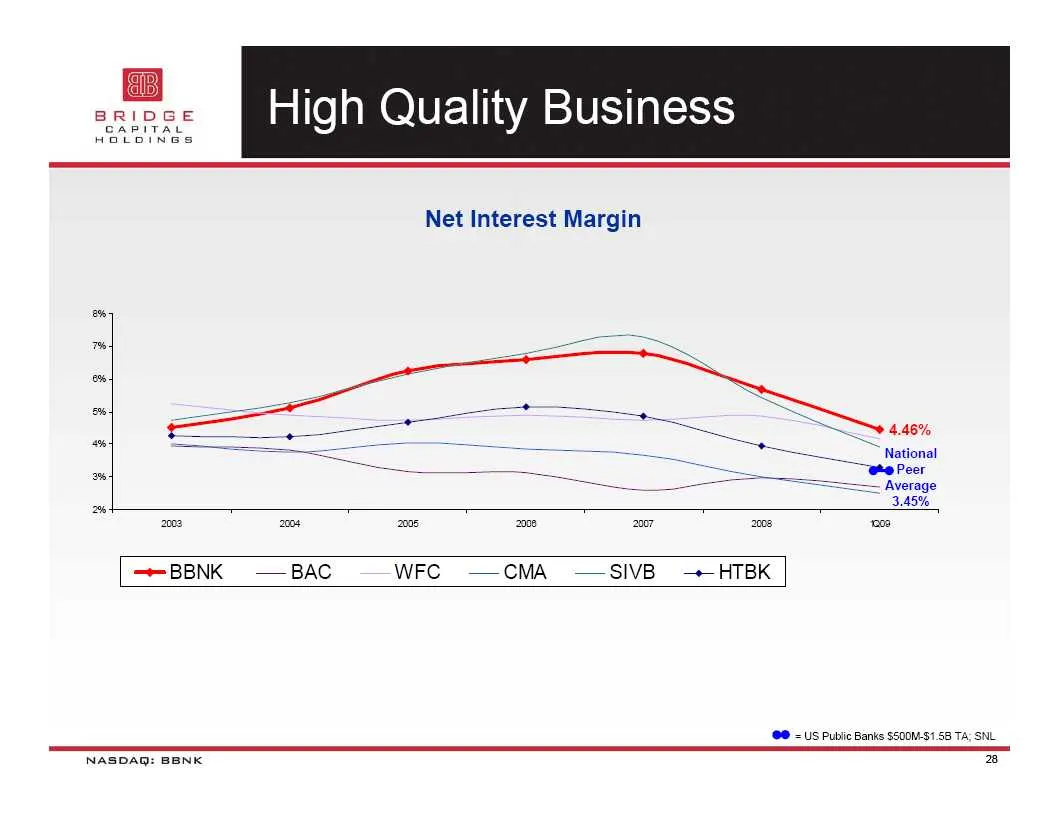
Slide 28: Net interest margin vs peers
4.46% National we Peer Average 3.45% 2008 2008 2005 2a08 ‘07 208 ‘08 —--BBNK —BAC WFC —-CMA_—-SIVB_ -+-HTBK @0 = US Public Banks $S00M-51.58 TA: SNL NASDAQ: BBNK 28
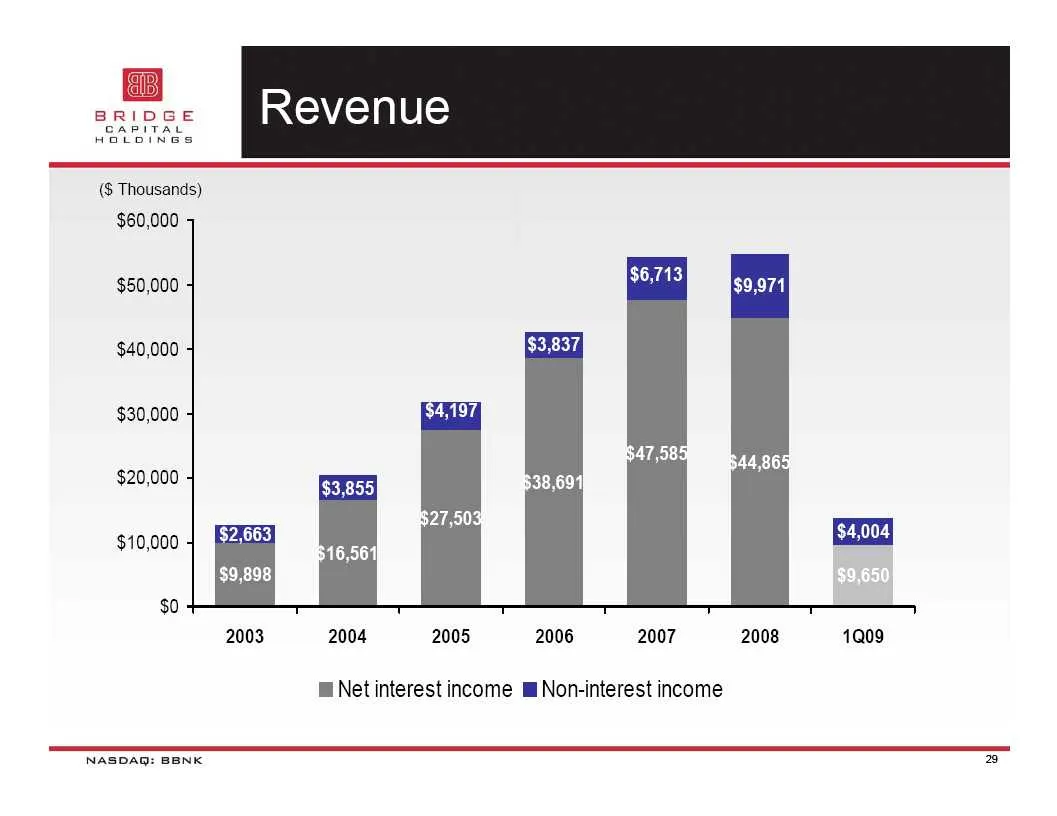
Slide 29: Revenue
Revenue ($ Thousands) $60,000 $50,000 $40,000 $30,000 $20,000 $10,000 $0 2003 2004 2005 2006 2007 2008 1Q09 @ Net interest income m Non-interest income NASDAQ: BBNK 29
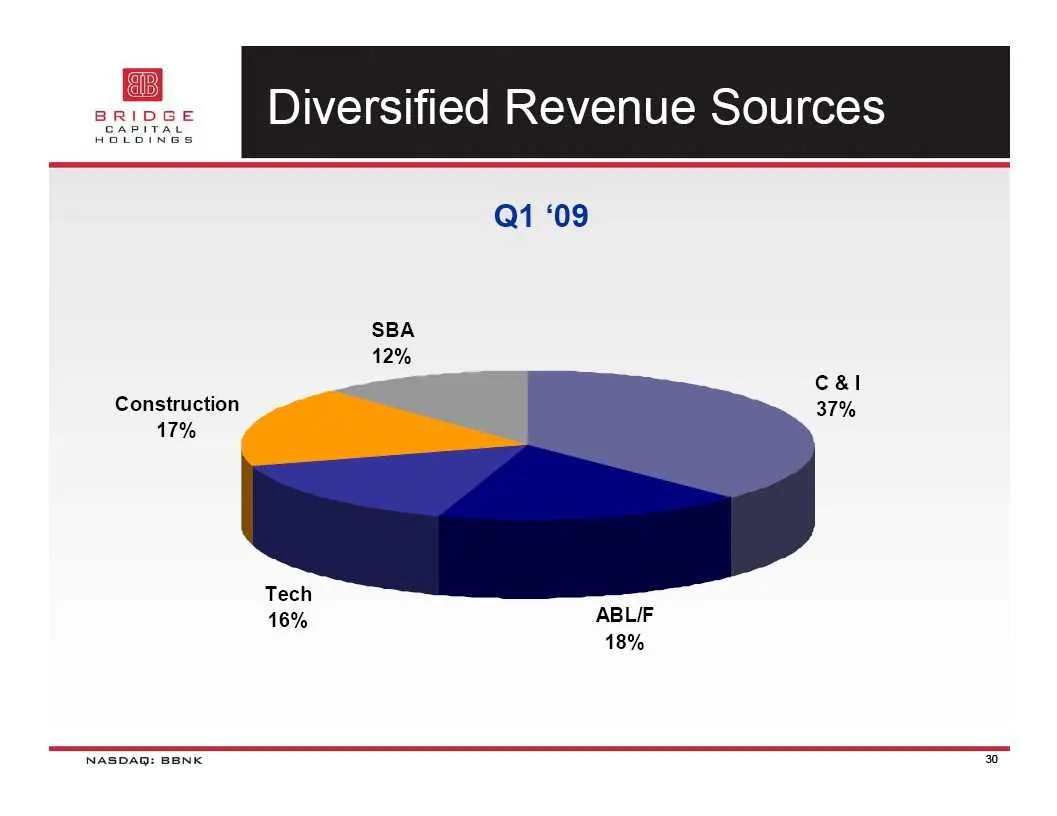
Slide 30: Diversified Revenue Sources
fie Diversified Revenue Sources Construction 17% Q1 ‘09 SBA 12% cal 37% 16% ABLIF 18%
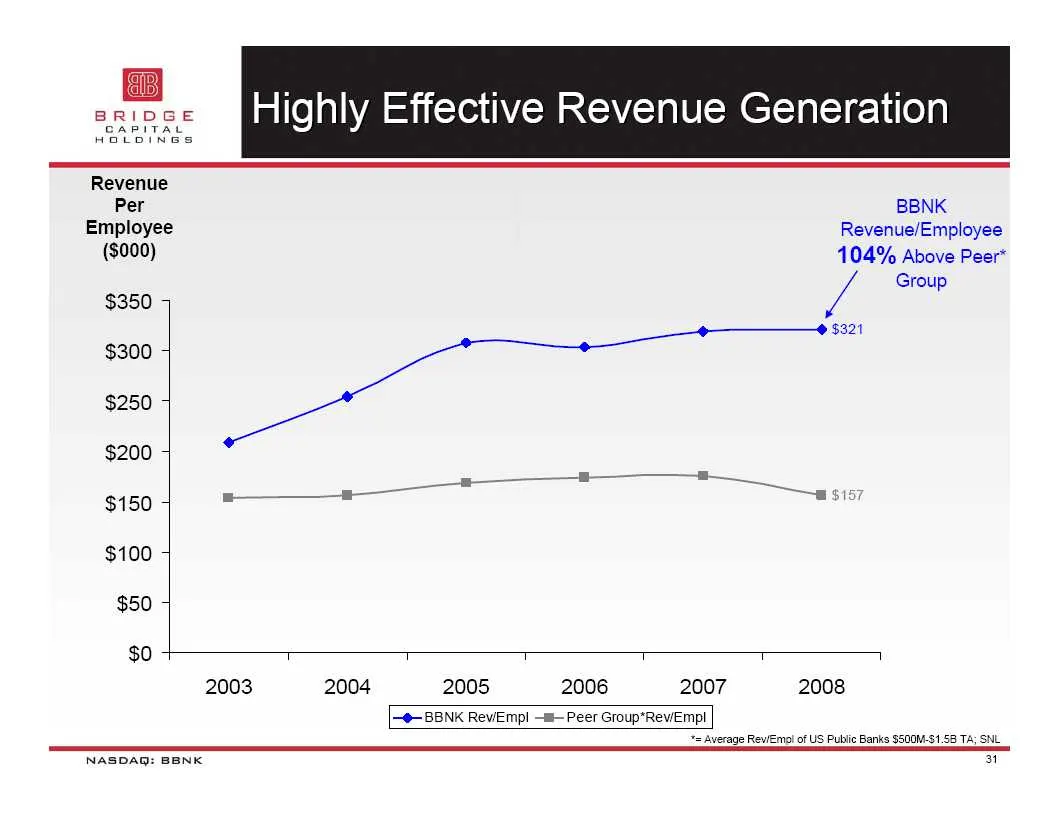
Slide 31: Highly Effective Revenue Generation
Highly Effective Revenue Generation Revenue Per BBNK Employee Revenue/Employee ($000) 104% Above Peer* Group $350 4 $321 $300 4 $250 4 $200 4 $150 4 = $100 4 $50 4 $0 T T T T T 1 2003 2004 2005 2006 2007 2008 [-e—BBNK ReviEmpl —m- Peer Group*Rev/Empl = Average Rev/Emo\ of US Public Banks $500M-$1.58
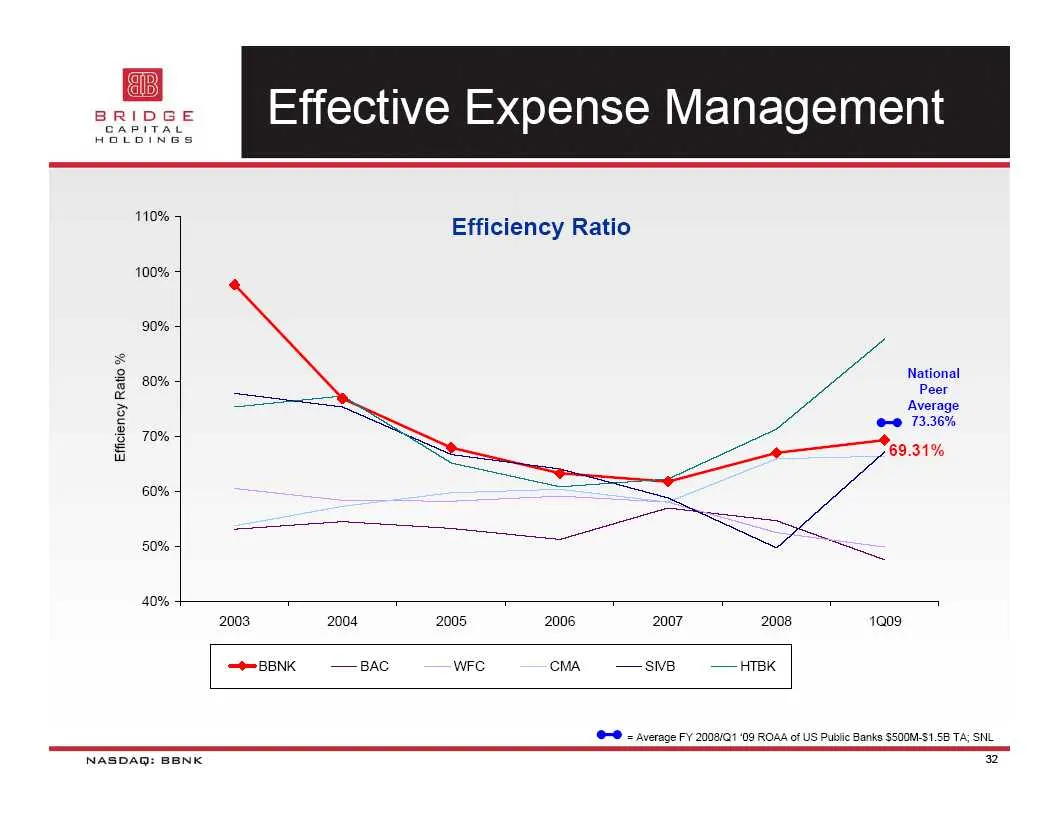
Slide 32: Effective Expense Management
Effective Expense Management 110% oe . Efficiency Ratio 100% 90% 2 National mS 80% Peer = Average 5 ee 73.36% 2 70% i" = 69.31% 60% 50% == 40% 2003 2004 2005 2006 2007 2008 1Q09 —BBNK — BAC WFC CMA —SNB —HTBK erage FY 2003/01 ‘09 ROAA of US Public Banks SSODM-S1.58 TA; SNL 22 NASDAQ: BBNK
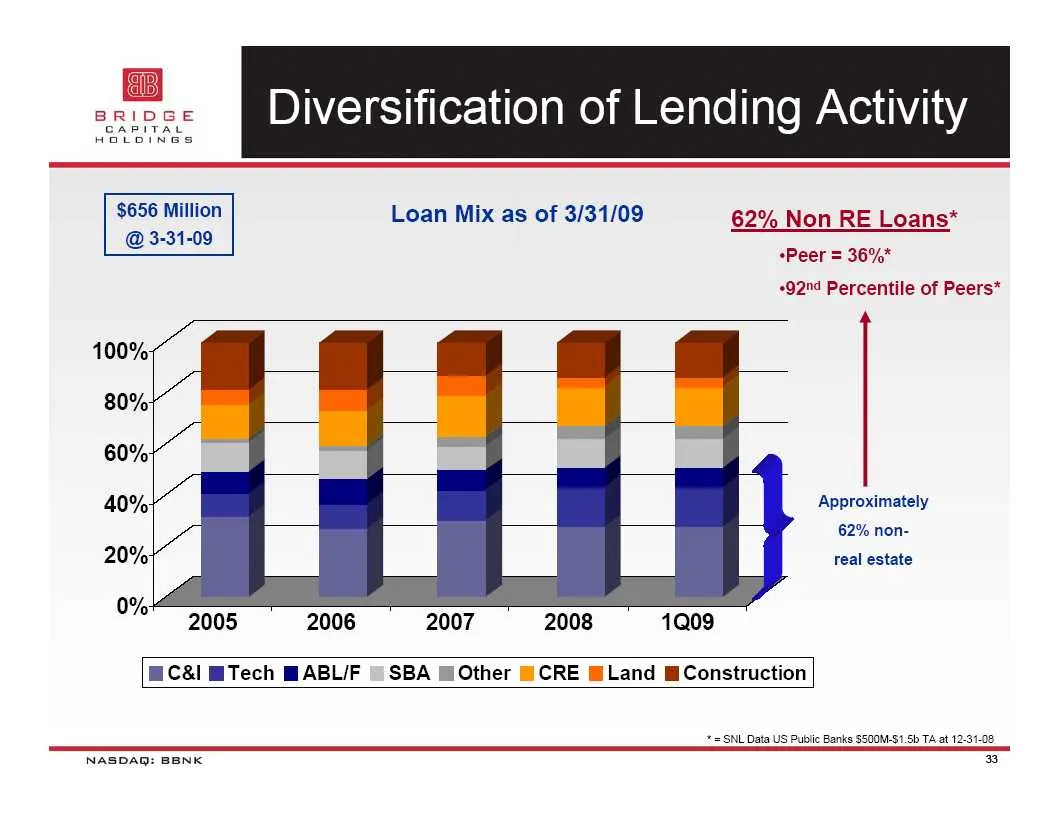
Slide 33: Diversification of Lending Activity
Diversification of Lending Activity $656 Million Loan Mix as of 3/31/09 62% Non RE Loans* @ 3-31-09 Peer = 36%" -92"¢ Percentile of Peers* Approximately 62% non- real estate 2005 2006 2007 2008 1Q09 ™C&l m@Tech MABL/F | SBA ®Other BCRE MLand MConstruction == SNL Data US Public Banks $S00M-$1.5b TA a
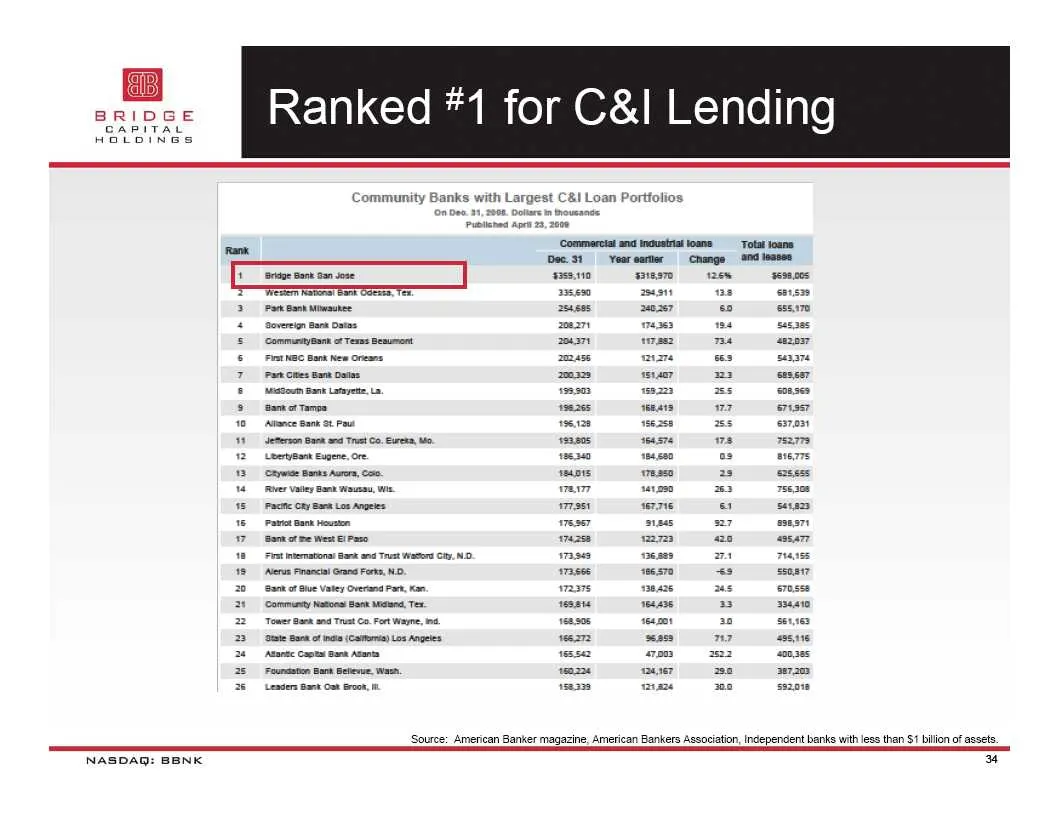
Slide 34: Community Banks with Largest C&I Loan Portfolios
NASDAQ: BBNK Community Banks with Largest C&! Loan Portfolios Pan Sank autee overs Sant Danae ‘Commurty Ban of Texas Beaumont gout Sant Latayete stance Bank 9 Pau detereon Gant and Trt Co. ret Leeryann Eugene, Ore eye Bans Aurora, 0 ‘Pace Cry Sra Los Anges Fiat nteratona! ant an Trt Wats Cy NO ‘erie
Slide 35: Looking Ahead
LOOKING AHEAD NASDAQ: BBNK
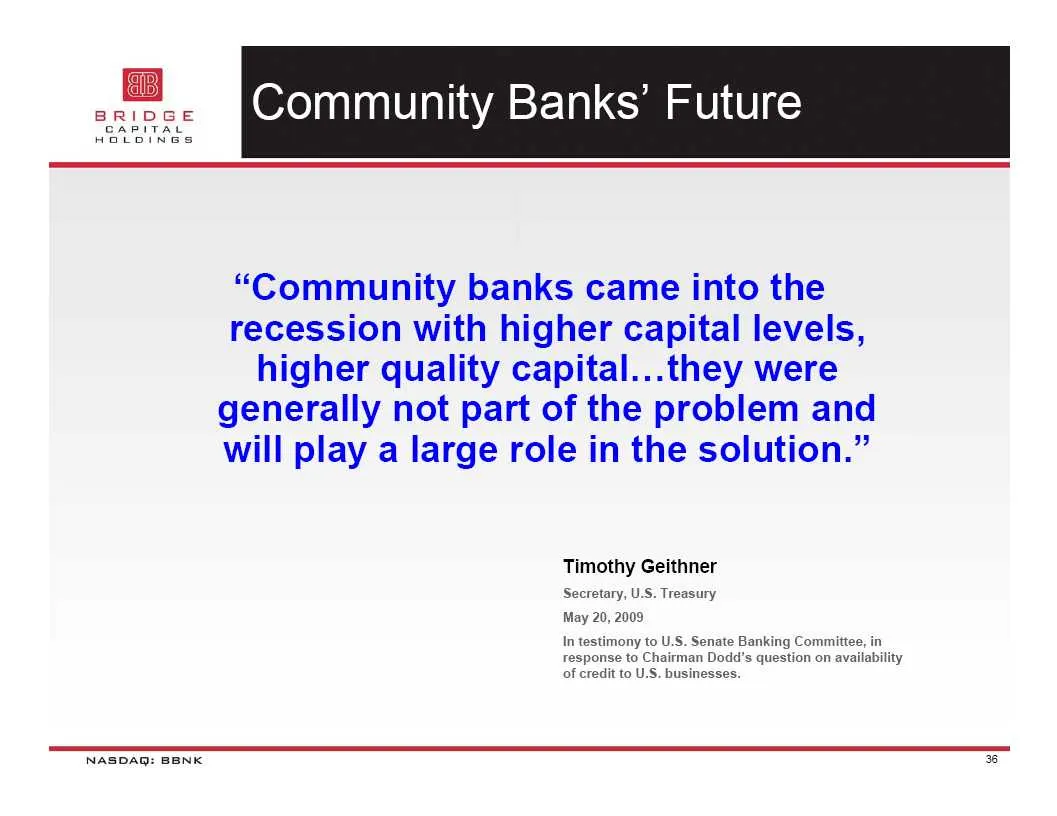
Slide 36: Community Banks' Future
Community Banks’ Future “Community banks came into the recession with higher capital levels, higher quality capital...they were generally not part of the problem and will play a large role in the solution.” Timothy Geithner Secretary, U.S. Treasury May 20, 2009 In testimony to U.S. Senate Banking Co
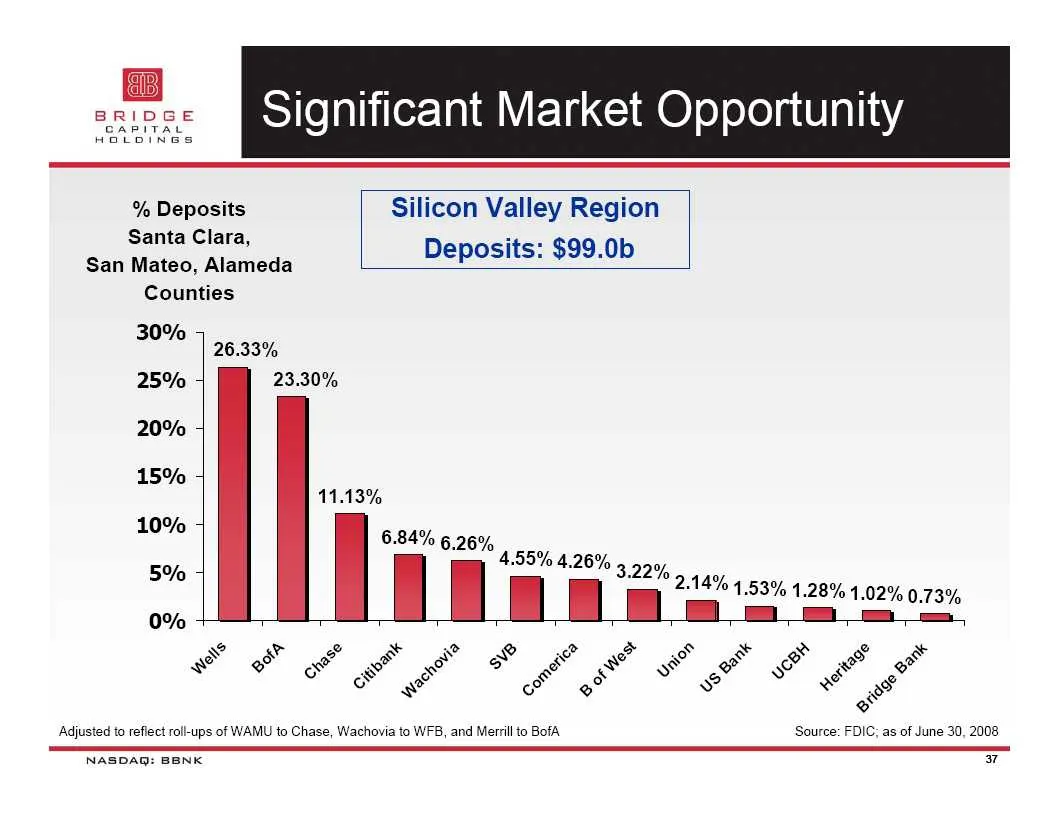
Slide 37: Significant Market Opportunity
Significant Market Opportunity % Deposits Silicon Valley Region Santa Clara, tees San Mateo, Alameda Deposits: $99.0b Counties 30% 26.33% 25% 23.30% 20% 15% 11.13% 10% 684% 6.26% 4 co, 5 5% tO 929% 5 aay) | | 184 1.53% 1.28% 1.02% 0.73% 0% + Bo oe = = ry & ra & Rs 3 ve & Py s ro * & 2 eo x é Adjuste
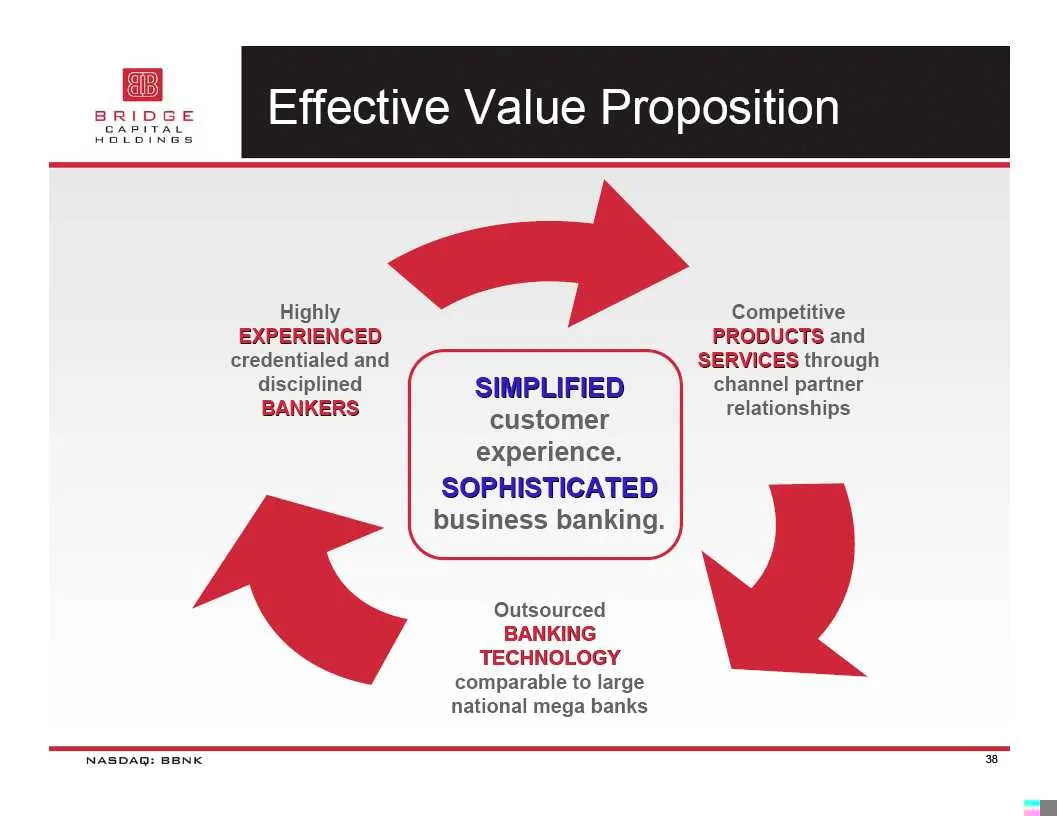
Slide 38: Effective Value Proposition
Effective Value Proposition Highly Competitive EXPERIENCED PRODUCTS and credentialed and SERVICES through disciplined SIMPLIFIED channel partner BANKERS customer relationships experience. SOPHISTICATED business banking. Outsourced BANKING TECHNOLOGY comparable to large national mega banks NASDAQ: BB
Slide 39: Bridge Bank
BRIDGE BANK A business banking franchise Professional Business Bank of Choice for small and middle-market businesses and technology companies in Silicon Valley, California, and the nation. NASDAQ: BBNK 39
Slide 40: Preparing for activity beyond the recession
Preparing for activity beyond the recession: = Enhance sales process and effectiveness = Build best-in-class Enterprise Risk Management = Serve and support our clients ! ! !
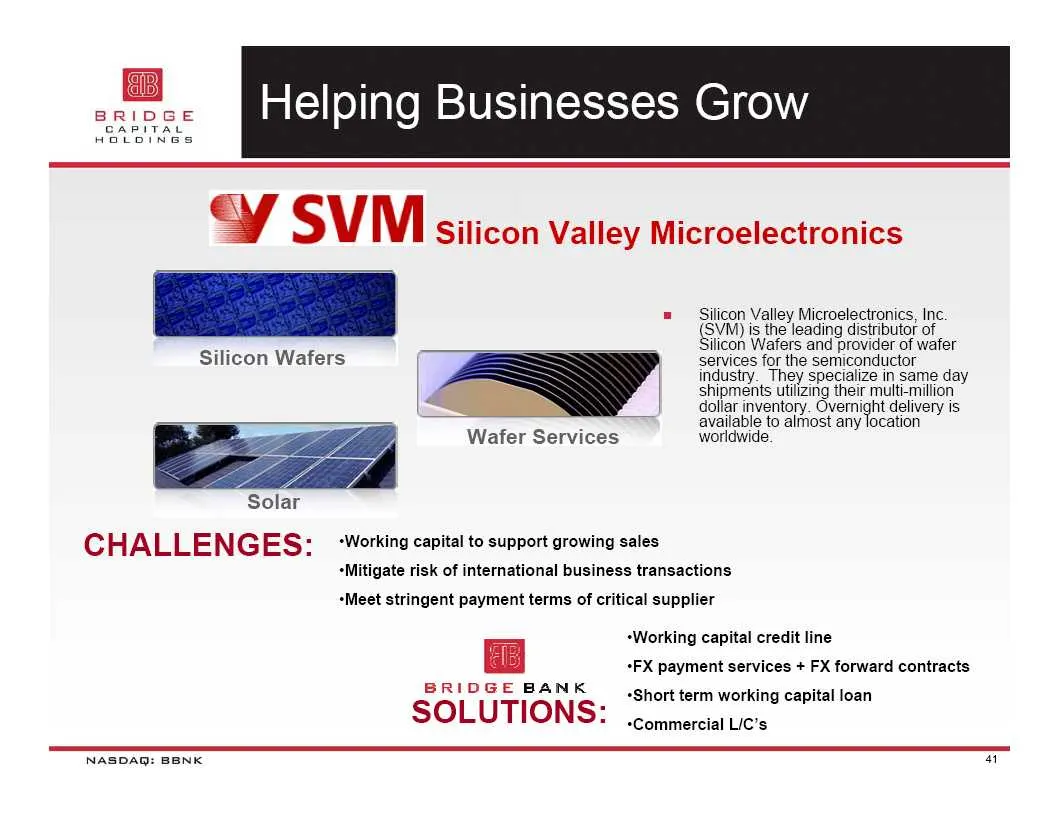
Slide 41: Silicon Valley Microelectronics
Yy SVM Silicon Valley Microelectronics = — Silicon Valley Microelectronics, Inc. Silicon Wafers Solar CHALLENGES: (SVM) is the leading distributor of ilicon Wafers and provider of wafer services for the semiconductor industry. They specialize in same day shipments utilizing their multi-million S dol
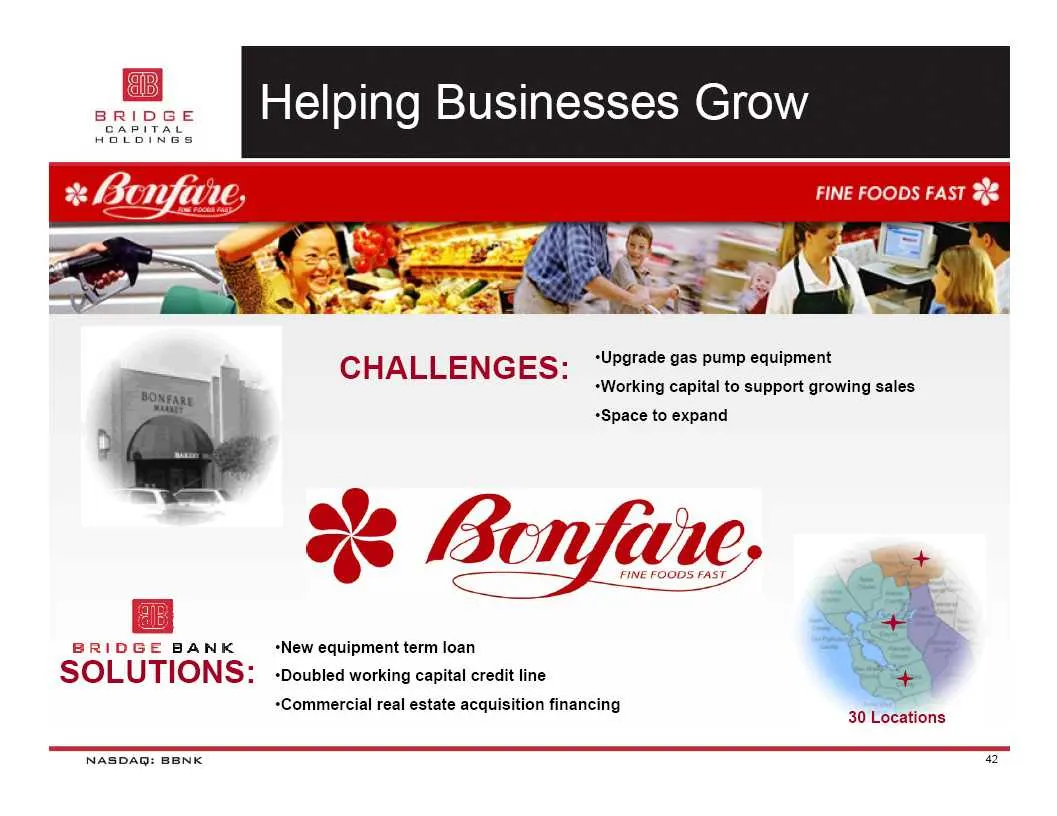
Slide 42: Gas station client case study
+Upgrade gas pump equipment +Working capital to support growing sales +Space to expand BRIDGE BANK New equipment term loan < TIONG: SOLUTIONS: -poubied working capital credit line “Commercial real estate acquisition financing 30 Locations NASDAQ: BBNK 22
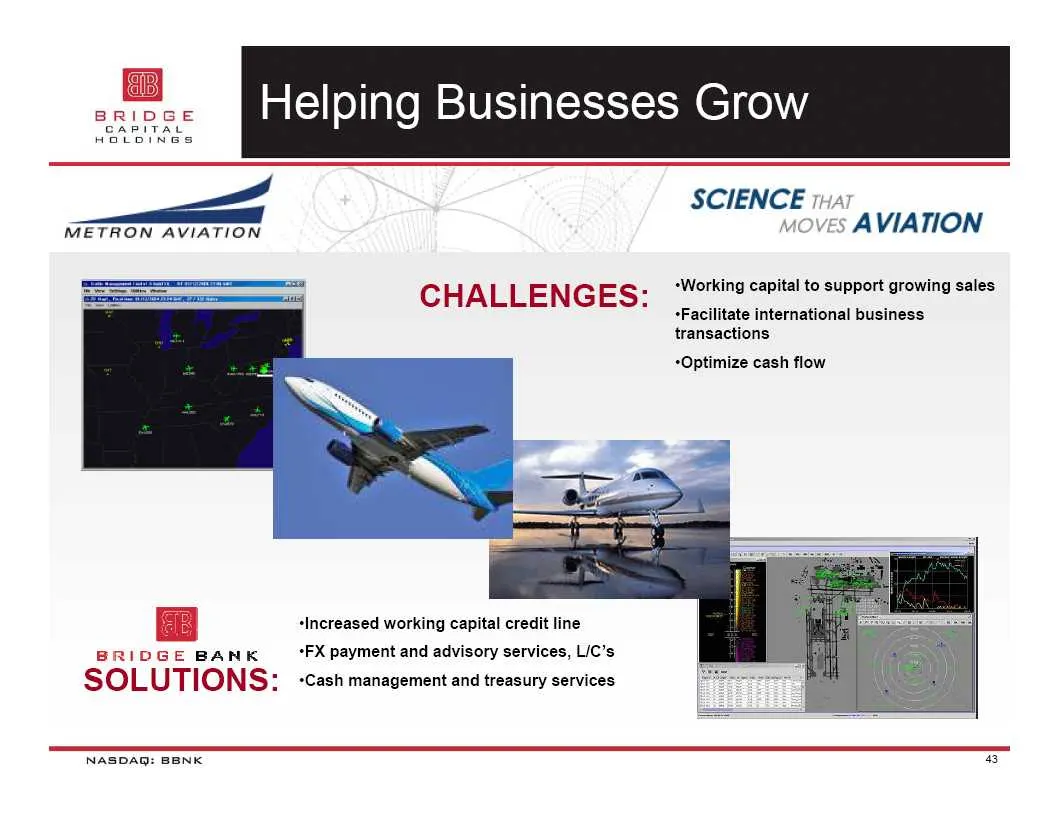
Slide 43: Aviation client case study
SCIENCE tar voves AVIATION CHALLENGES: ‘W2tking capital to support growing sales -Facilitate international business transactions *Optimize cash flow BRIDGE BANK “FX payment and advisory services, L/C’s SOLUTIONS: -cash management and treasury services Increased working capital credit line NASDAQ: BB

Slide 44: Metal recycling client case study
. _ “Purchase and install specialty recycling equipment x CHALLENGES: ,;, support NYC recycling contract r\ AMEN A,LLo ADVANCED METAL PROCESSIN' g Se FAN es Chimeolk Metals ce BRIDGE BANK +$4 million construction & equipment loan SOLUTIONS: -uspa Bai term ioan NASDAQ: BBNK ry
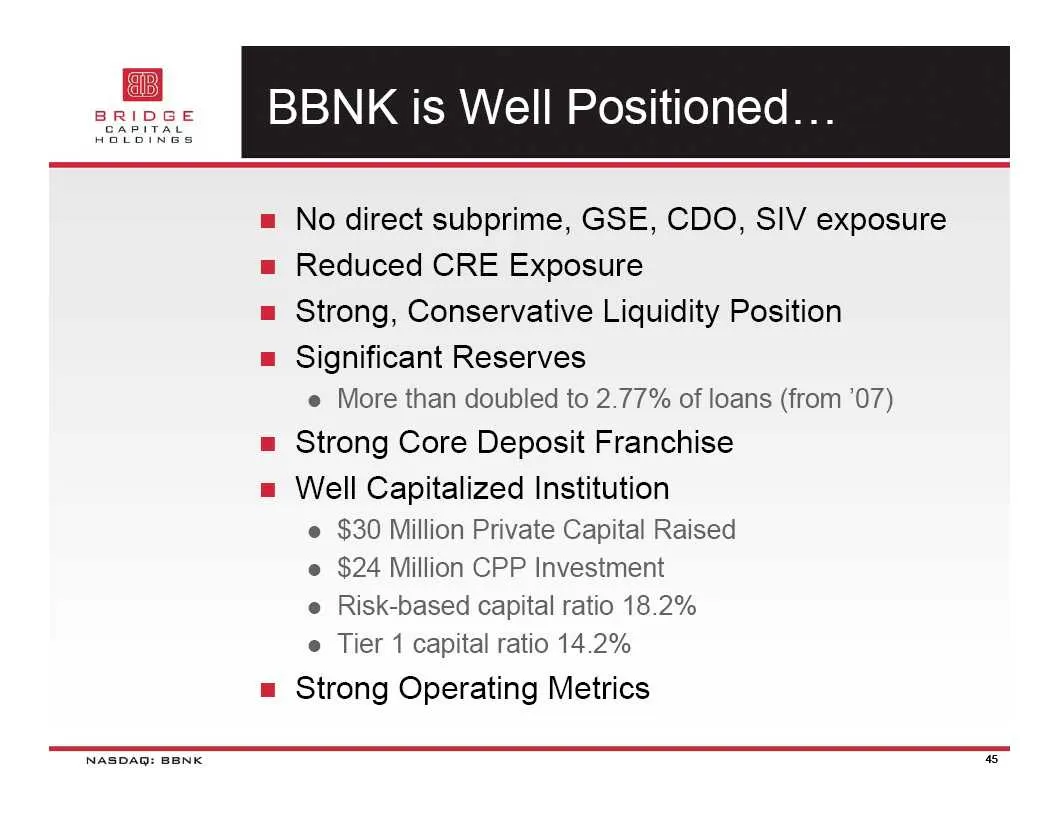
Slide 45: BBNK is Well Positioned...
NASDAQ: BBNK BBNK is Well Positioned... No direct subprime, GSE, CDO, SIV exposure Reduced CRE Exposure Strong, Conservative Liquidity Position Significant Reserves e More than doubled to 2.77% of loans (from ’07) Strong Core Deposit Franchise Well Capitalized Institution e $30 Million Private Capit
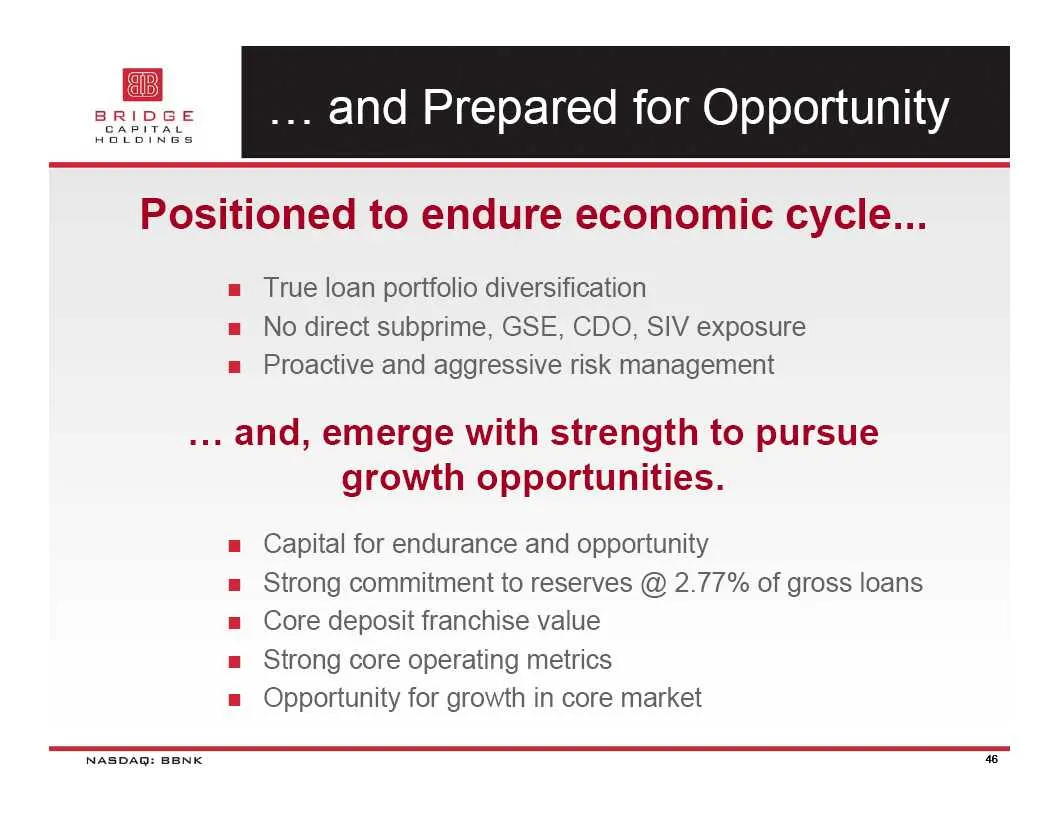
Slide 46: ... and Prepared for Opportunity
... and Prepared for Opportunity Positioned to endure economic cycle... a True loan portfolio diversification = No direct subprime, GSE, CDO, SIV exposure a Proactive and aggressive risk management ... and, emerge with strength to pursue growth opportunities. Capital for endurance and opportunity St

Slide 47: Patella! Foundation
Patella! Foundation NASDAQ: BBNK a7
Source: SEC EDGAR · 8-K filed May 22, 2009
More decks from Bridge Capital Holdings
 Merger or Acquisition (March 2015)11 slides · Mar 9, 2015
 Q4 2014 Earnings Presentation22 slides · Feb 4, 2015
 Q2 2014 Earnings Presentation23 slides · Jul 29, 2014
 Shareholder Meeting (May 2014)19 slides · May 28, 2014
 Q1 2014 Earnings Presentation23 slides · May 13, 2014
 Q4 2013 Earnings Presentation24 slides · Feb 5, 2014