Susquehanna Bancshares — Investor Presentation (May 2013)
36 slides from Susquehanna Bancshares's investor presentation, May 9, 2013
Slide 1: Susquehanna Bancshares, Inc. Investor Presentation 2nd Quarter 2013
Exhibit 99.1 Susquehanna Bancshares, Inc. Investor Presentation 2nd Quarter 2013
Slide 2: Forward-Looking Statements
Forward-Looking Statements During the course of this presentation, we may make projections and other forward-looking statements regarding priorities and strategic objectives of Susquehanna Bancshares, Inc., as well as projected capital ratios, efficiency ratios, net income and earnings. We encourage
Slide 3: Who is Susquehanna?
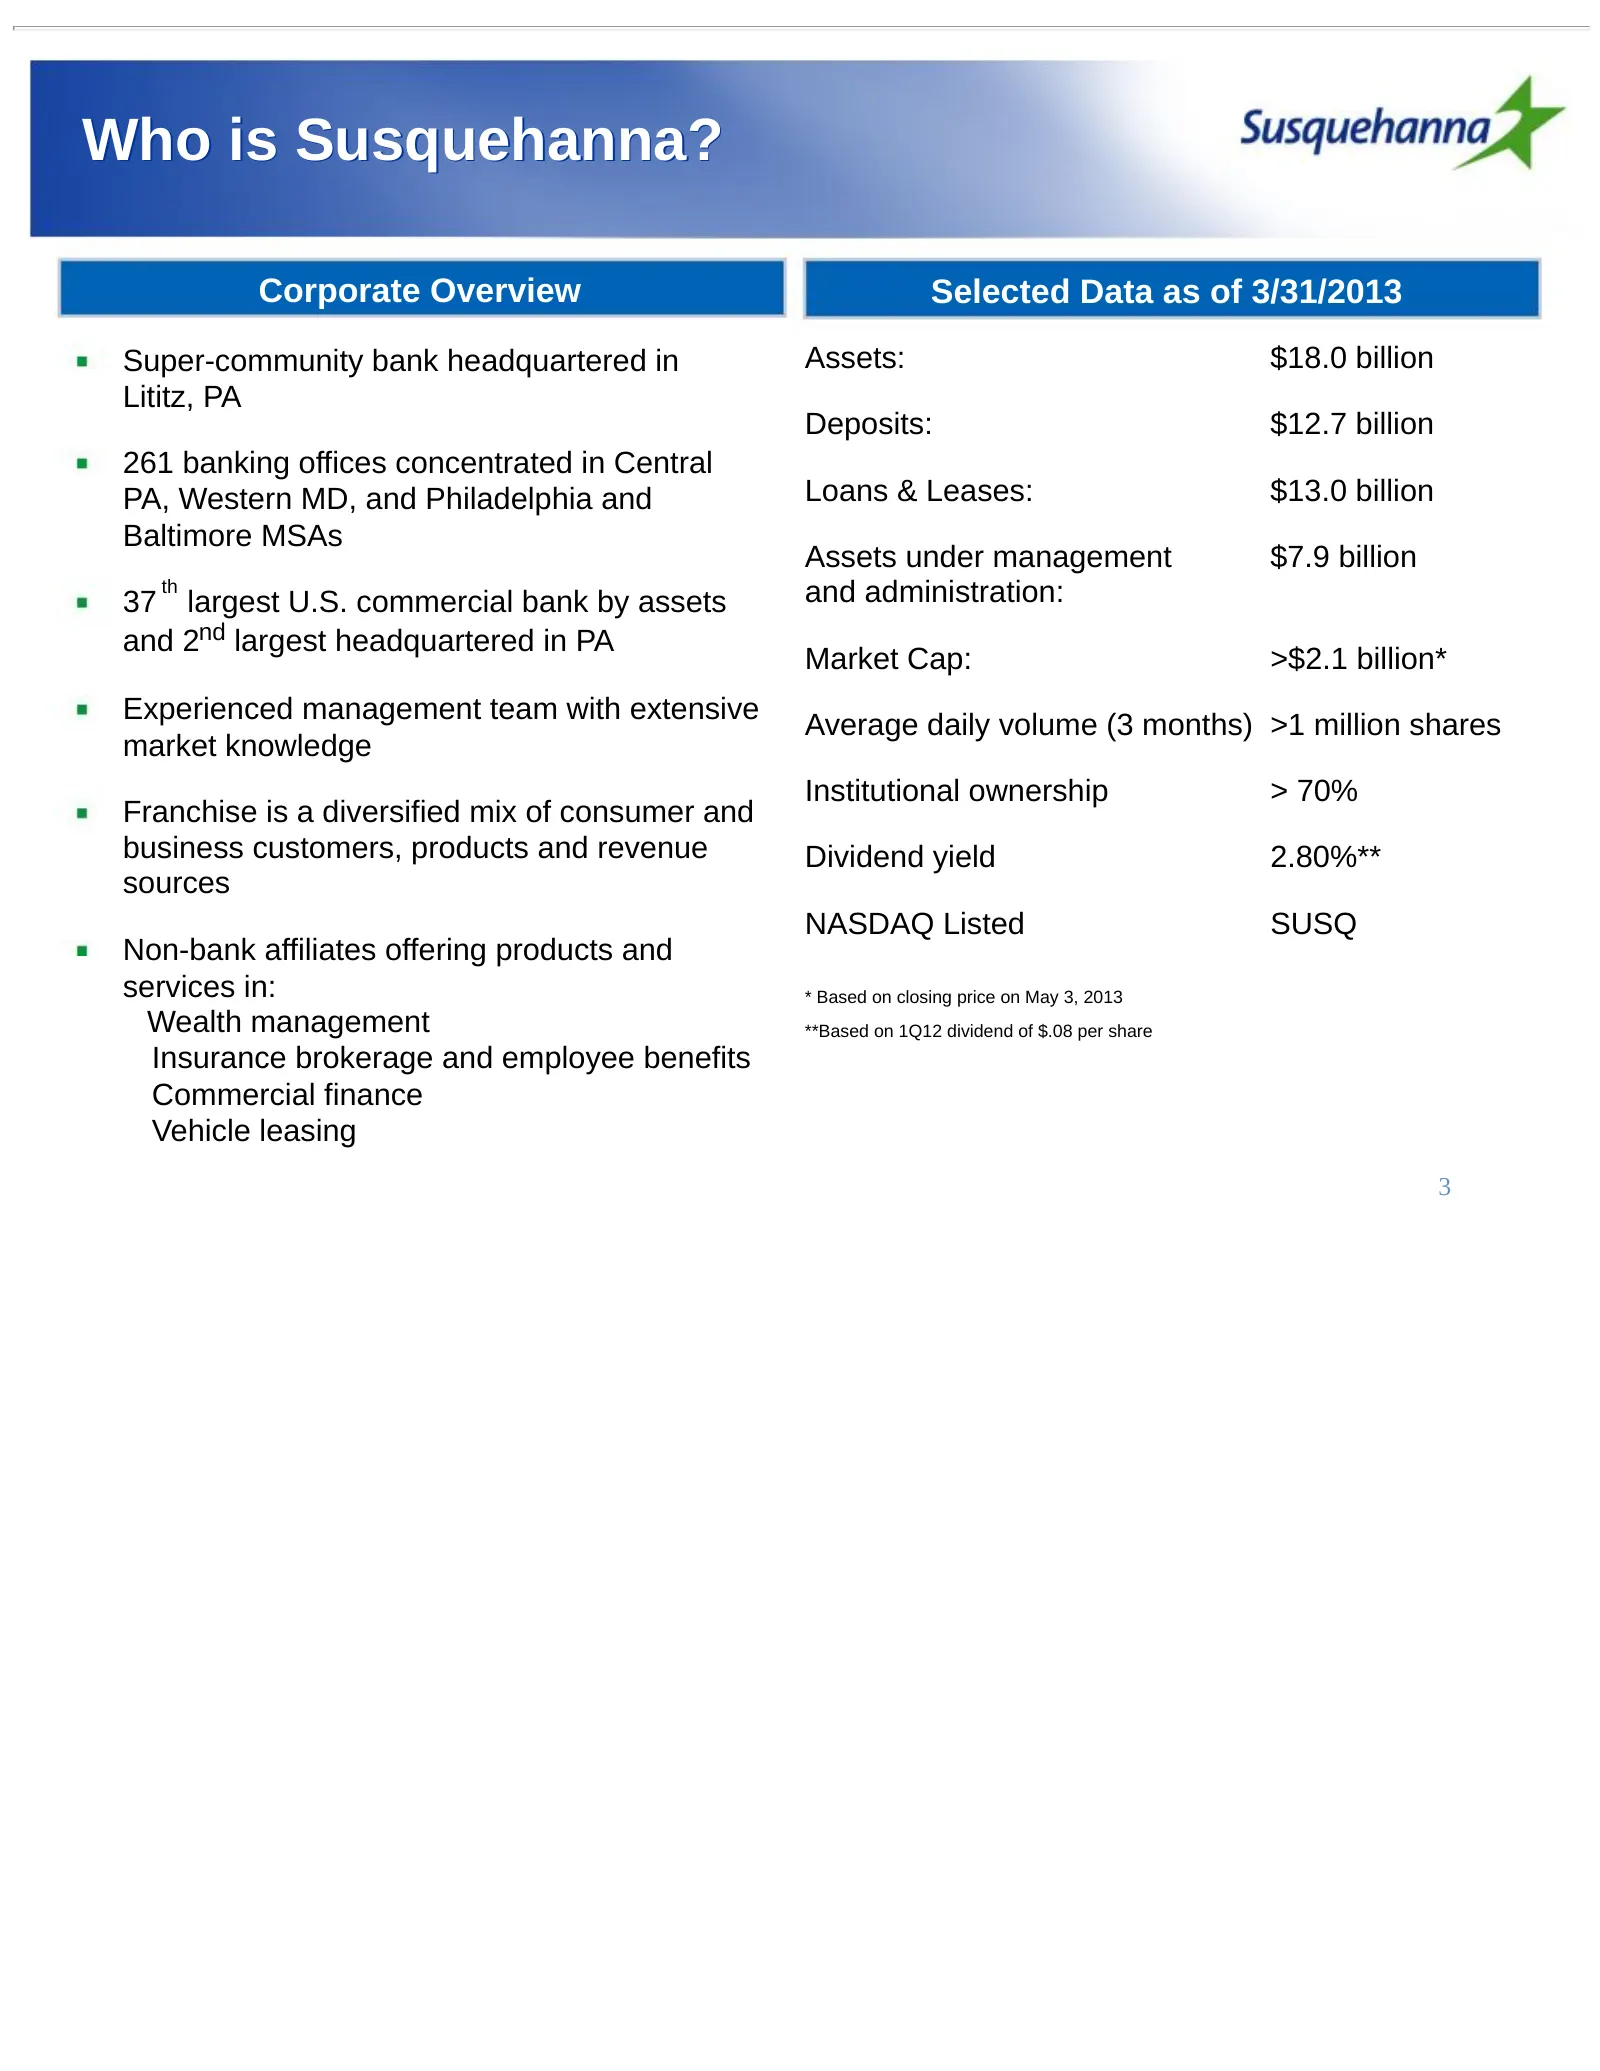
Who is Susquehanna? Corporate Overview Selected Data as of 3/31/2013 Super-community bank headquartered in Assets: $18.0 billion Lititz, PA Deposits: $12.7 billion 261 banking offices concentrated in Central PA, Western MD, and Philadelphia and Loans & Leases: $13.0 billion Baltimore MSAs Assets und
Slide 4: Uniquely Positioned
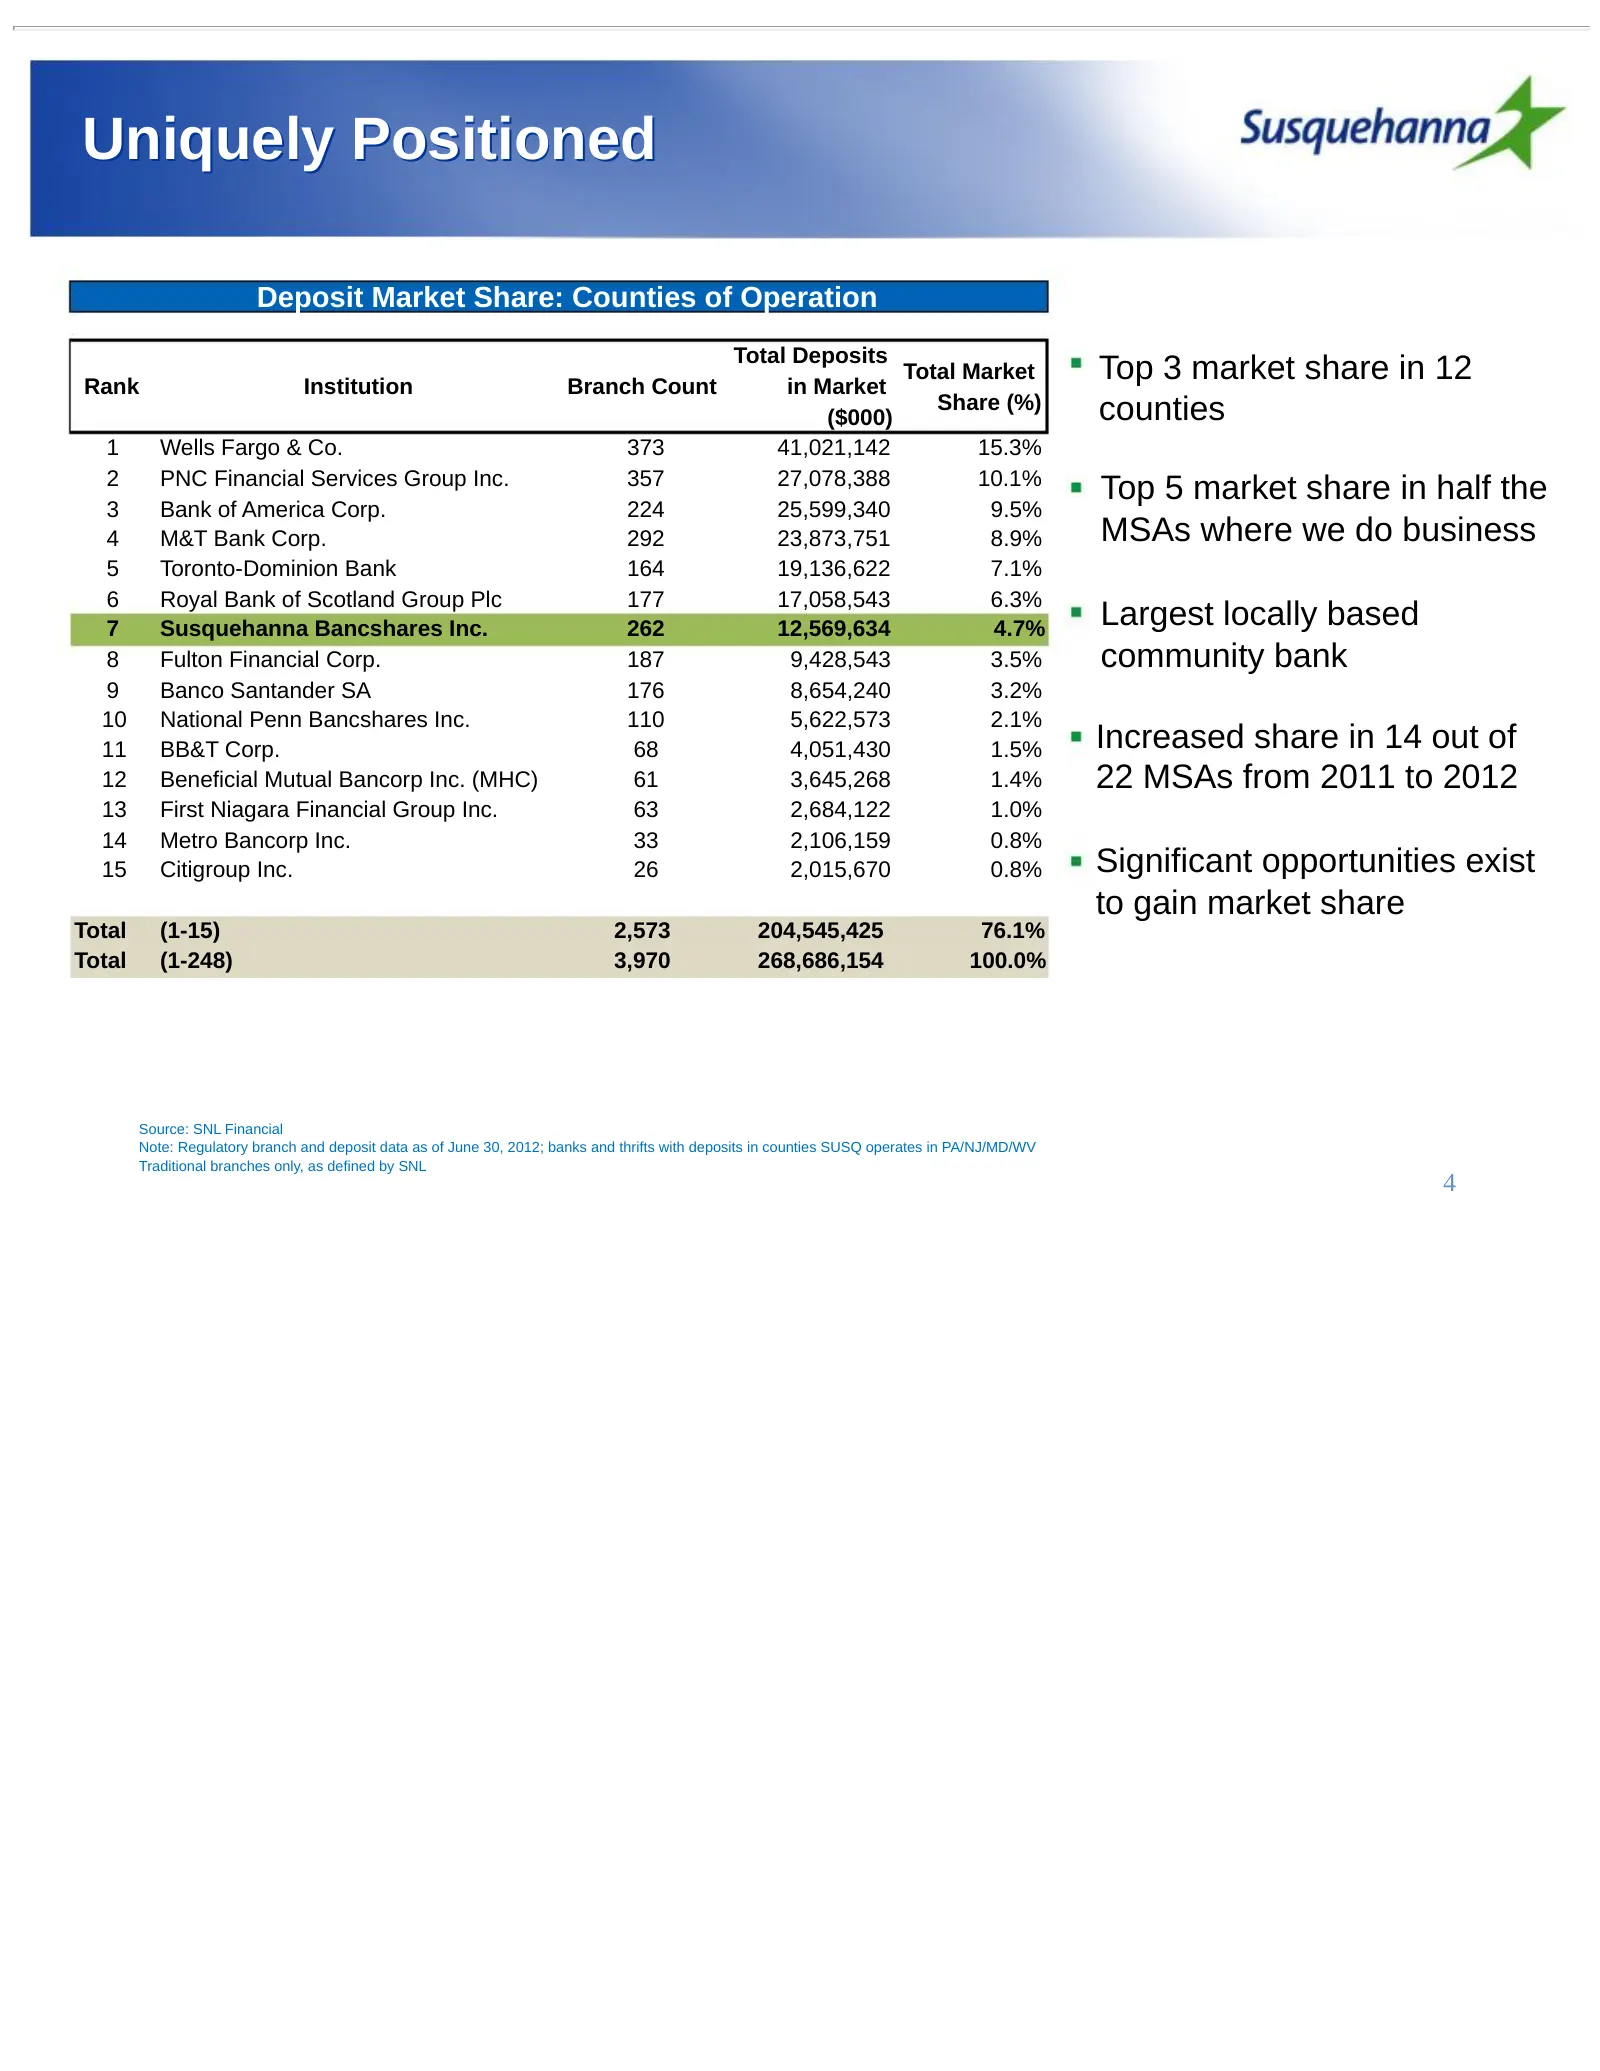
Uniquely Positioned Deposit Market Share: Counties of Operation Total Deposits Rank Institution Branch Count in Market Total Market Top 3 market share in 12 ($000) Share (%) counties 1 Wells Fargo & Co. 373 41,021,142 15.3% 2 PNC Financial Services Group Inc. 357 27,078,388 10.1% Top 5 market share
Slide 5: Building on Momentum
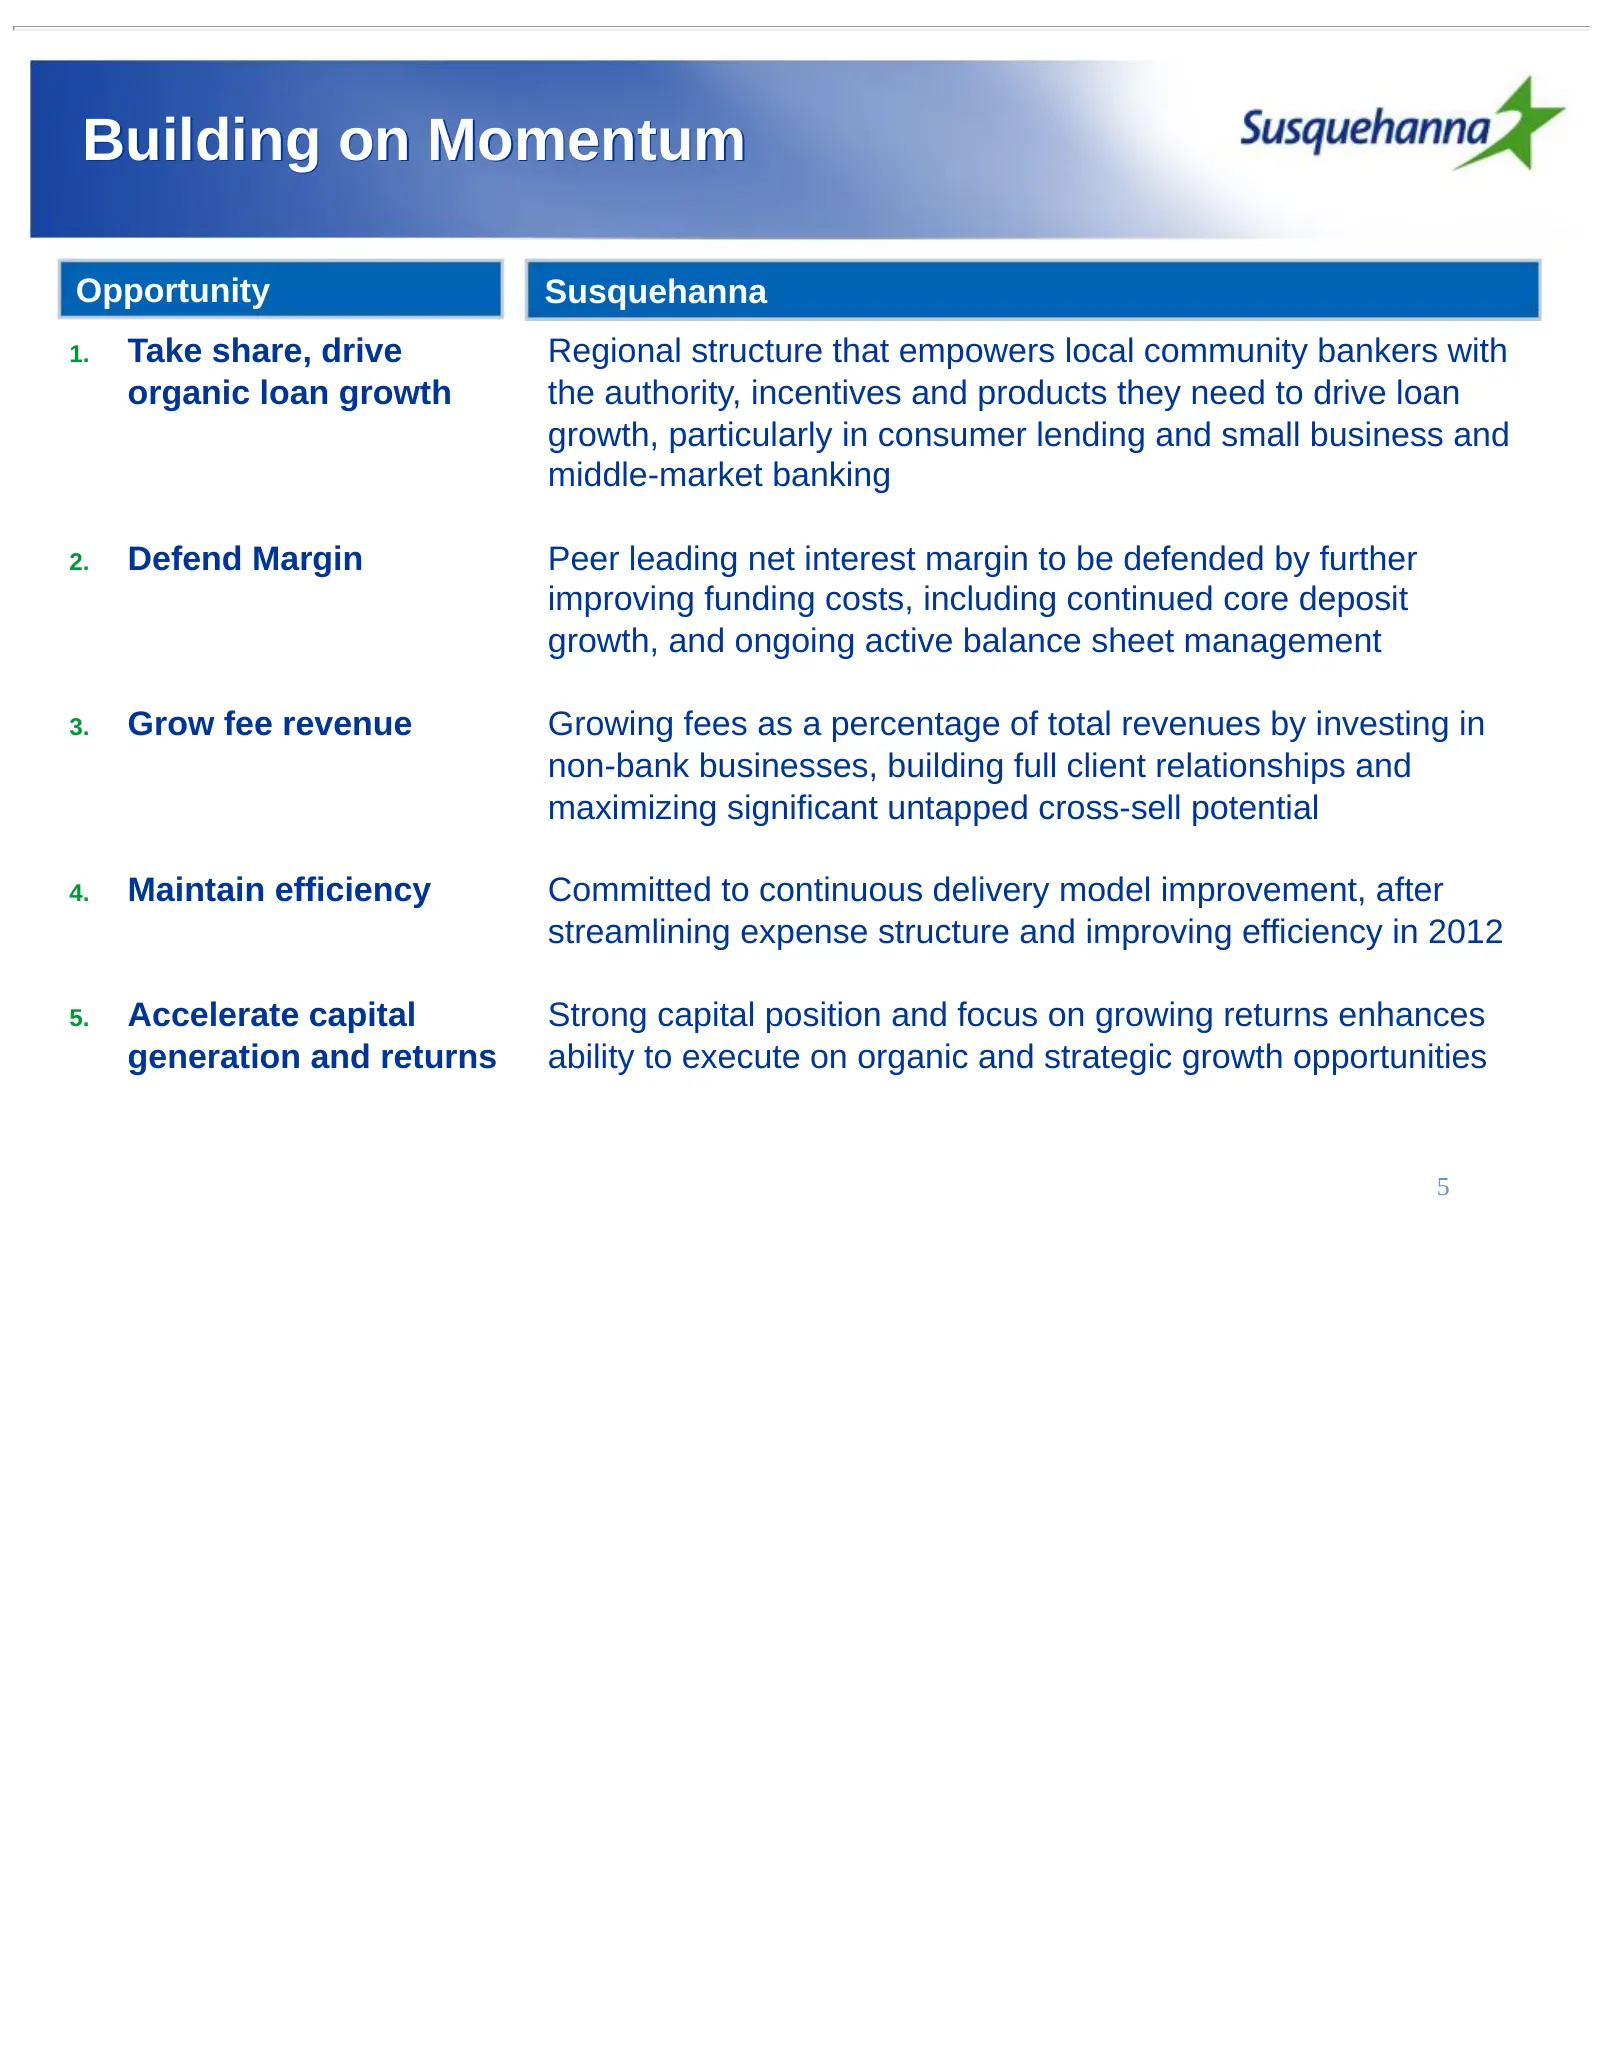
Building on Momentum Opportunity Susquehanna 1. Take share, drive Regional structure that empowers local community bankers with organic loan growth the authority, incentives and products they need to drive loan growth, particularly in consumer lending and small business and middle-market banking 2.
Slide 6: Focus for 2013
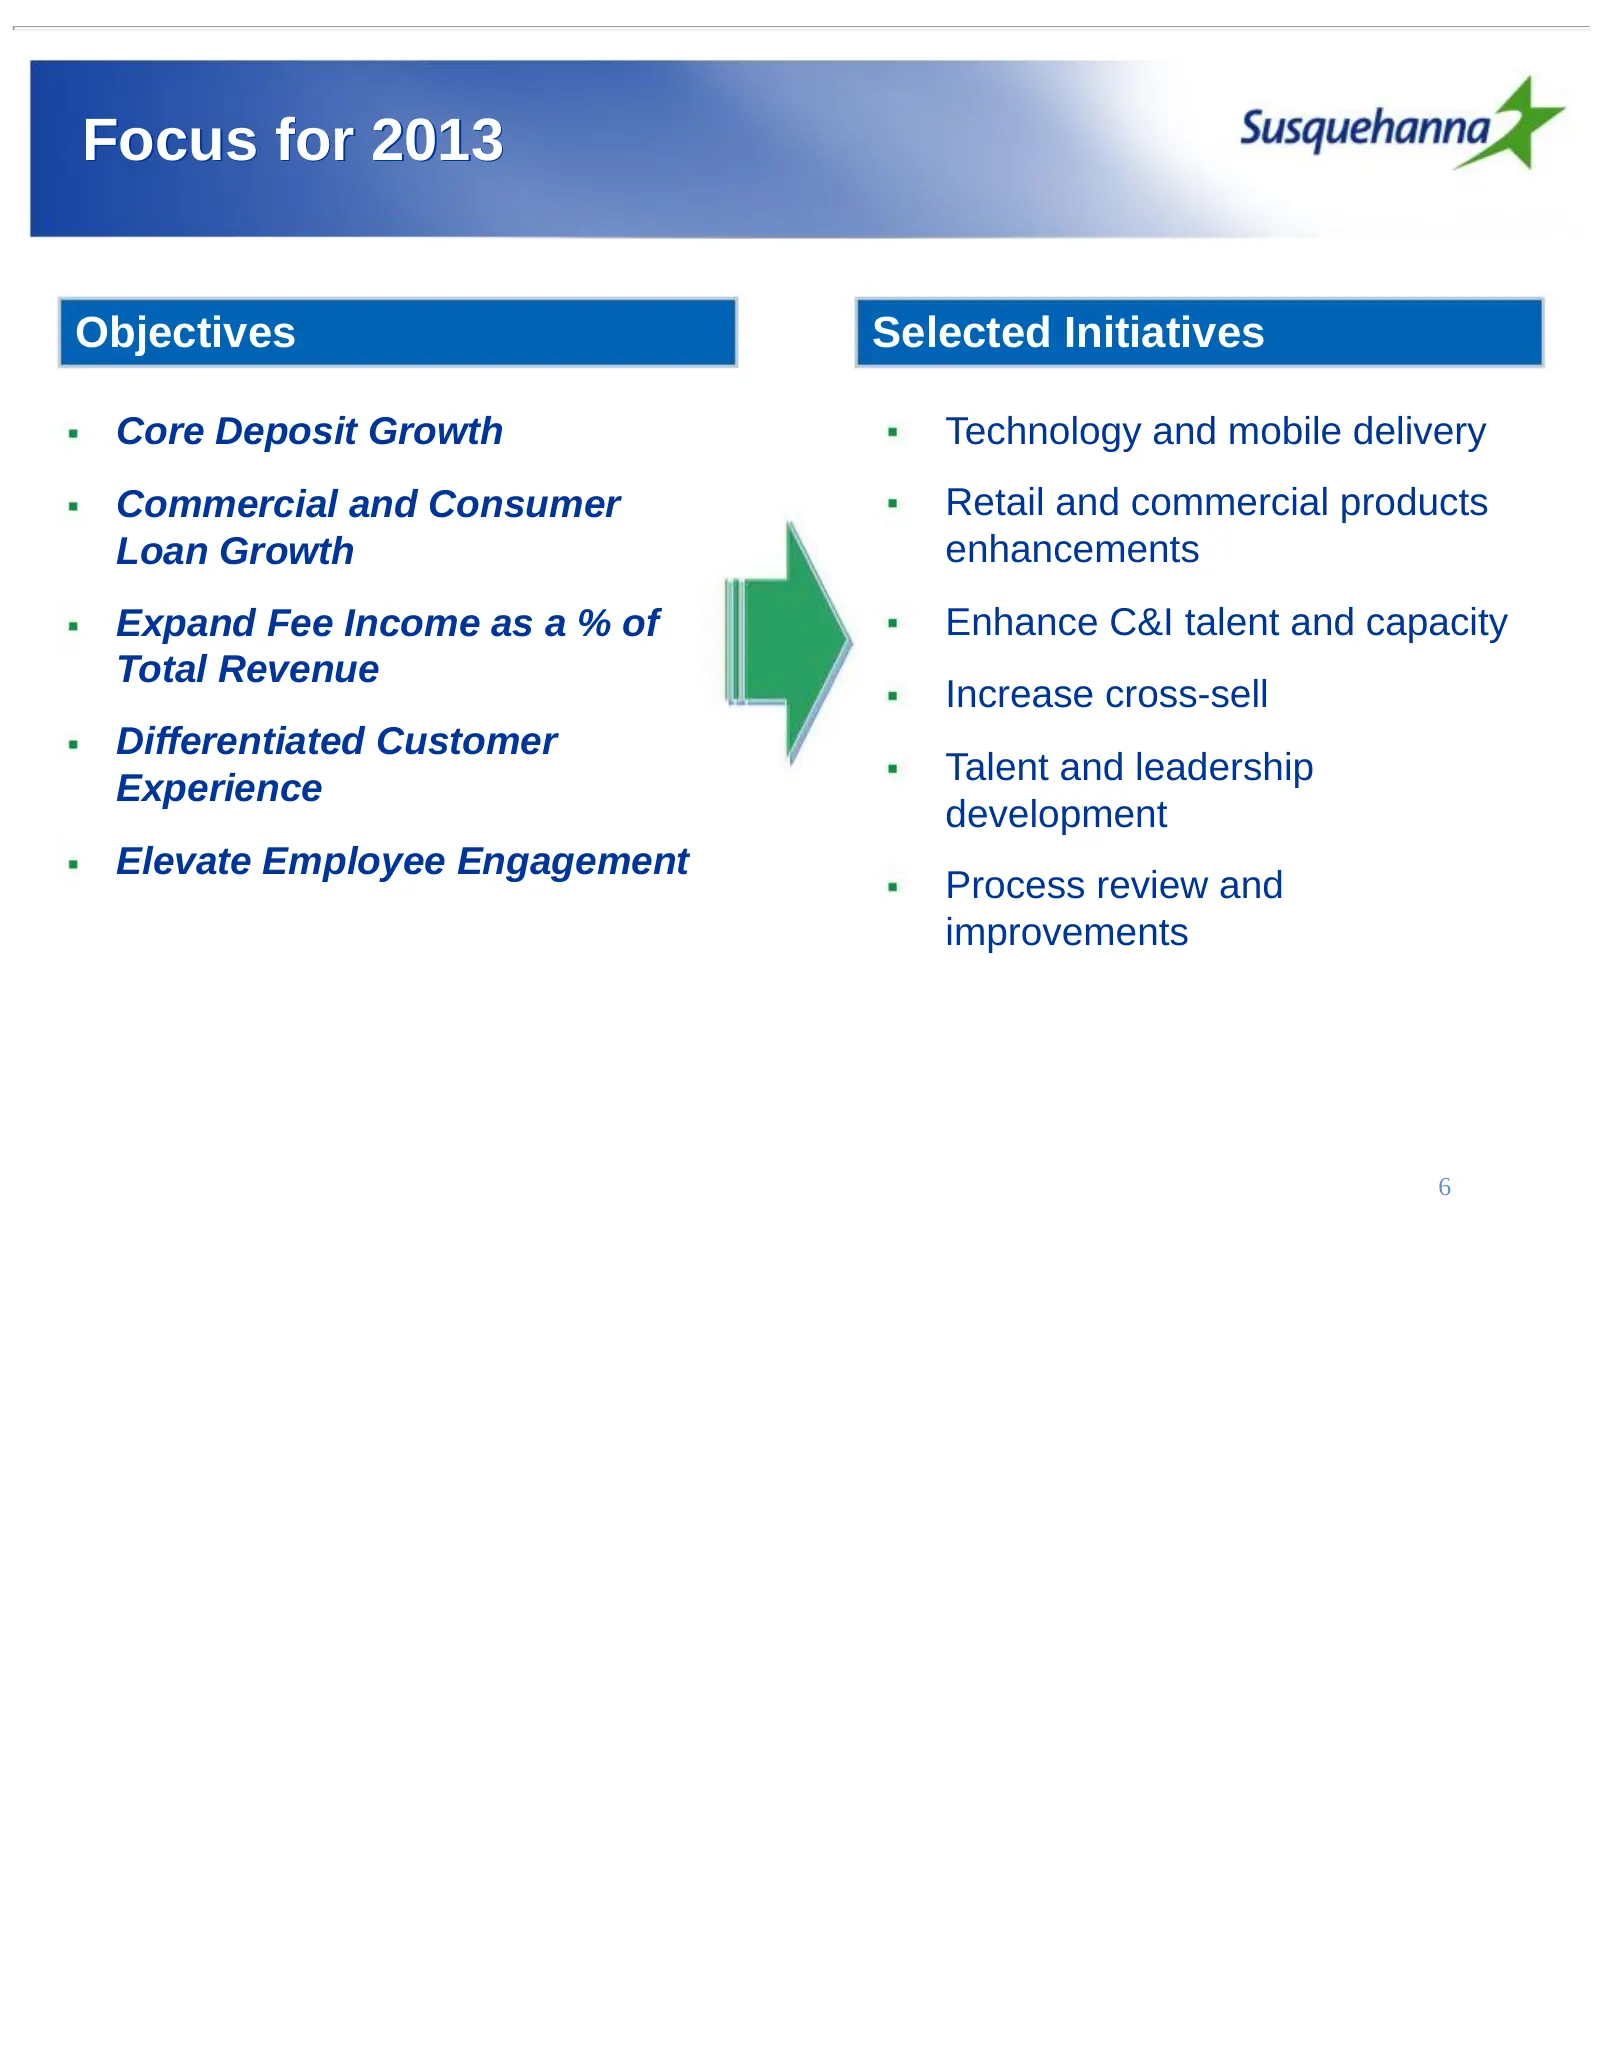
Focus for 2013 Objectives Selected Initiatives Core Deposit Growth Technology and mobile delivery Commercial and Consumer Retail and commercial products Loan Growth enhancements Expand Fee Income as a % of Enhance C&I talent and capacity Total Revenue Increase cross-sell Differentiated Customer Tale
Slide 7: 1st Quarter 2013 Highlights
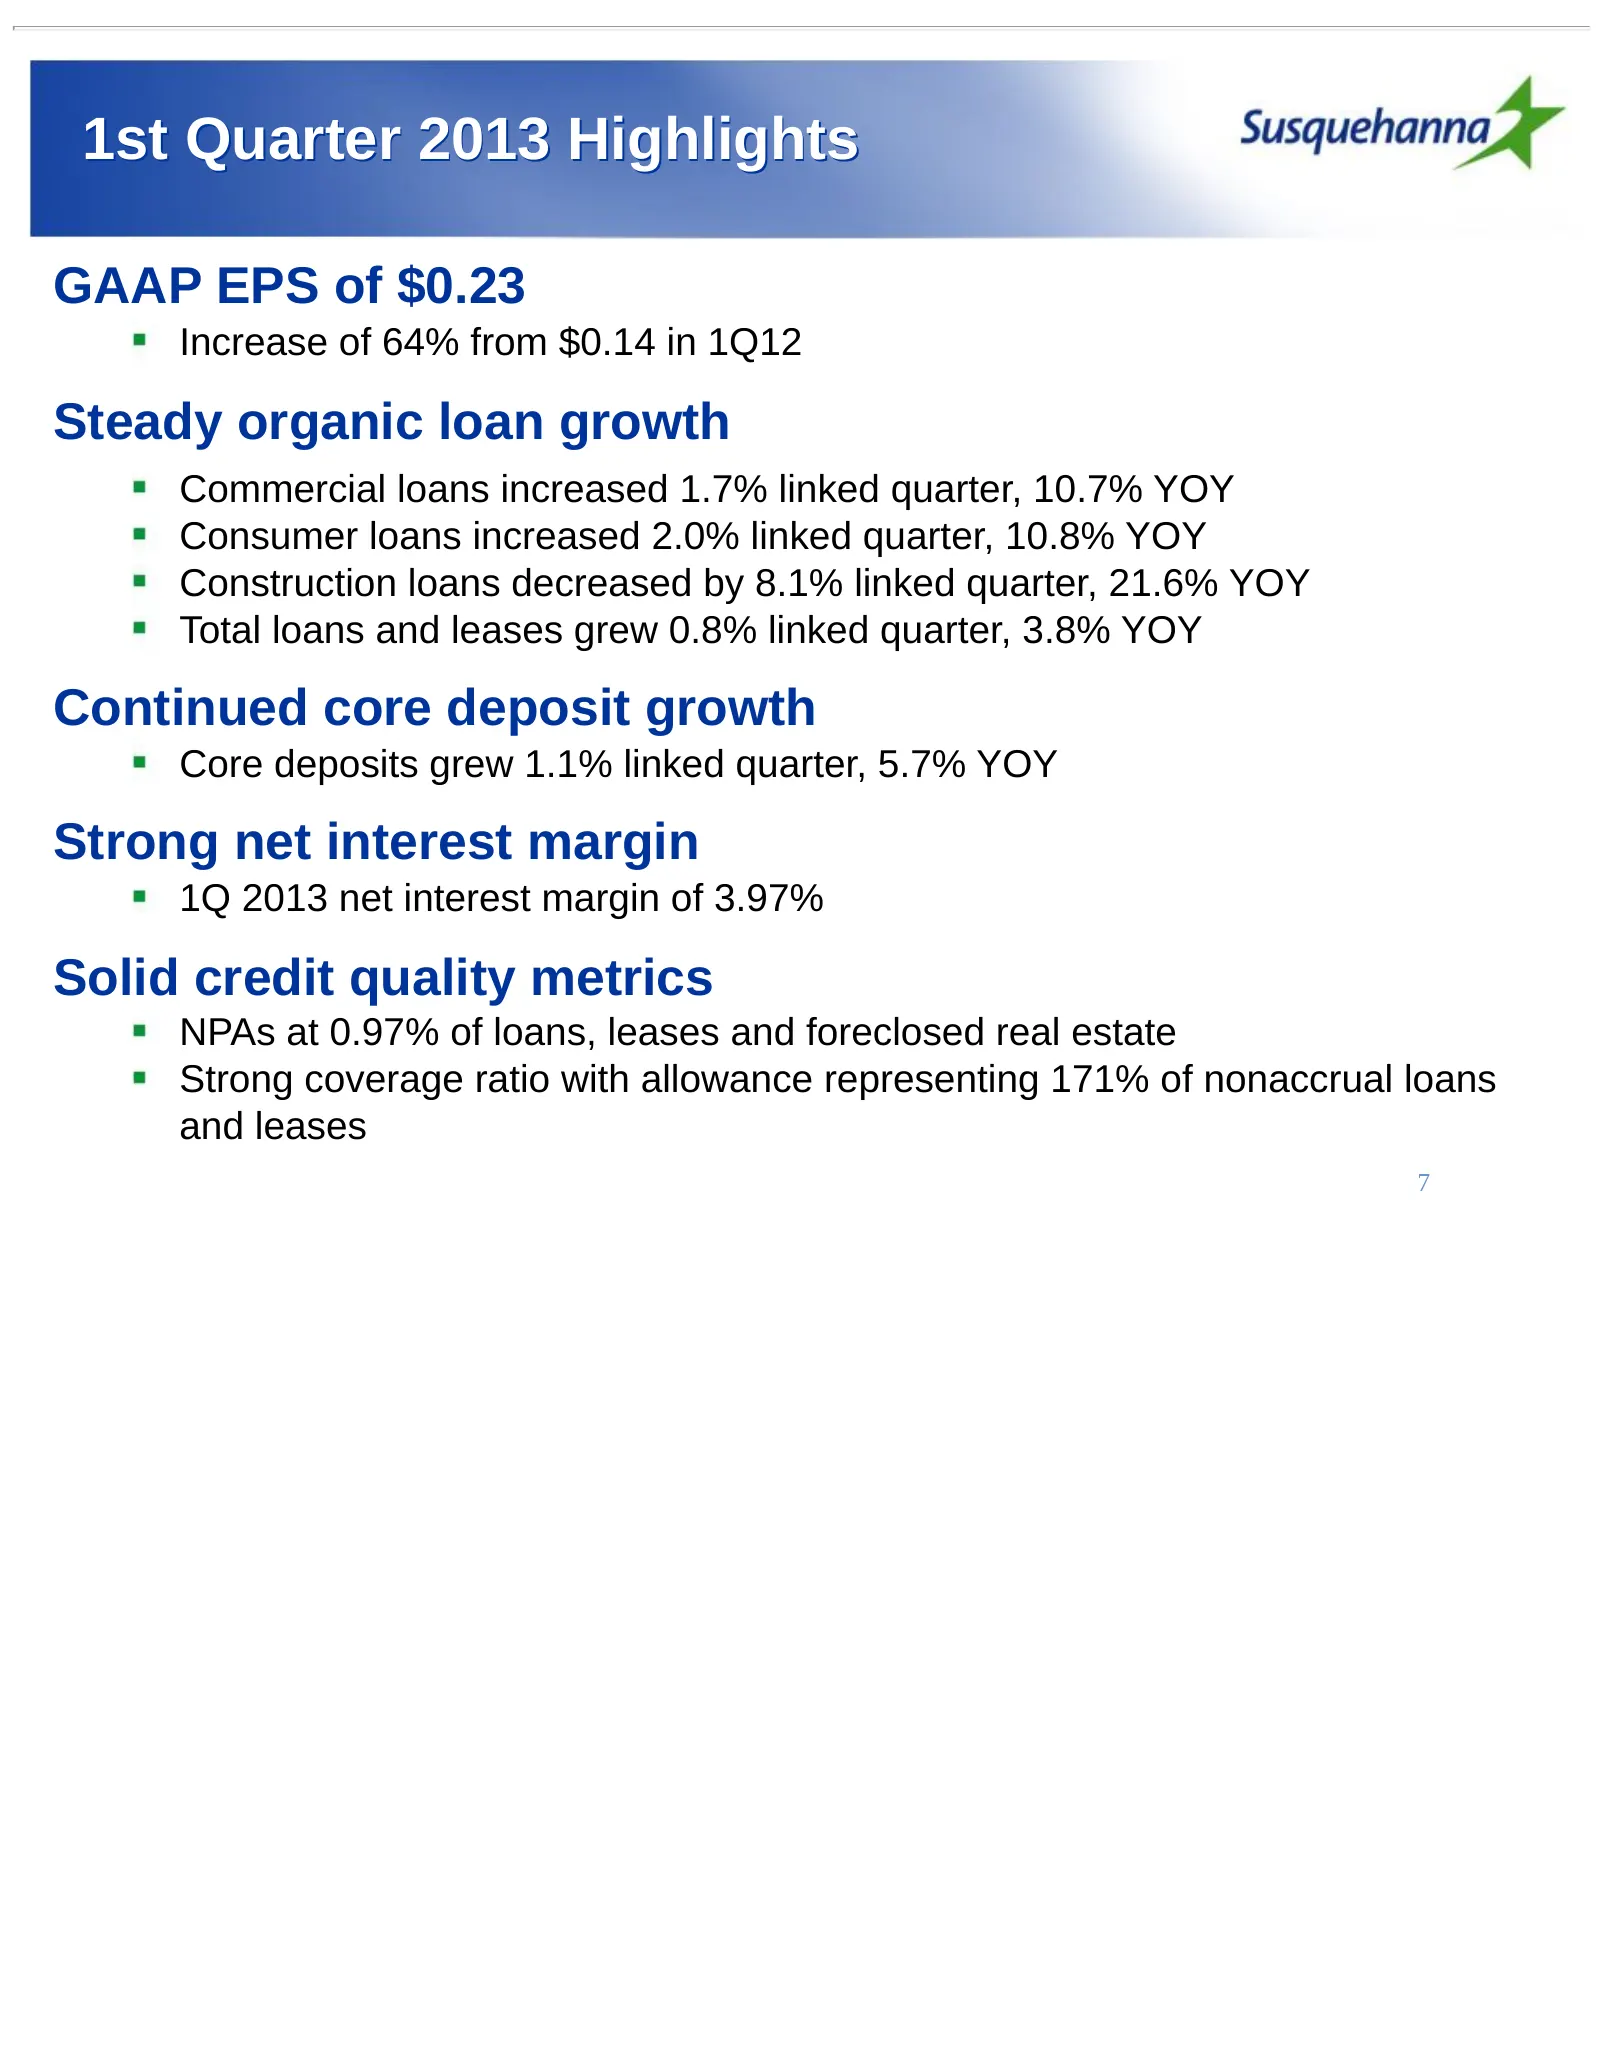
1st Quarter 2013 Highlights GAAP EPS of $0.23 Increase of 64% from $0.14 in 1Q12 Steady organic loan growth Commercial loans increased 1.7% linked quarter, 10.7% YOY Consumer loans increased 2.0% linked quarter, 10.8% YOY Construction loans decreased by 8.1% linked quarter, 21.6% YOY Total loans and
Slide 8: Momentum: Loan Growth
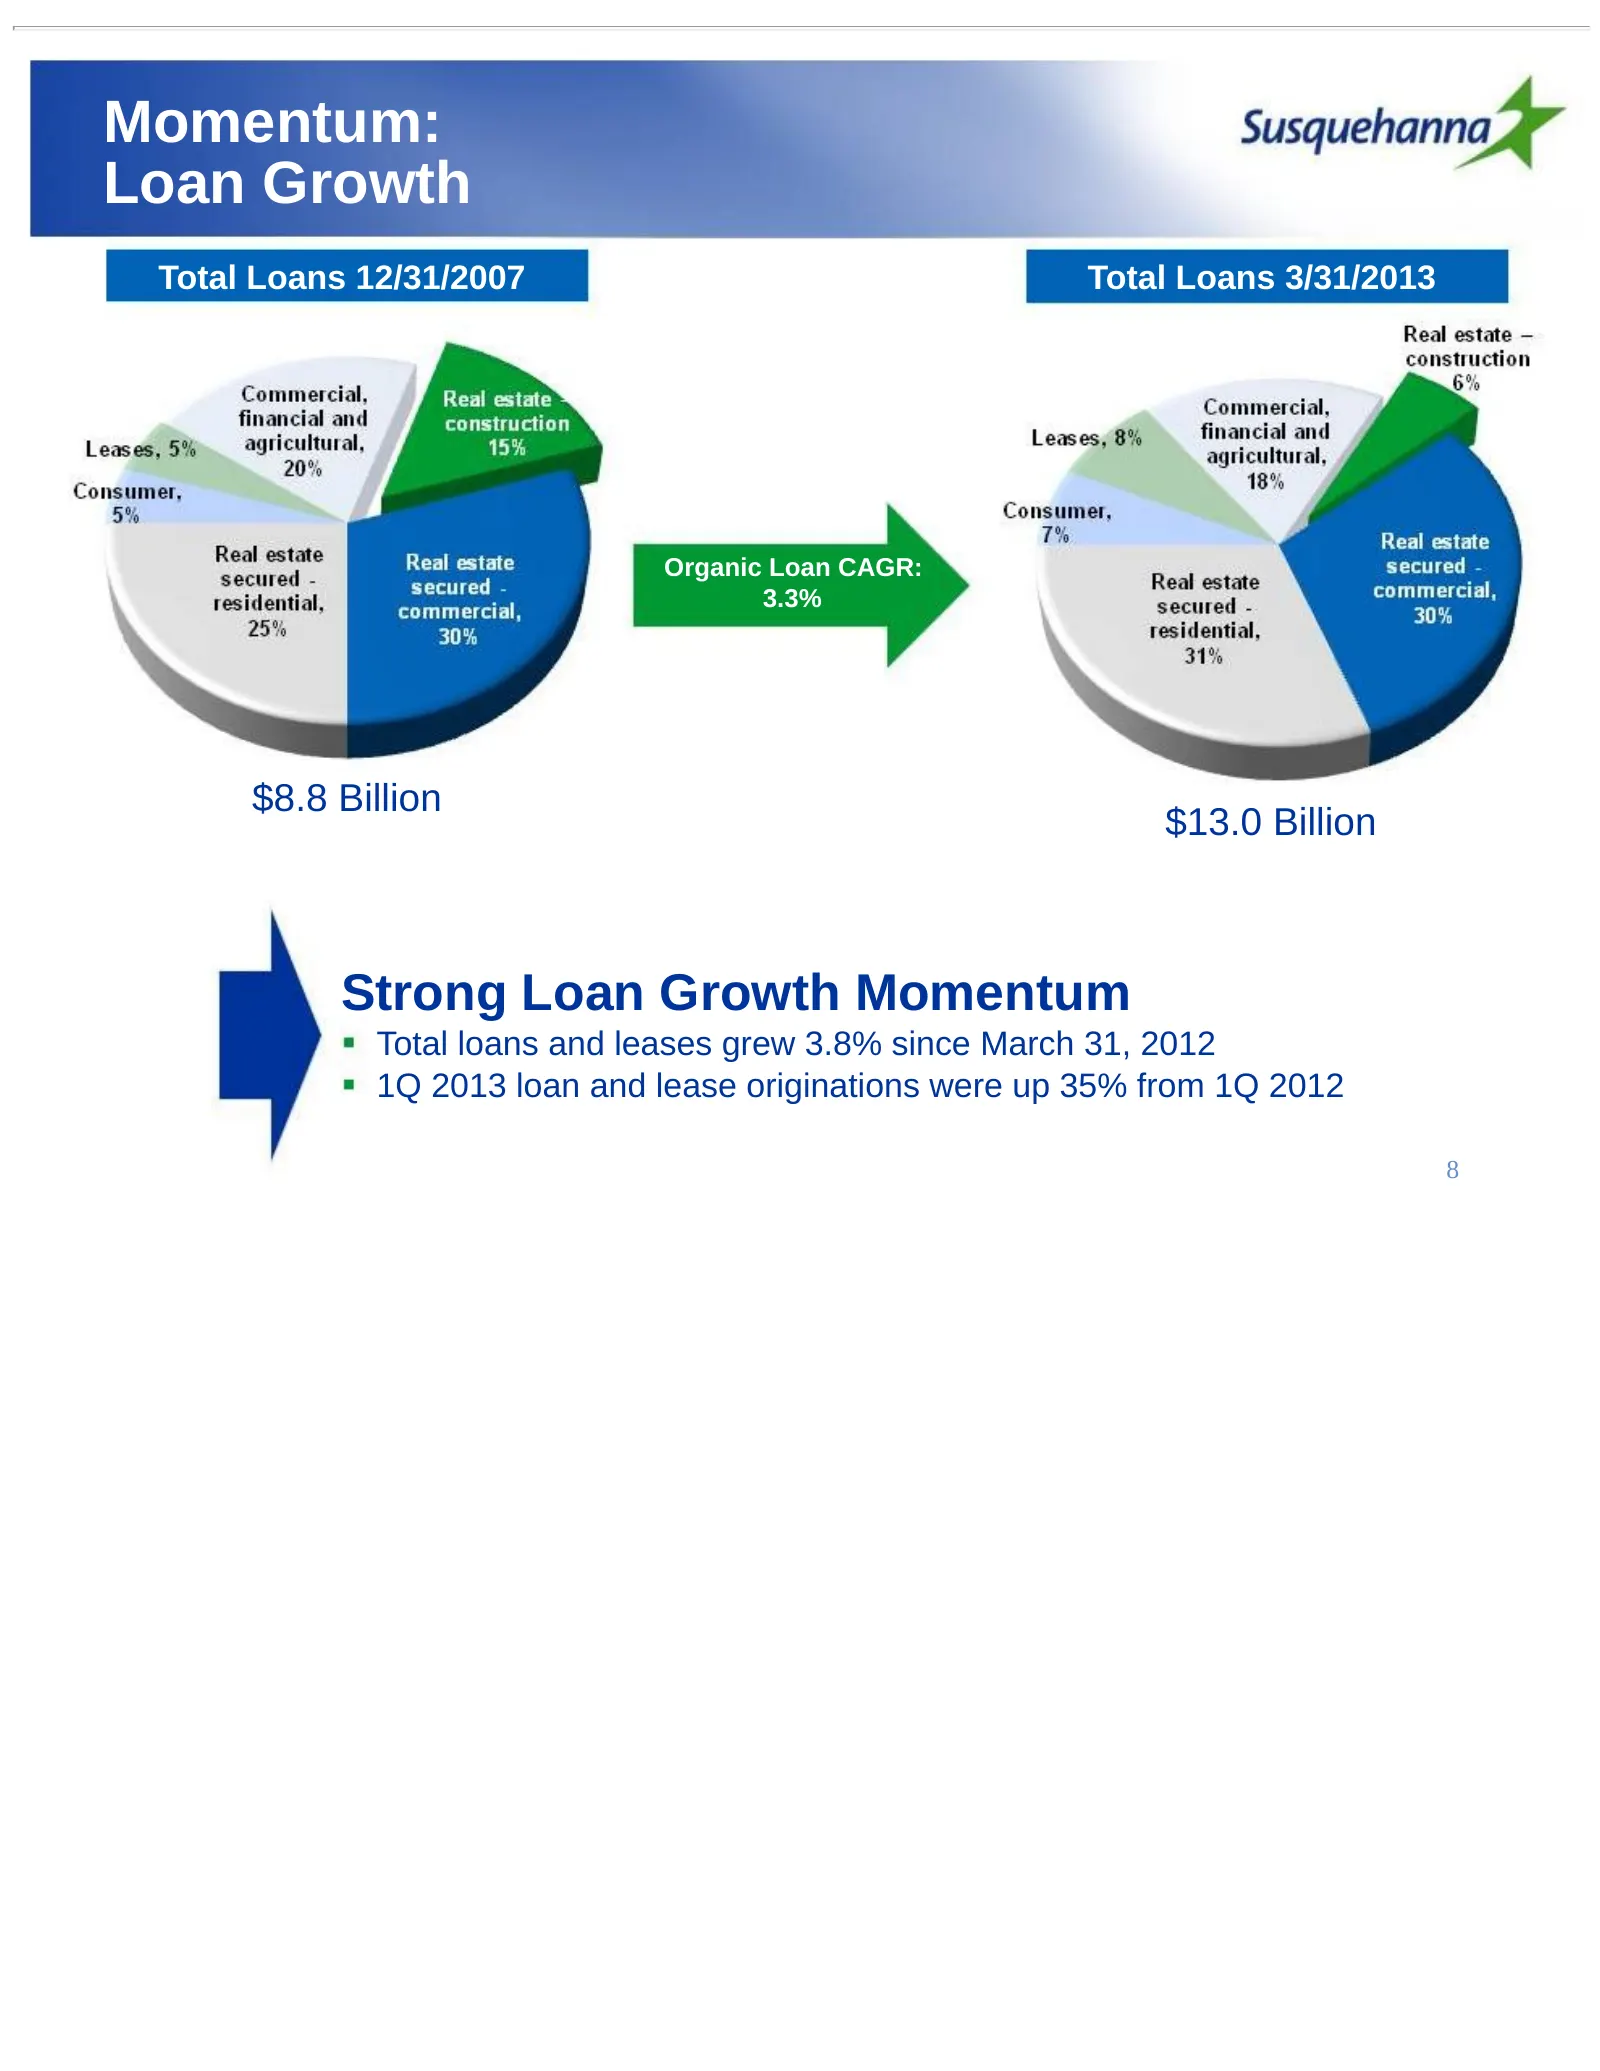
Momentum: Loan Growth Total Loans 12/31/2007 Total Loans 3/31/2013 Organic Loan CAGR: 3.3% $8.8 Billion $13.0 Billion Strong Loan Growth Momentum Total loans and leases grew 3.8% since March 31, 2012 1Q 2013 loan and lease originations were up 35% from 1Q 2012 8
Slide 9: Asset Quality Continues to Improve
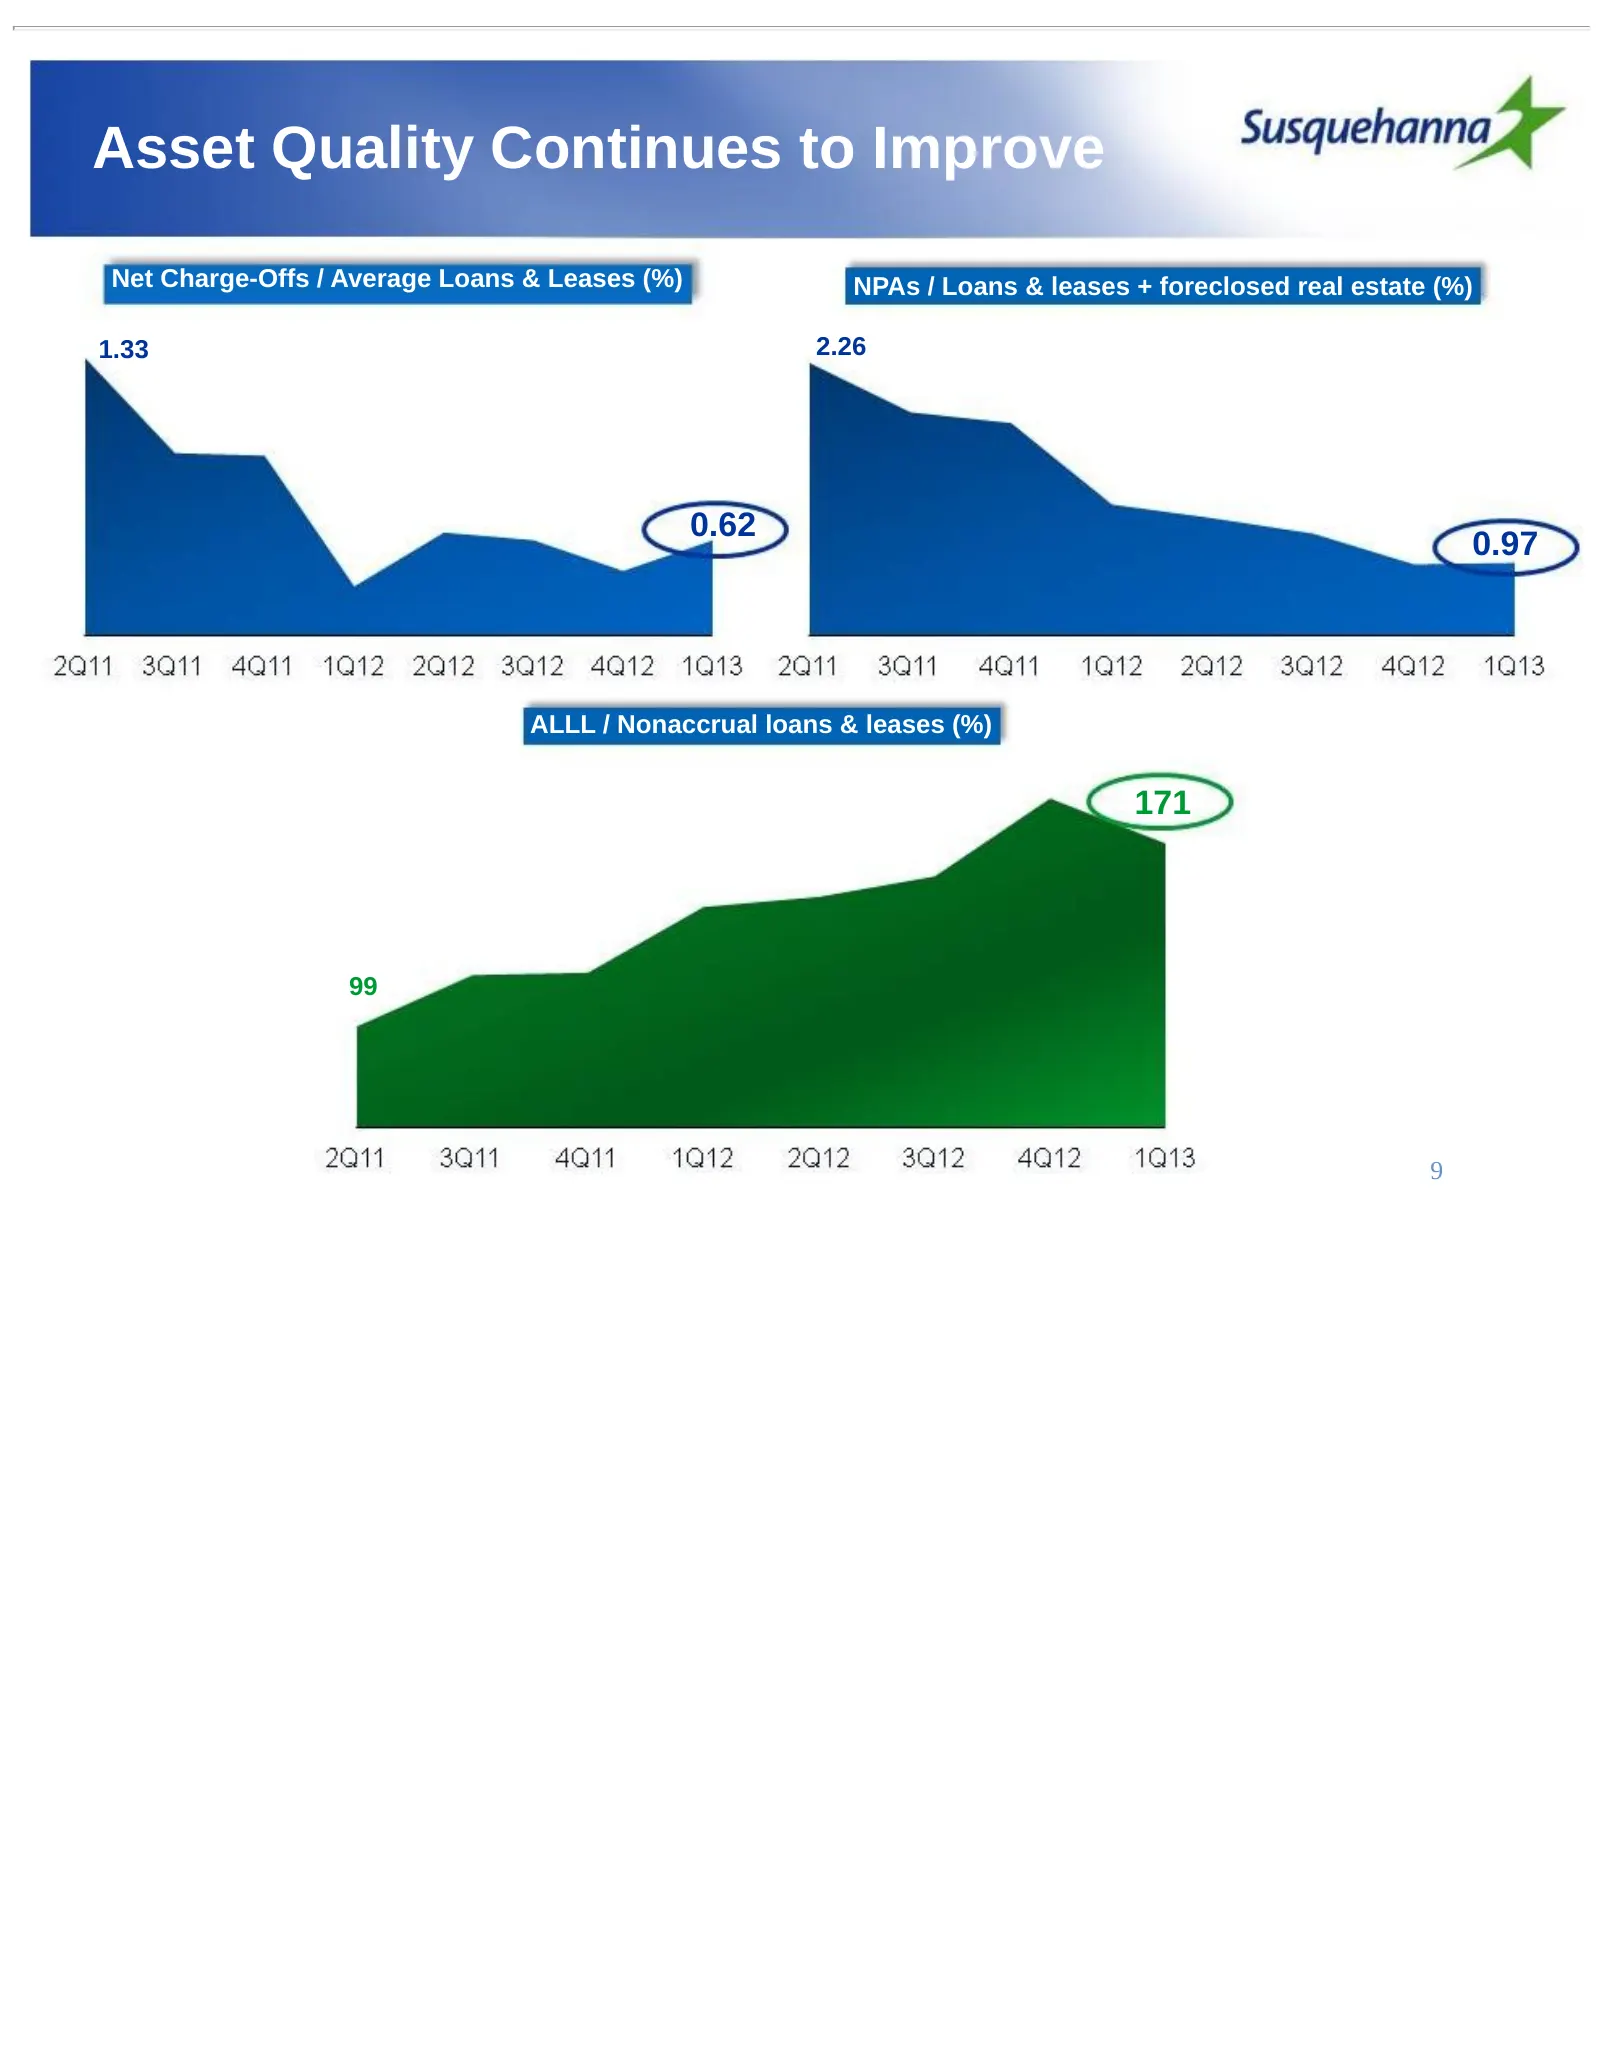
Asset Quality Continues to Improve Net Charge-Offs / Average Loans & Leases (%) NPAs / Loans & leases + foreclosed real estate (%) 1.33 2.26 0.62 0.97 ALLL / Nonaccrual loans & leases (%) 171 99 9
Slide 10: Positioned For Further Growth
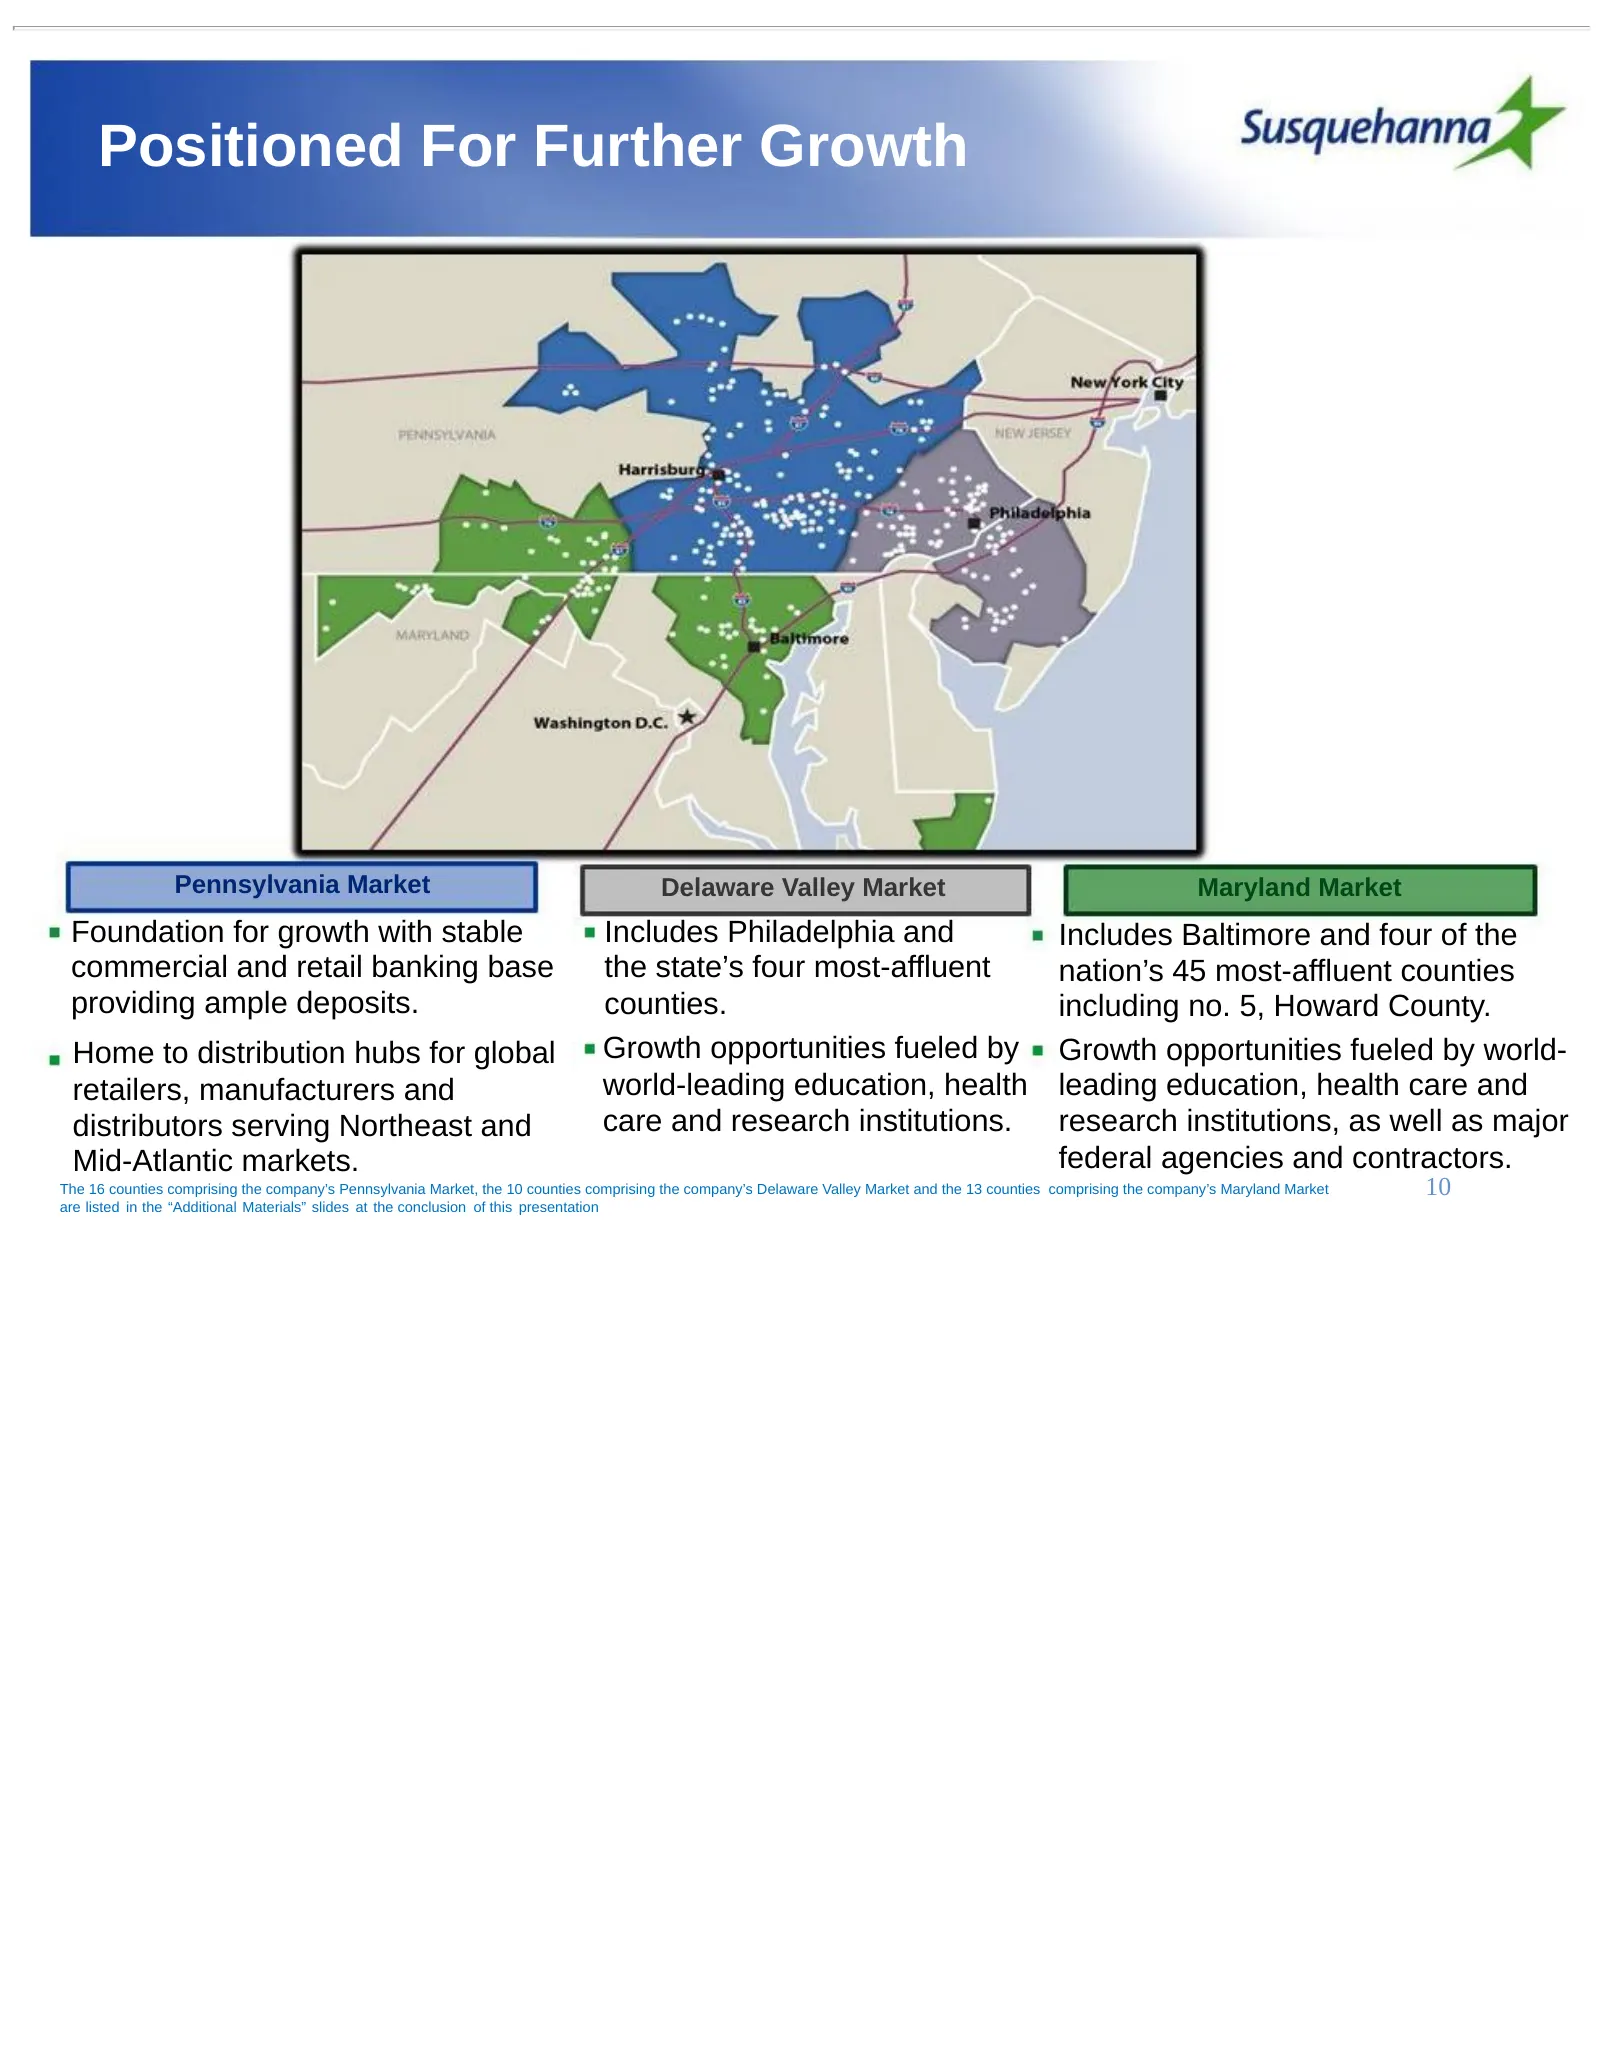
Positioned For Further Growth Pennsylvania Market Delaware Valley Market Maryland Market Foundation for growth with stable Includes Philadelphia and Includes Baltimore and four of the commercial and retail banking base the state’s four most-affluent nation’s 45 most-affluent counties providing ample
Slide 11: Market Opportunity
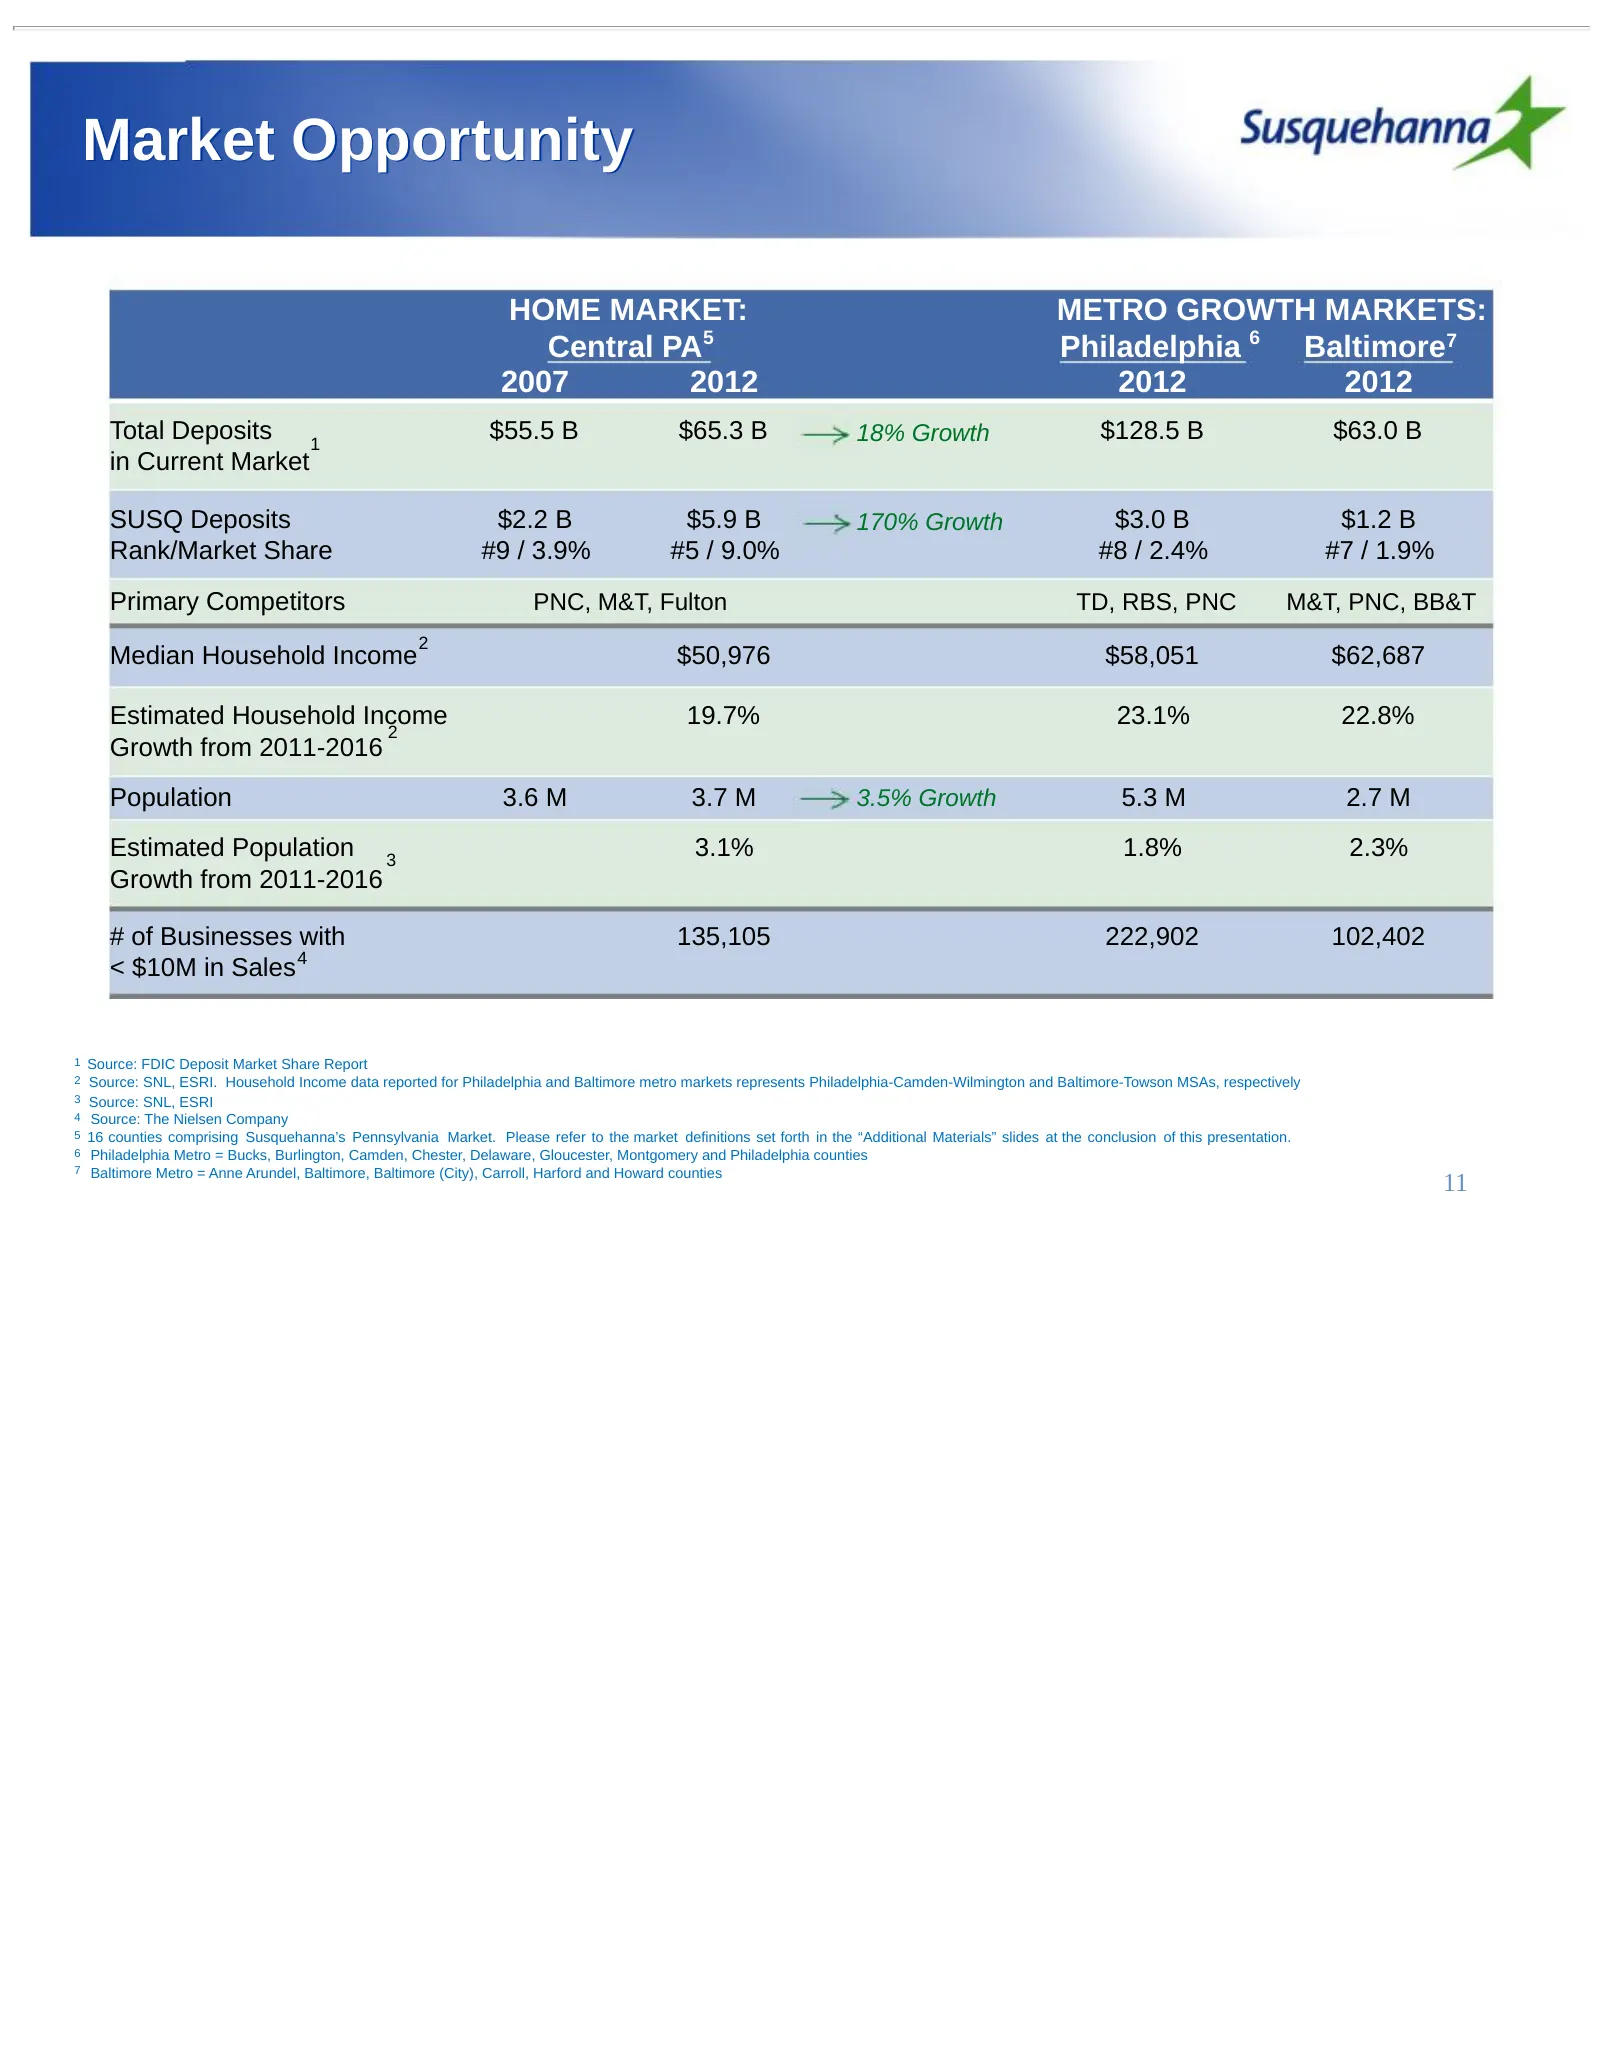
Market Opportunity HOME MARKET: METRO GROWTH MARKETS: Central PA5 Philadelphia 6 Baltimore7 2007 2012 2012 2012 Total Deposits 1 $55.5 B $65.3 B 18% Growth $128.5 B $63.0 B in Current Market SUSQ Deposits $2.2 B $5.9 B 170% Growth $3.0 B $1.2 B Rank/Market Share #9 / 3.9% #5 / 9.0% #8 / 2.4% #7 / 1.
Slide 12: Momentum: Defending Net Interest Margin
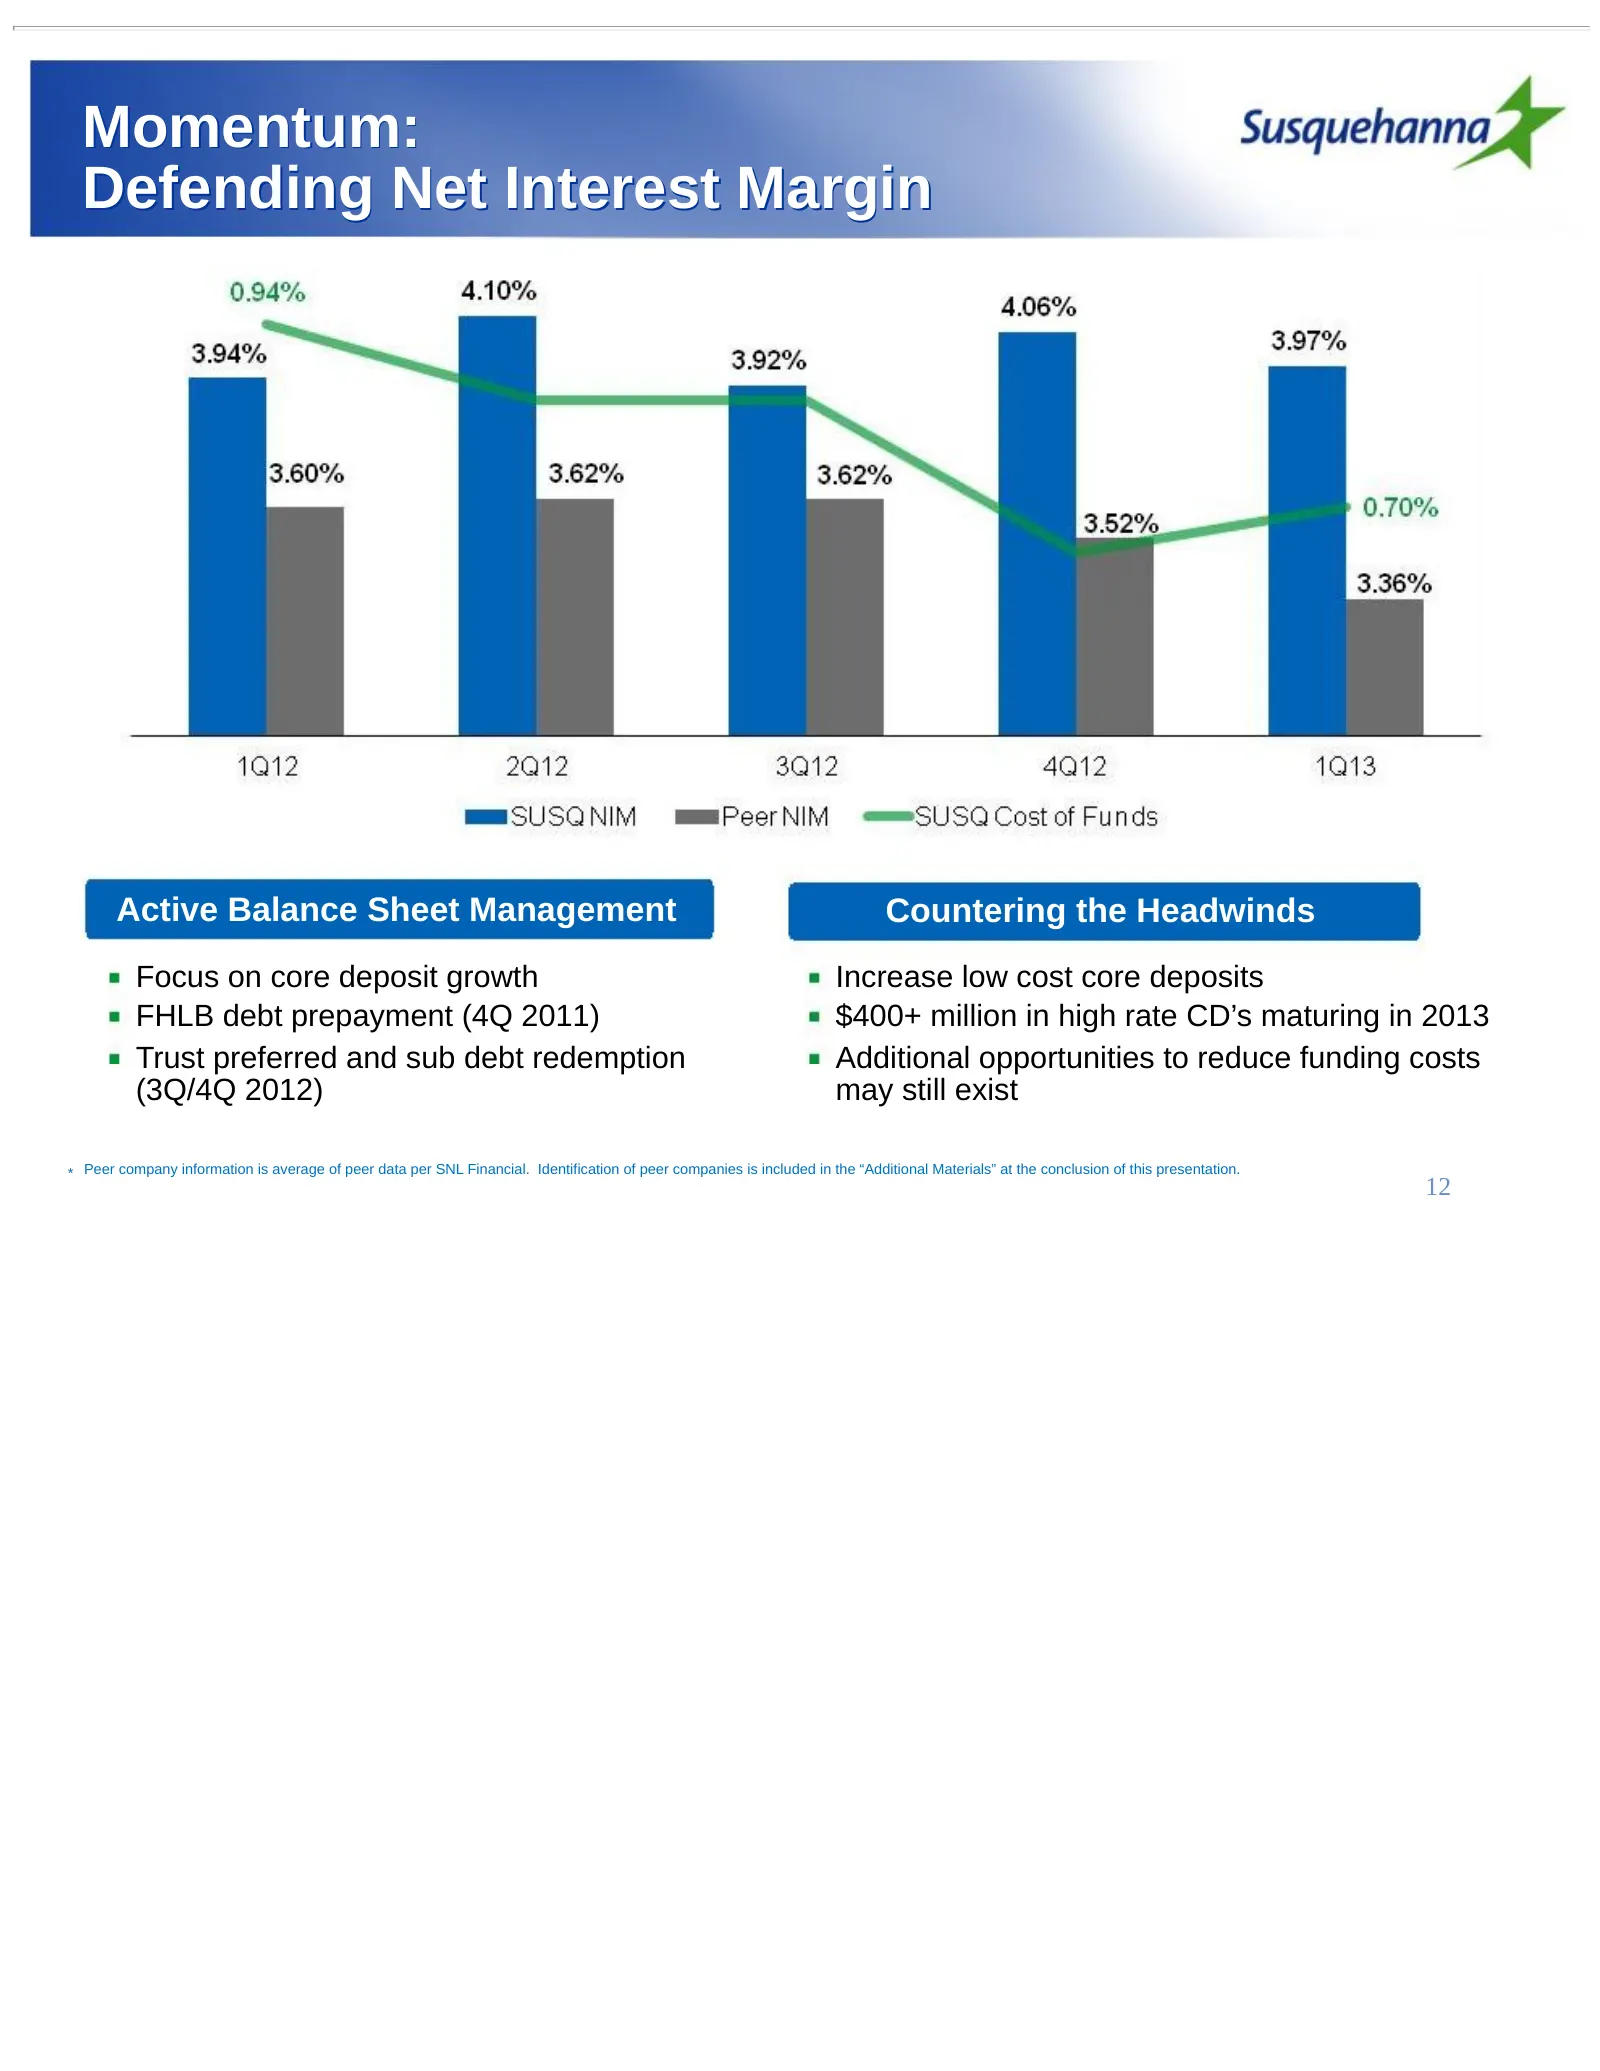
Momentum: Defending Net Interest Margin Active Balance Sheet Management Countering the Headwinds Focus on core deposit growth Increase low cost core deposits FHLB debt prepayment (4Q 2011) $400+ million in high rate CD’s maturing in 2013 Trust preferred and sub debt redemption Additional opportuniti
Slide 13: Strong Core Deposit Growth
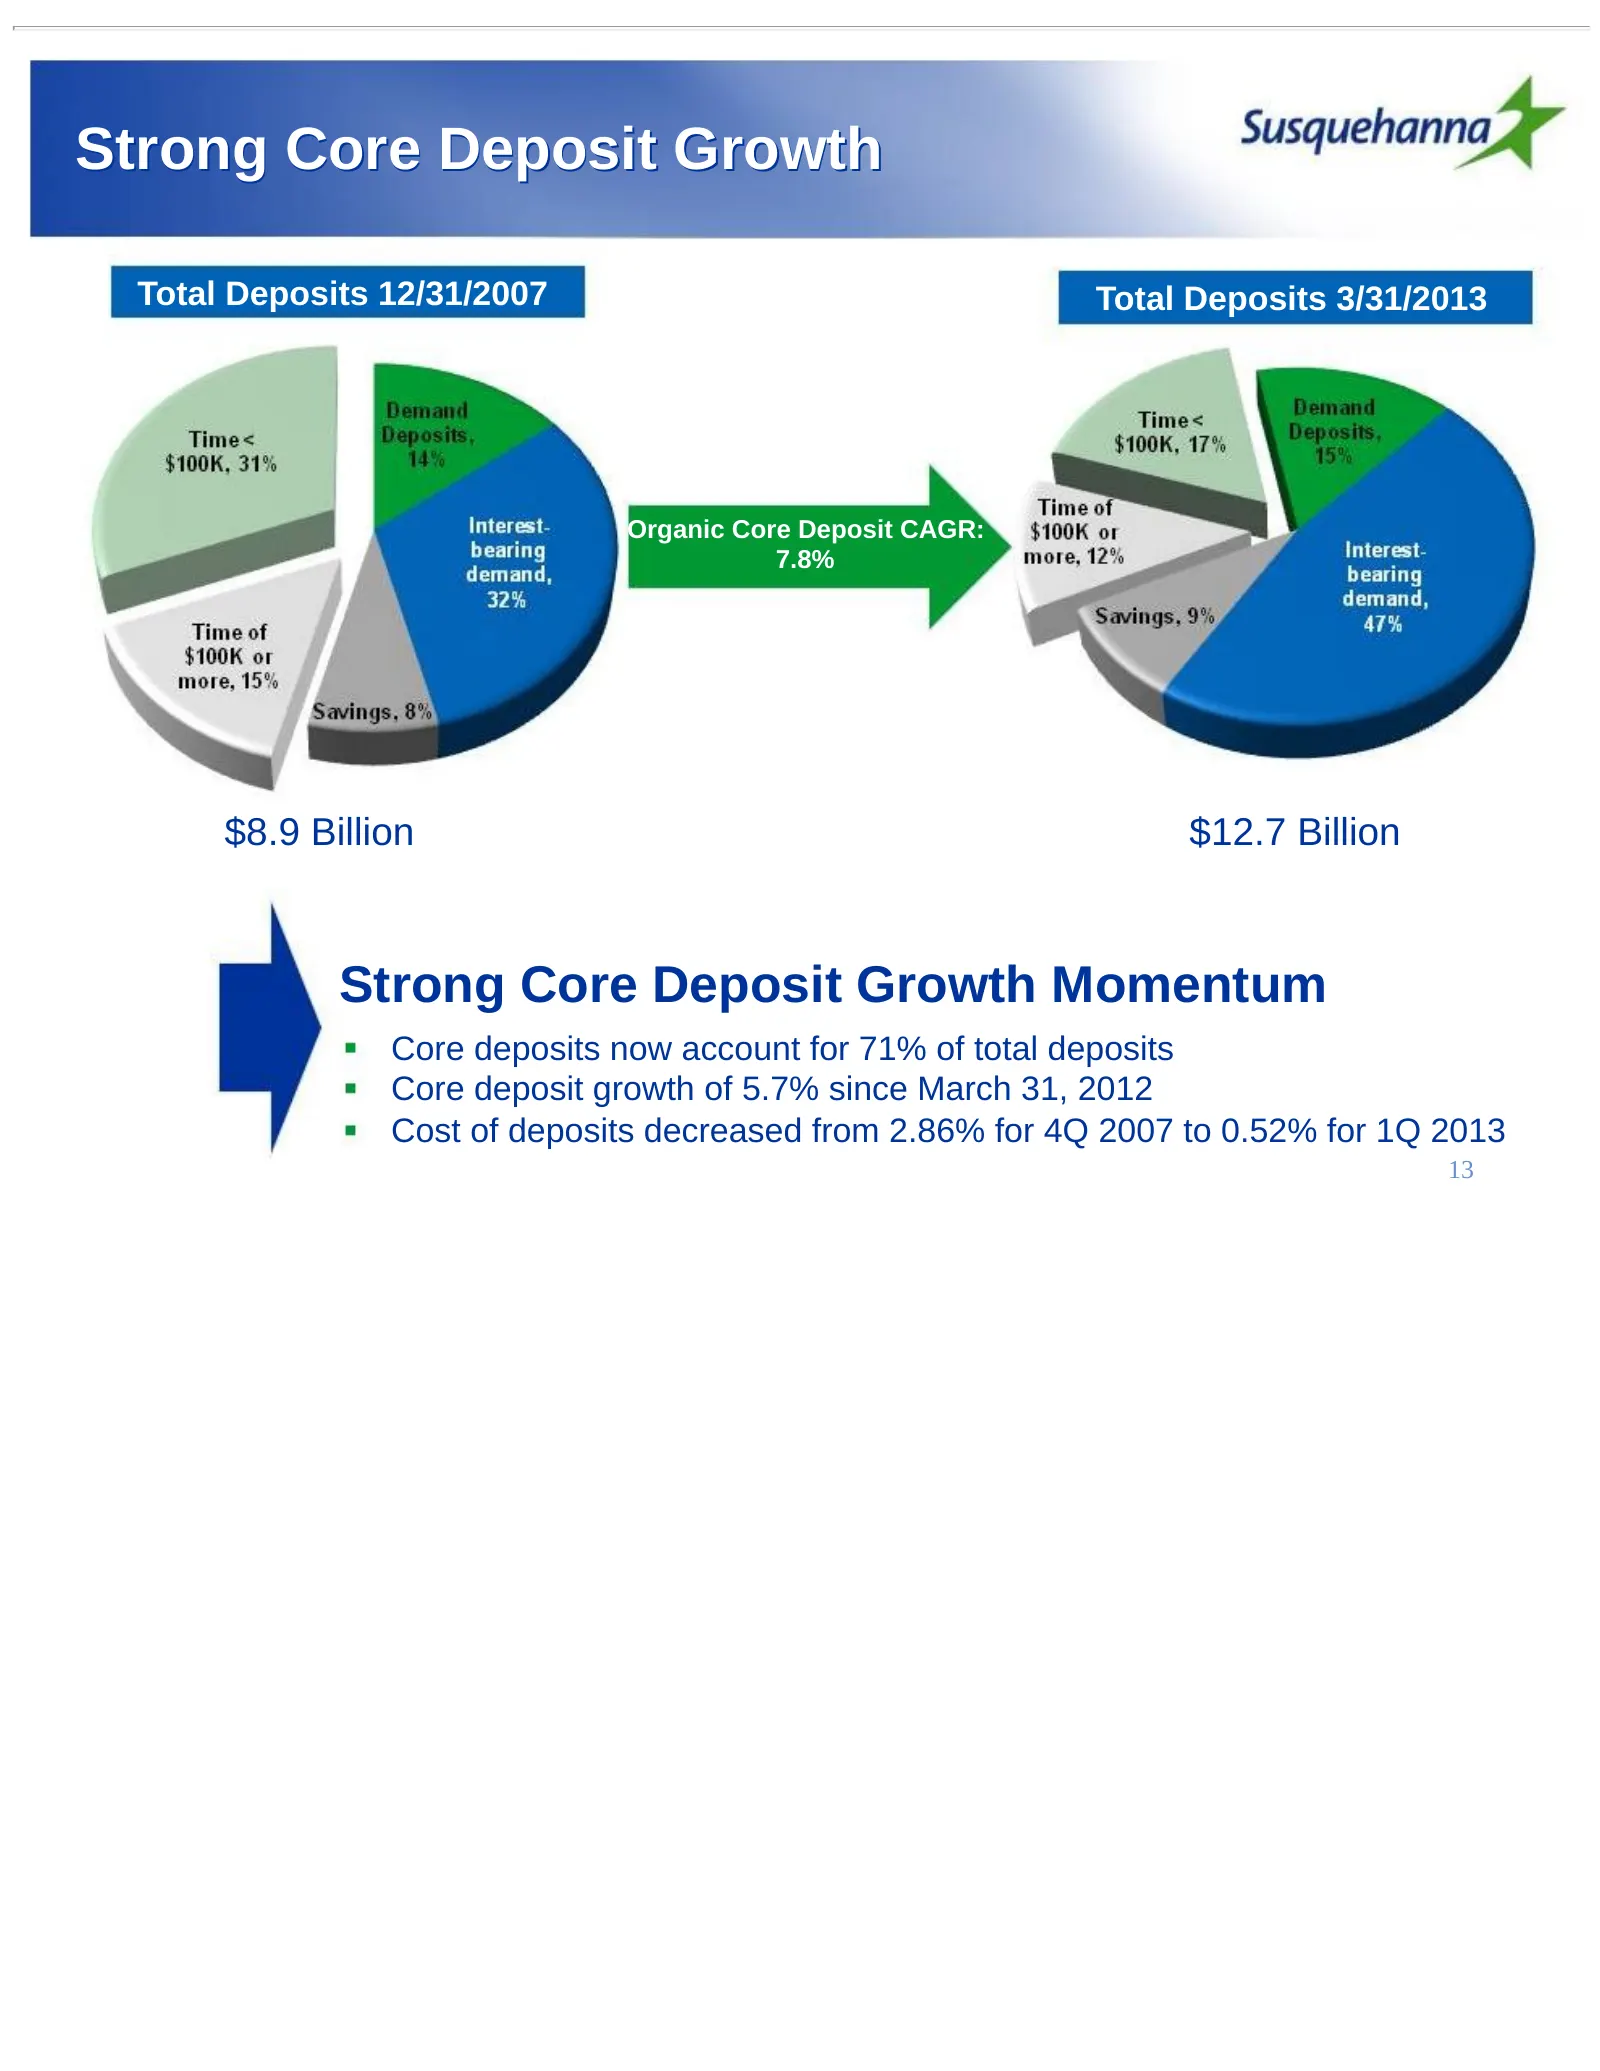
Strong Core Deposit Growth Total Deposits 12/31/2007 Total Deposits 3/31/2013 Organic Core Deposit CAGR: 7.8% $8.9 Billion $12.7 Billion Strong Core Deposit Growth Momentum Core deposits now account for 71% of total deposits Core deposit growth of 5.7% since March 31, 2012 Cost of deposits decreased
Slide 14: Momentum: Growing Fee Revenue
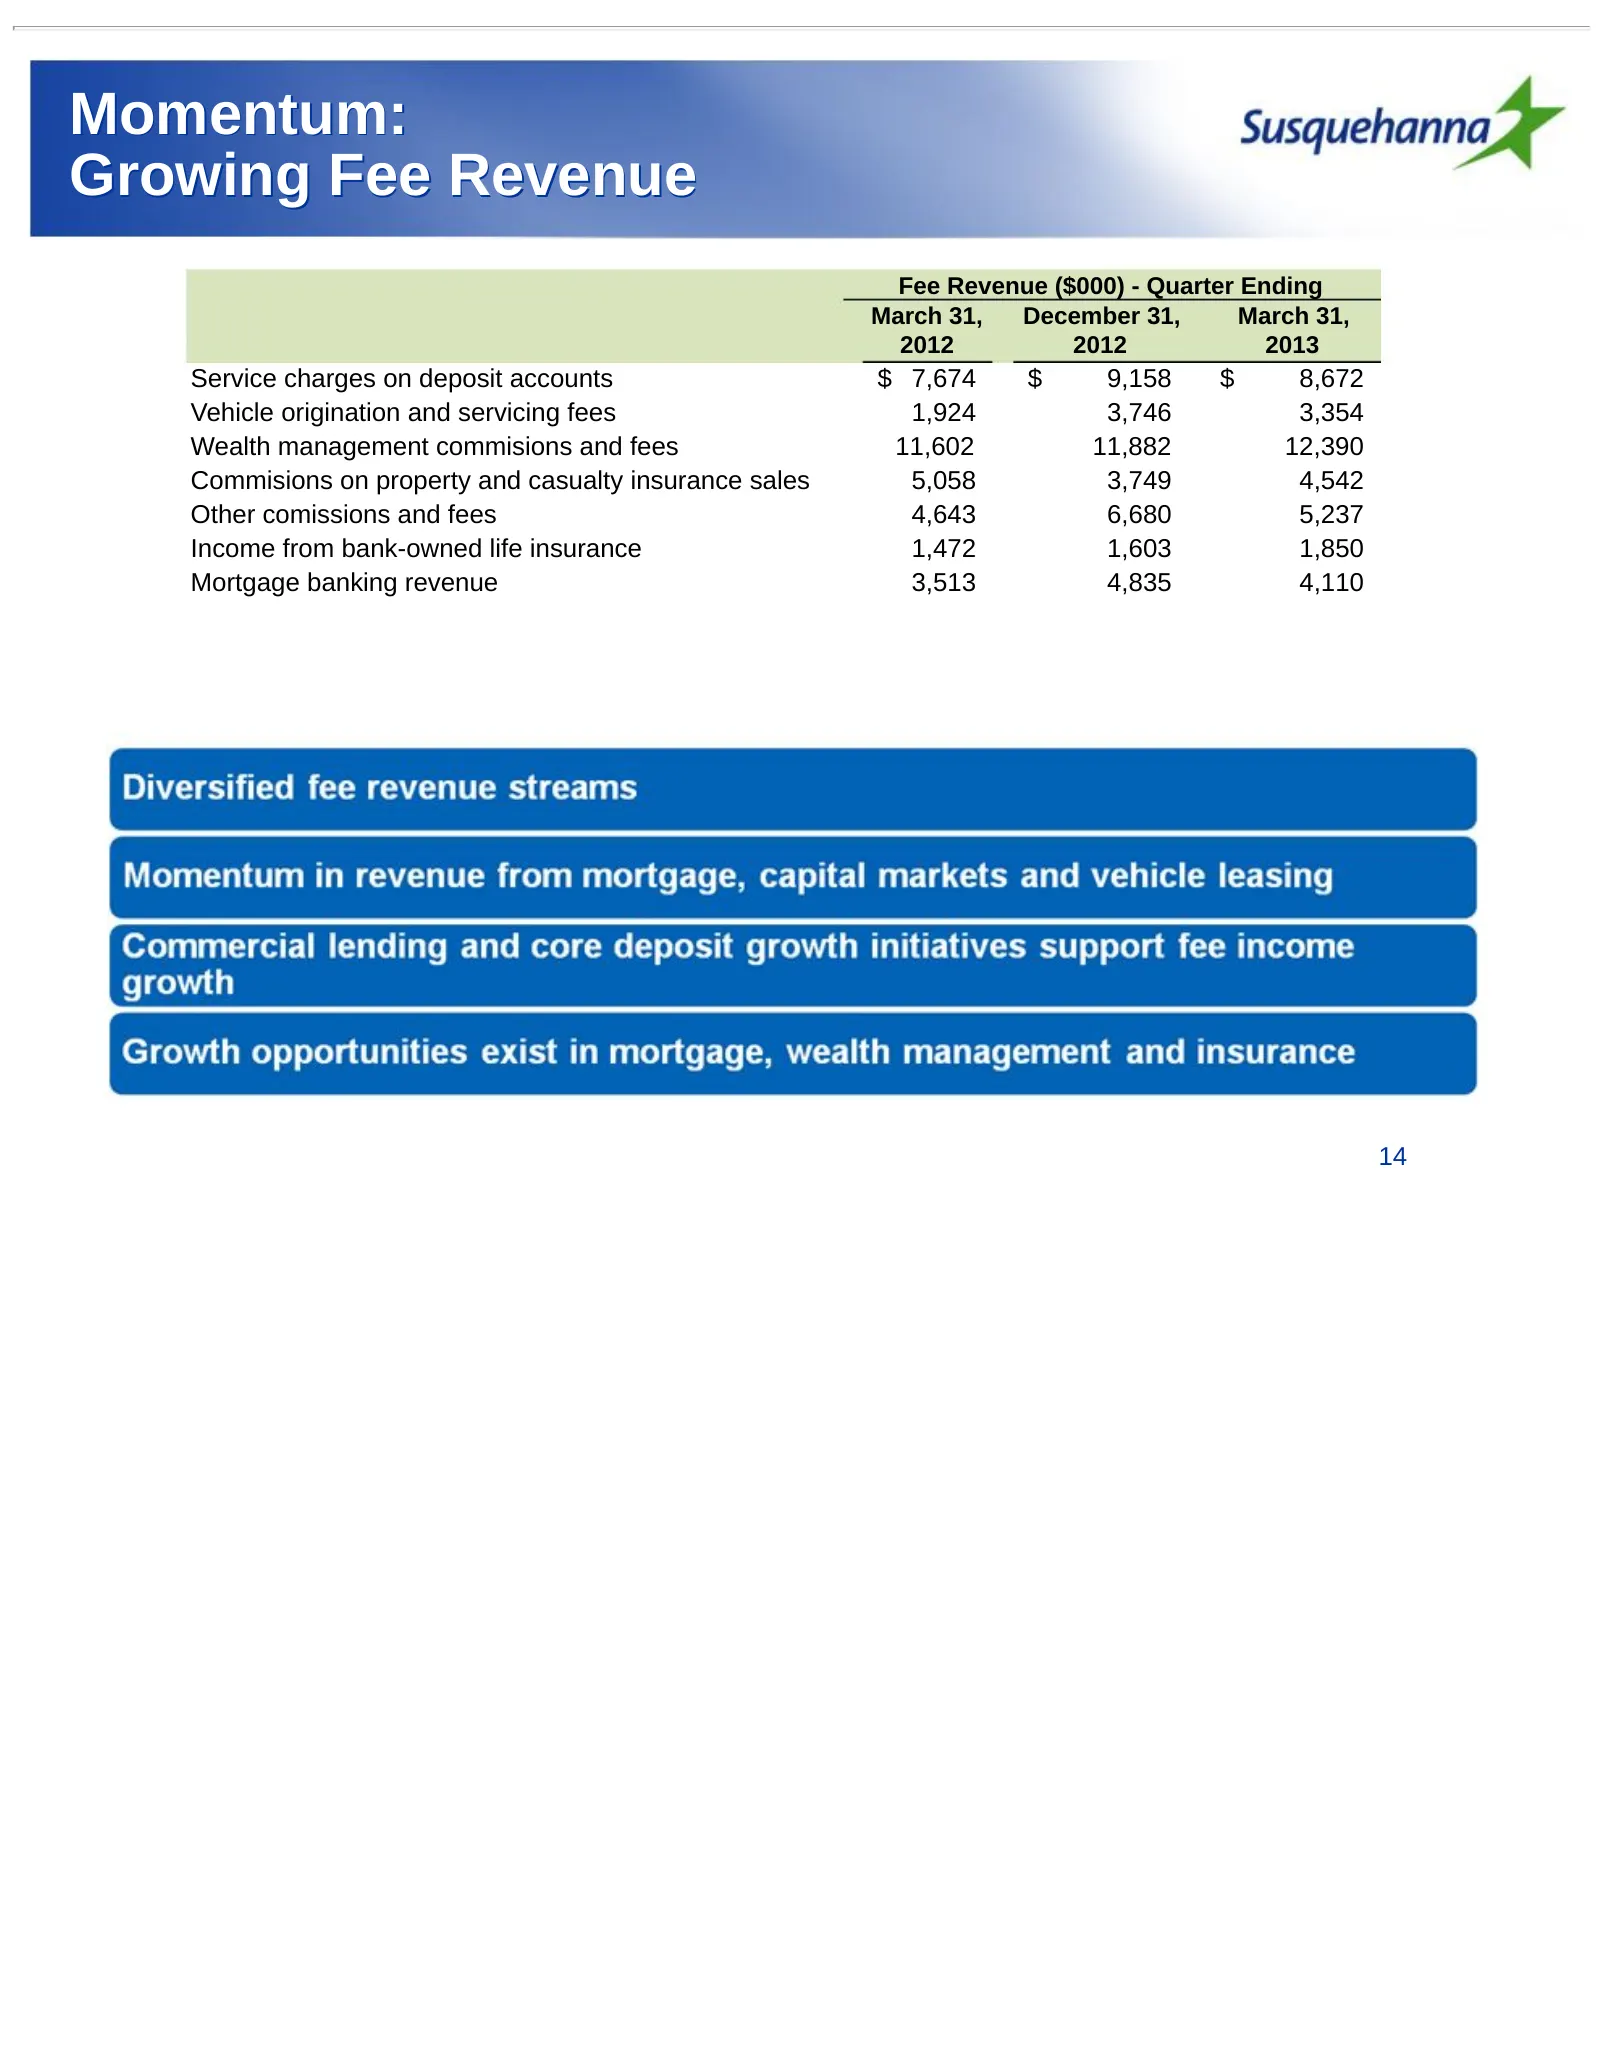
Momentum: Growing Fee Revenue Fee Revenue ($000) - Quarter Ending March 31, December 31, March 31, 2012 2012 2013 Service charges on deposit accounts $ 7,674 $ 9,158 $ 8,672 Vehicle origination and servicing fees 1,924 3,746 3,354 Wealth management commisions and fees 11,602 11,882 12,390 Commisions
Slide 15: Momentum: Efficiency Focus Benefits Core Performance
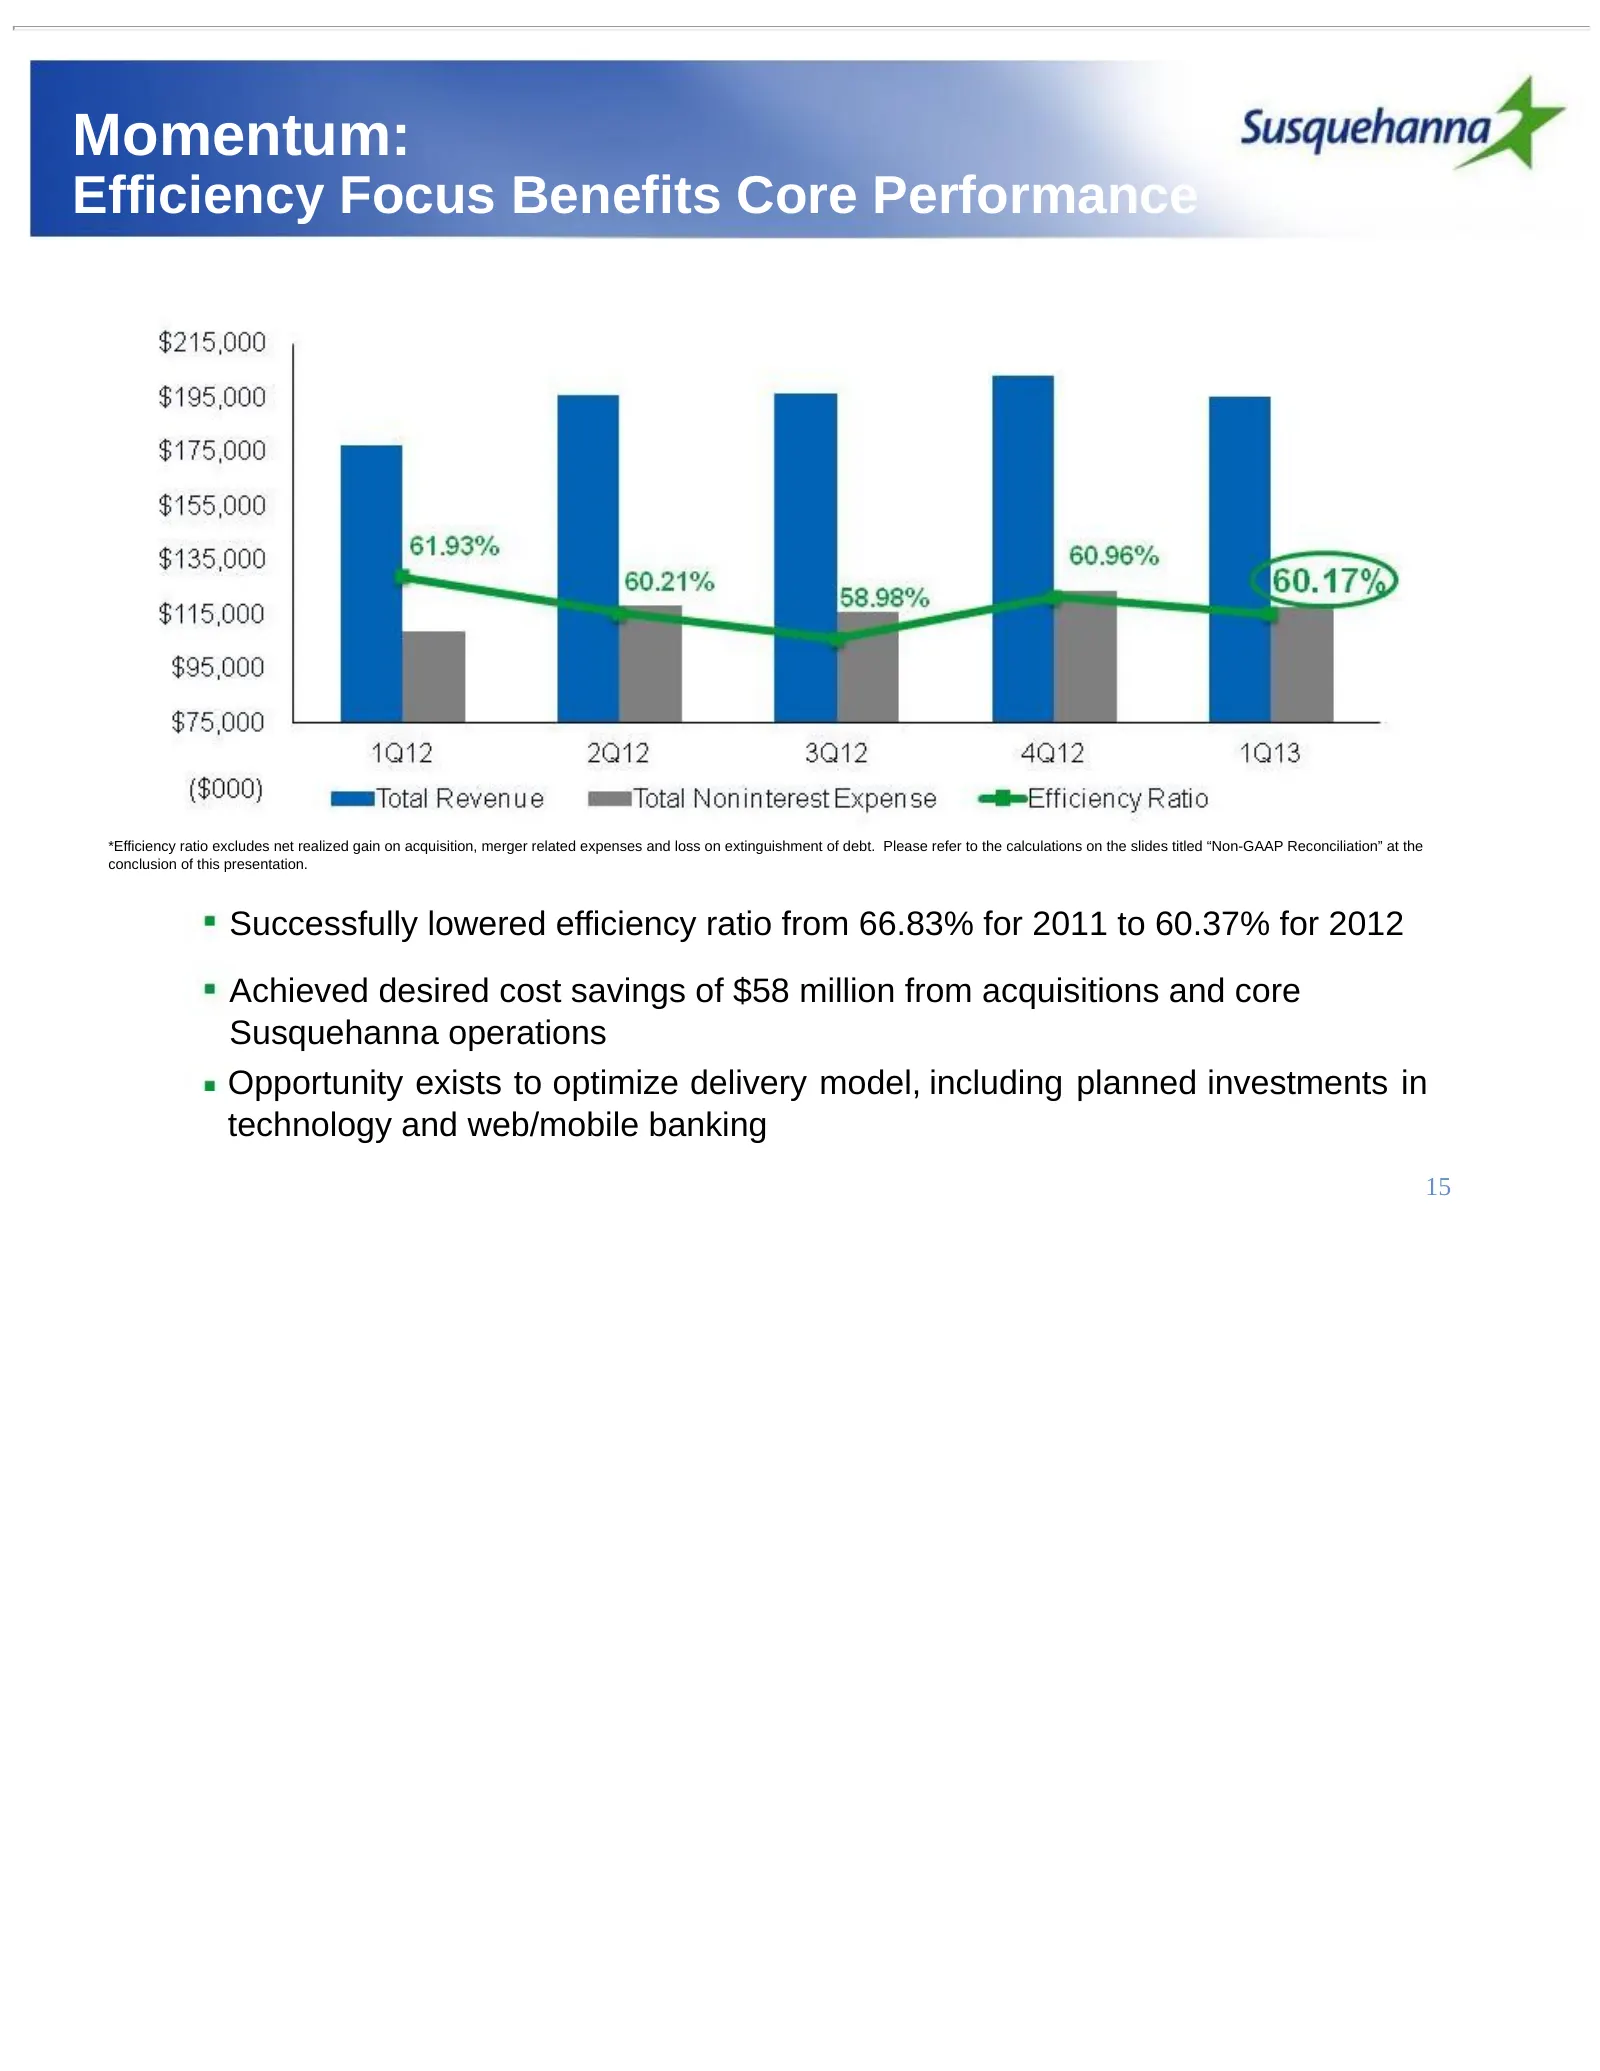
Momentum: Efficiency Focus Benefits Core Performance *Efficiency ratio excludes net realized gain on acquisition, merger related expenses and loss on extinguishment of debt. Please refer to the calculations on the slides titled “Non-GAAP Reconciliation” at the conclusion of this presentation. Succes
Slide 16: Momentum: Capital Generation and Returns
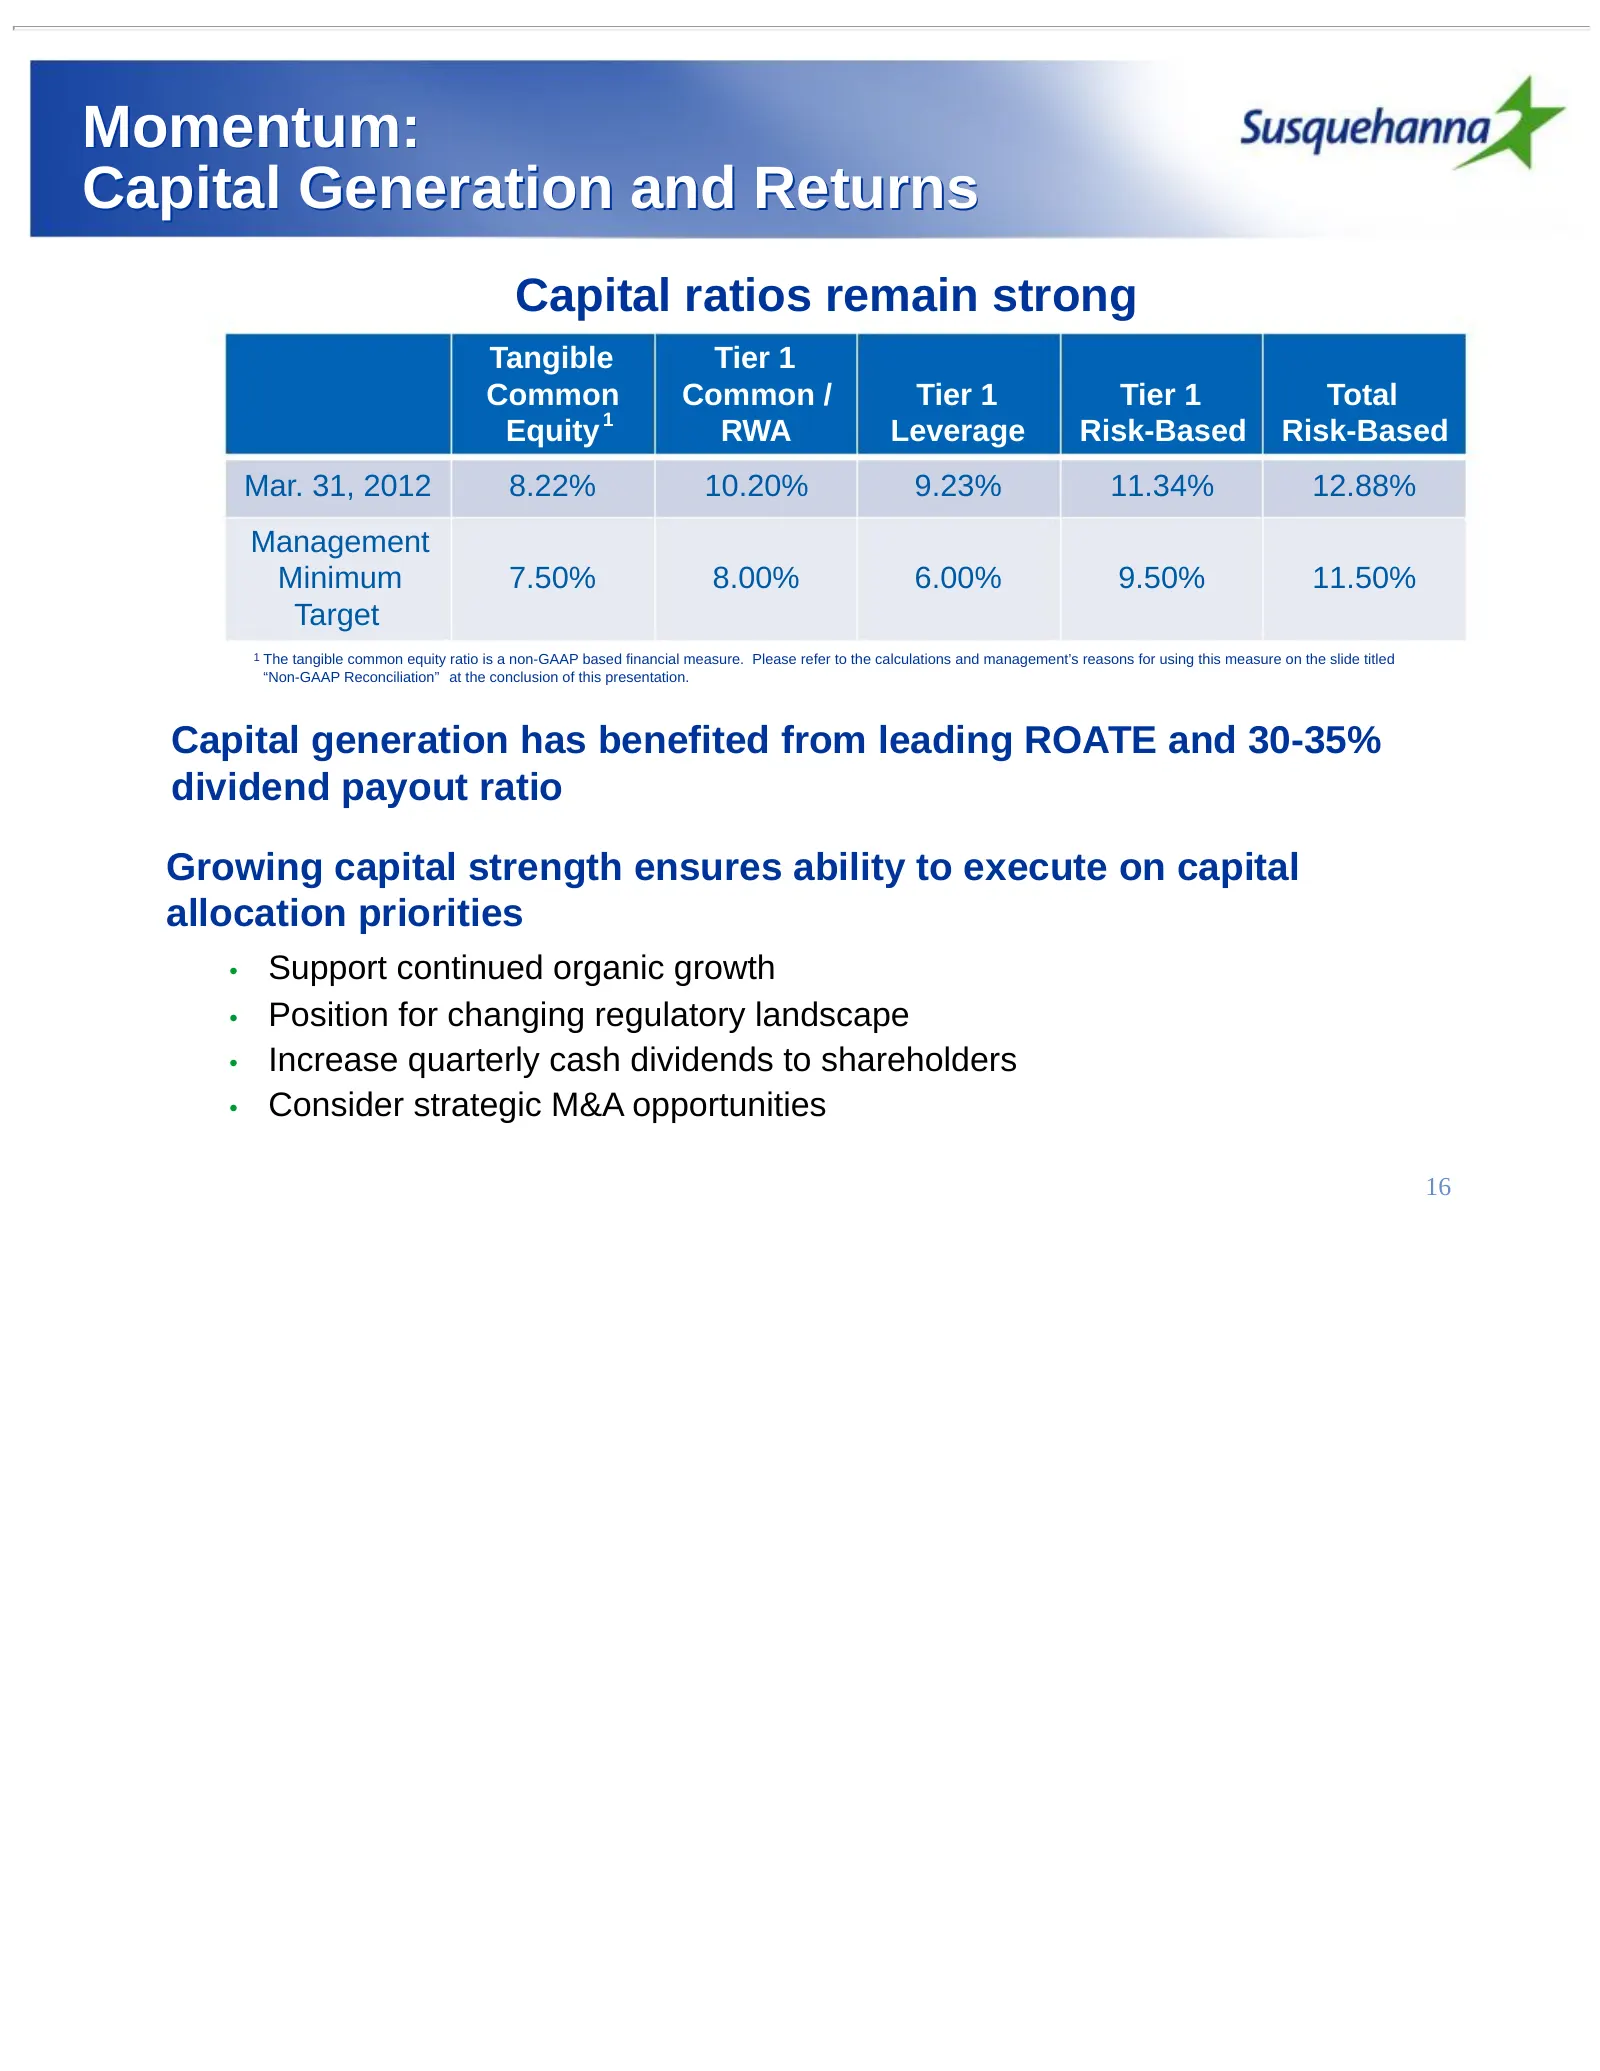
Momentum: Capital Generation and Returns Capital ratios remain strong Tangible Tier 1 Common Common / Tier 1 Tier 1 Total Equity 1 RWA Leverage Risk-Based Risk-Based Mar. 31, 2012 8.22% 10.20% 9.23% 11.34% 12.88% Management Minimum 7.50% 8.00% 6.00% 9.50% 11.50% Target 1 The tangible common equity r
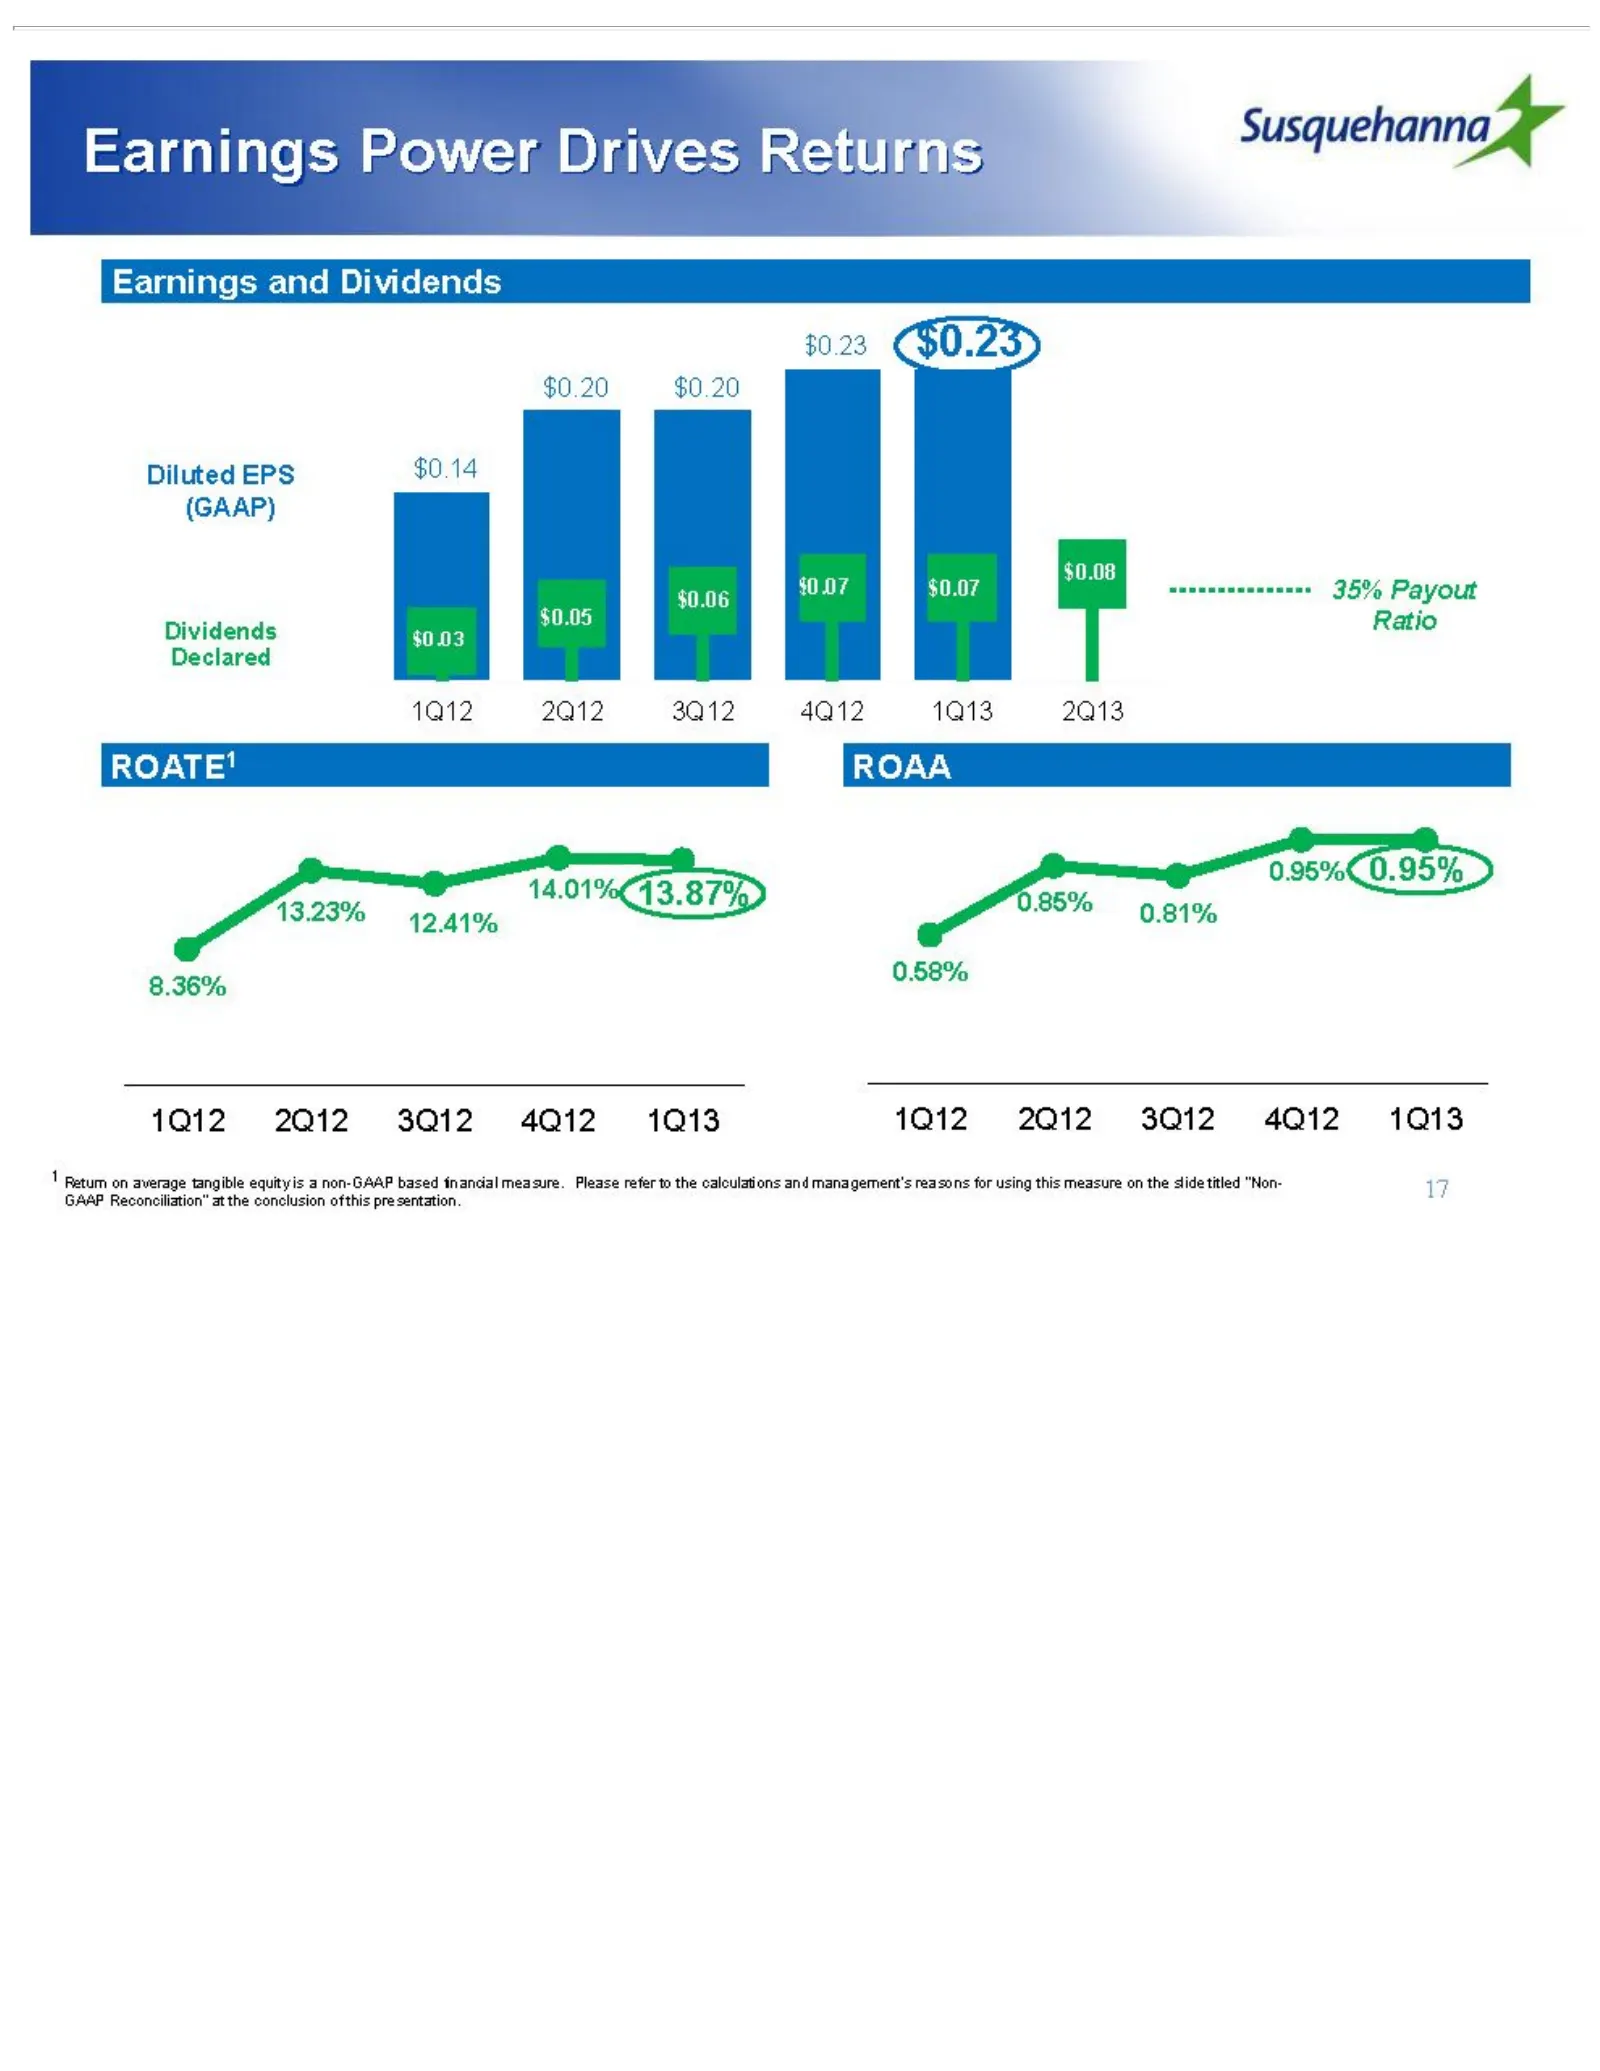
Slide 17: Earnings Power Drives Returns
Susquehanna gr Earnings Power Drives Returns Earnings and Dividends $0.23 $0.20 $0.20 $0.07 T Diluted EPS $0.14 (GAAP) Dividends $0.03 Declared sos 2? Eso 6 6 35% Payout Ratio 1Q12 2012, 3Q12,s dQi2_—s 1013.—s( 213 ROATE!' ROAA 0.95%€ 0.95% 14.01% 13.23% 941% 3.87%) 085% — 0.81% 8.36% 0.69% 1012 201
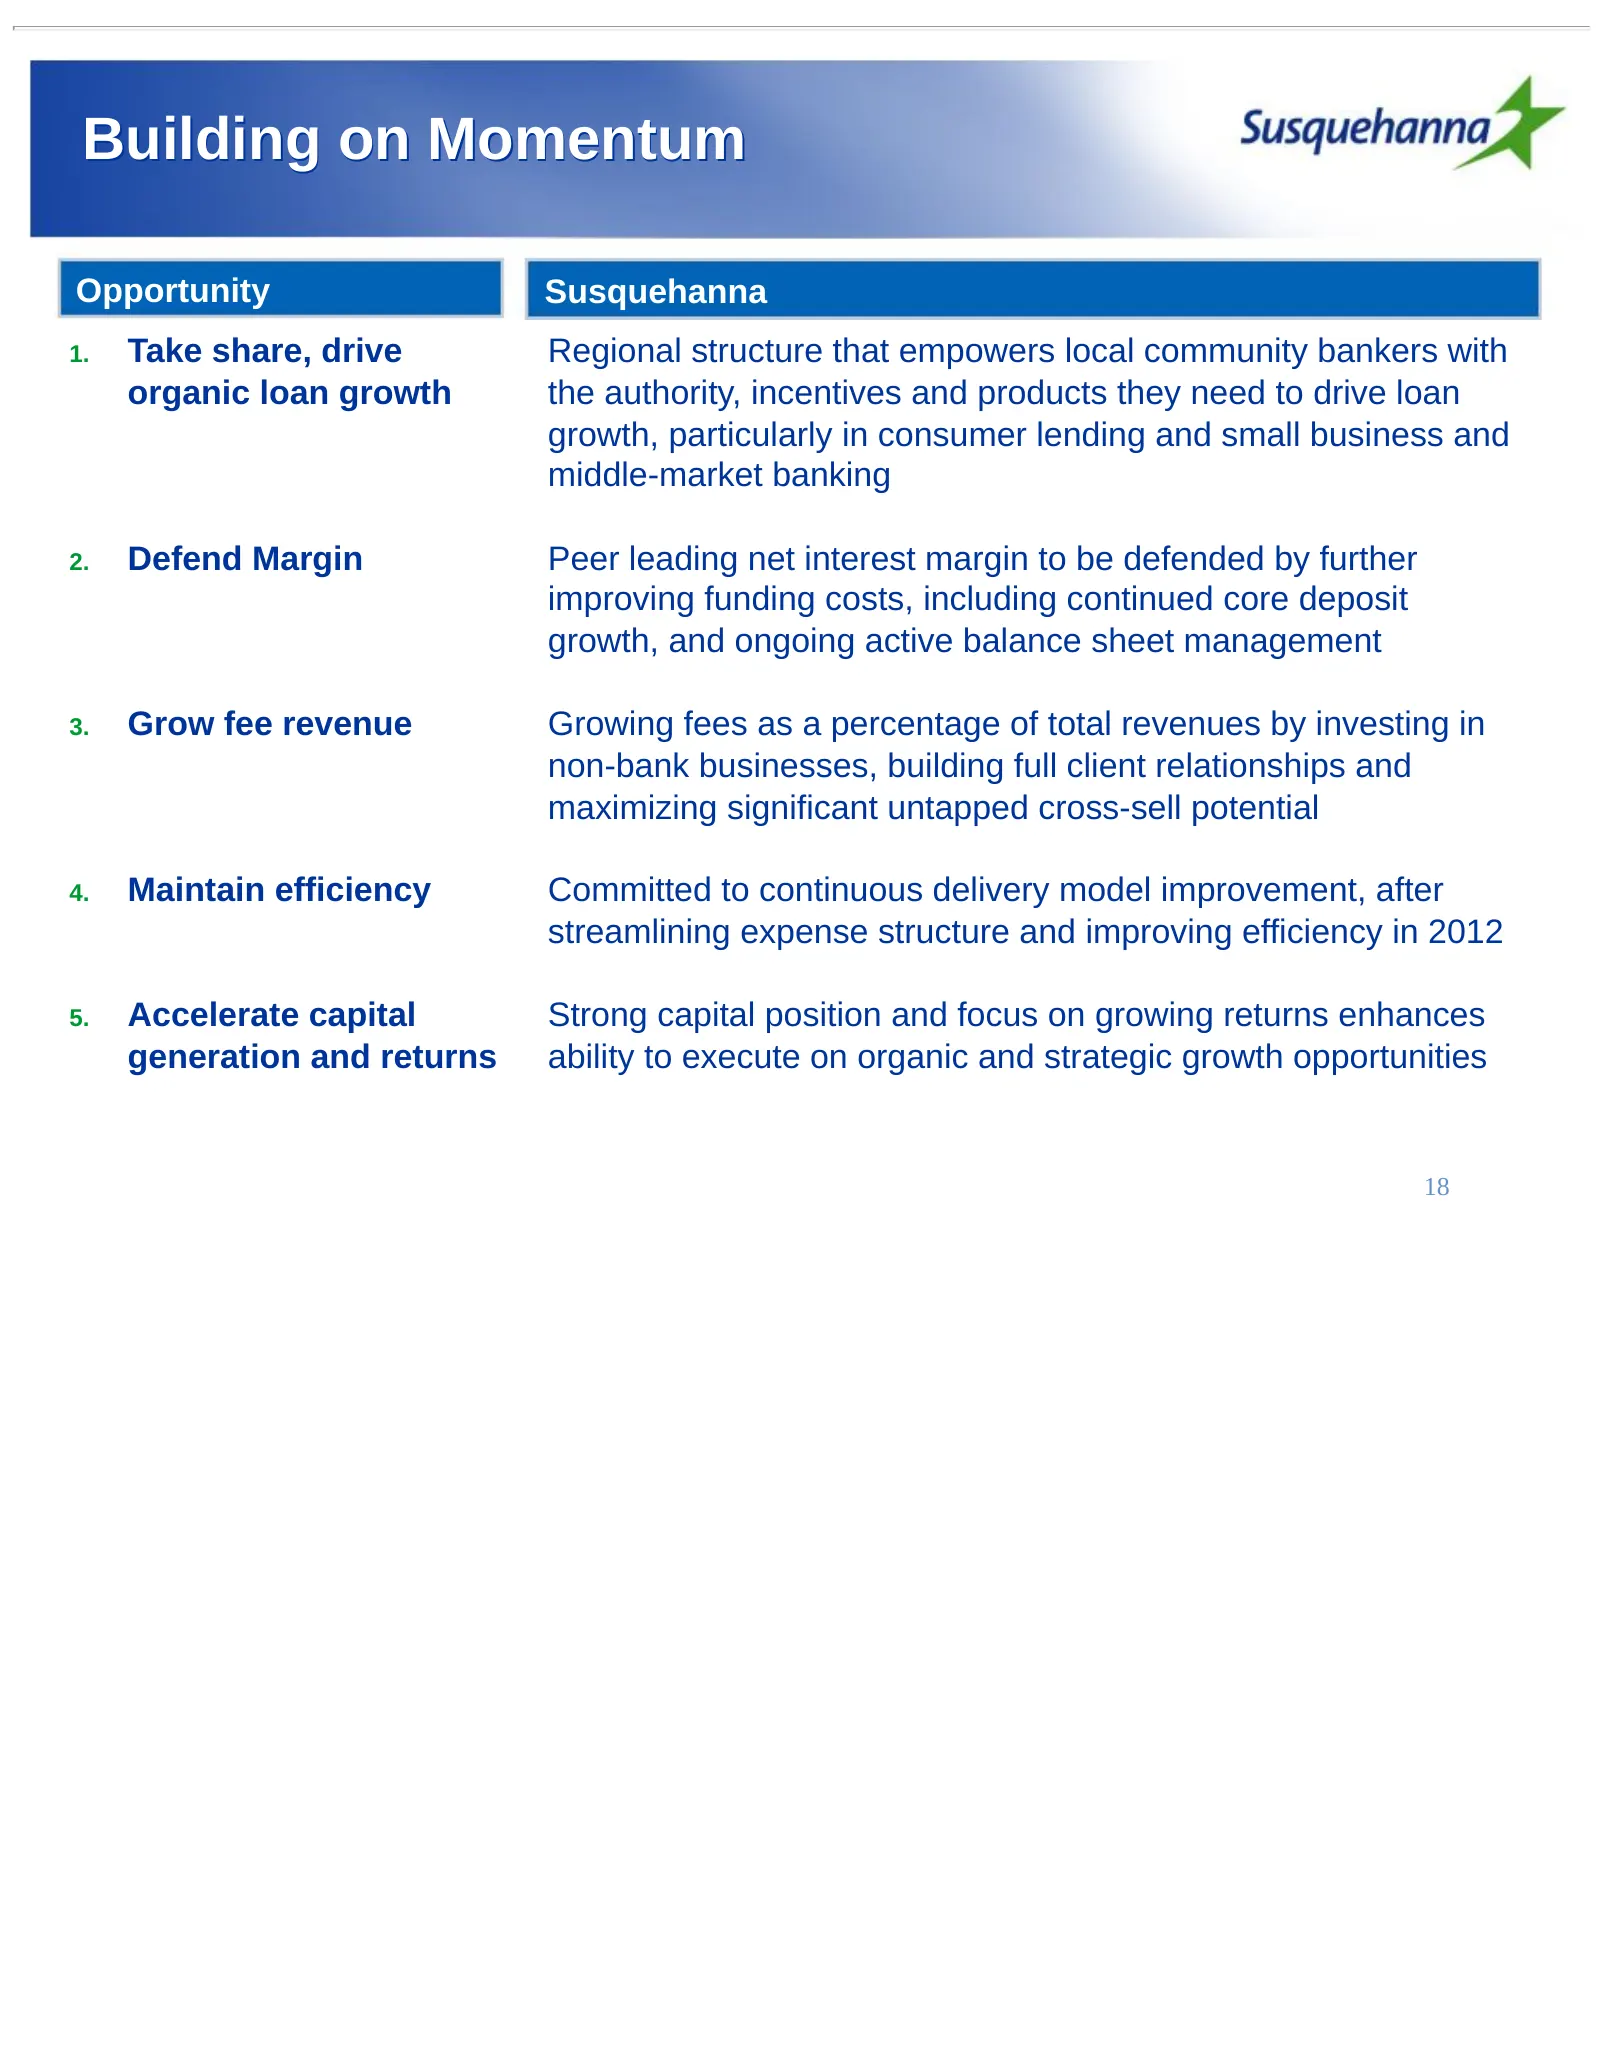
Slide 18: Building on Momentum
Building on Momentum Opportunity Susquehanna 1. Take share, drive Regional structure that empowers local community bankers with organic loan growth the authority, incentives and products they need to drive loan growth, particularly in consumer lending and small business and middle-market banking 2.
Slide 19: Additional Materials
Additional Materials
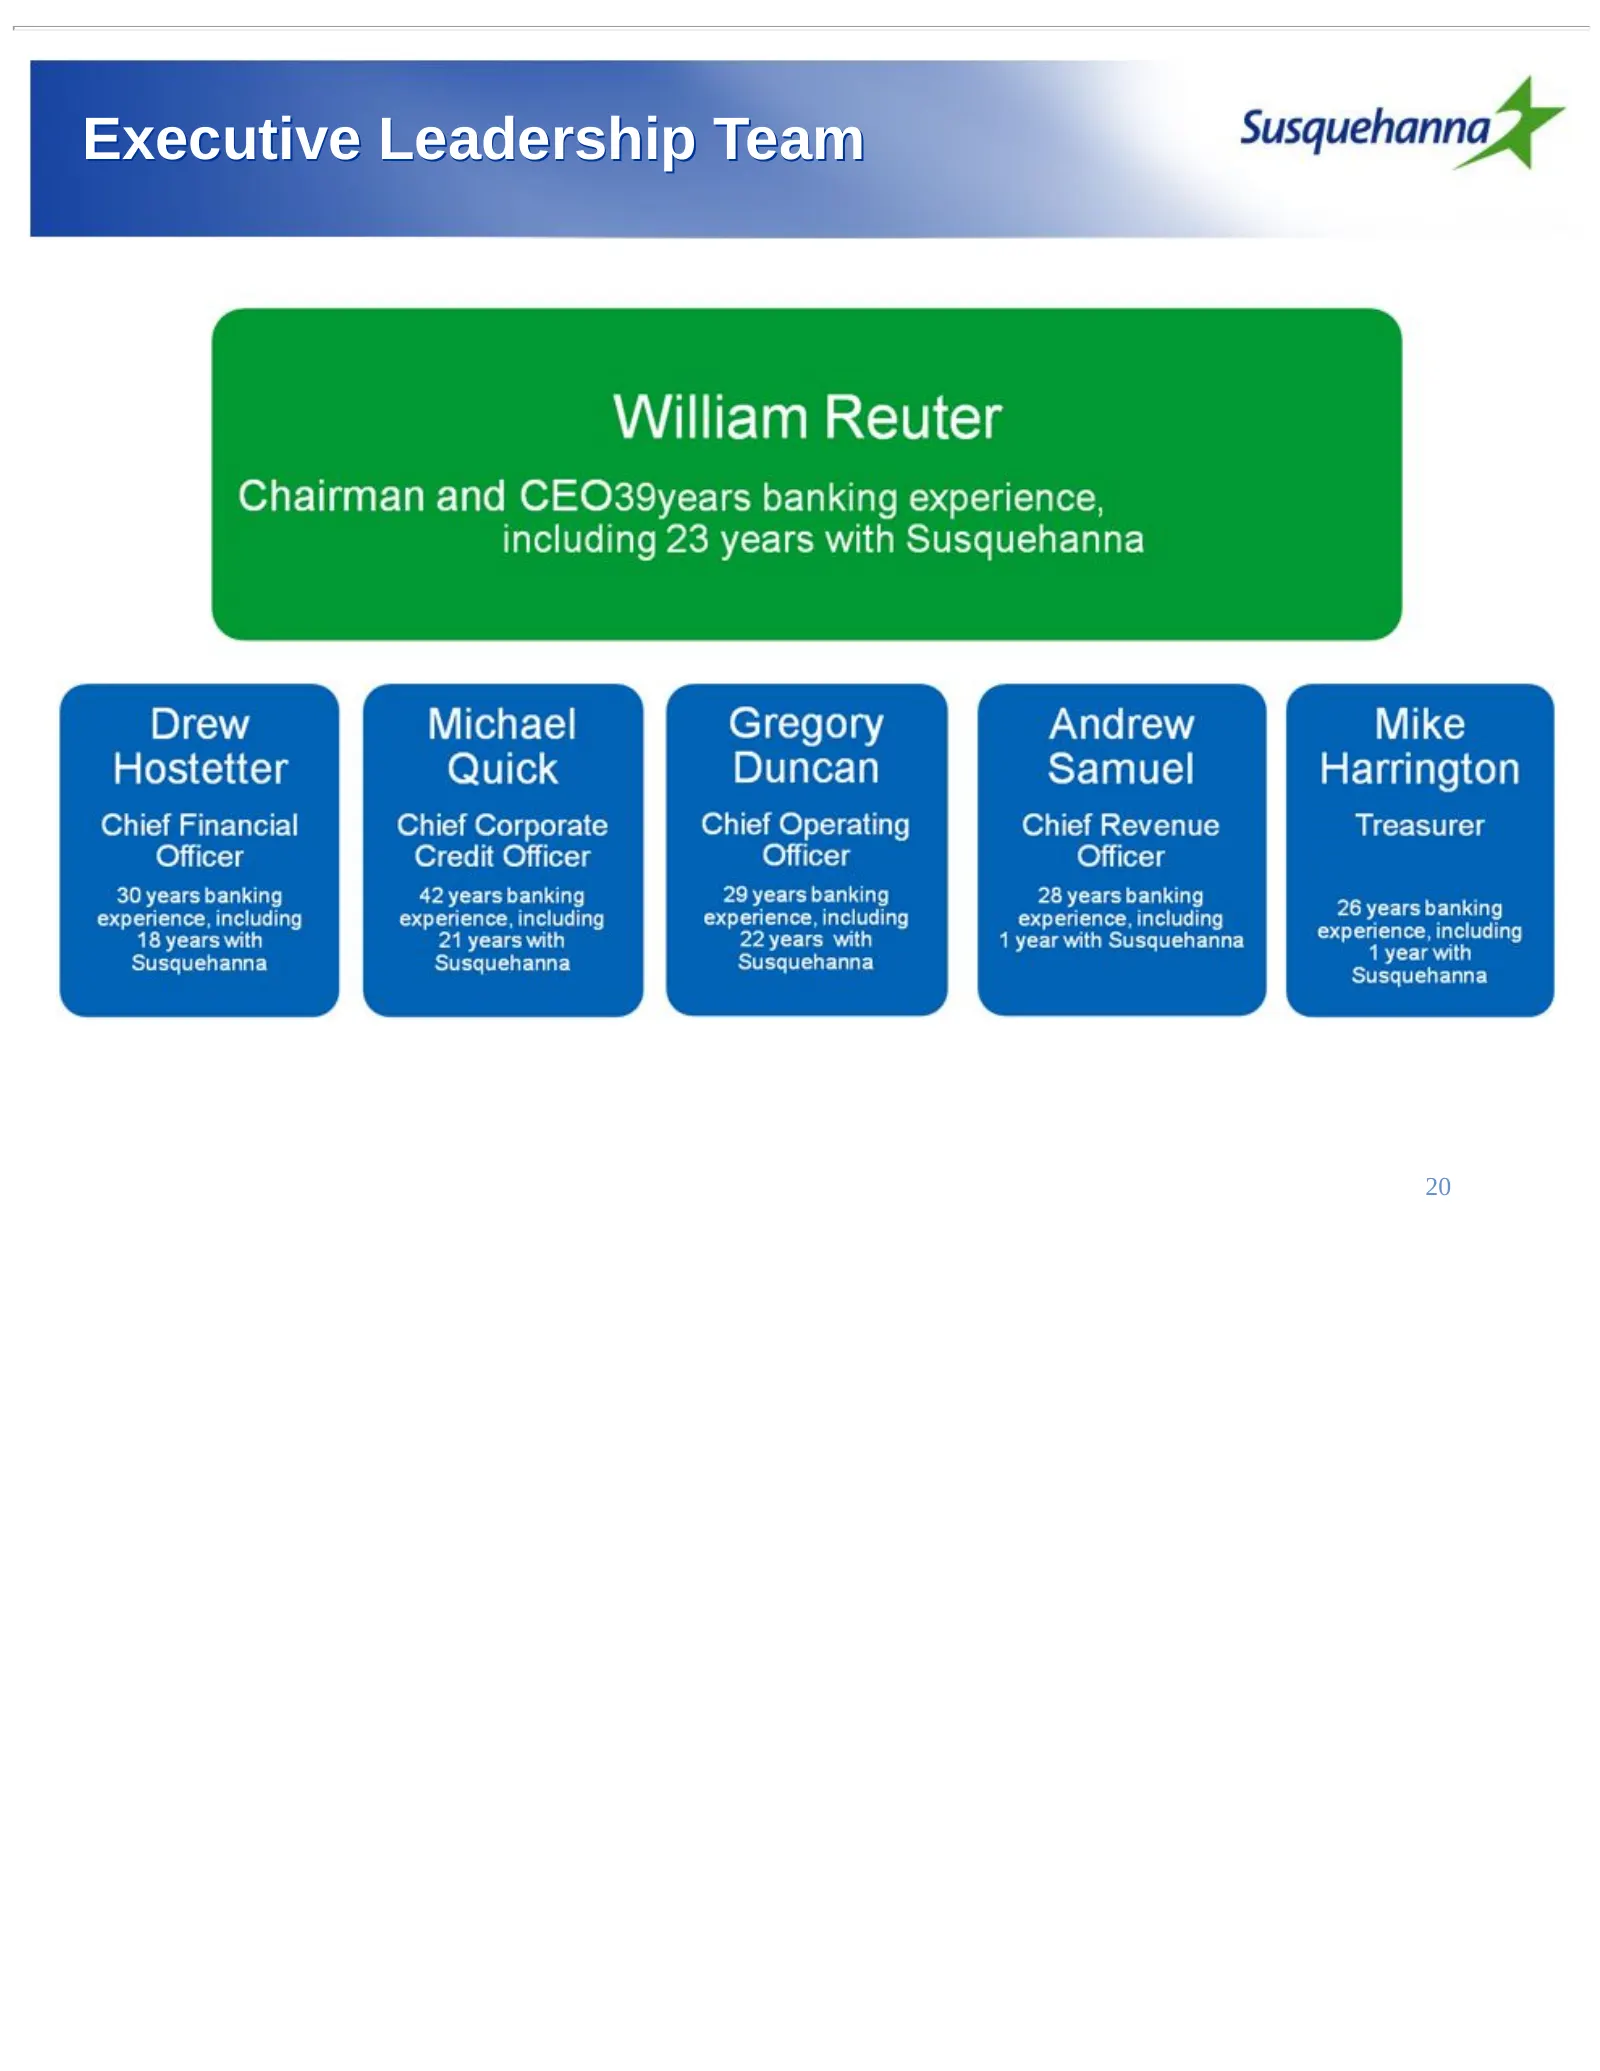
Slide 20: Executive Leadership Team
Executive Leadership Team 20
Slide 21: Critical Mass in Attractive Markets
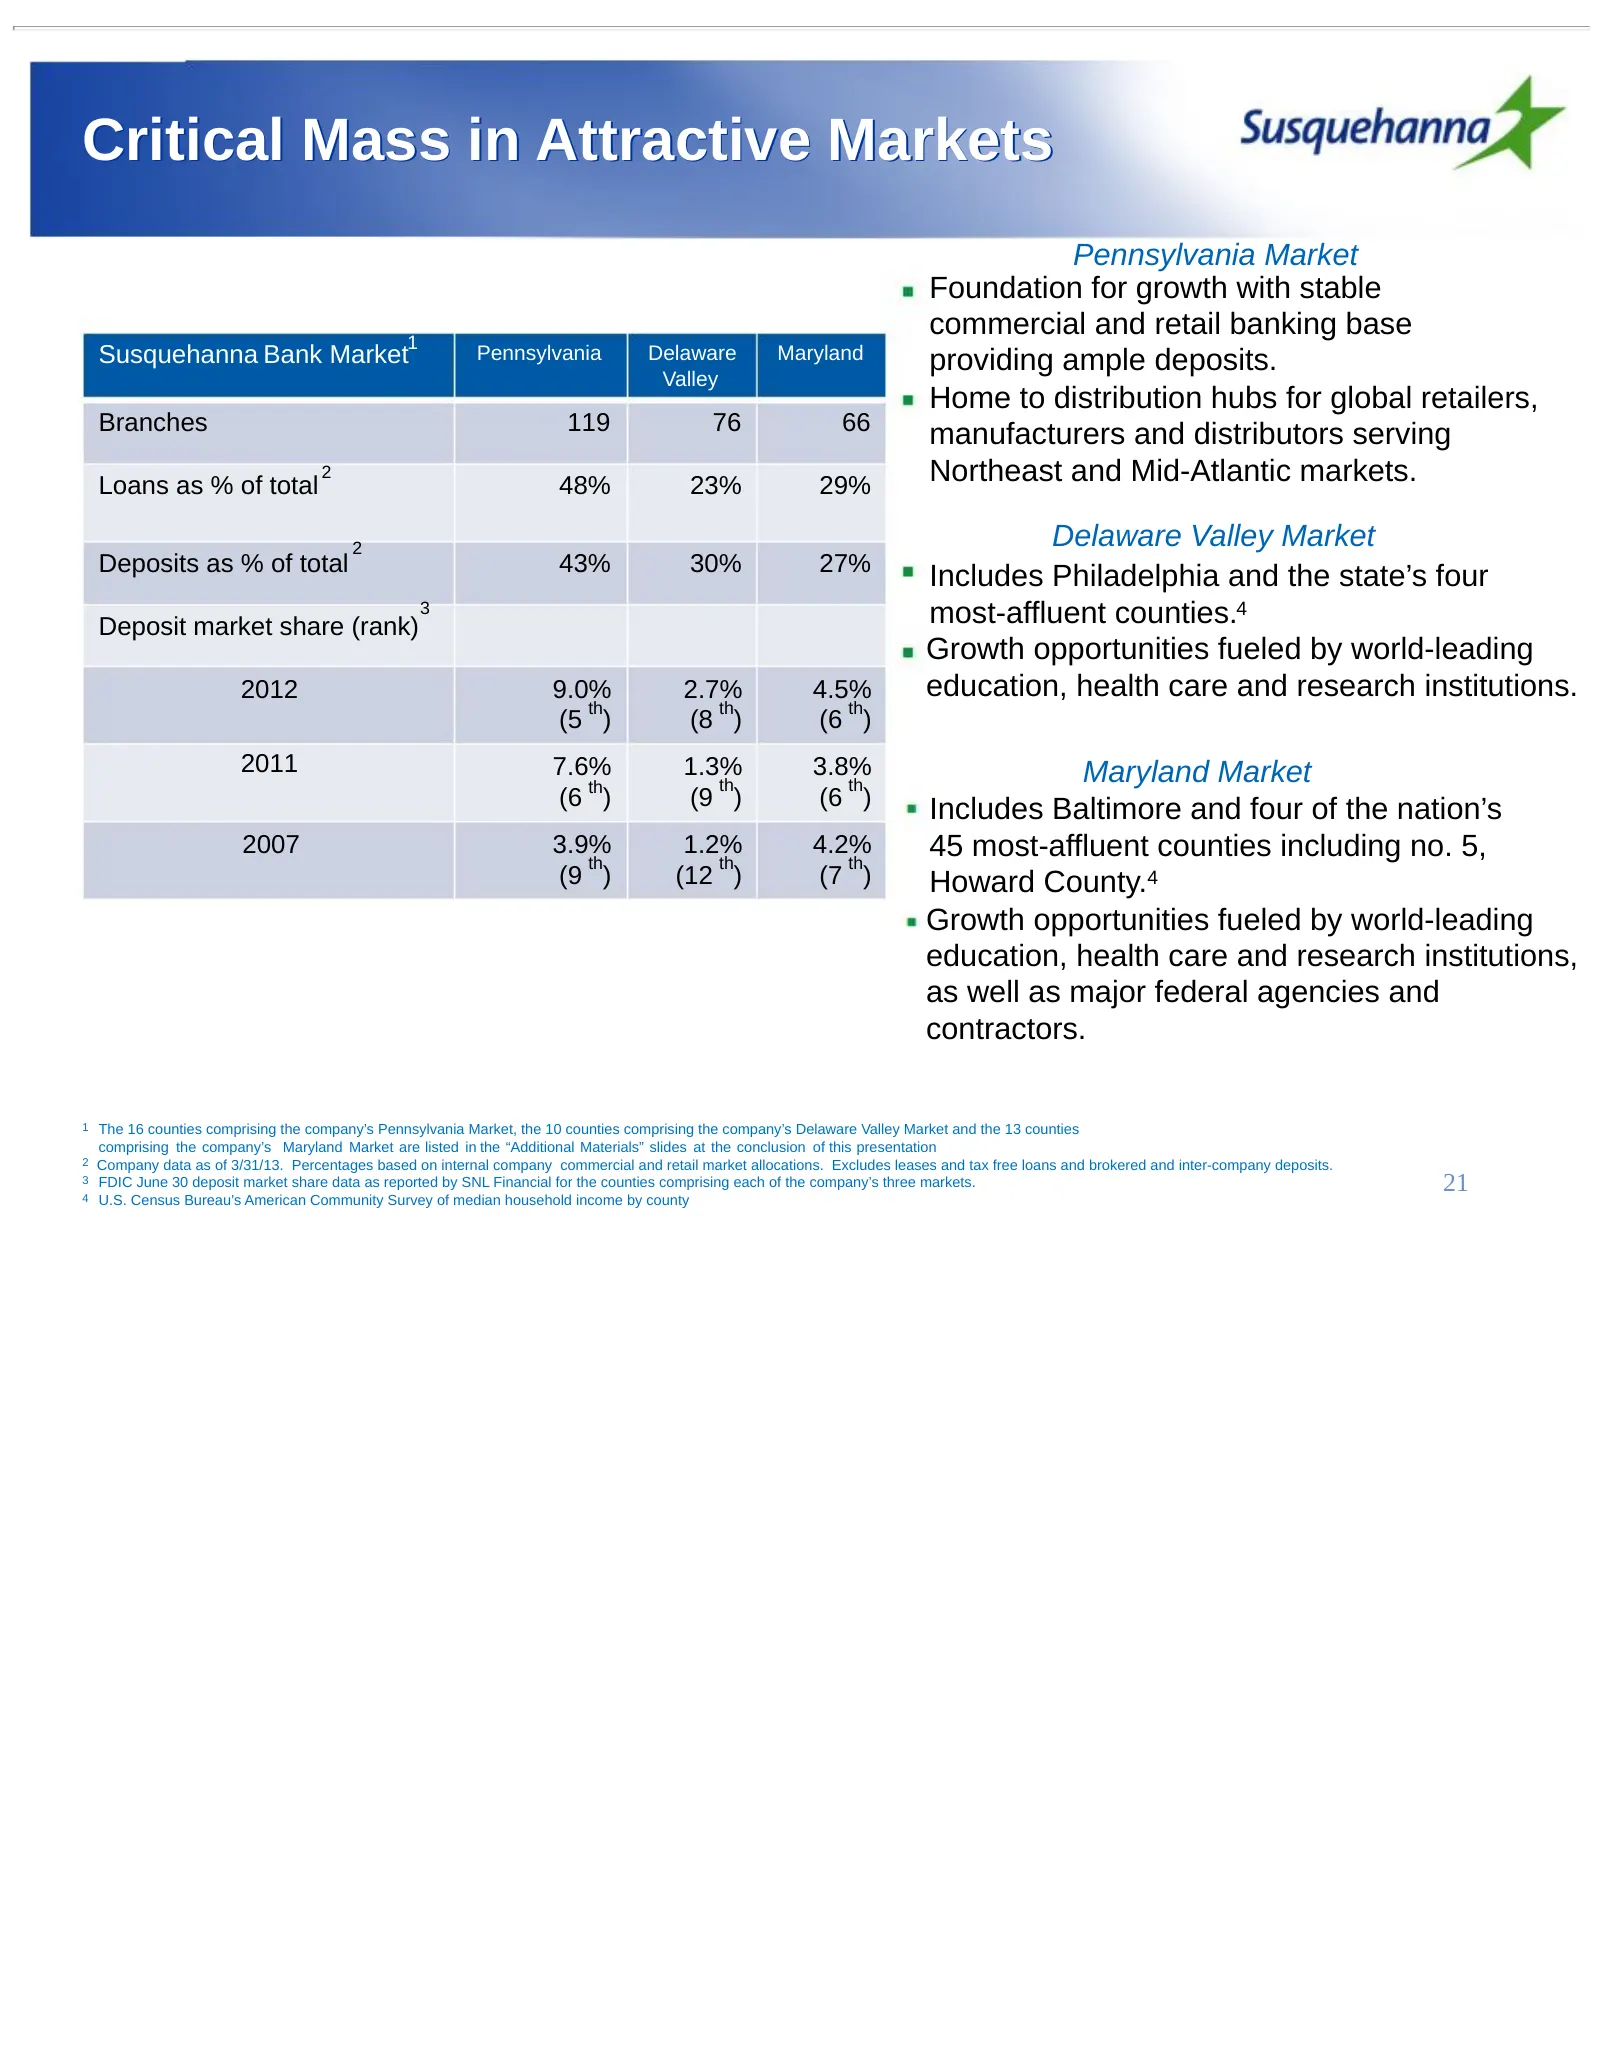
Critical Mass in Attractive Markets Pennsylvania Market Foundation for growth with stable 1 commercial and retail banking base Susquehanna Bank Market Pennsylvania Delaware Maryland providing ample deposits. Valley Home to distribution hubs for global retailers, Branches 119 76 66 manufacturers and
Slide 22: 1st Quarter 2013 Financial Highlights
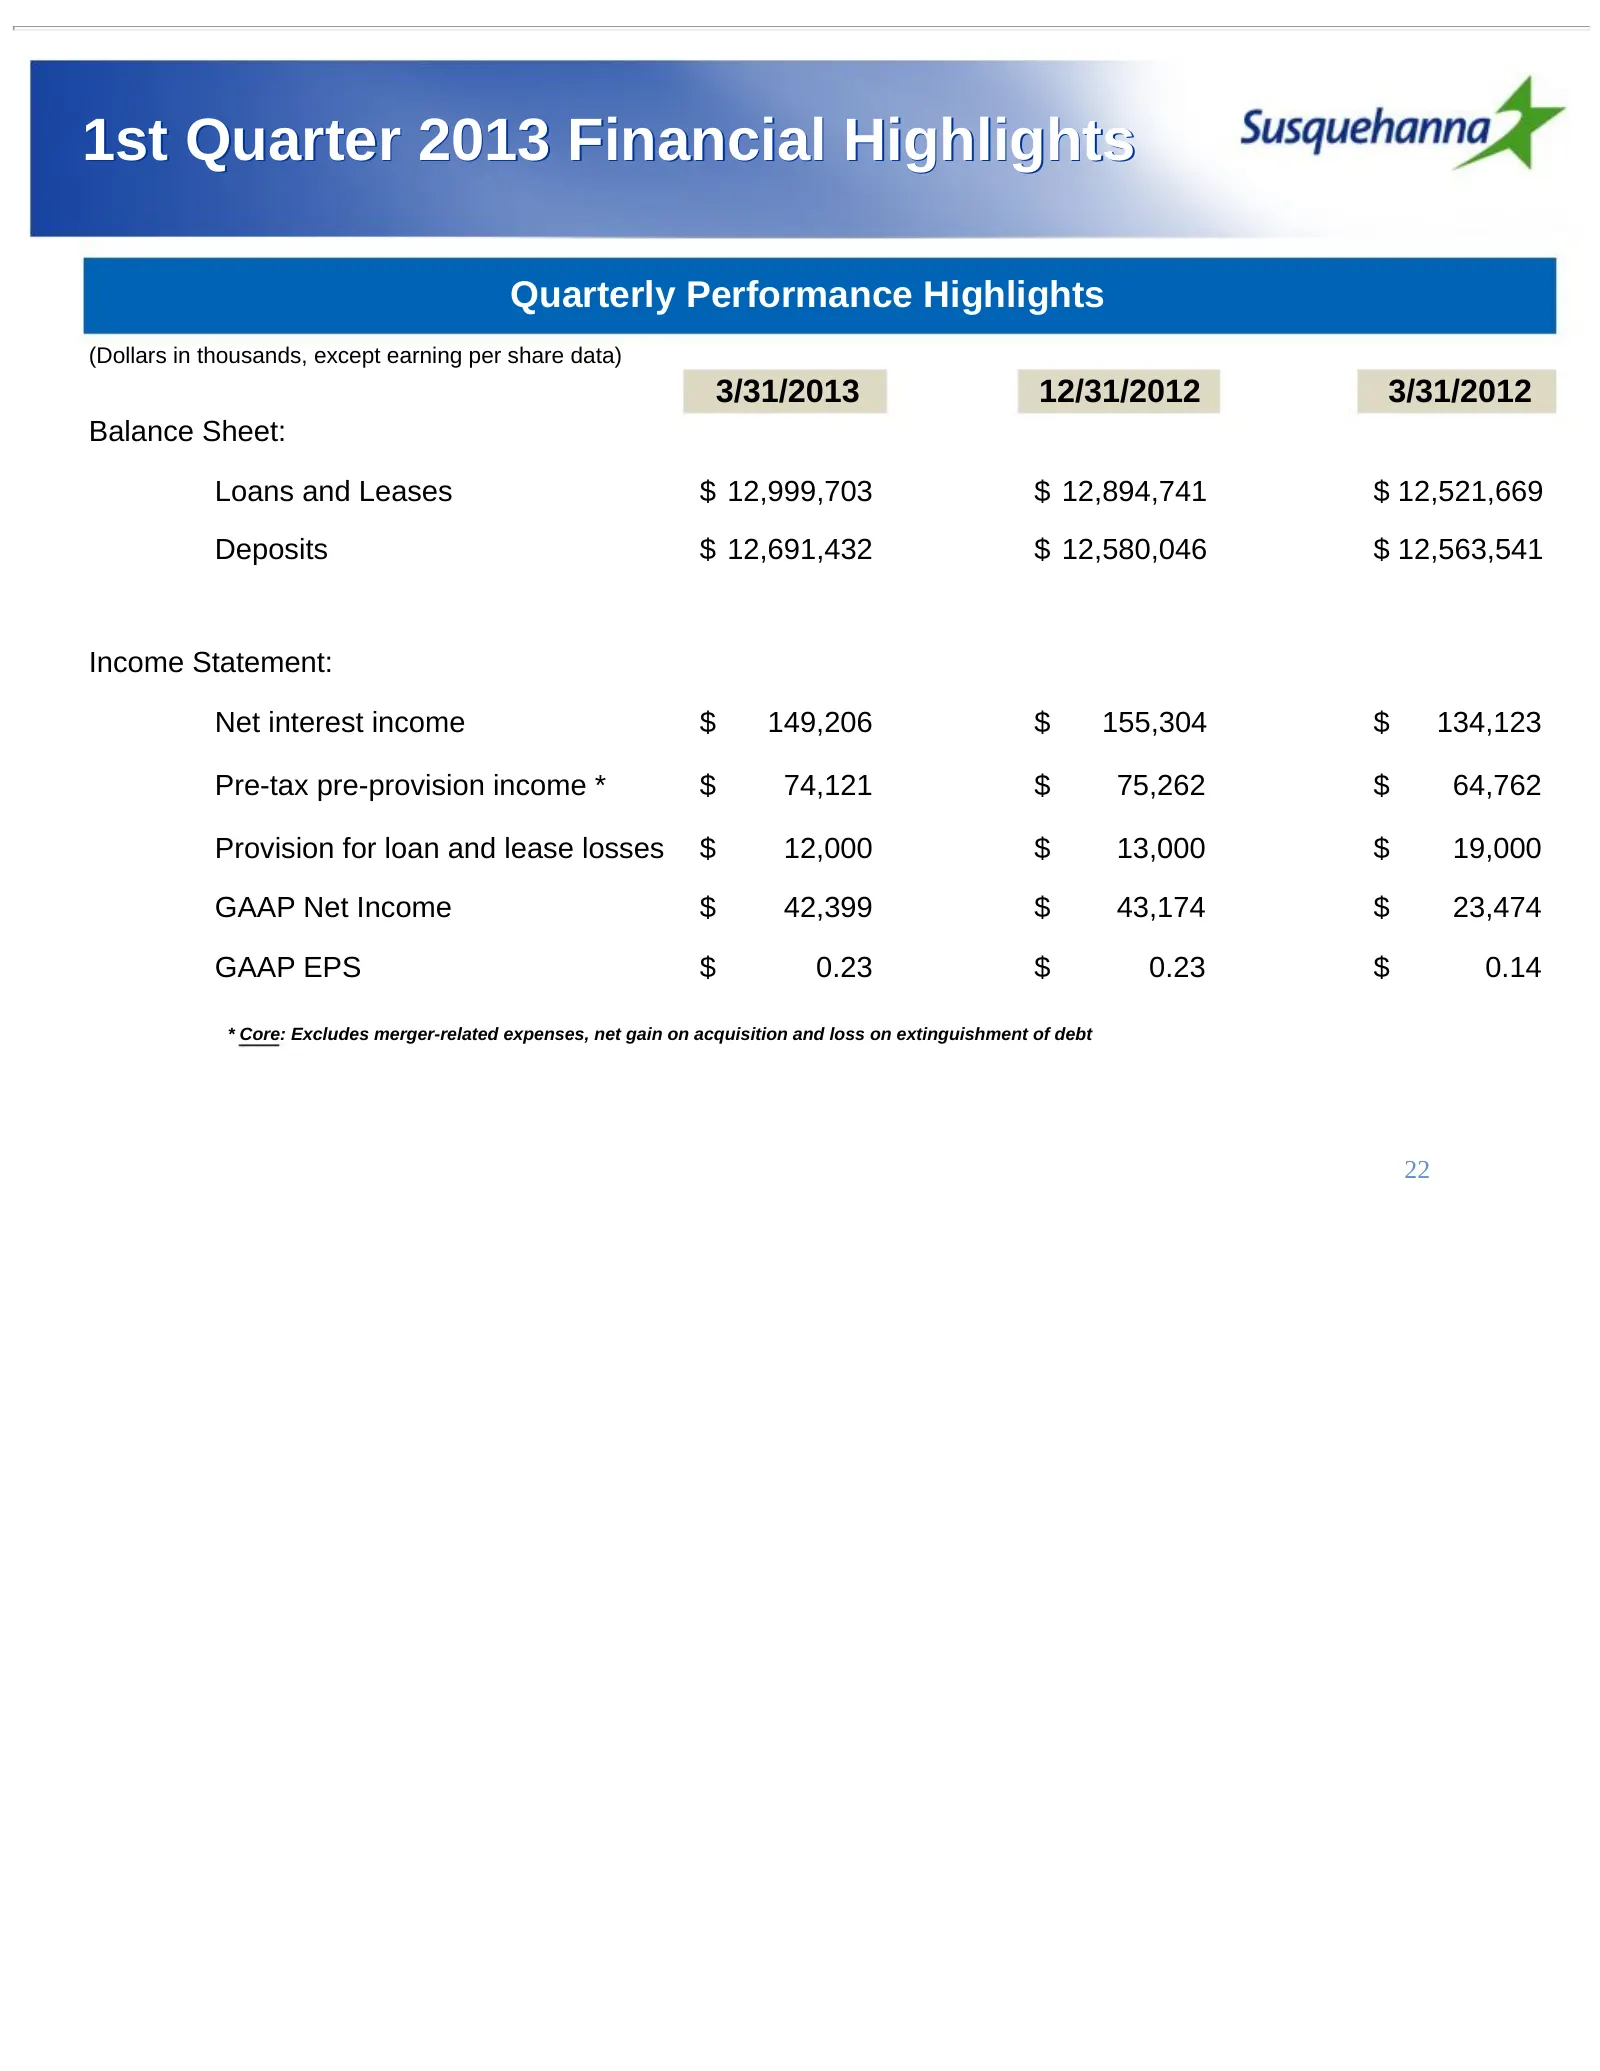
1st Quarter 2013 Financial Highlights Quarterly Performance Highlights (Dollars in thousands, except earning per share data) 3/31/2013 12/31/2012 3/31/2012 Balance Sheet: Loans and Leases $ 12,999,703 $ 12,894,741 $ 12,521,669 Deposits $ 12,691,432 $ 12,580,046 $ 12,563,541 Income Statement: Net int
Slide 23: Quarterly Loan and Lease Originations
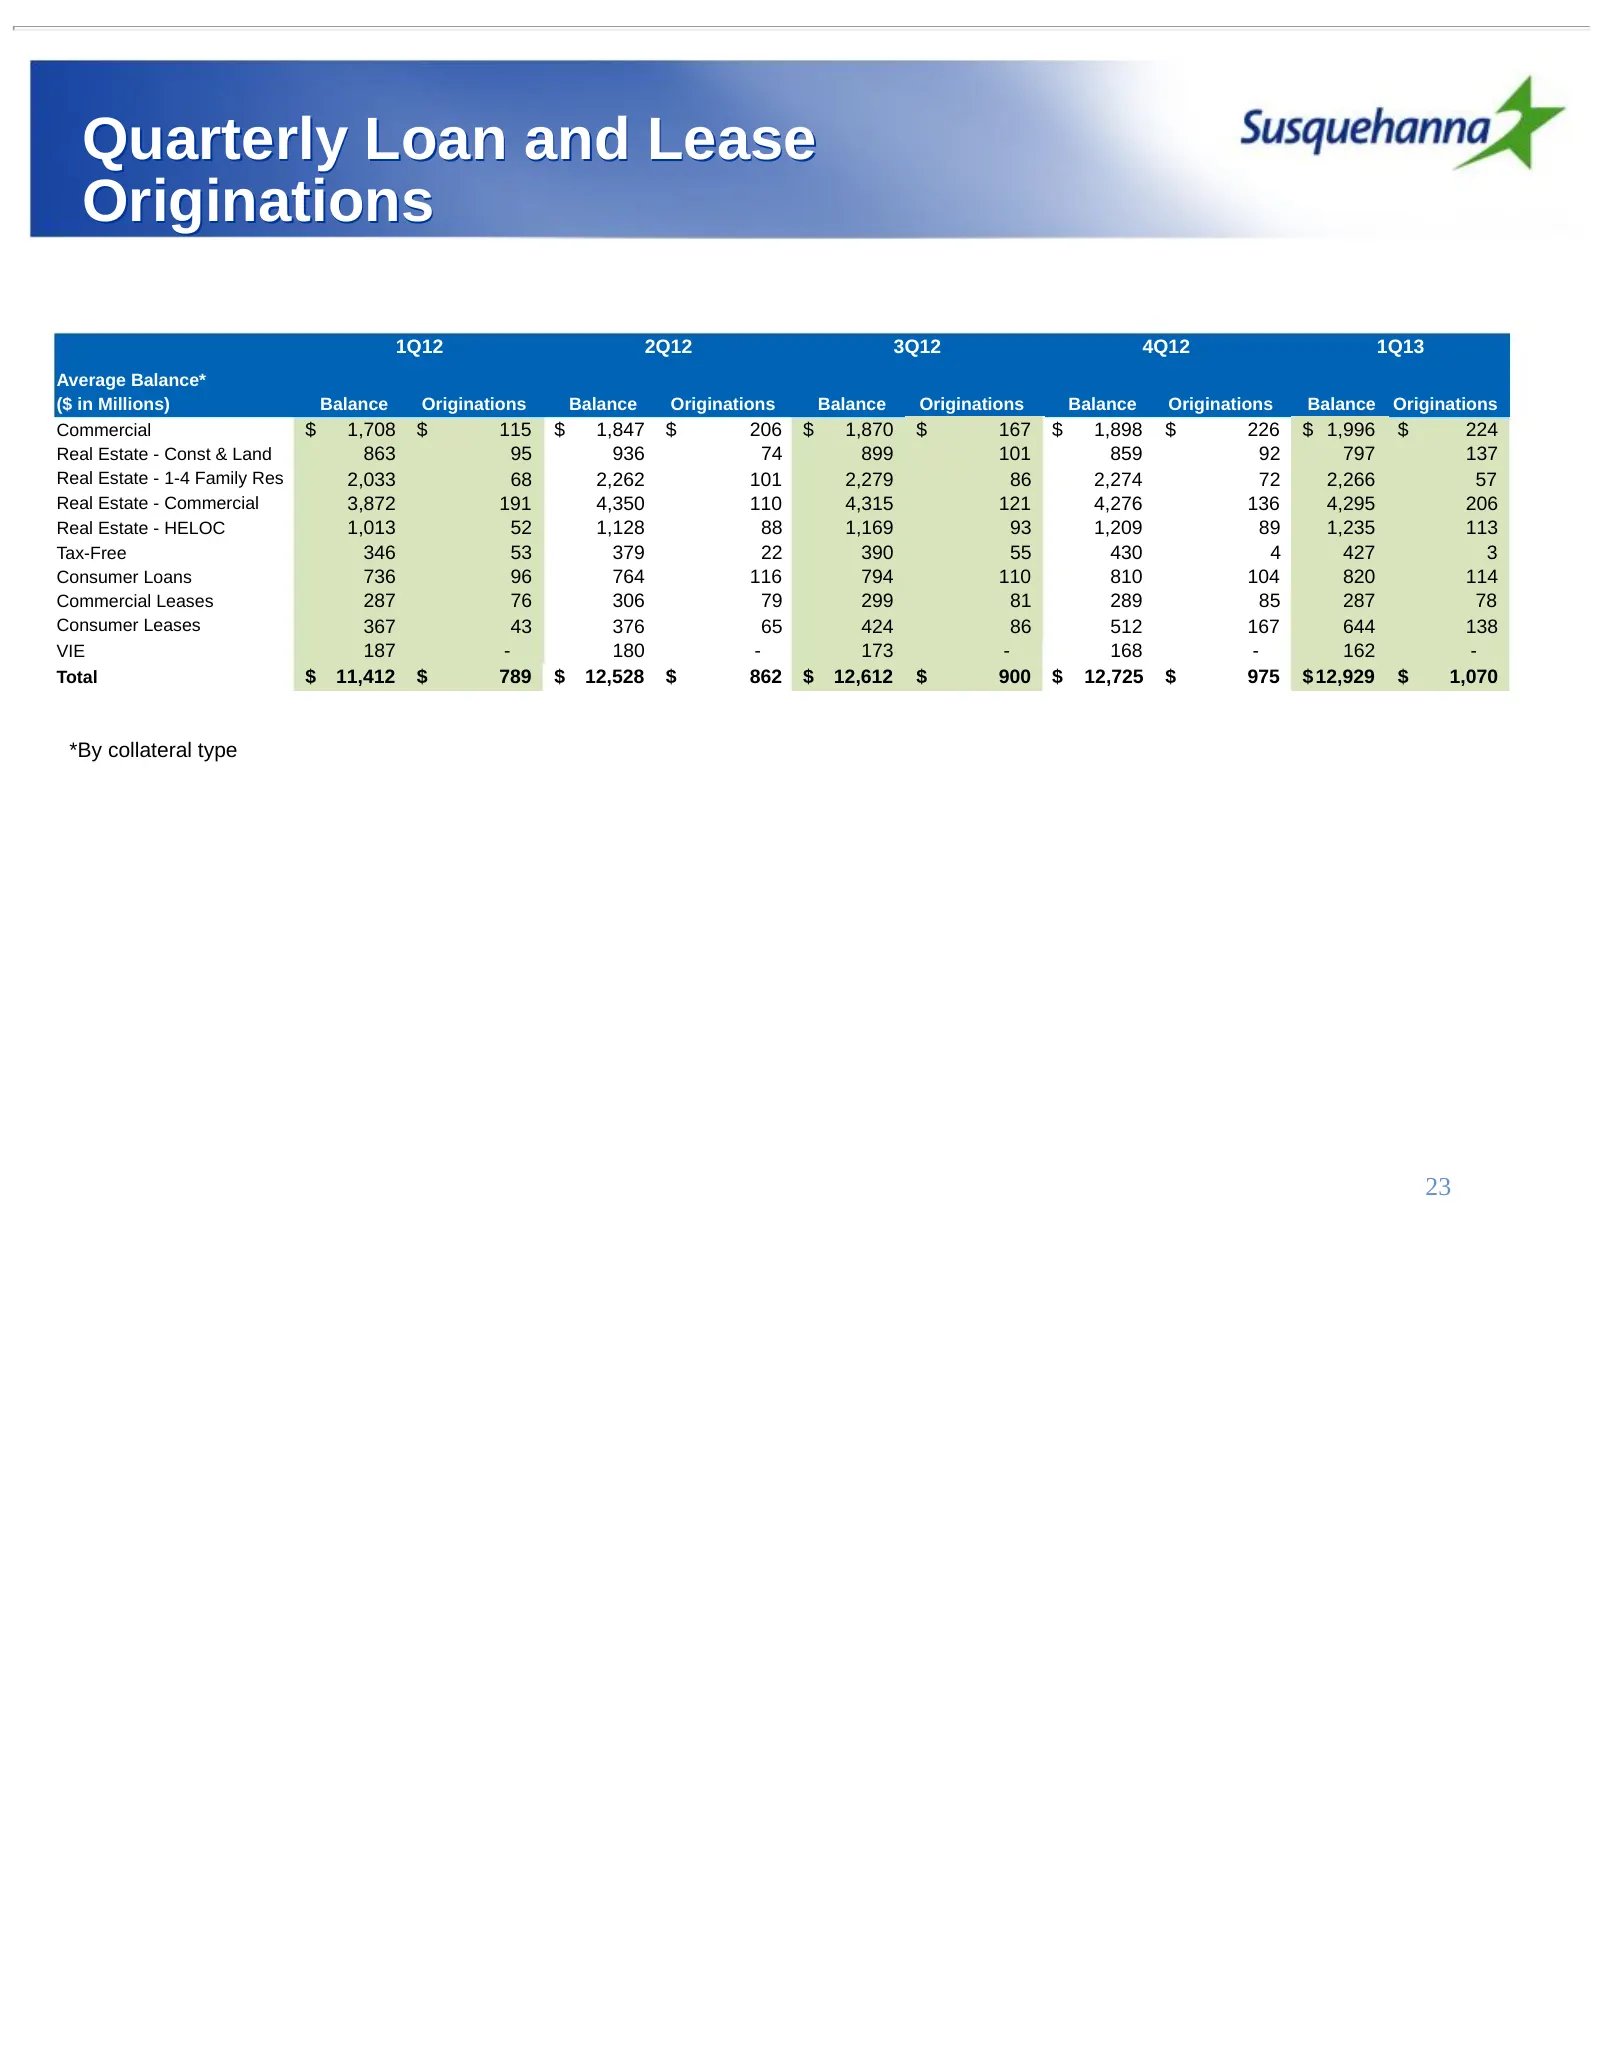
Quarterly Loan and Lease Originations 1Q12 2Q12 3Q12 4Q12 1Q13 Average Balance* ($ in Millions) Balance Originations Balance Originations Balance Originations Balance Originations Balance Originations Commercial $ 1,708 $ 115 $ 1,847 $ 206 $ 1,870 $ 167 $ 1,898 $ 226 $ 1,996 $ 224 Real Estate - Cons
Slide 24: Loan Mix & Yield
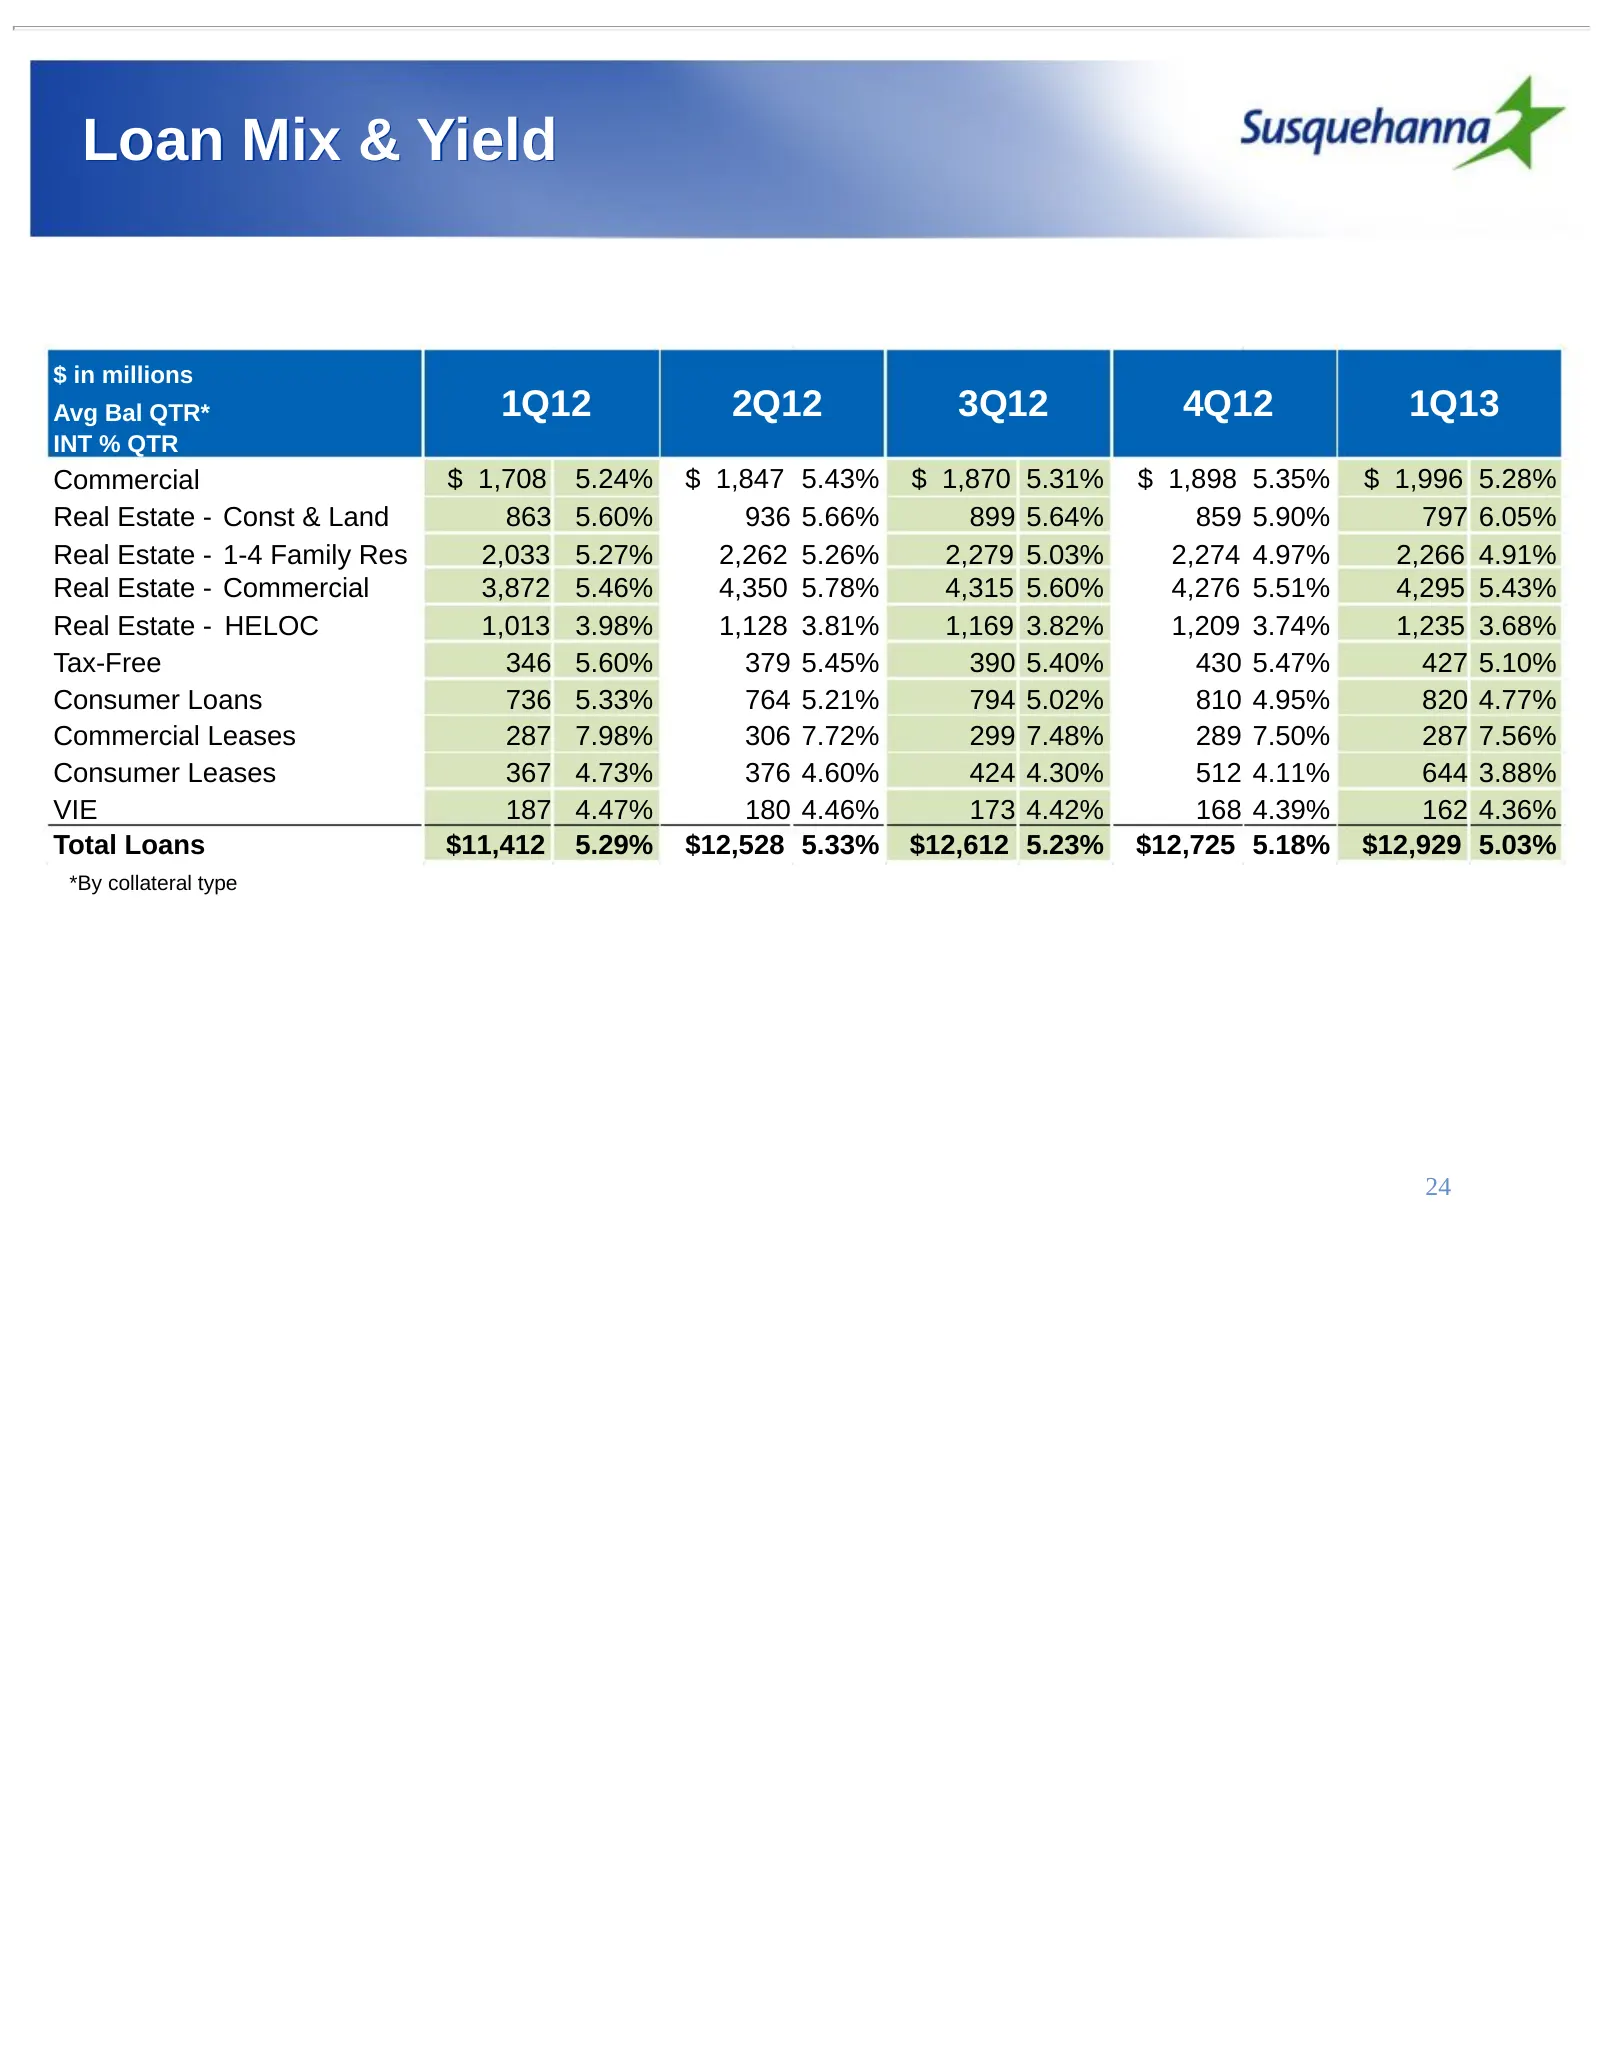
Loan Mix & Yield $ in millions Avg Bal QTR* 1Q12 2Q12 3Q12 4Q12 1Q13 INT % QTR Commercial $ 1,708 5.24% $ 1,847 5.43% $ 1,870 5.31% $ 1,898 5.35% $ 1,996 5.28% Real Estate - Const & Land 863 5.60% 936 5.66% 899 5.64% 859 5.90% 797 6.05% Real Estate - 1-4 Family Res 2,033 5.27% 2,262 5.26% 2,279 5.03
Slide 25: CRE and Construction Composition
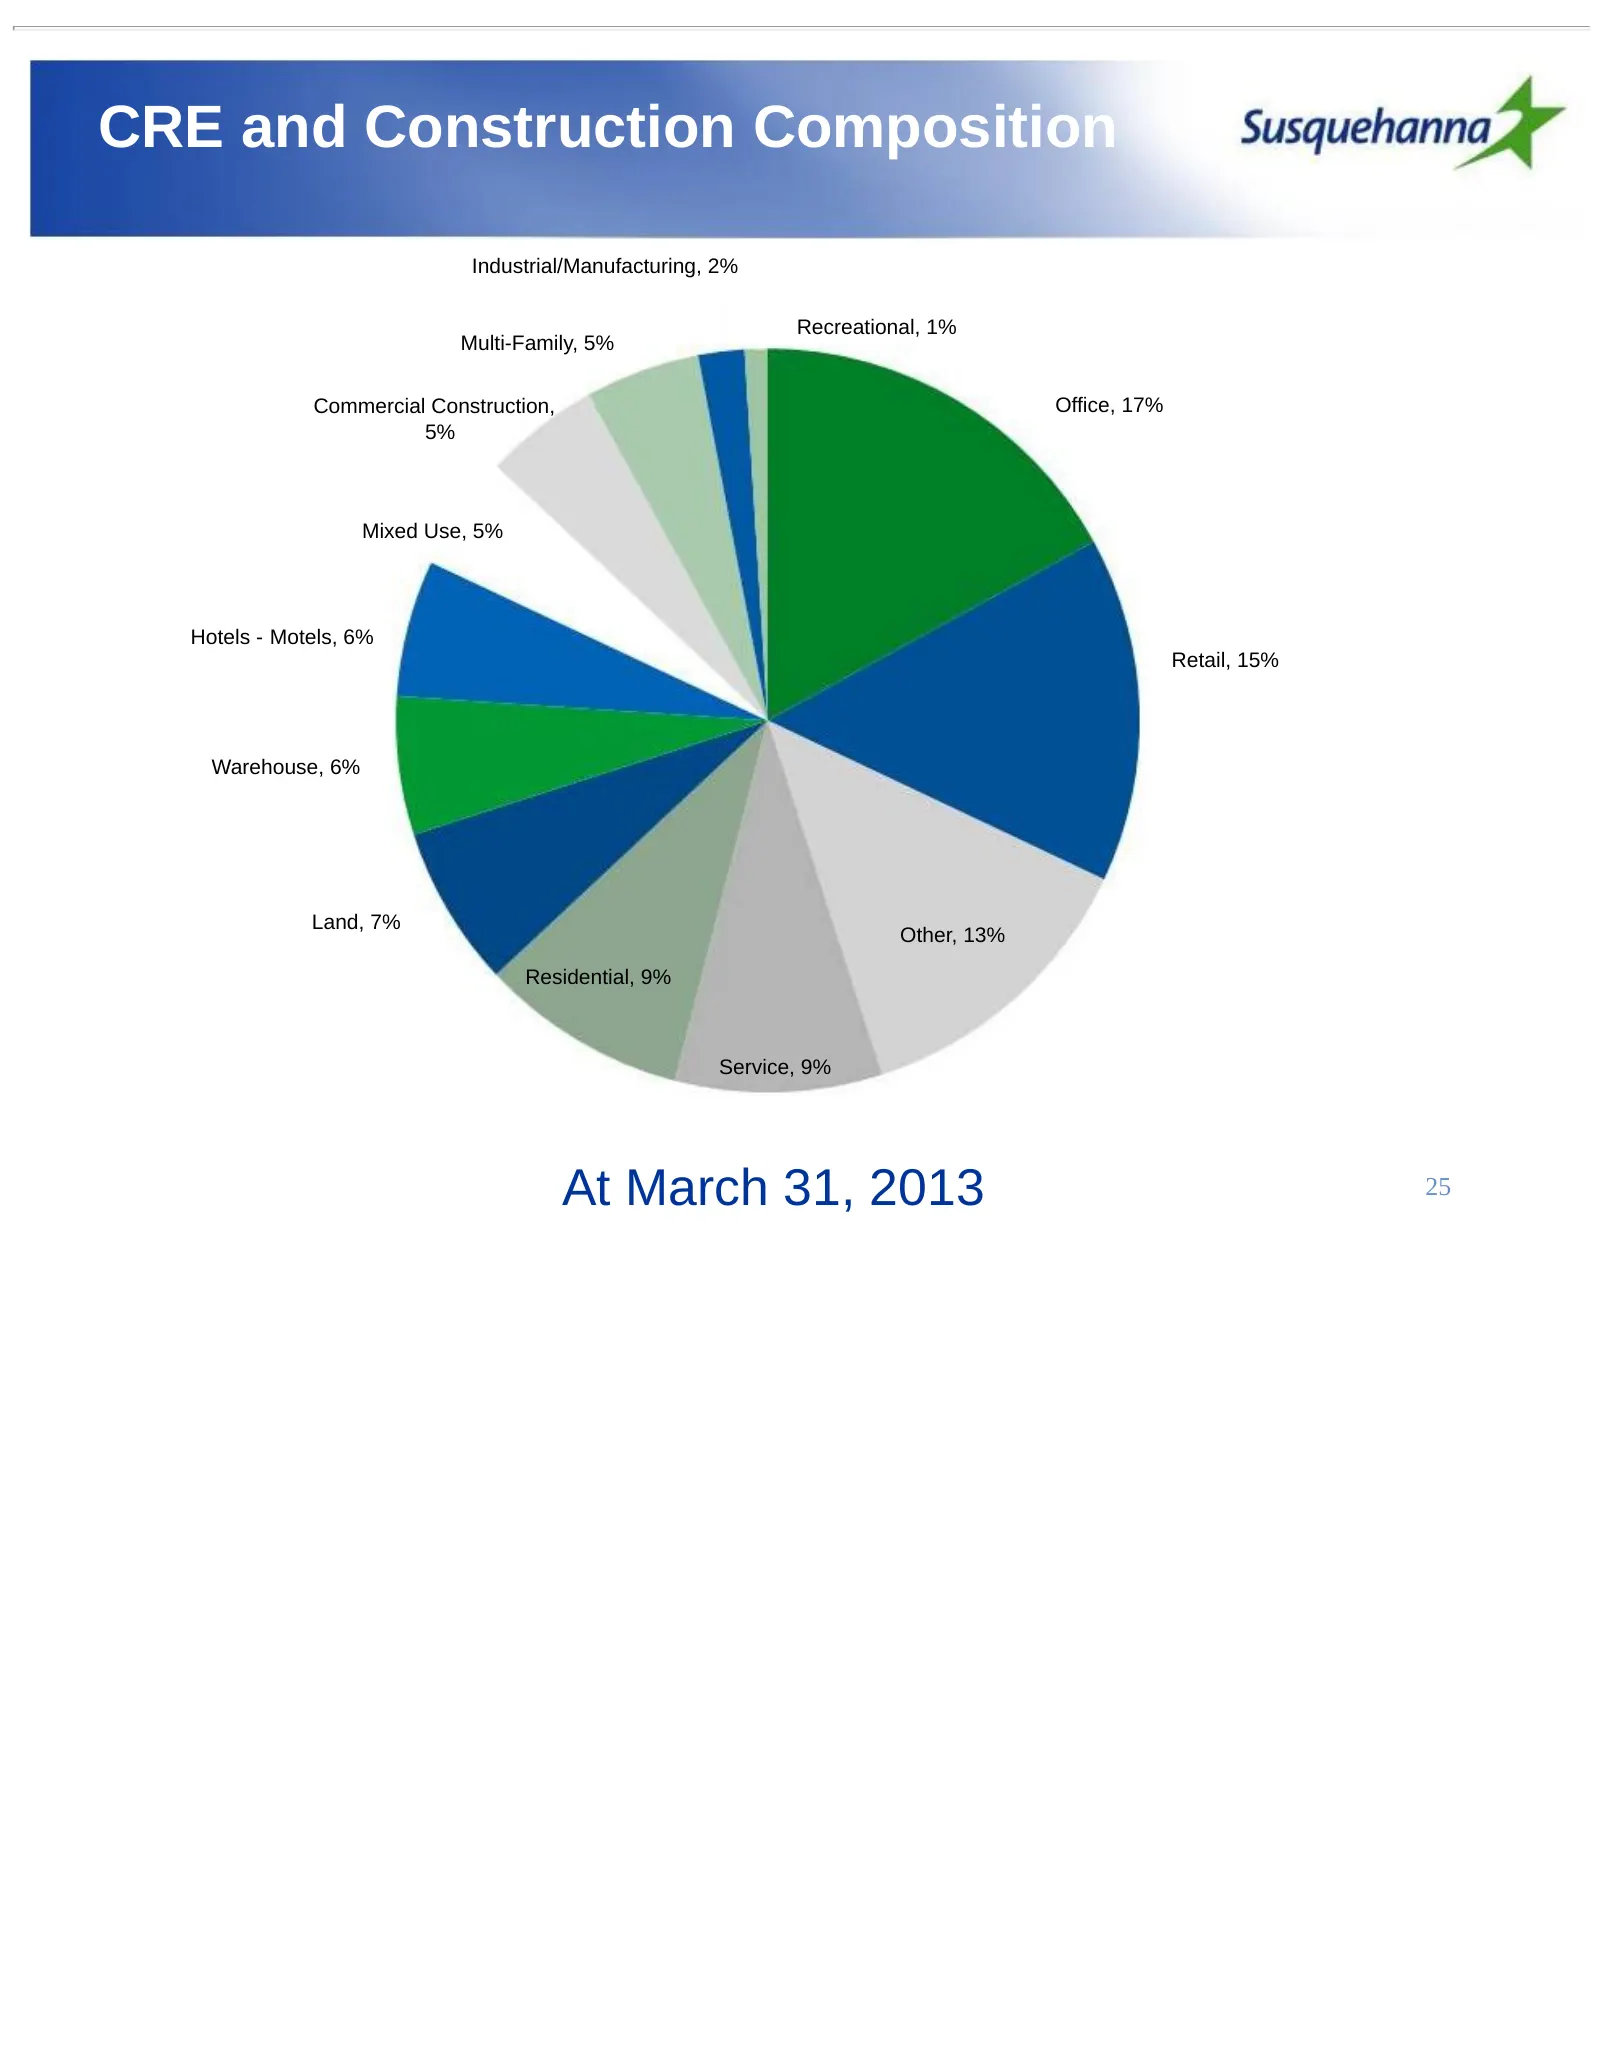
CRE and Construction Composition Industrial/Manufacturing, 2% Recreational, 1% Multi-Family, 5% Commercial Construction, Office, 17% 5% Mixed Use, 5% Hotels - Motels, 6% Retail, 15% Warehouse, 6% Land, 7% Other, 13% Residential, 9% Service, 9% At March 31, 2013 25
Slide 26: Asset Quality
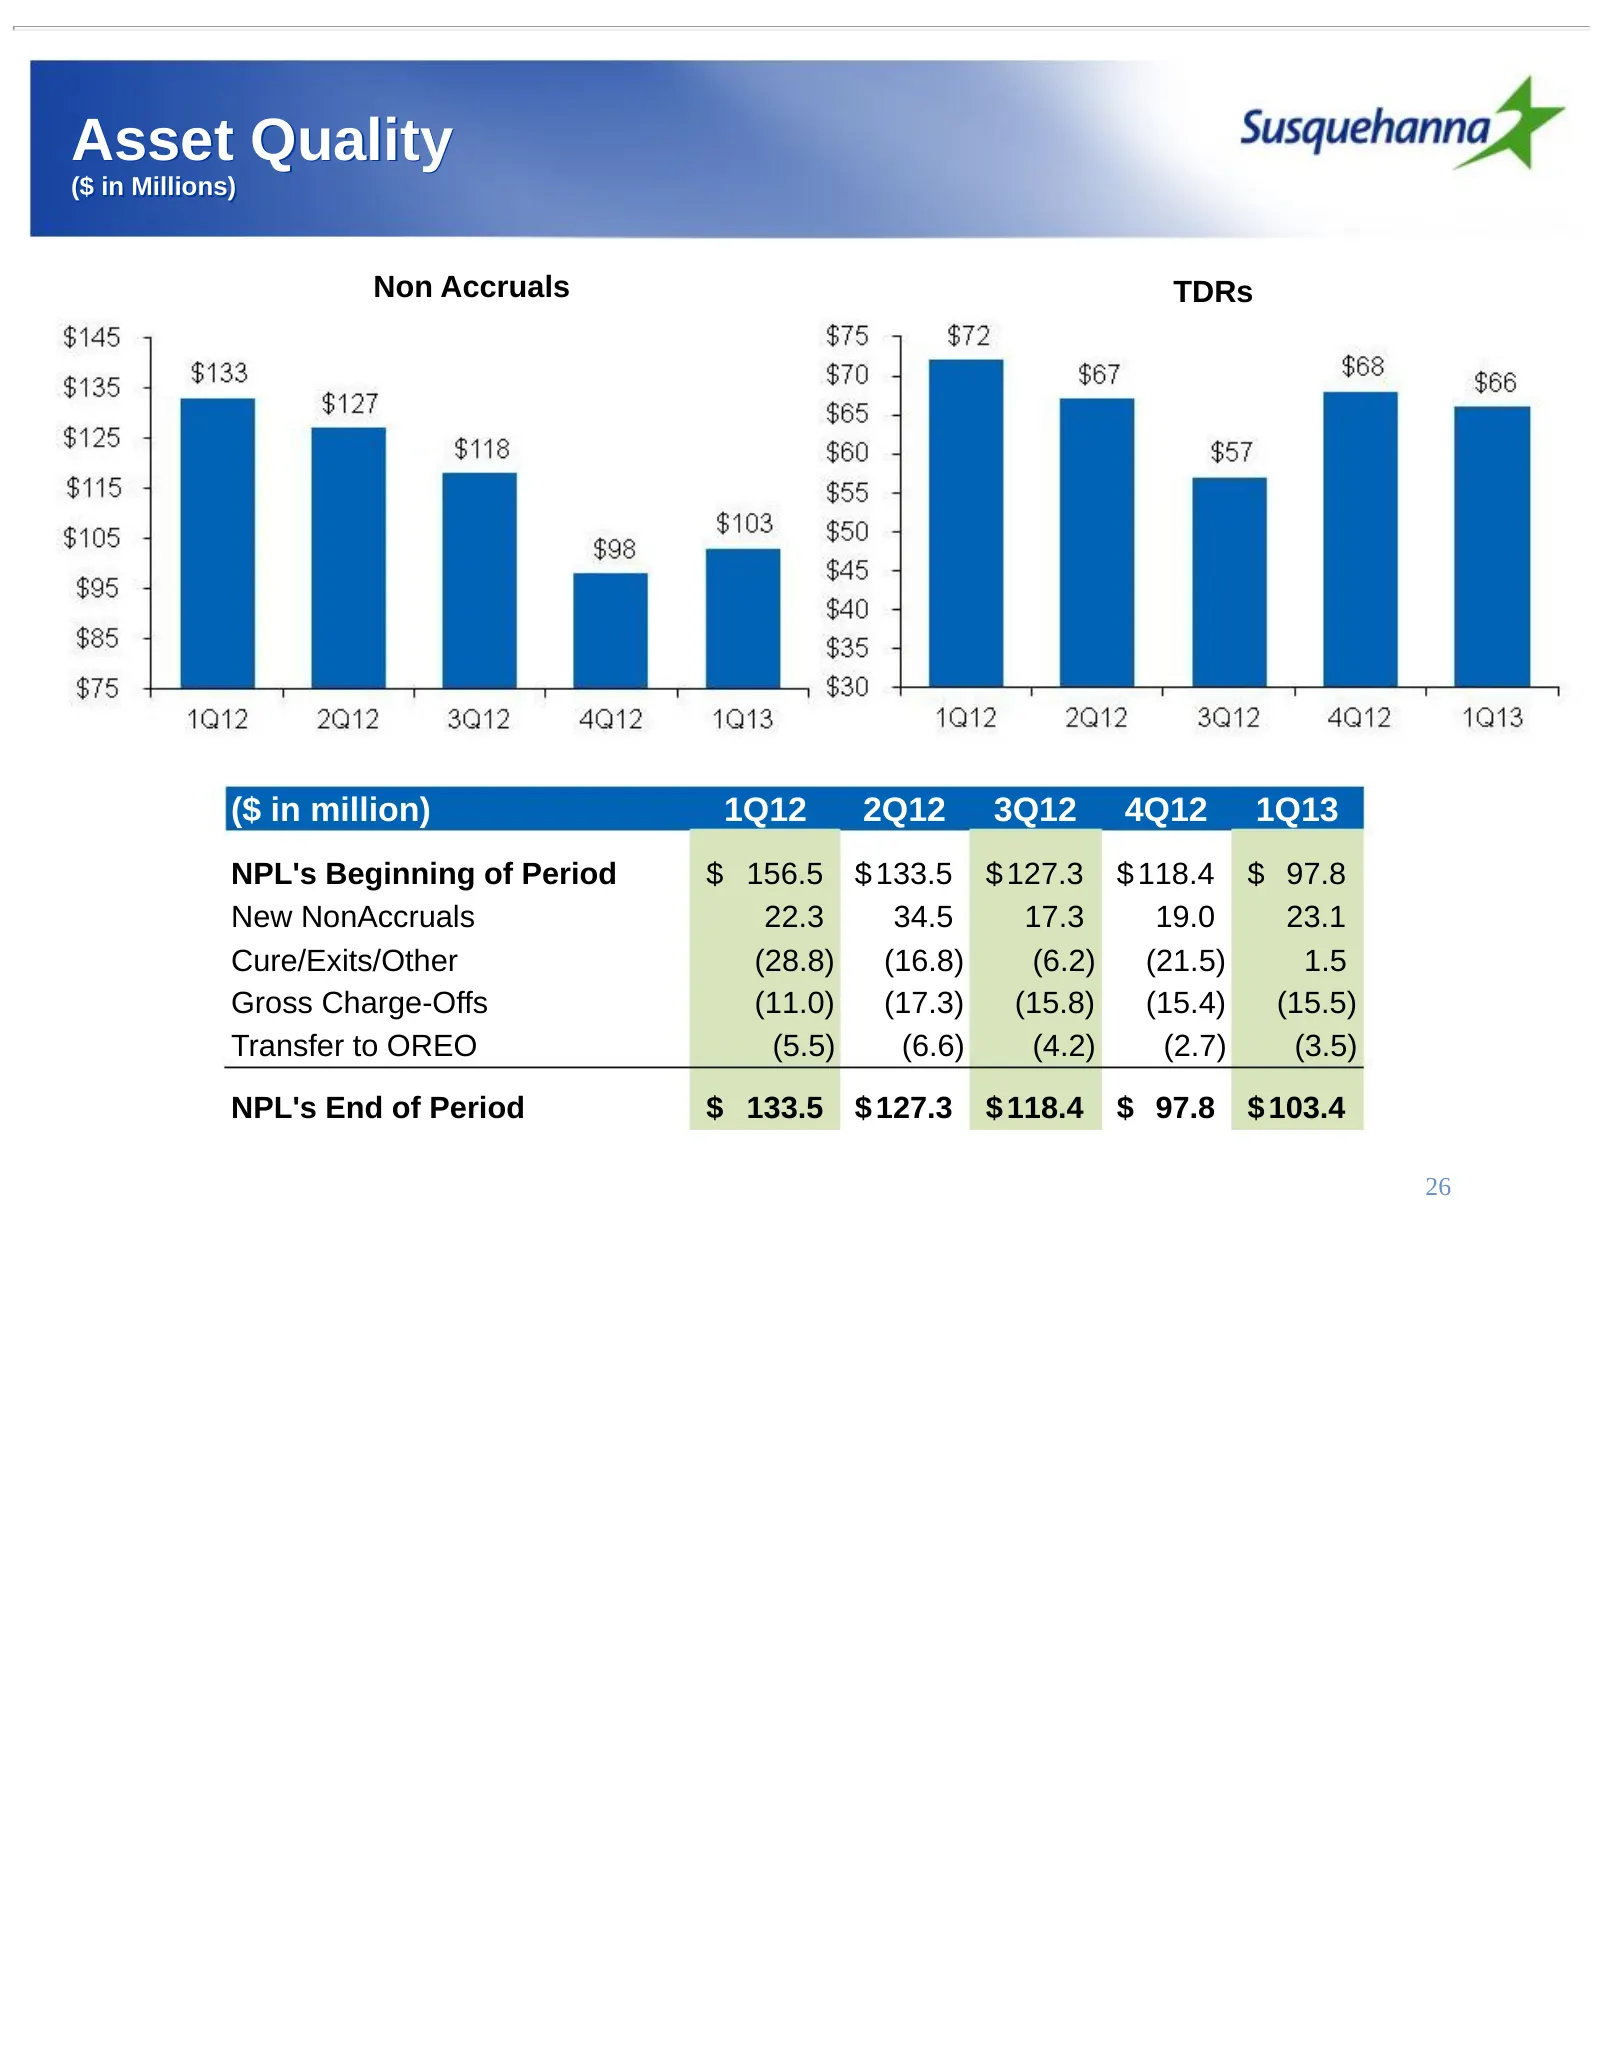
Asset Quality ($ in Millions) Non Accruals TDRs ($ in million) 1Q12 2Q12 3Q12 4Q12 1Q13 NPL's Beginning of Period $ 156.5 $ 133.5 $ 127.3 $ 118.4 $ 97.8 New NonAccruals 22.3 34.5 17.3 19.0 23.1 Cure/Exits/Other (28.8) (16.8) (6.2) (21.5) 1.5 Gross Charge-Offs (11.0) (17.3) (15.8) (15.4) (15.5) Trans
Slide 27: Asset Quality
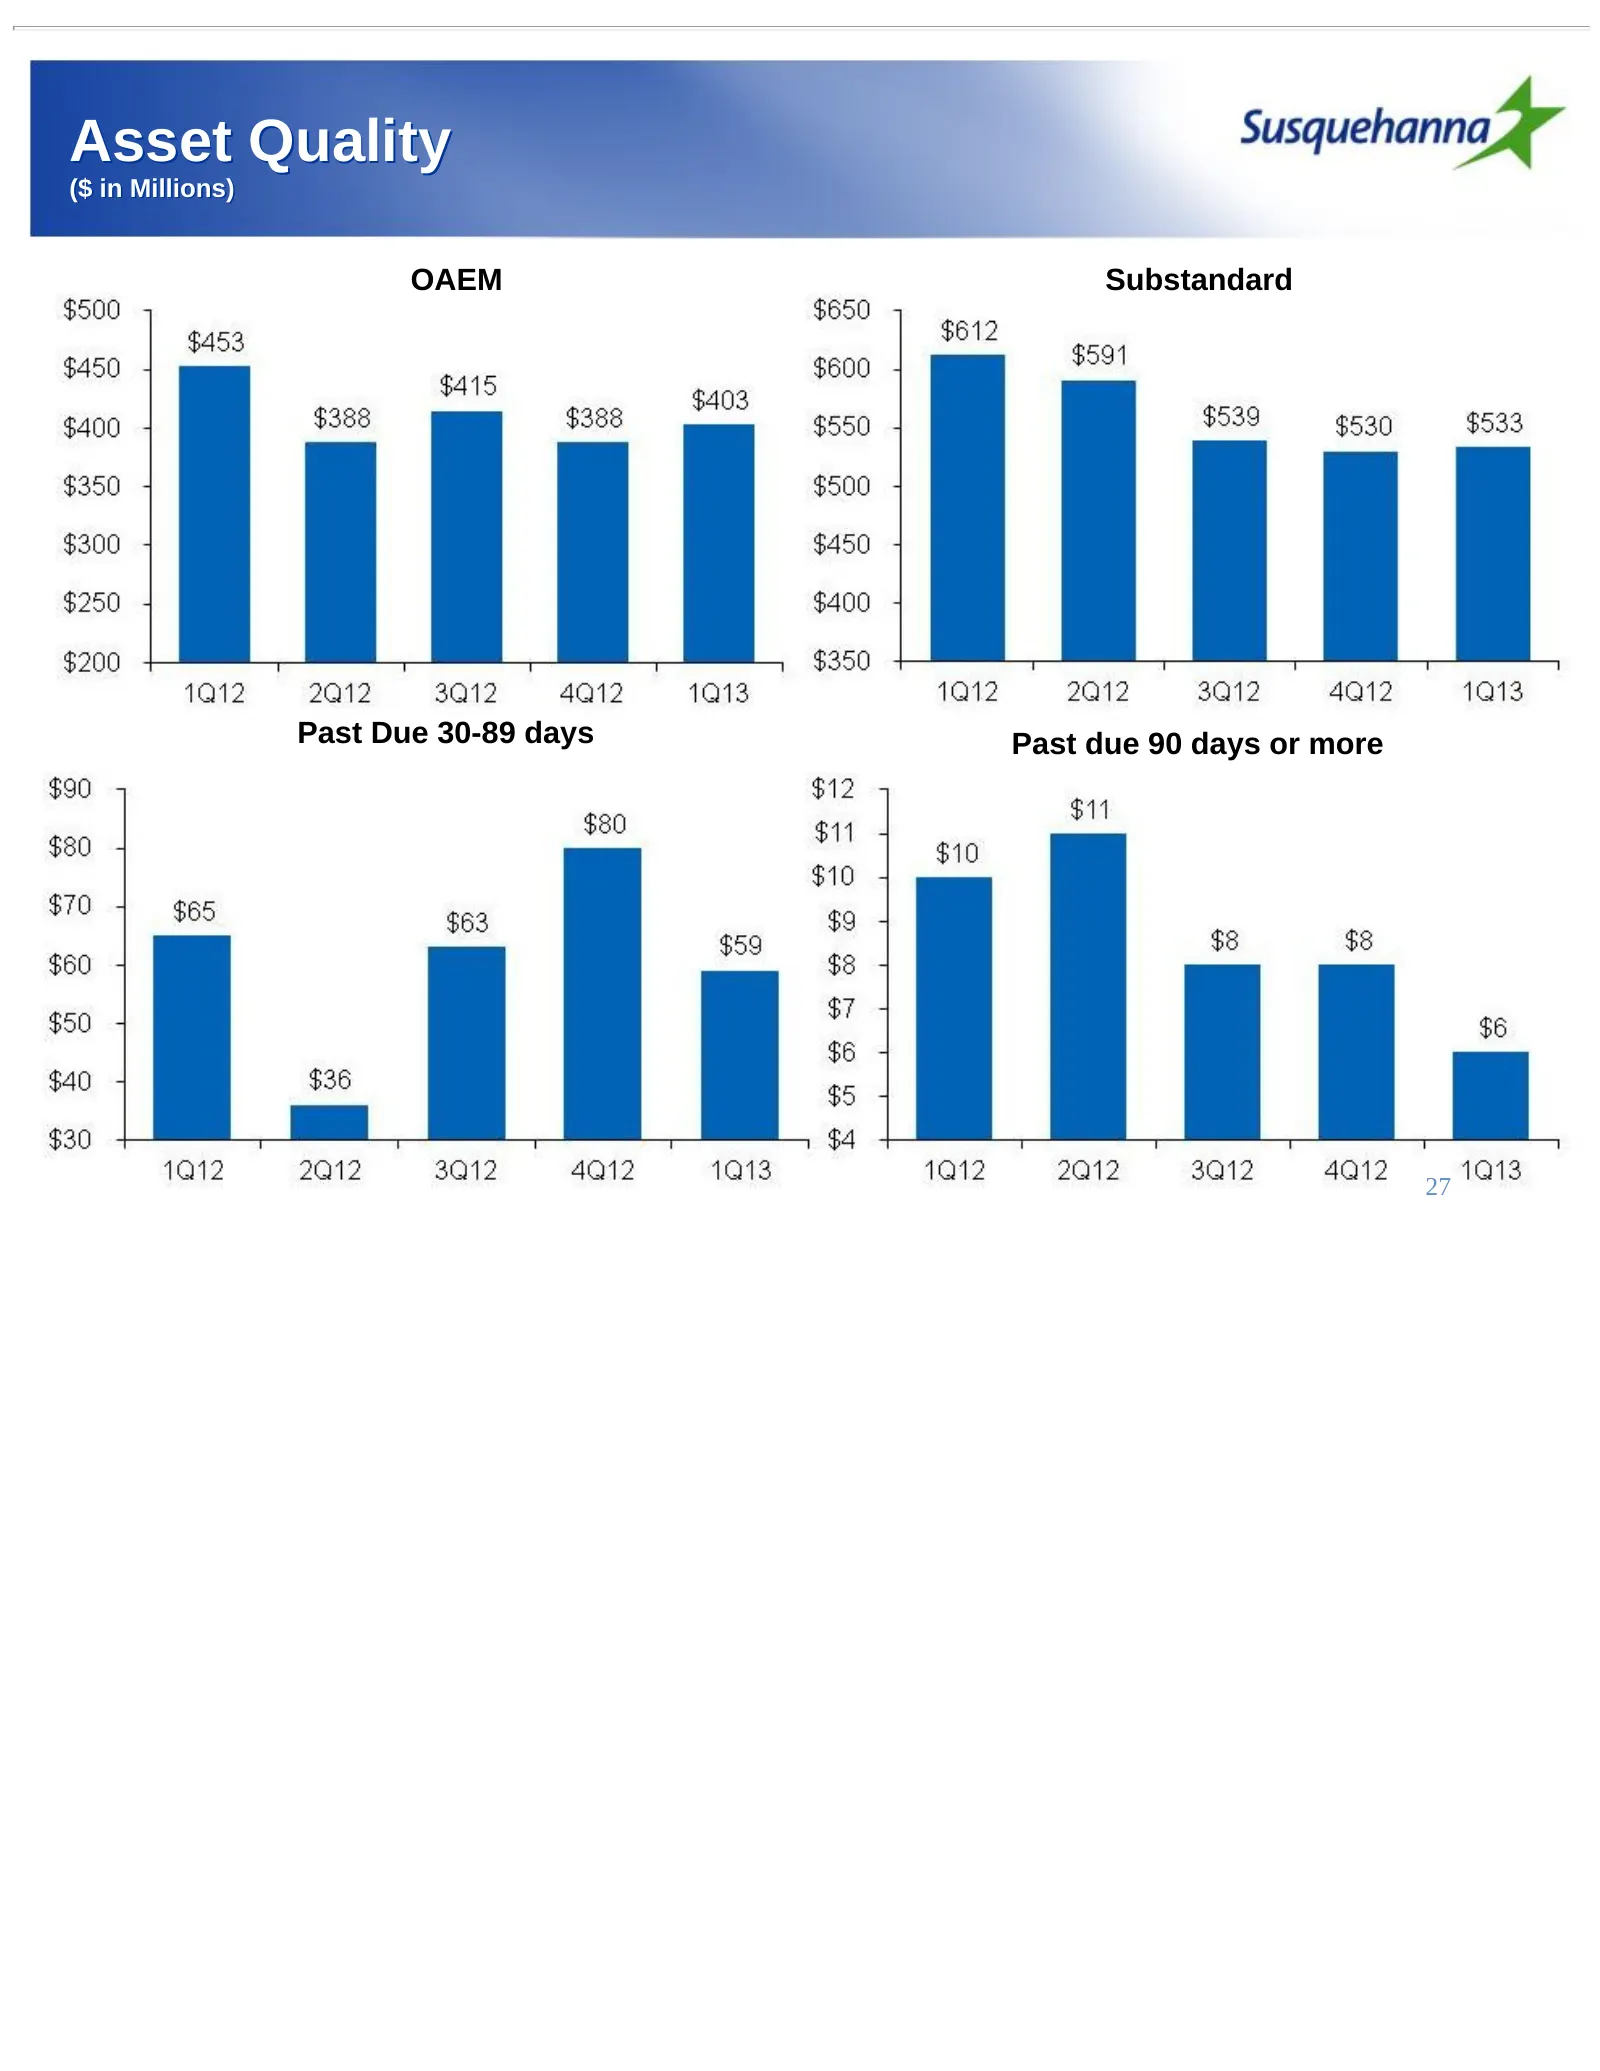
Asset Quality ($ in Millions) OAEM Substandard Past Due 30-89 days Past due 90 days or more 27
Slide 28: Investment Securities
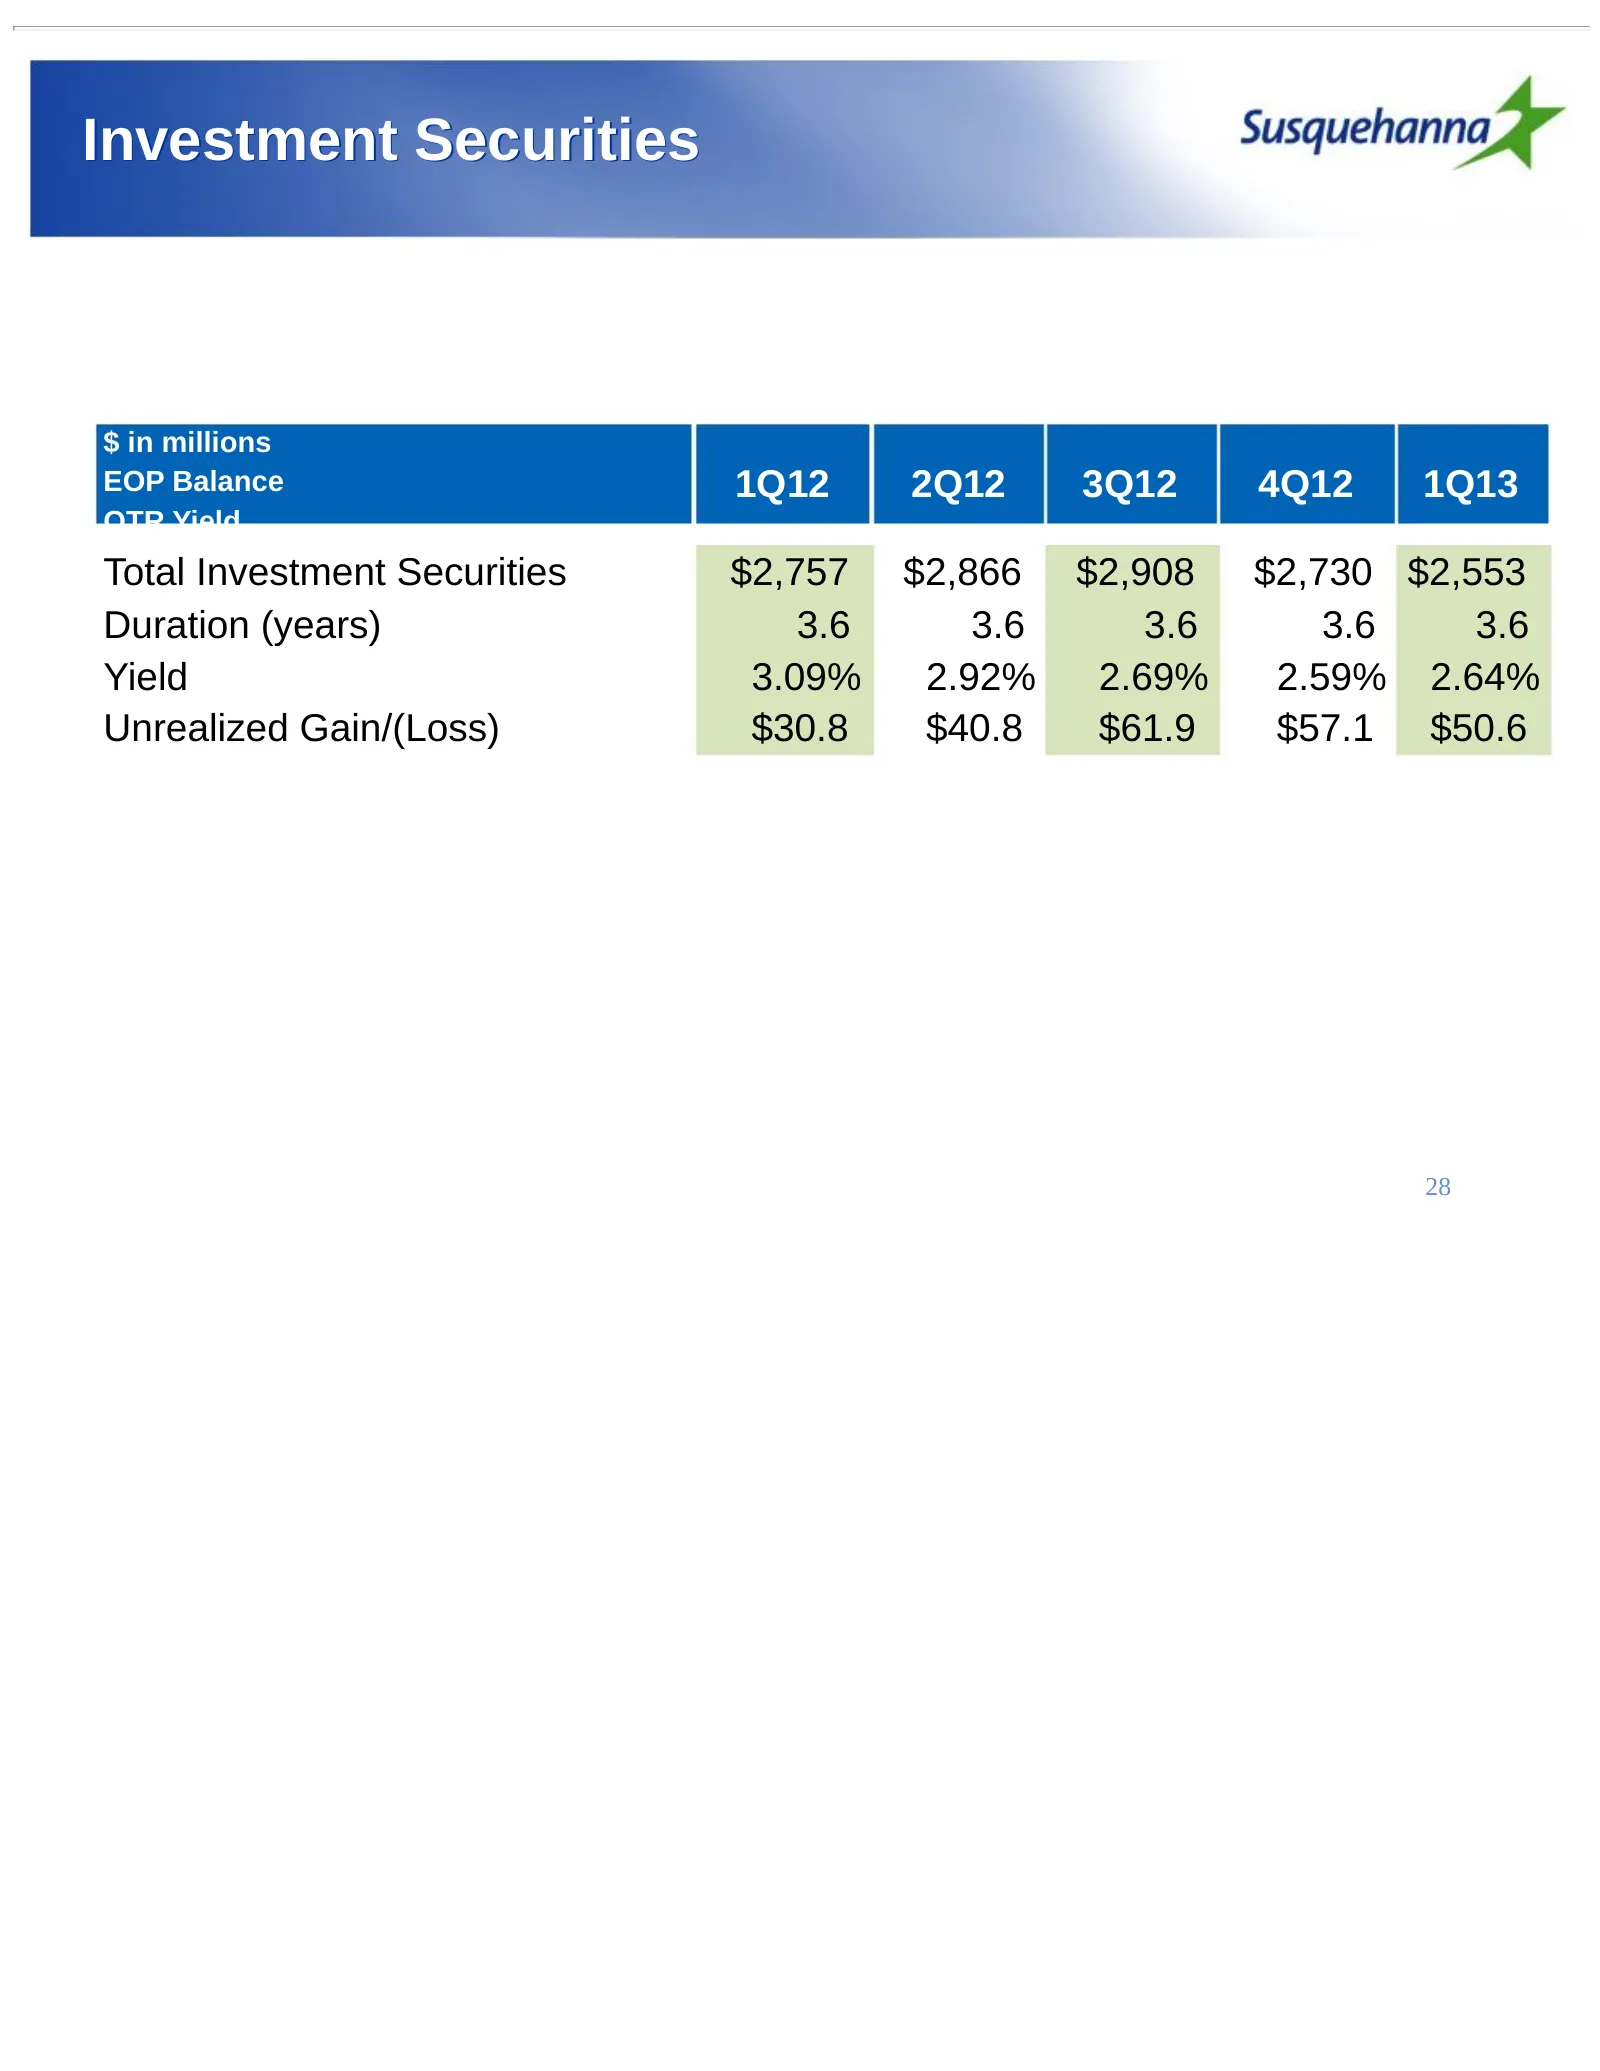
Investment Securities $ in millions EOP Balance 1Q12 2Q12 3Q12 4Q12 1Q13 QTR Yield Total Investment Securities $2,757 $2,866 $2,908 $2,730 $2,553 Duration (years) 3.6 3.6 3.6 3.6 3.6 Yield 3.09% 2.92% 2.69% 2.59% 2.64% Unrealized Gain/(Loss) $30.8 $40.8 $61.9 $57.1 $50.6 28
Slide 29: Deposit Mix & Cost by Product
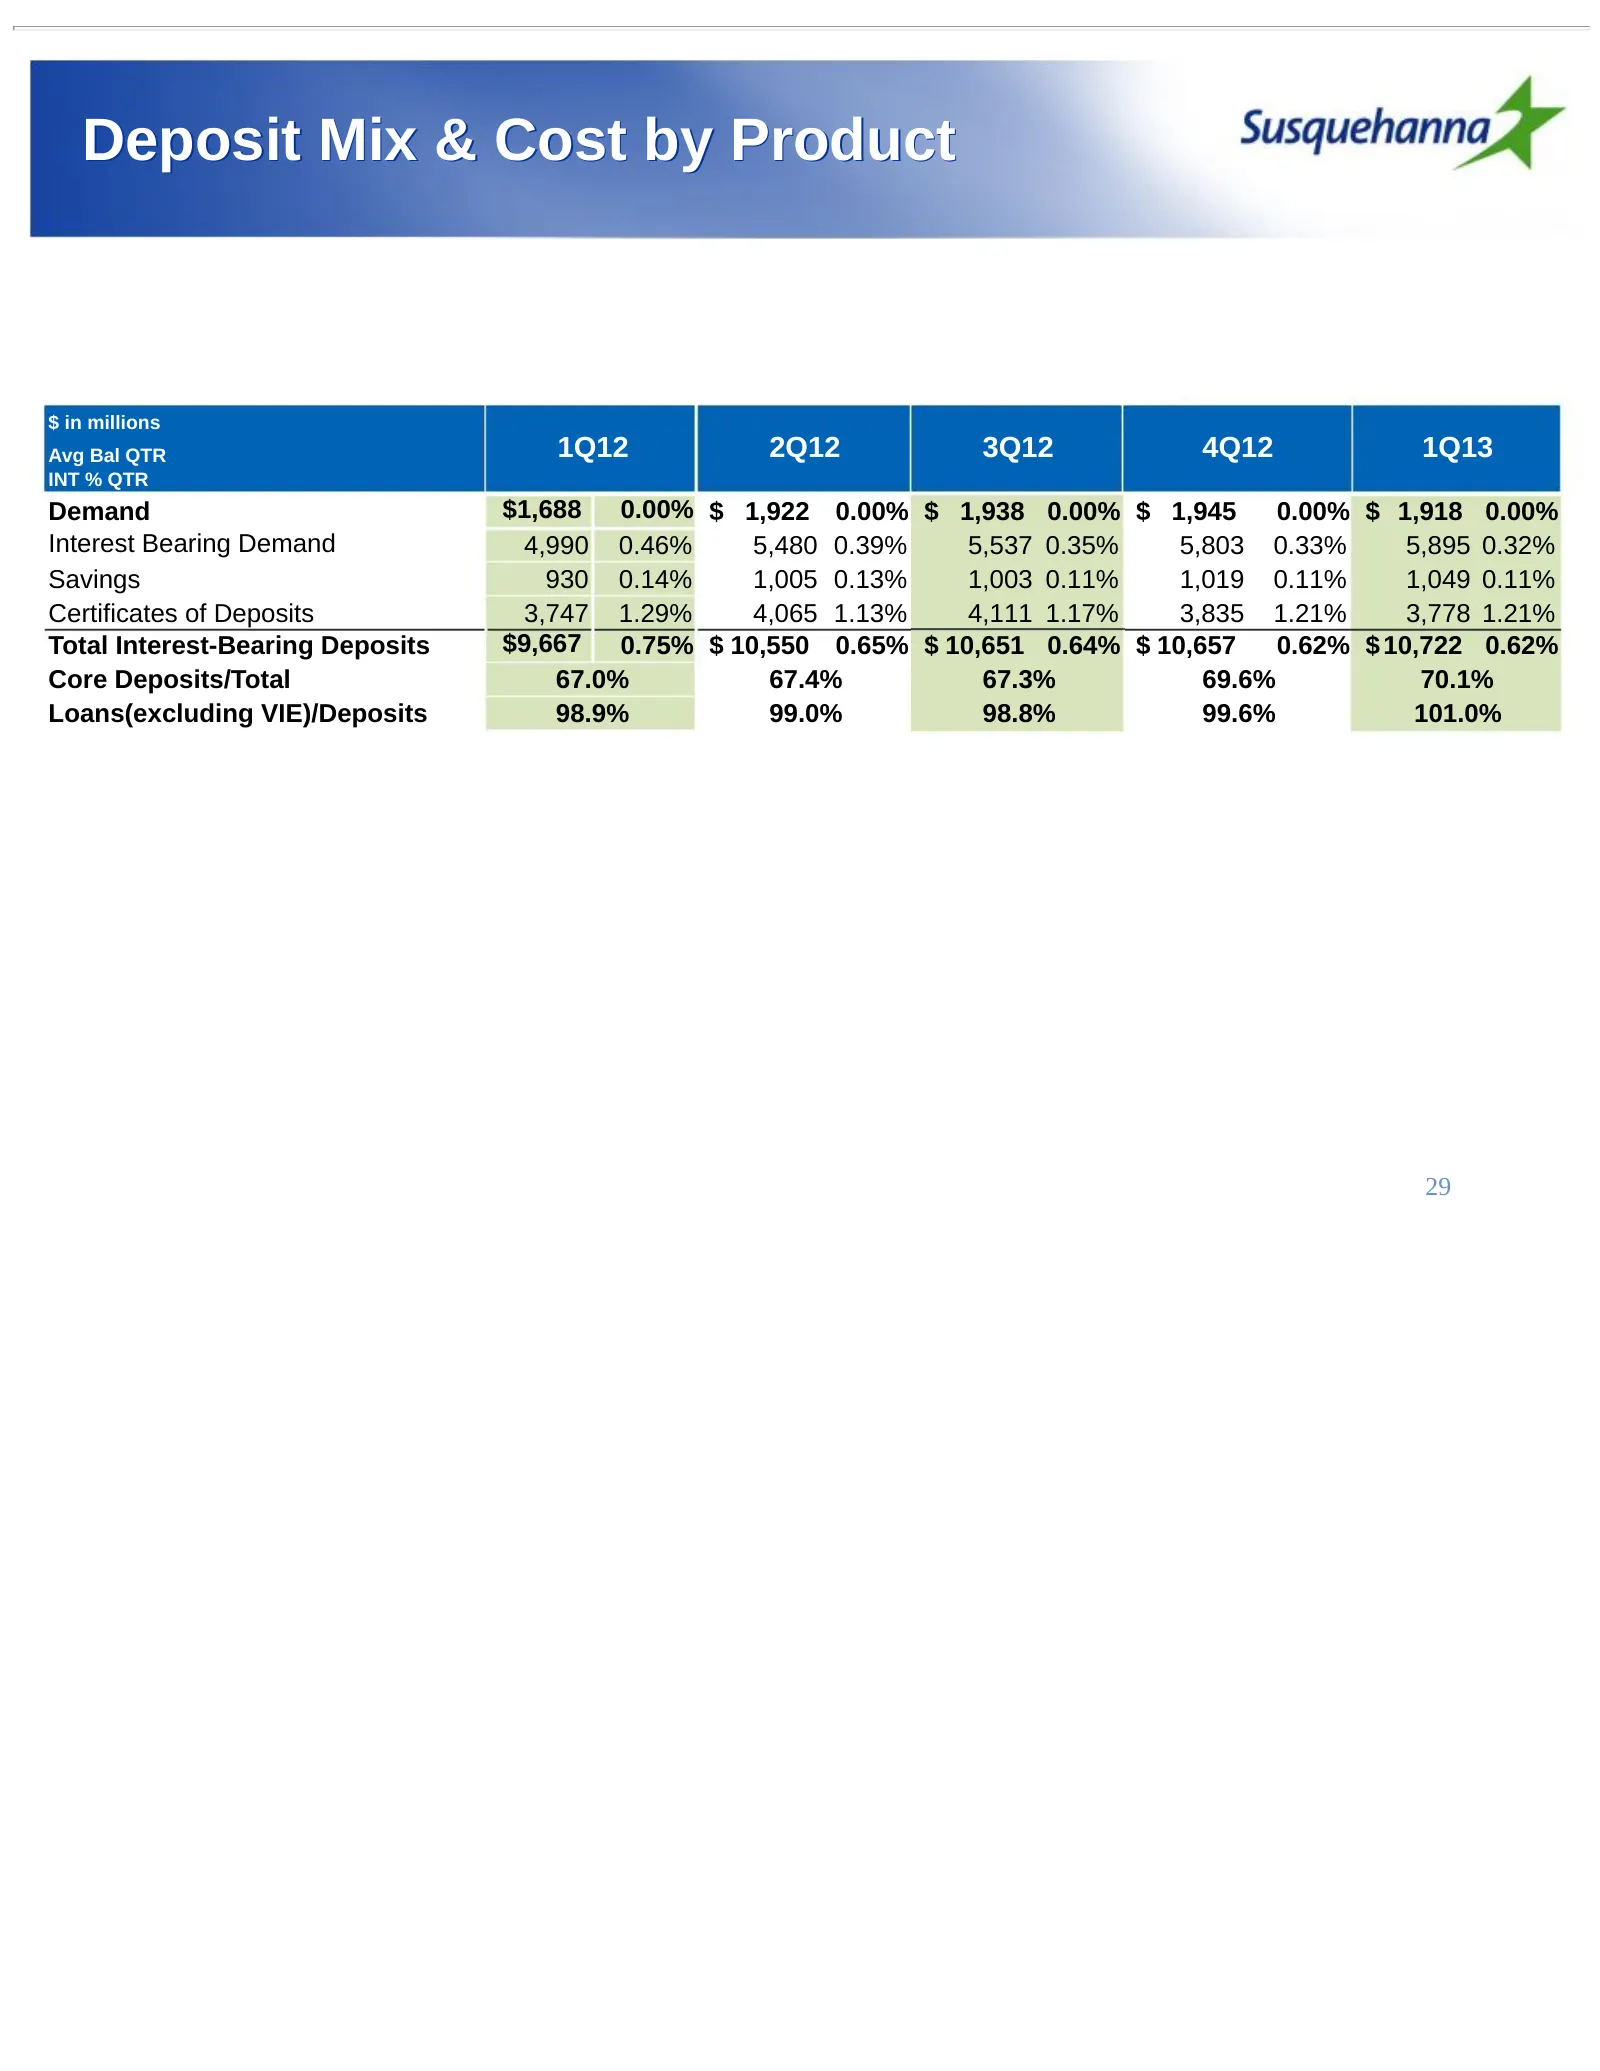
Deposit Mix & Cost by Product $ in millions Avg Bal QTR 1Q12 2Q12 3Q12 4Q12 1Q13 INT % QTR Demand $1,688 0.00% $ 1,922 0.00% $ 1,938 0.00% $ 1,945 0.00% $ 1,918 0.00% Interest Bearing Demand 4,990 0.46% 5,480 0.39% 5,537 0.35% 5,803 0.33% 5,895 0.32% Savings 930 0.14% 1,005 0.13% 1,003 0.11% 1,019 0
Slide 30: Borrowing Mix & Cost
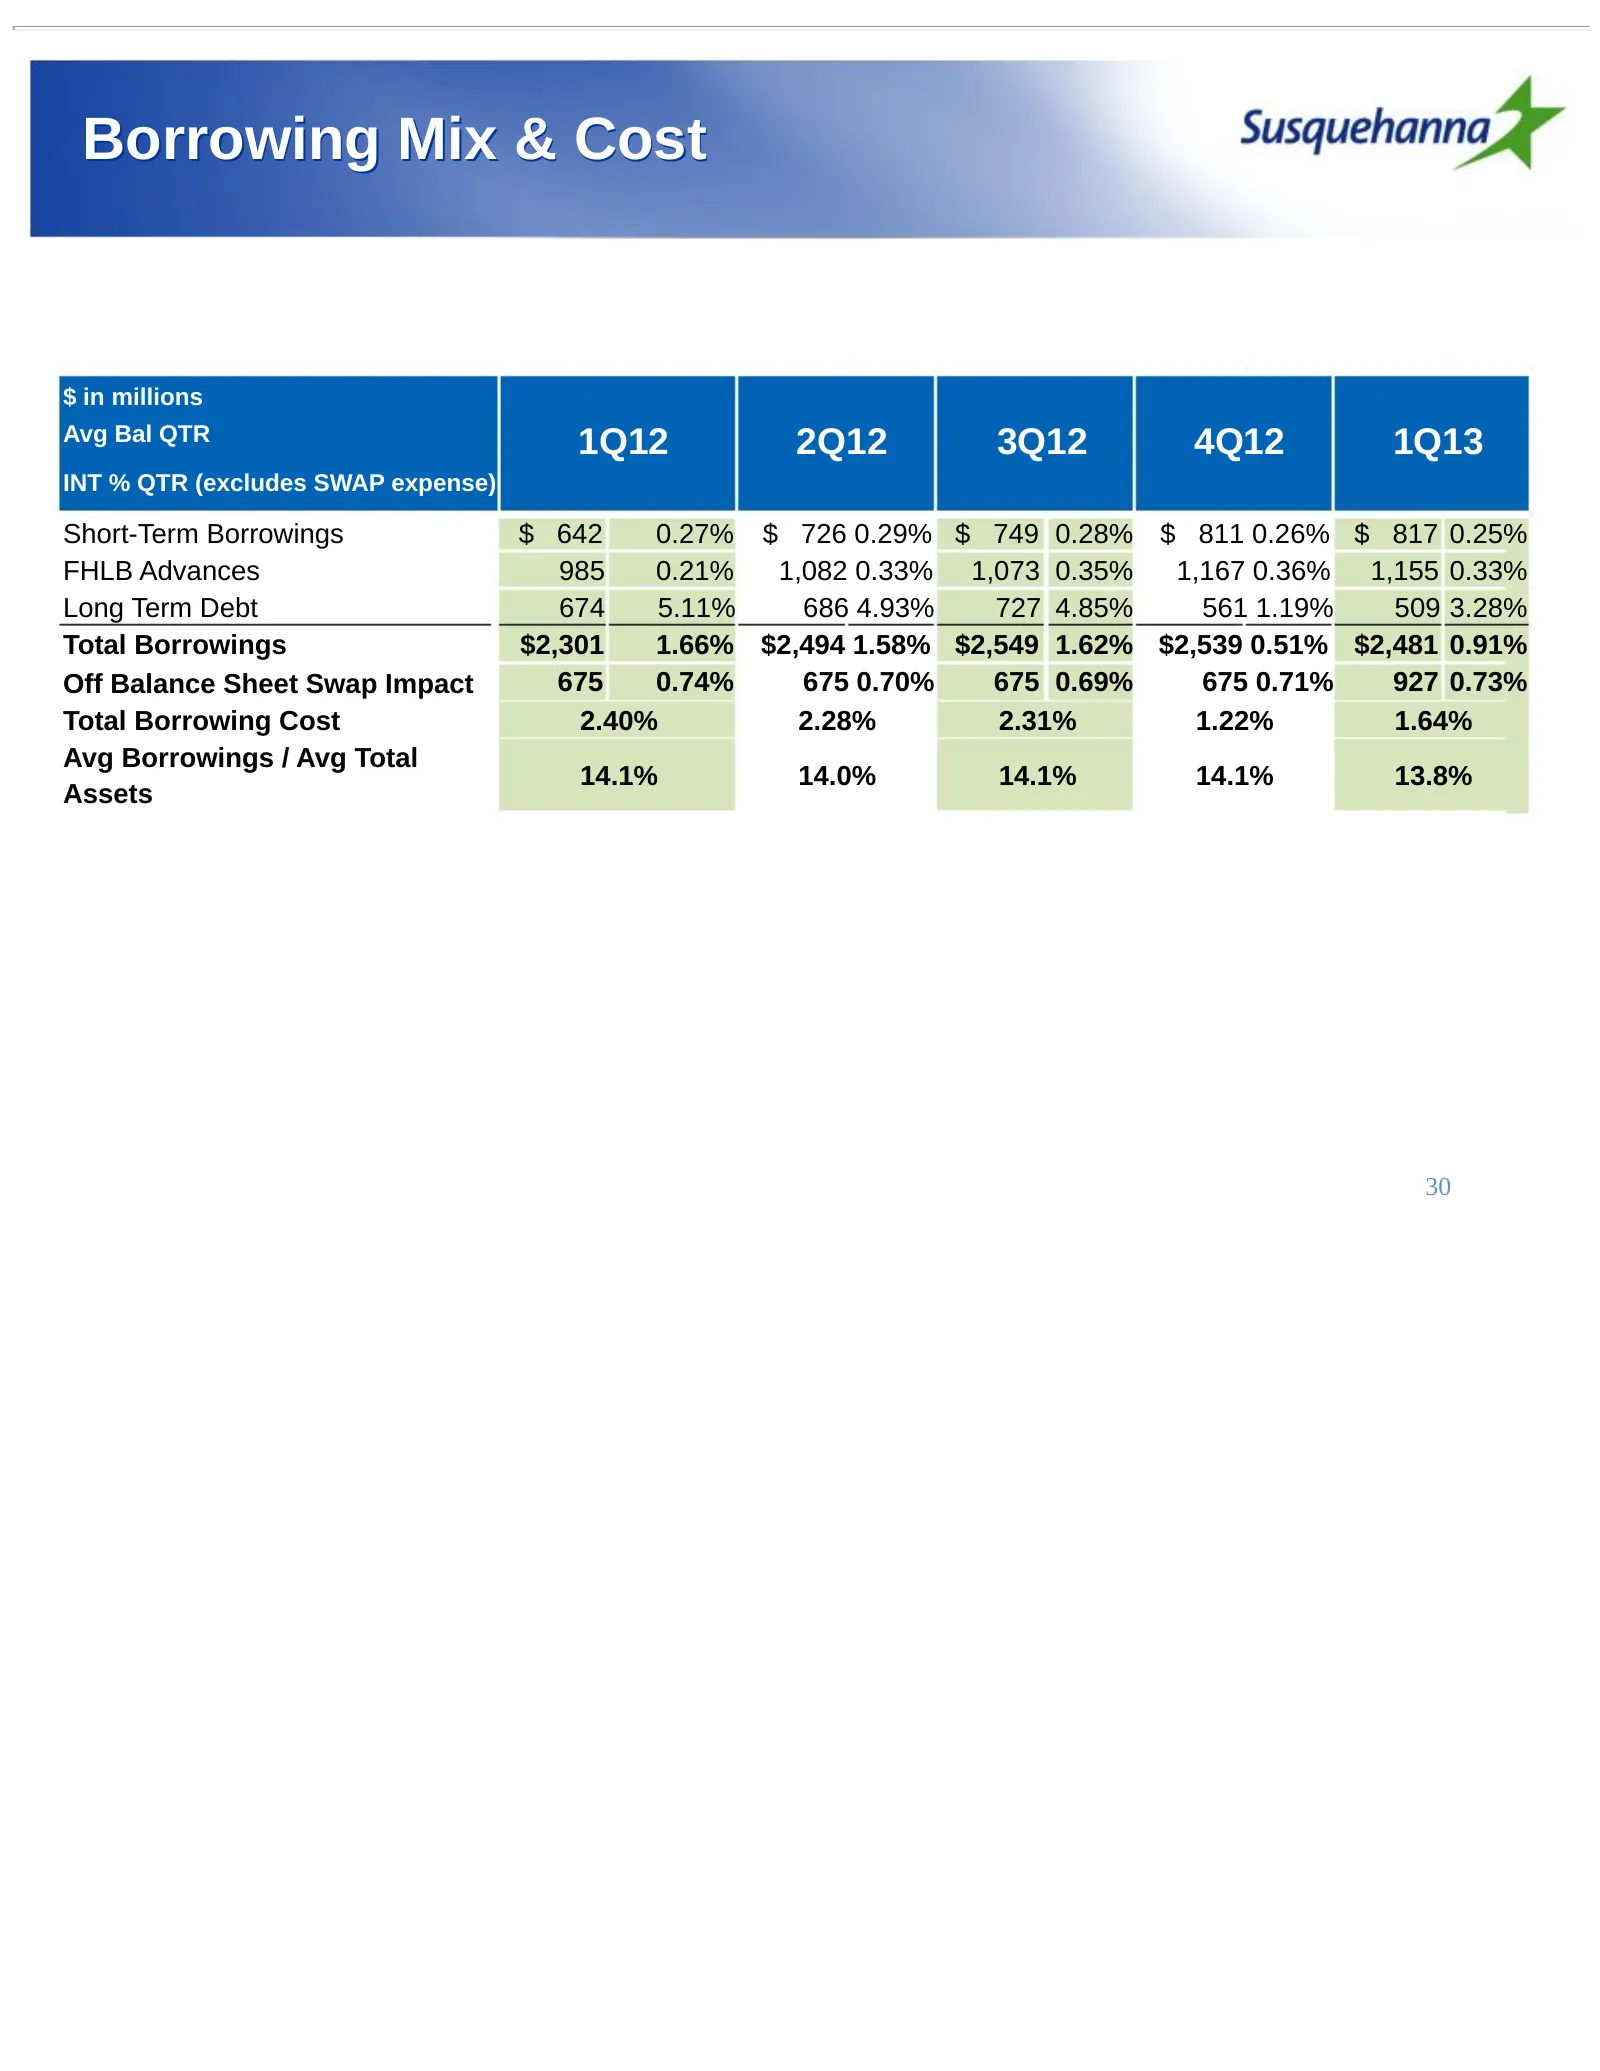
Borrowing Mix & Cost $ in millions Avg Bal QTR 1Q12 2Q12 3Q12 4Q12 1Q13 INT % QTR (excludes SWAP expense) Short-Term Borrowings $ 642 0.27% $ 726 0.29% $ 749 0.28% $ 811 0.26% $ 817 0.25% FHLB Advances 985 0.21% 1,082 0.33% 1,073 0.35% 1,167 0.36% 1,155 0.33% Long Term Debt 674 5.11% 686 4.93% 727 4
Slide 31: Quarterly Fee Revenue
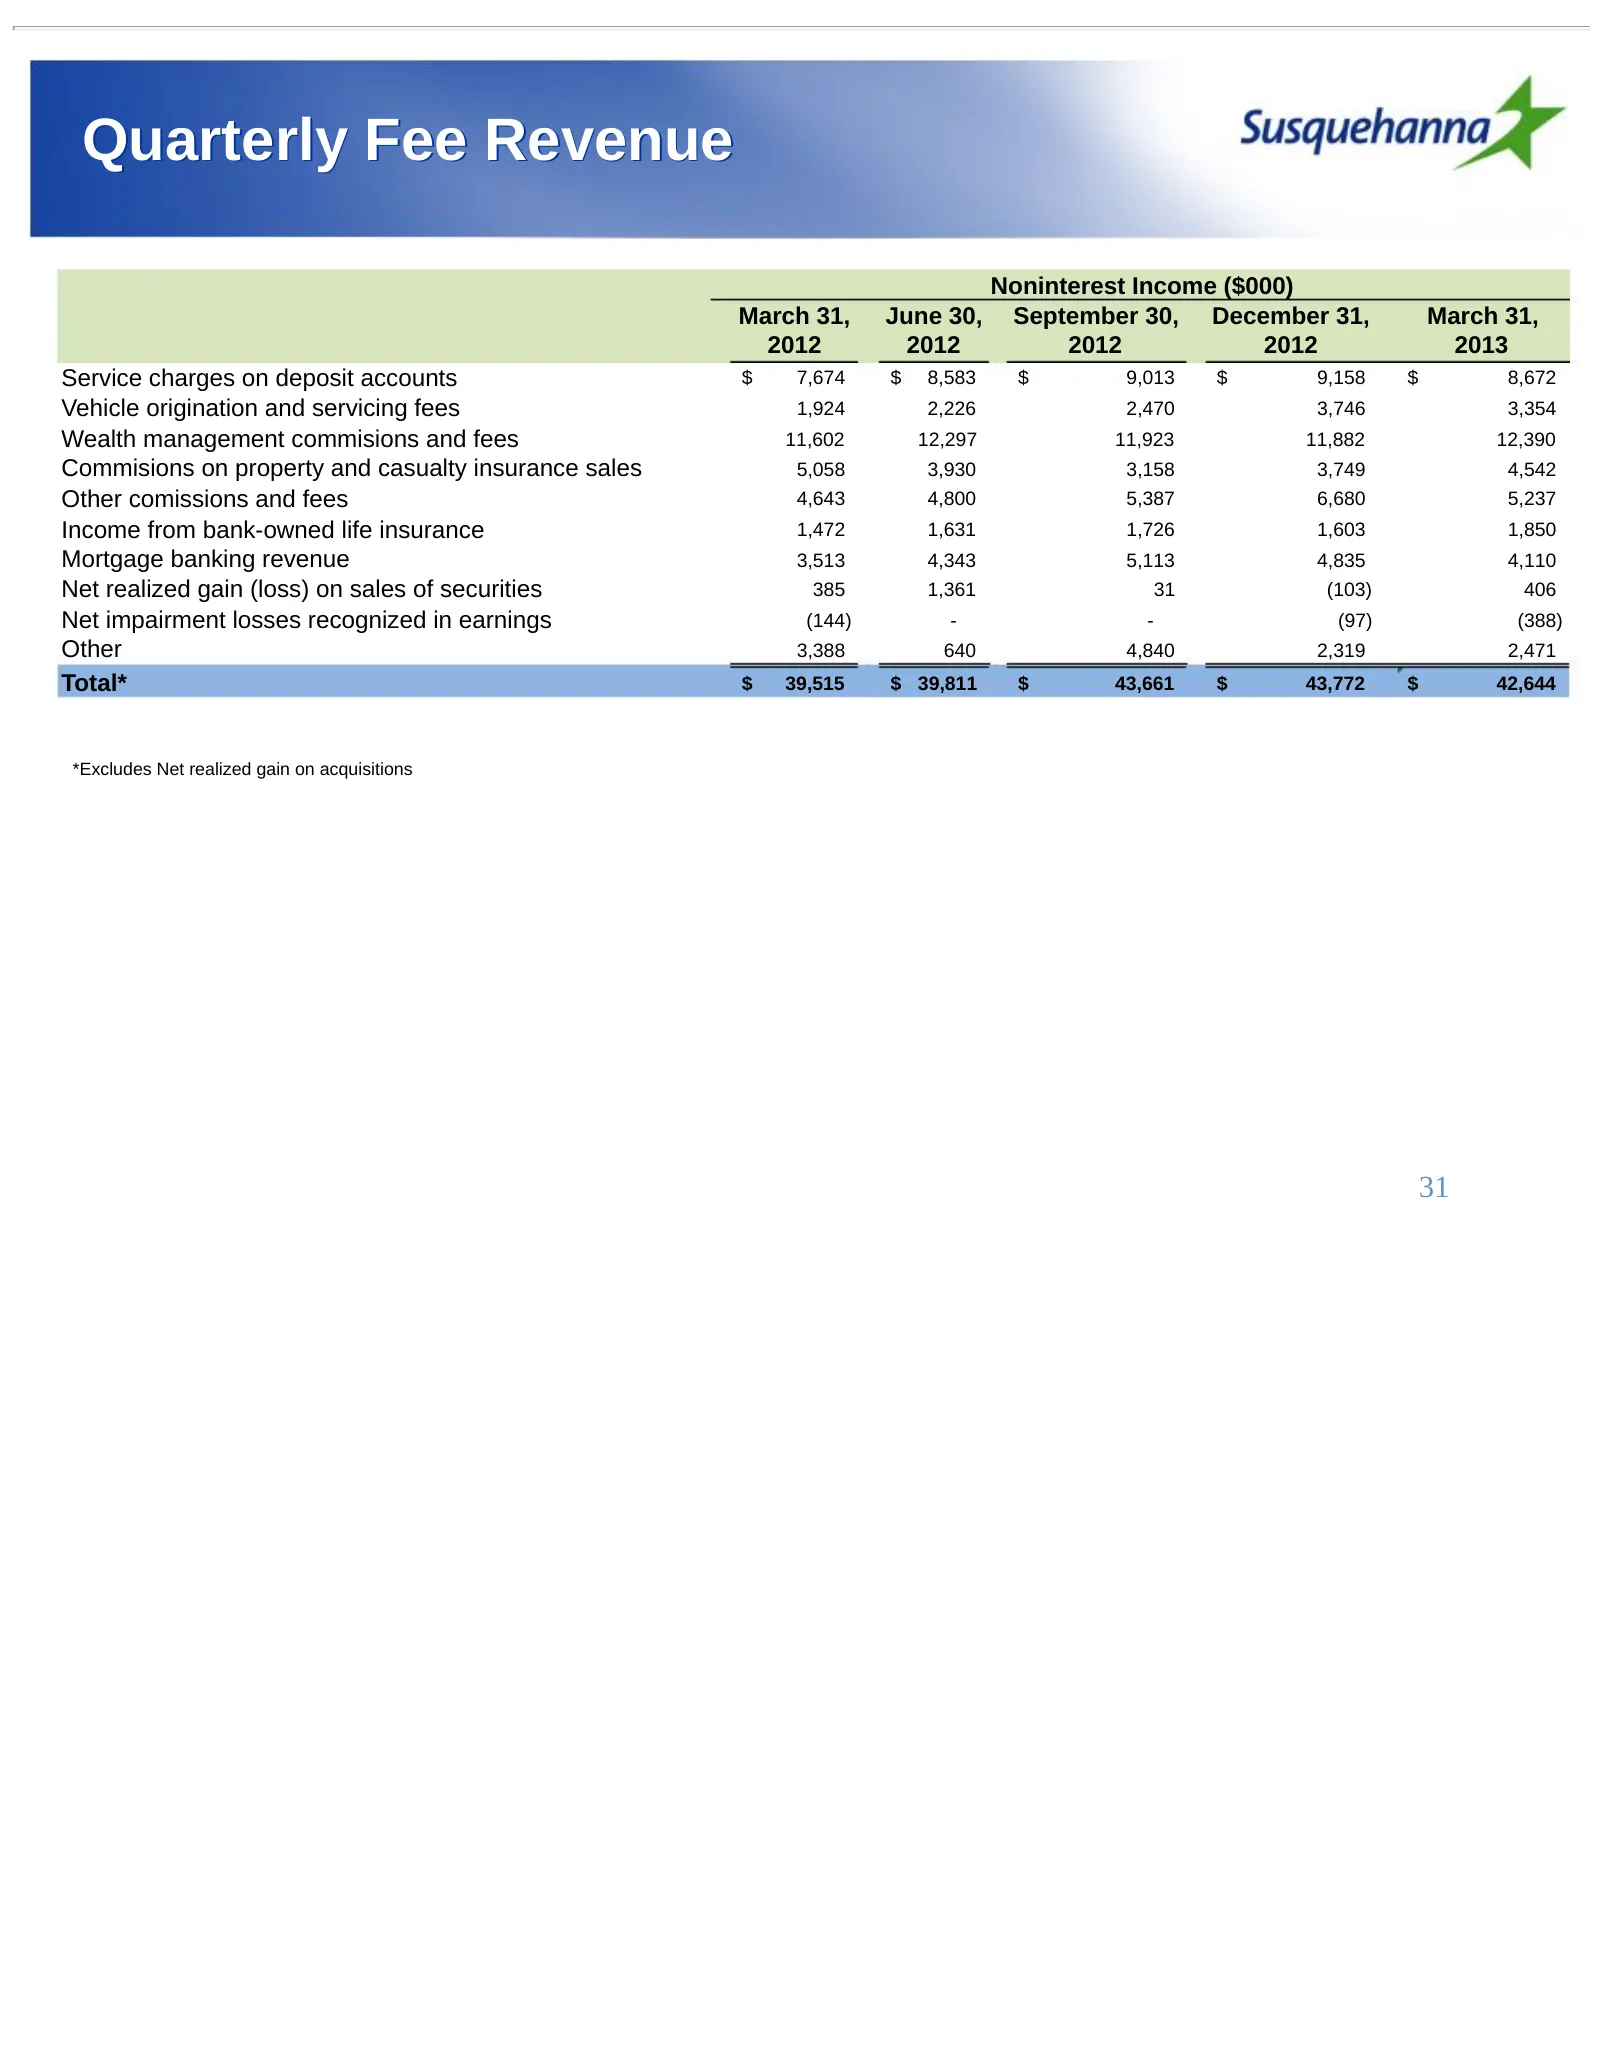
Quarterly Fee Revenue Noninterest Income ($000) March 31, June 30, September 30, December 31, March 31, 2012 2012 2012 2012 2013 Service charges on deposit accounts $ 7,674 $ 8,583 $ 9,013 $ 9,158 $ 8,672 Vehicle origination and servicing fees 1,924 2,226 2,470 3,746 3,354 Wealth management commisio
Slide 32: Earnings Drivers
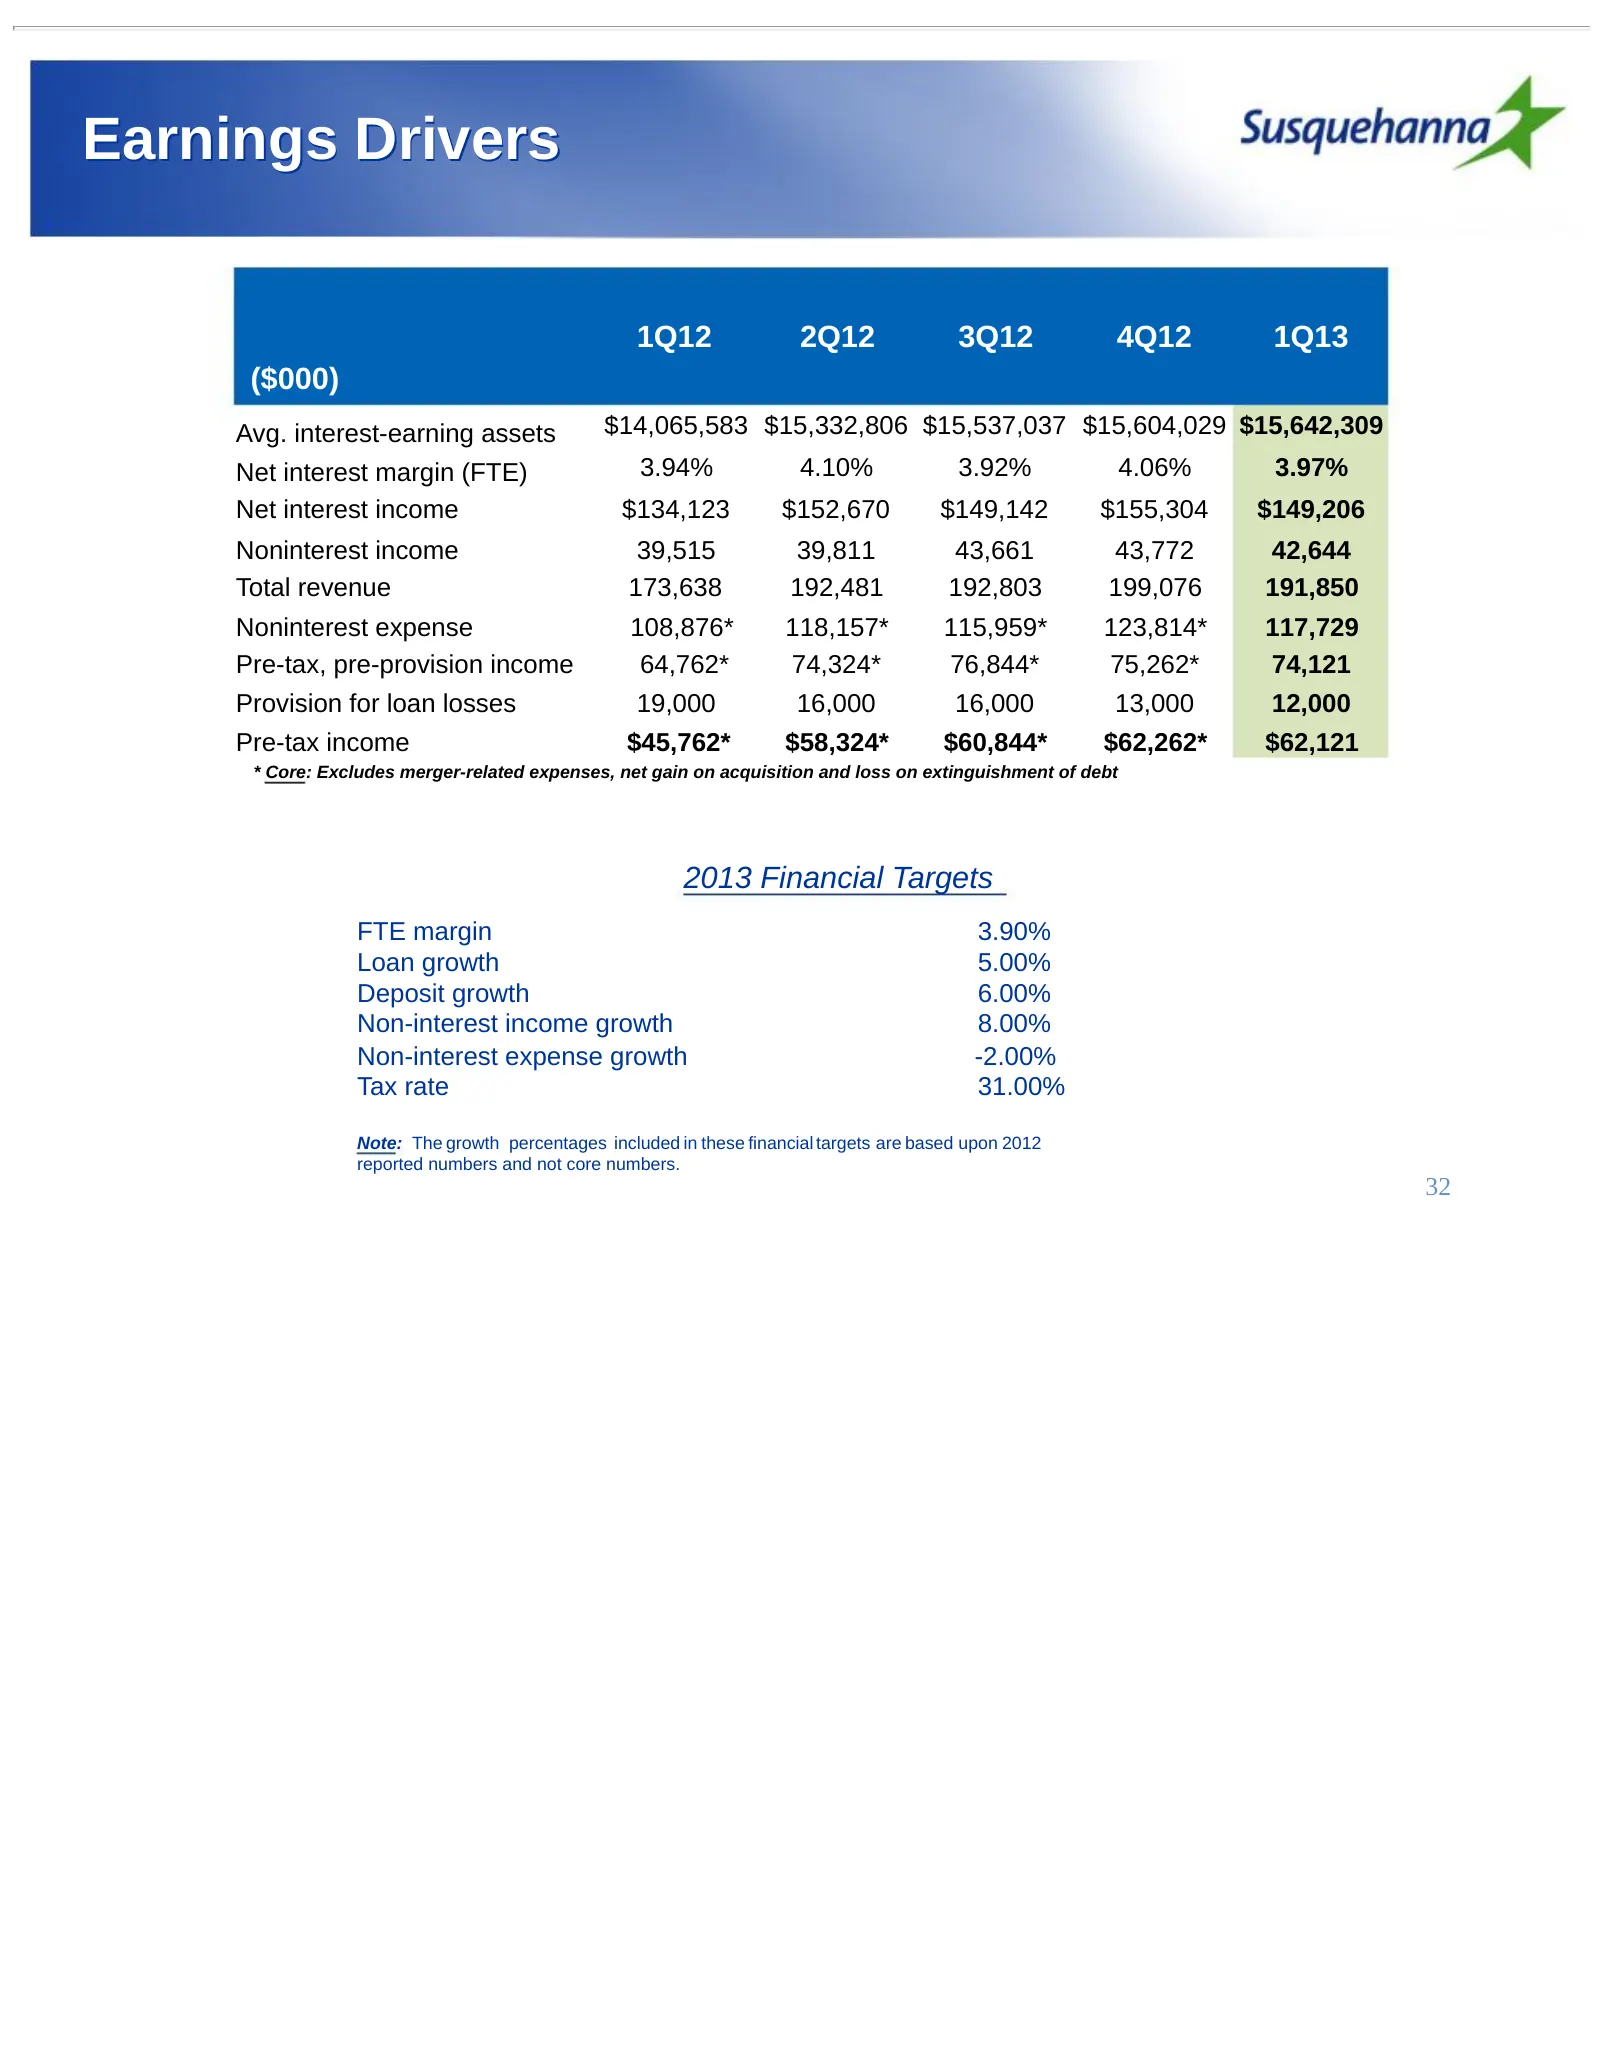
Earnings Drivers 1Q12 2Q12 3Q12 4Q12 1Q13 ($000) Avg. interest-earning assets $14,065,583 $15,332,806 $15,537,037 $15,604,029 $15,642,309 Net interest margin (FTE) 3.94% 4.10% 3.92% 4.06% 3.97% Net interest income $134,123 $152,670 $149,142 $155,304 $149,206 Noninterest income 39,515 39,811 43,661 4
Slide 33: Susquehanna Bank Markets
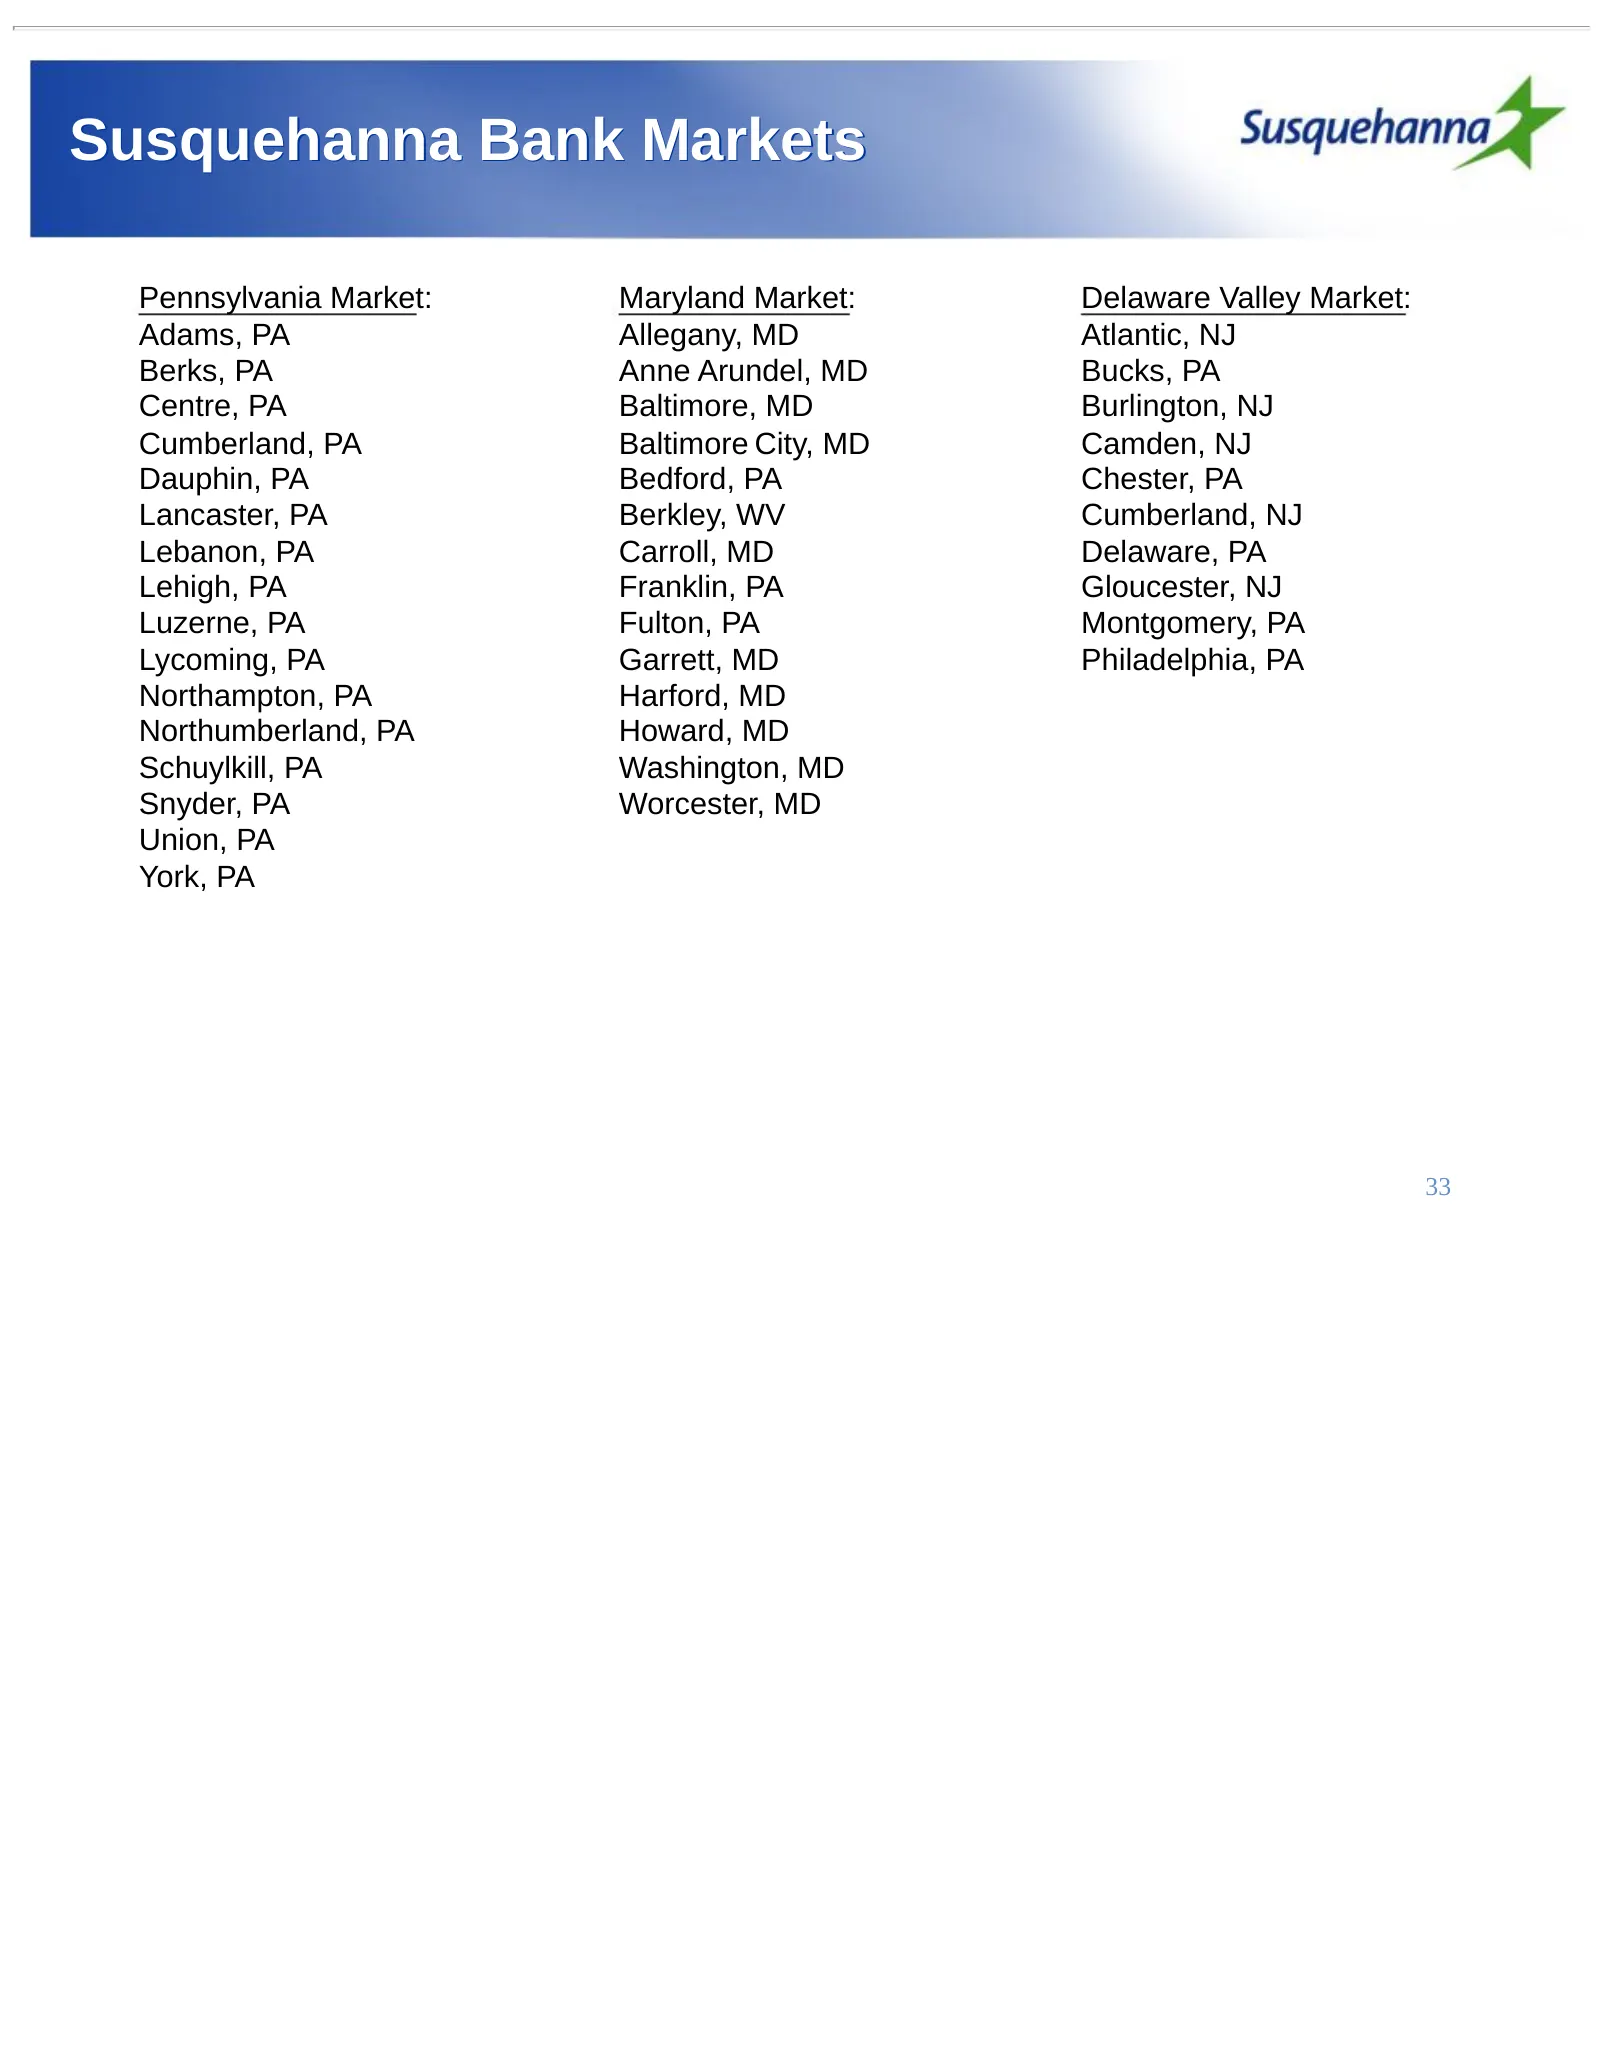
Susquehanna Bank Markets Pennsylvania Market: Maryland Market: Delaware Valley Market: Adams, PA Allegany, MD Atlantic, NJ Berks, PA Anne Arundel, MD Bucks, PA Centre, PA Baltimore, MD Burlington, NJ Cumberland, PA Baltimore City, MD Camden, NJ Dauphin, PA Bedford, PA Chester, PA Lancaster, PA Berkl
Slide 34: Peer Companies
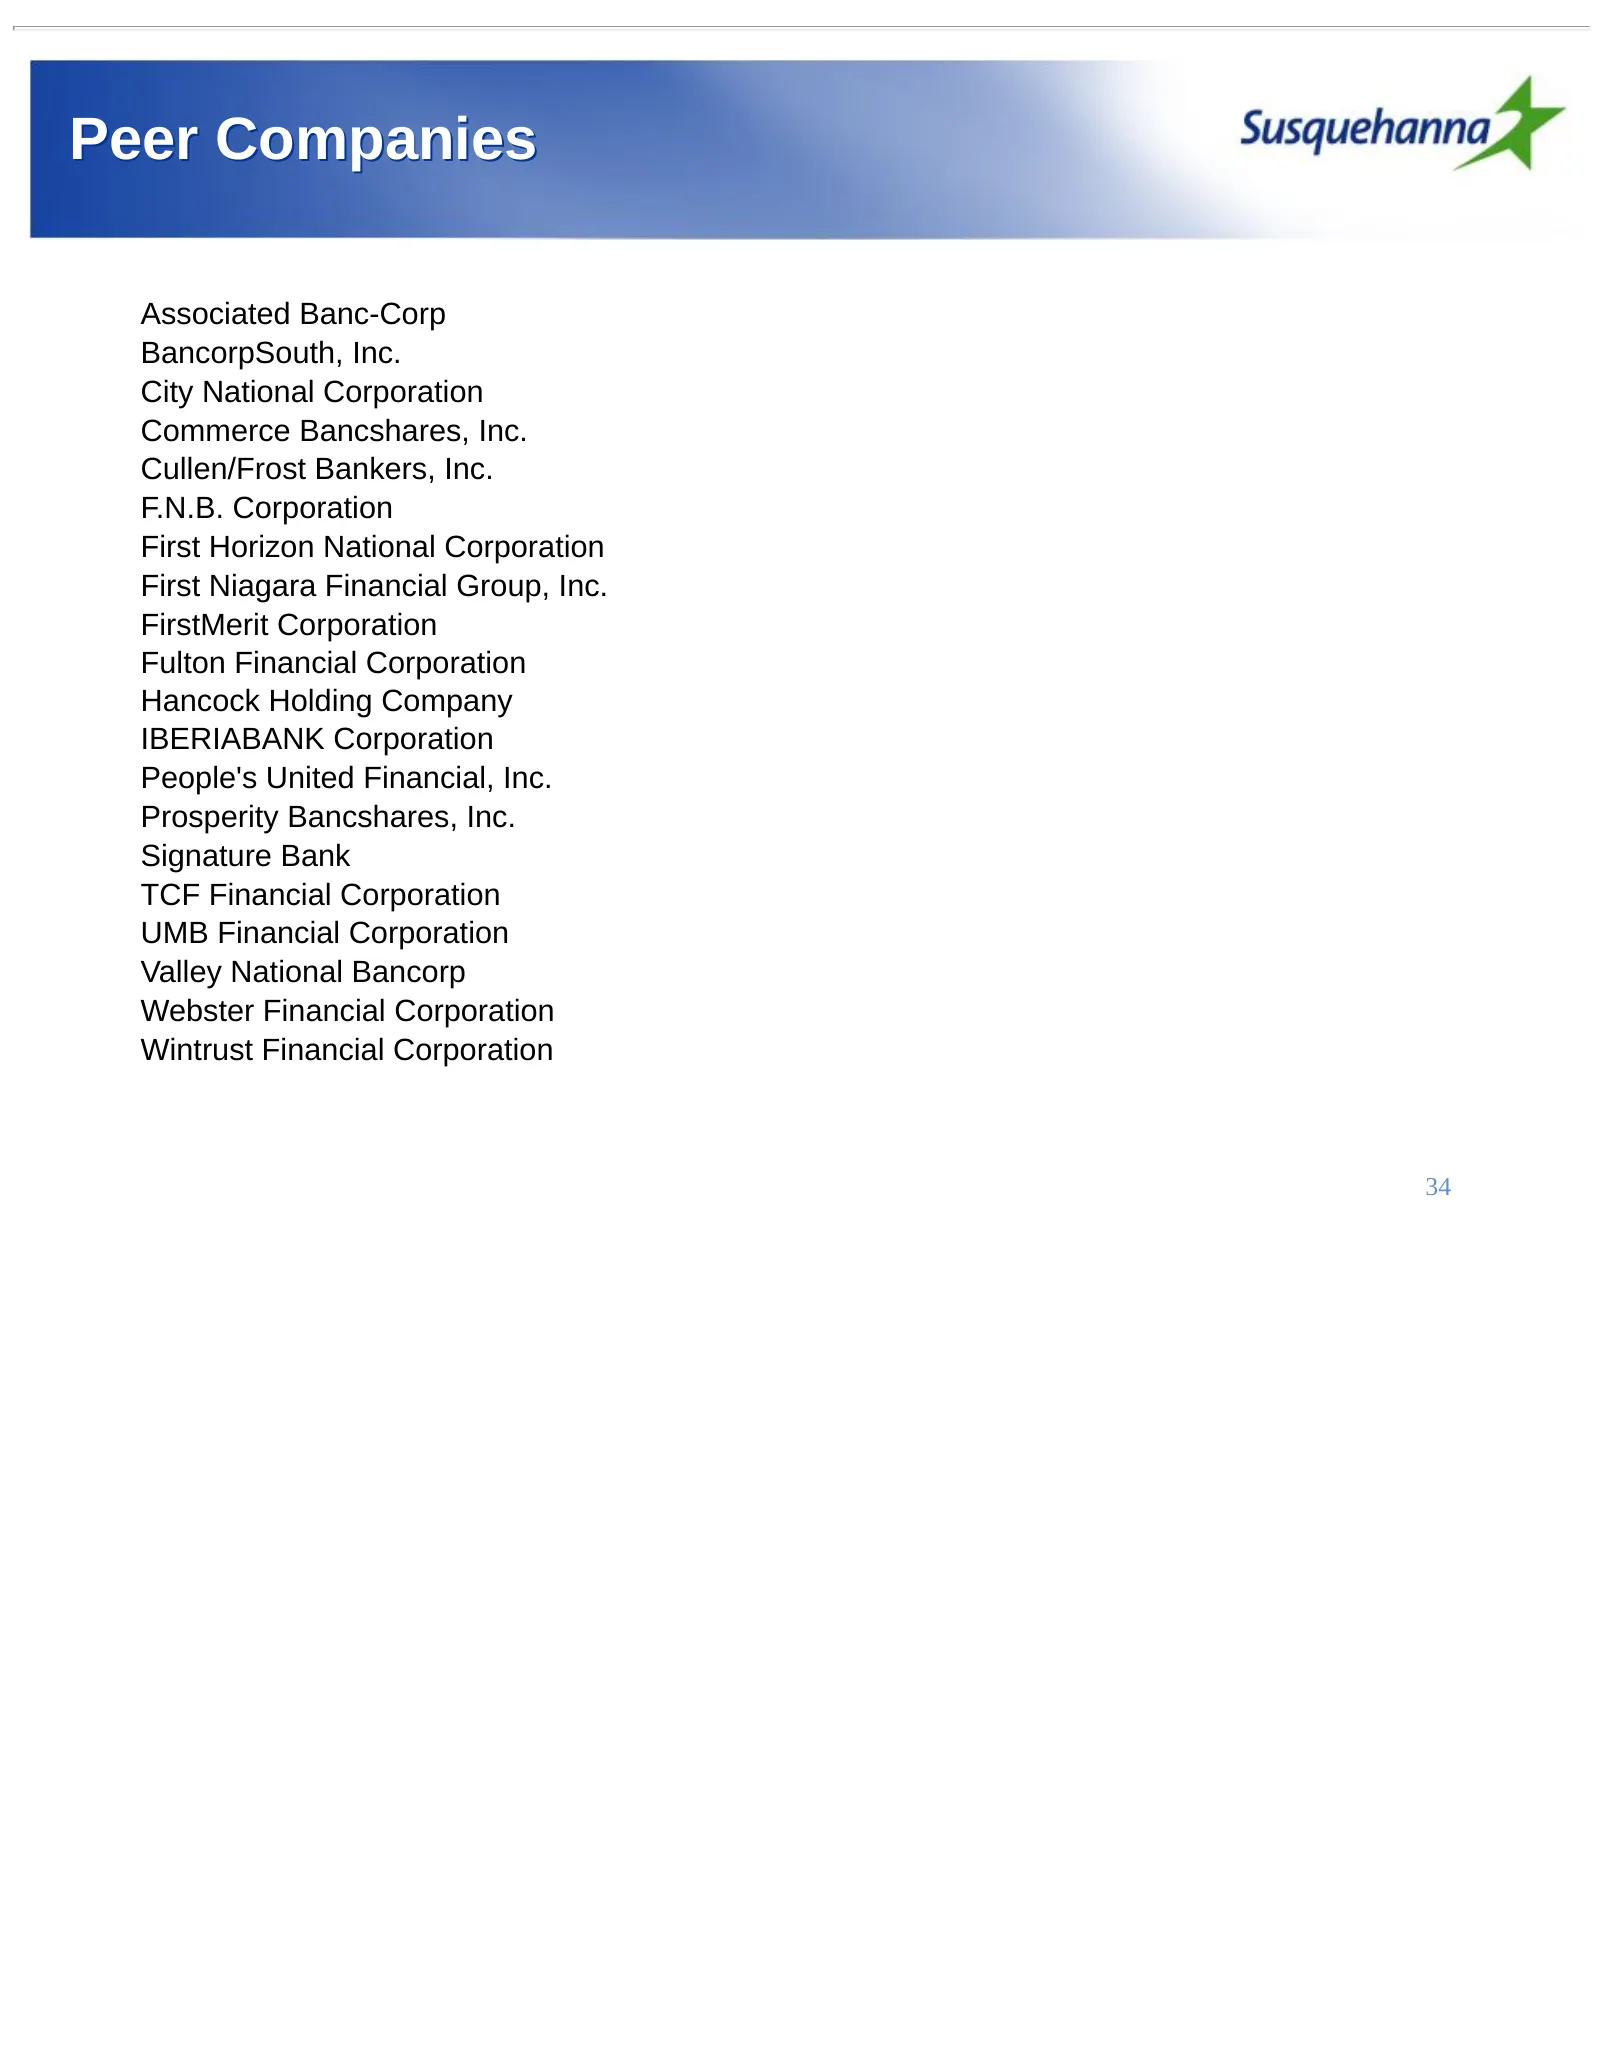
Peer Companies Associated Banc-Corp BancorpSouth, Inc. City National Corporation Commerce Bancshares, Inc. Cullen/Frost Bankers, Inc. F.N.B. Corporation First Horizon National Corporation First Niagara Financial Group, Inc. FirstMerit Corporation Fulton Financial Corporation Hancock Holding Company
Slide 35: Non-GAAP Reconciliation
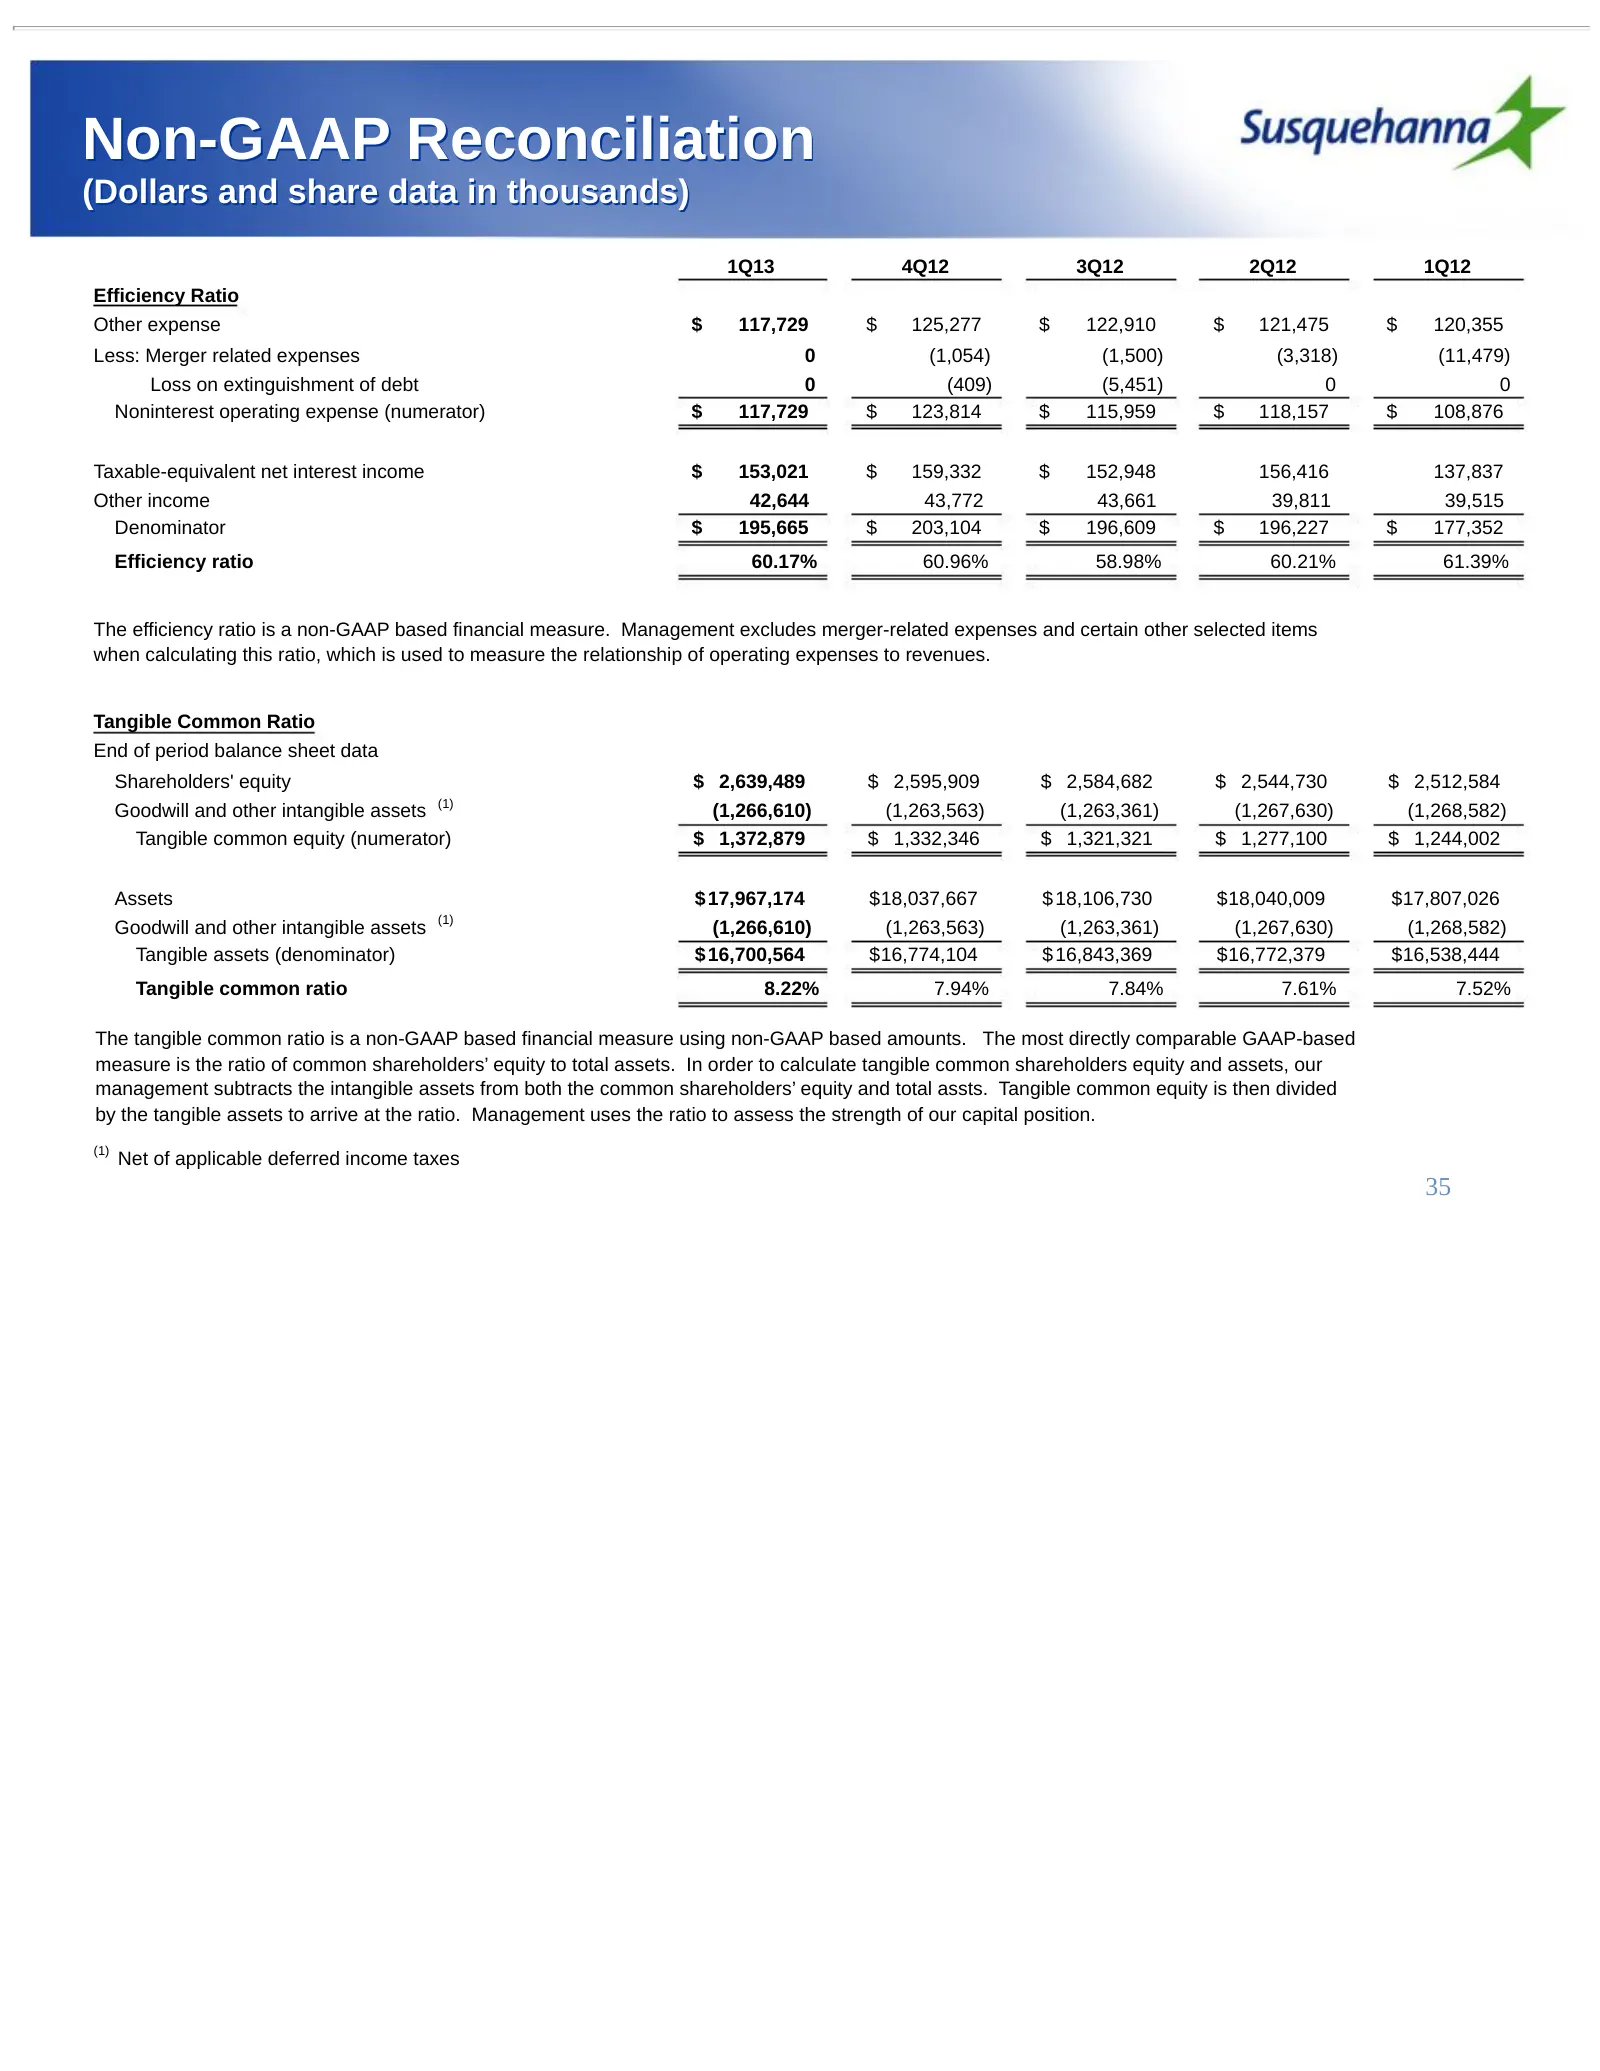
Non-GAAP Reconciliation (Dollars and share data in thousands) 1Q13 4Q12 3Q12 2Q12 1Q12 Efficiency Ratio Other expense $ 117,729 $ 125,277 $ 122,910 $ 121,475 $ 120,355 Less: Merger related expenses 0 (1,054) (1,500) (3,318) (11,479) Loss on extinguishment of debt 0 (409) (5,451) 0 0 Noninterest oper
Slide 36: Non-GAAP Reconciliation
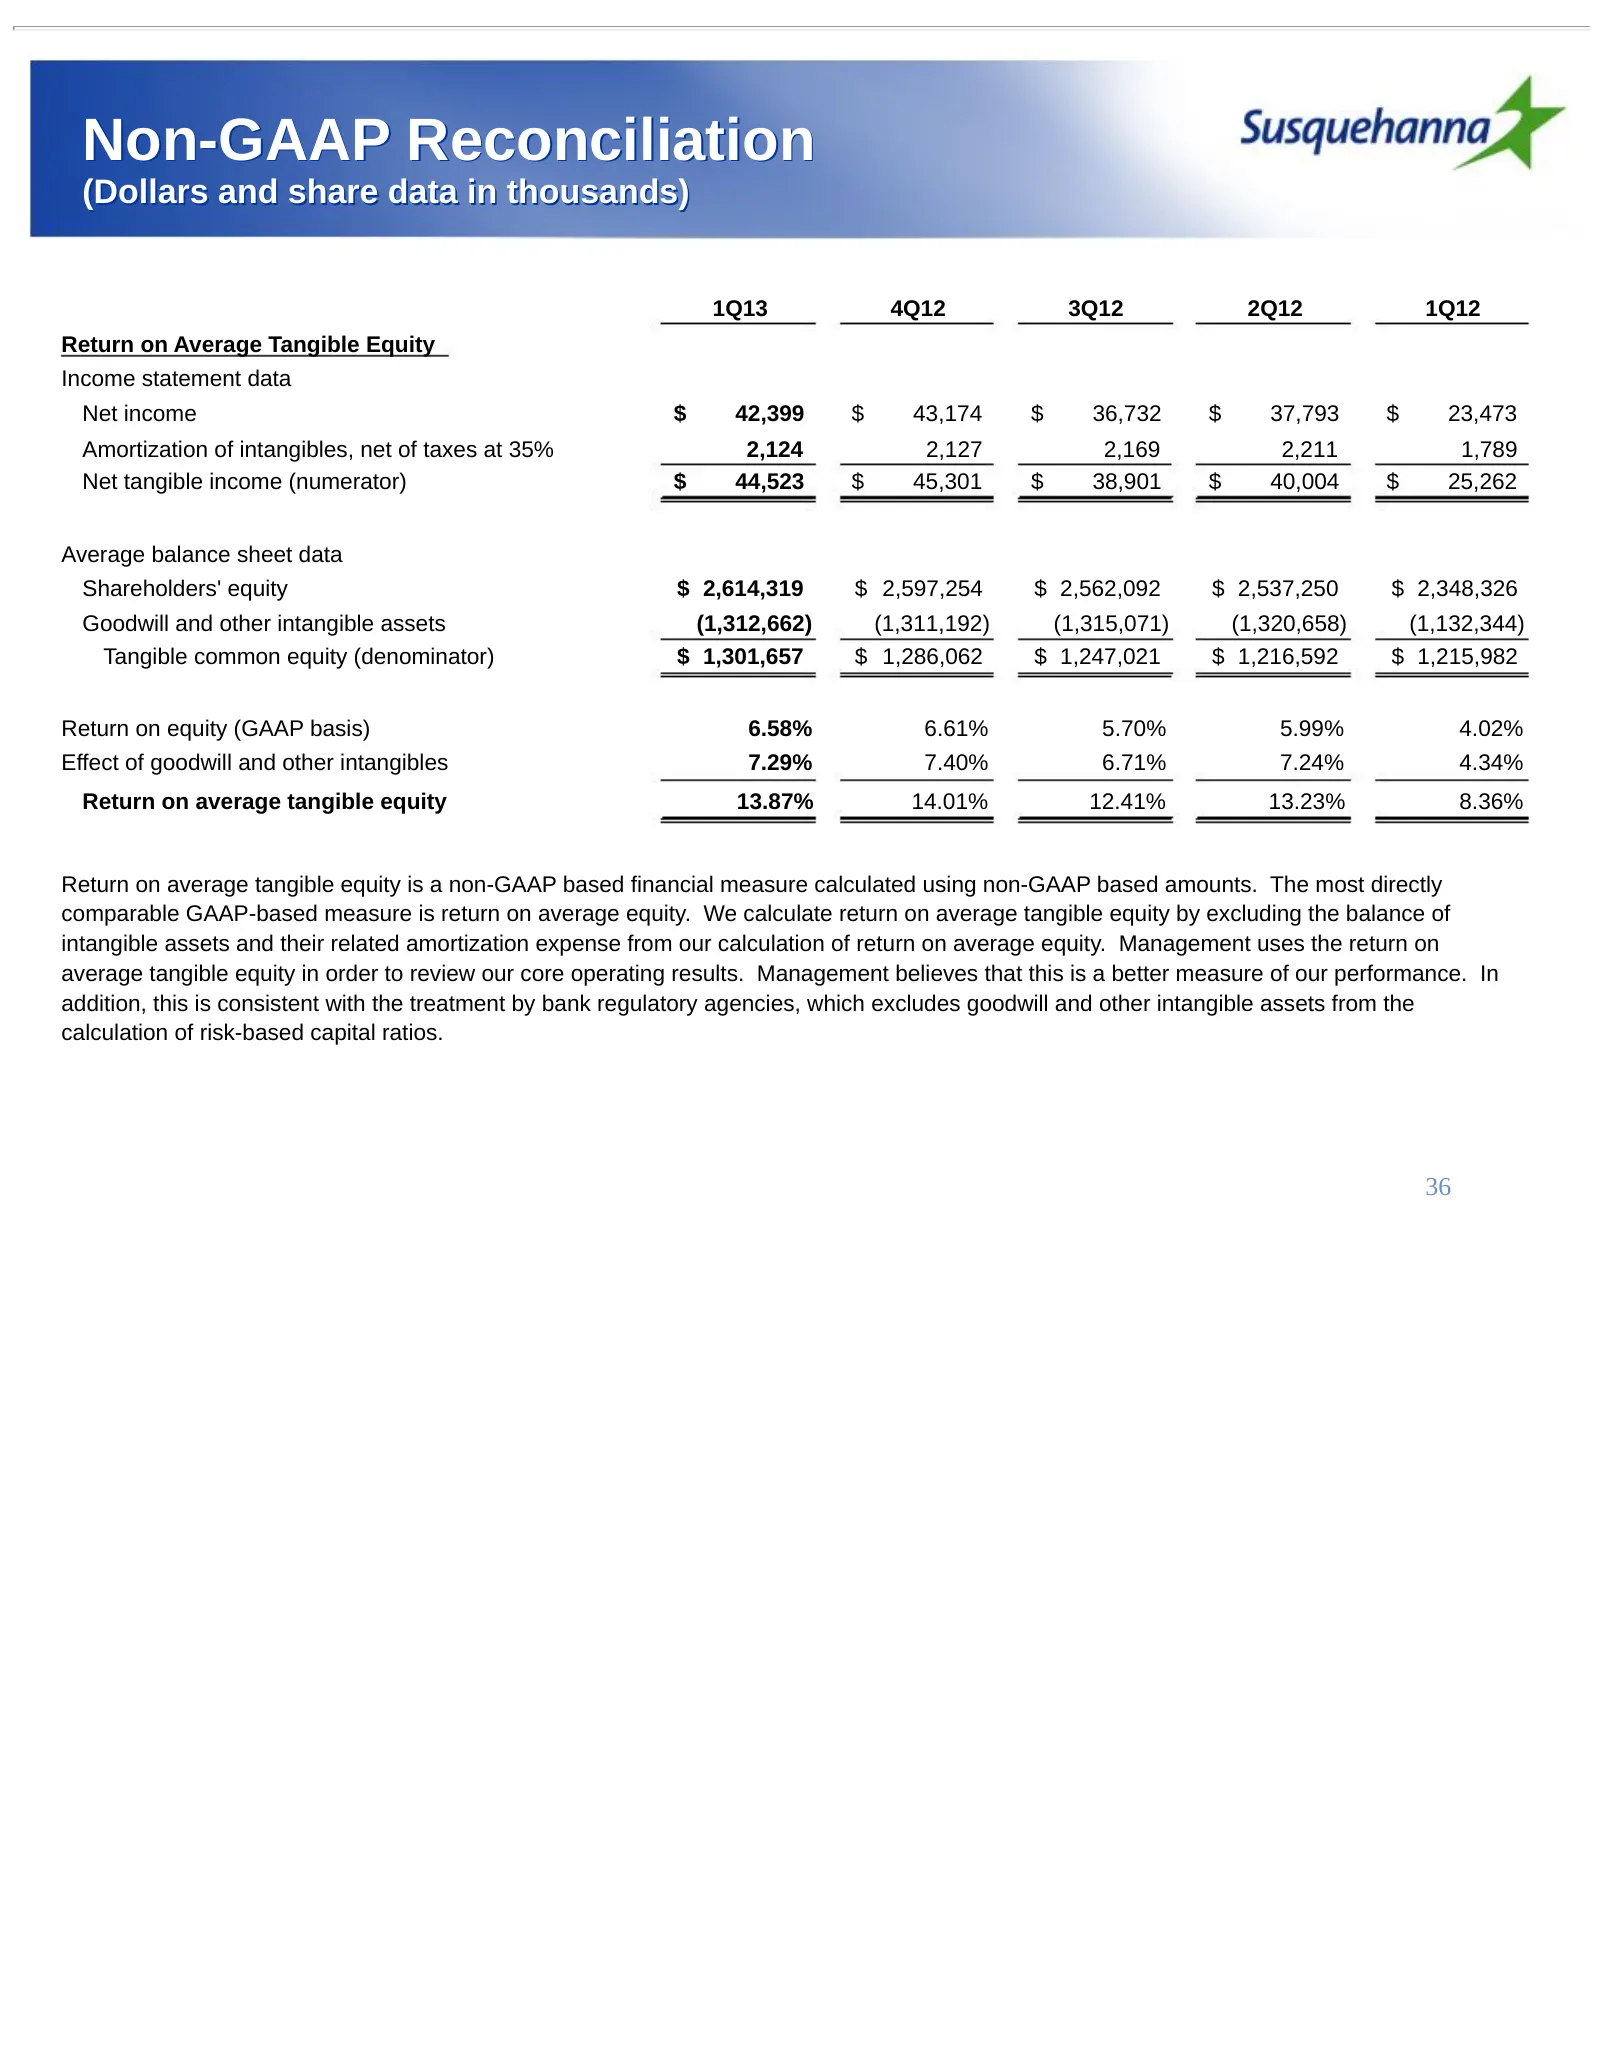
Non-GAAP Reconciliation (Dollars and share data in thousands) 1Q13 4Q12 3Q12 2Q12 1Q12 Return on Average Tangible Equity Income statement data Net income $ 42,399 $ 43,174 $ 36,732 $ 37,793 $ 23,473 Amortization of intangibles, net of taxes at 35% 2,124 2,127 2,169 2,211 1,789 Net tangible income (n
Source: SEC EDGAR · 8-K filed May 9, 2013
More decks from Susquehanna Bancshares Inc
 Investor Presentation (December 2014)51 slides · Dec 3, 2014
 Merger or Acquisition (November 2014)28 slides · Nov 17, 2014
 Merger or Acquisition (November 2014)13 slides · Nov 12, 2014
 Q2 2014 Earnings Presentation46 slides · Aug 11, 2014
 Investor Presentation (May 2014)44 slides · May 5, 2014
 Shareholder Meeting (May 2014)35 slides · May 2, 2014