Bob Evans Farms — CL King Best Ideas Investor Conference 2015
44 slides from Bob Evans Farms's conference presentation, Sep 10, 2015
Slide 1: Investor Presentation, CL King Best Ideas Investor Conference
Exhibit 99.1 Investor CL New September Mark 1Scott King York Taggart, Hood, Presentation Best 10, Chief Ideas VP, 2015 Investor Financial Conference Relations Officer 2015
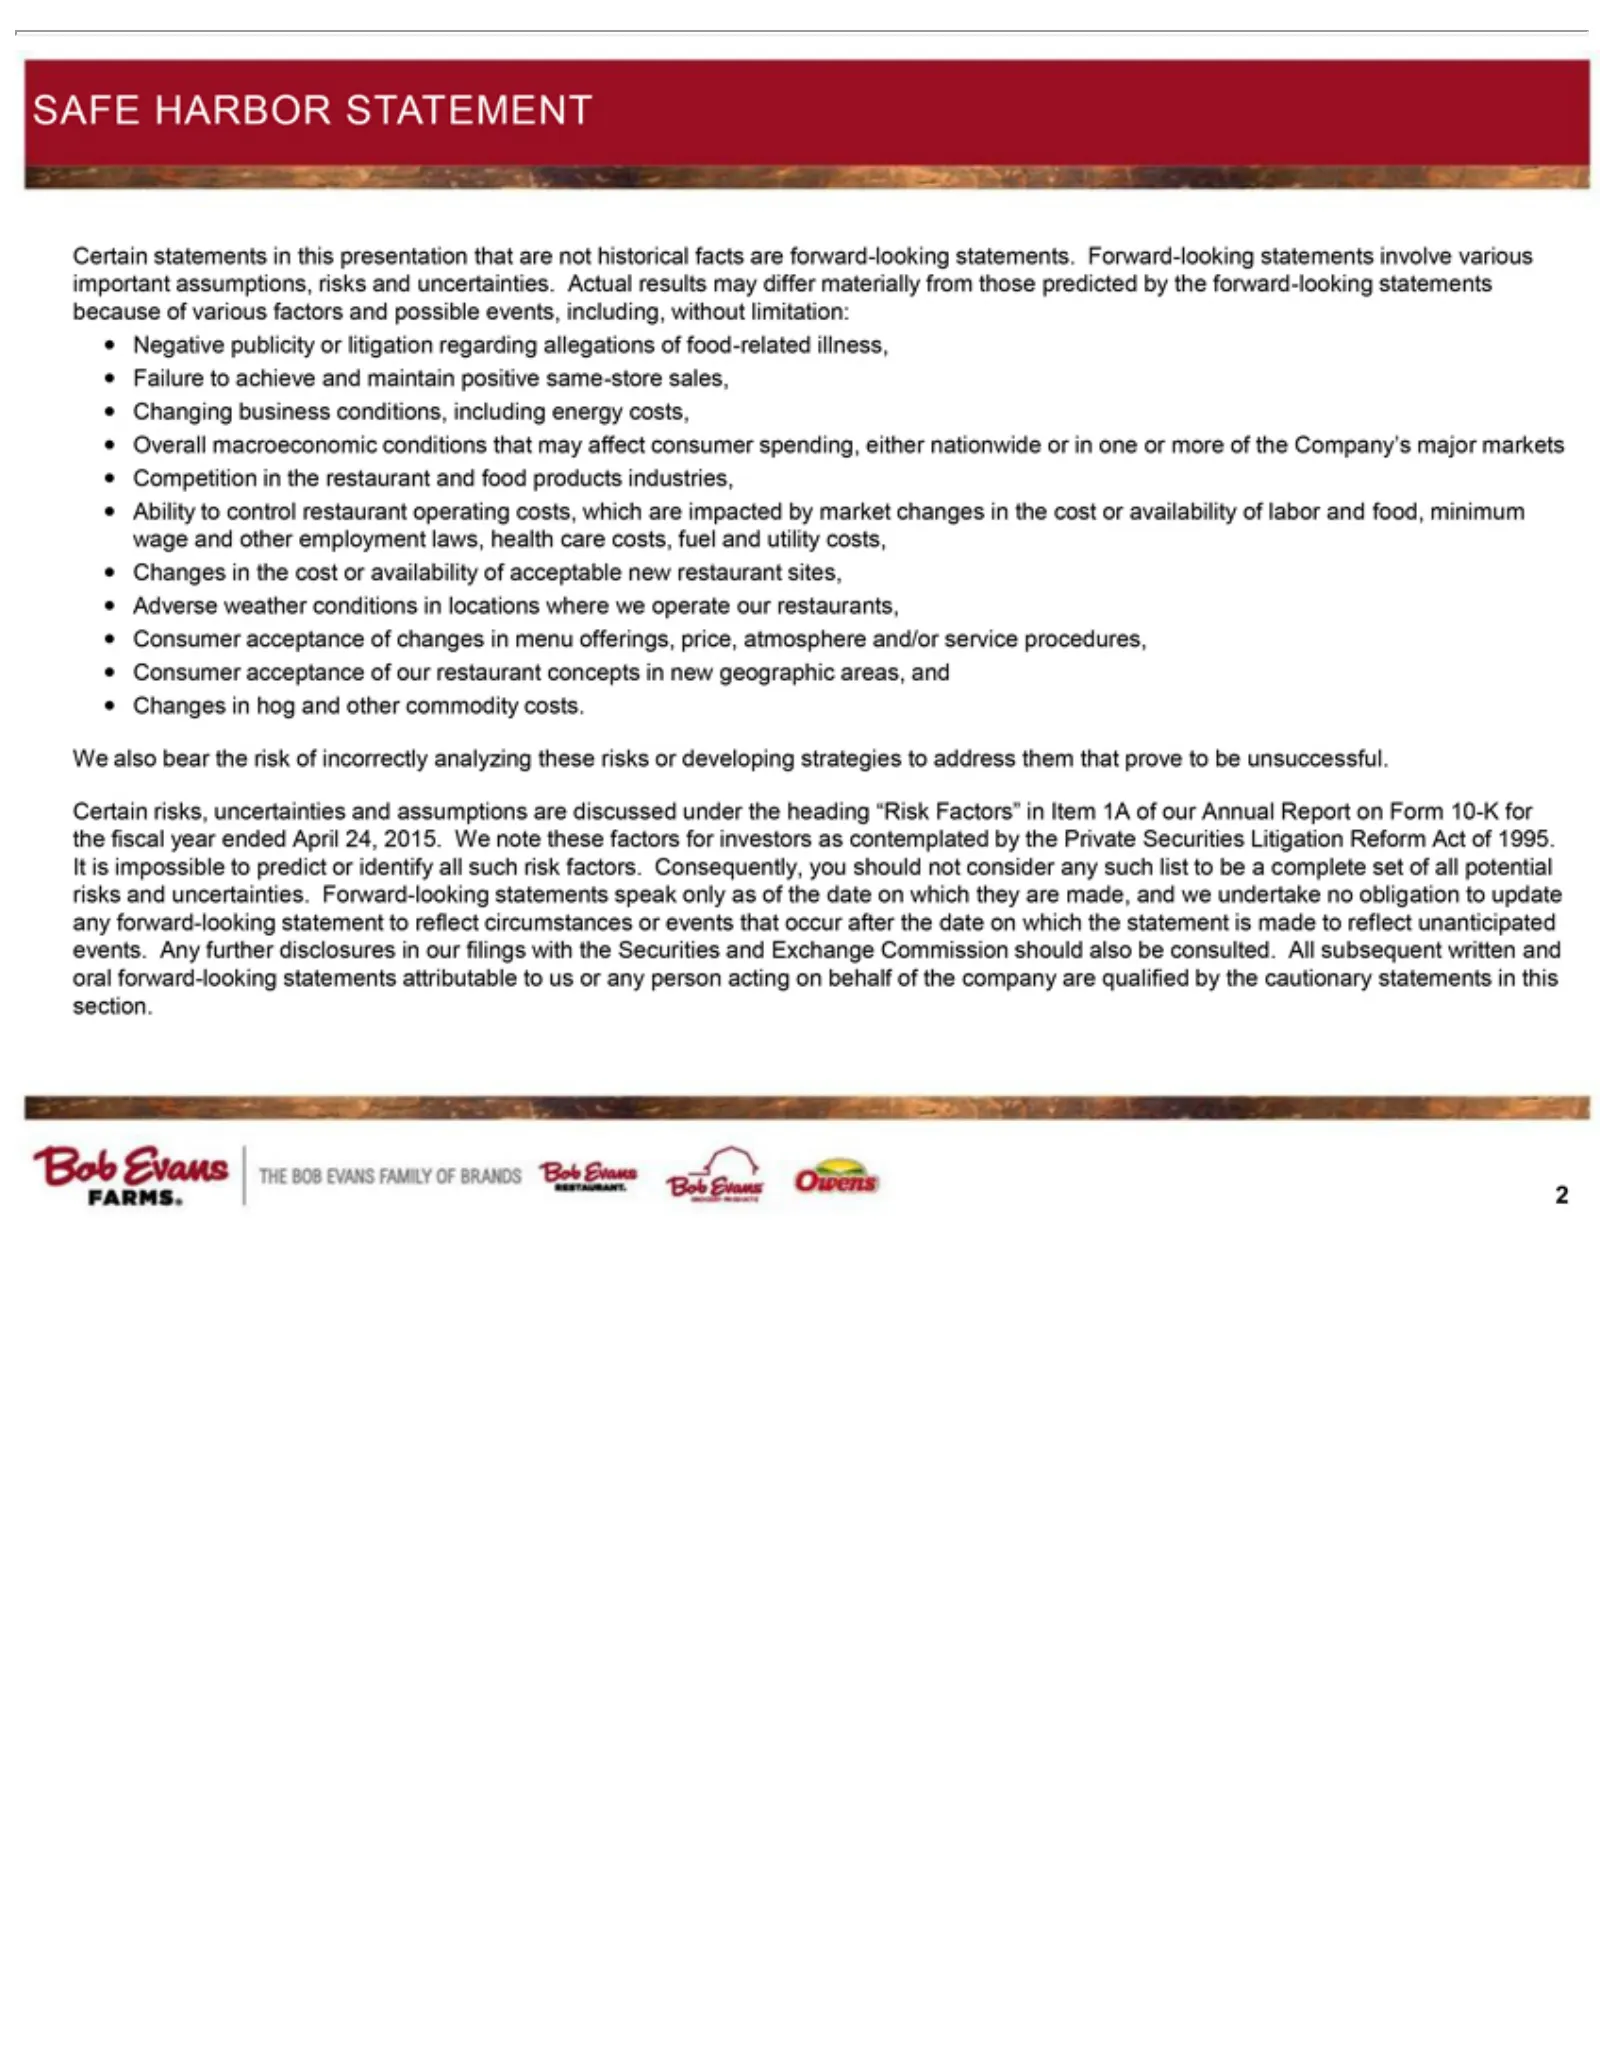
Slide 2: Safe Harbor Statement
Safealso may Negative Failure Changing Overall Competition Ability costs, Adverse Consumer Changes We Certain investors complete reflect 2should differ Harbor circumstances also to statements risks, macroeconomic bear weather in publicity as set achieve control business acceptance materially the hog
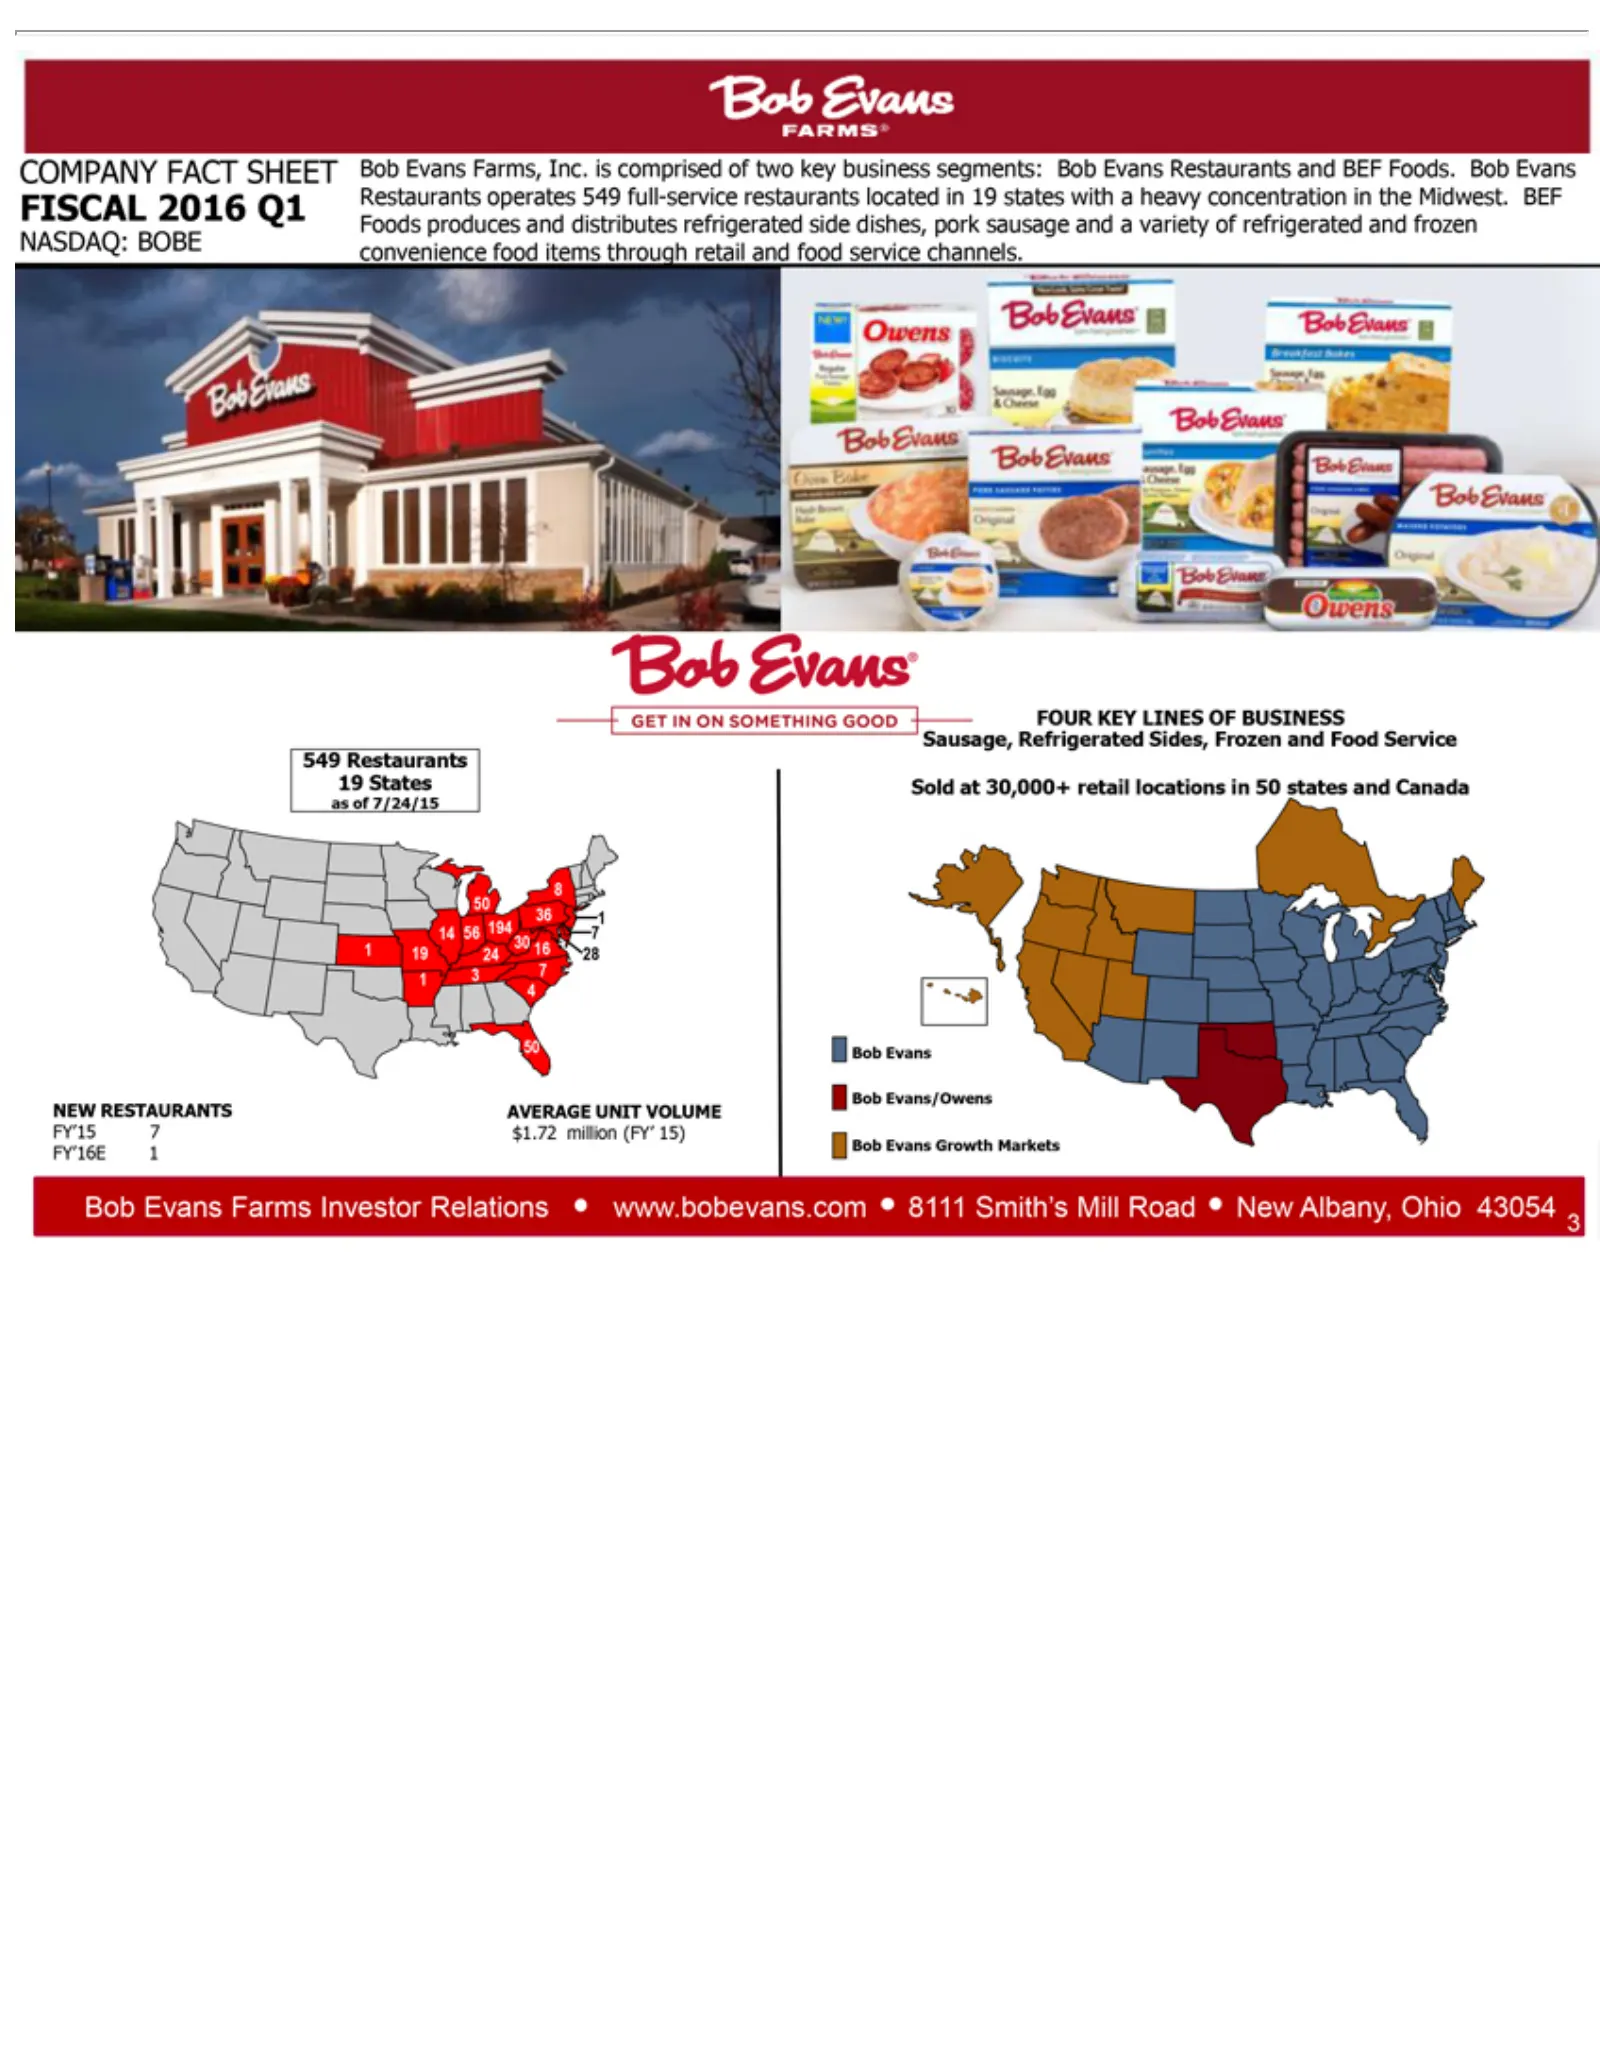
Slide 3: Company Key Fact Sheet
COMPANY concentration FOUR channels. Sold 549 as NEW FY’15 FY’16E AVERAGE $1.72 3Bob ofRestaurants Evans/Owens Evans at 7/24/15 million RESTAURANTS 7KEY 30,000+ 1 Farms Farms, Growth UNIT FACT LINES (FY’ in retail 19 the Investor VOLUME Inc. 15) SHEET States Markets Midwest. OFlocations isBUSINESS c
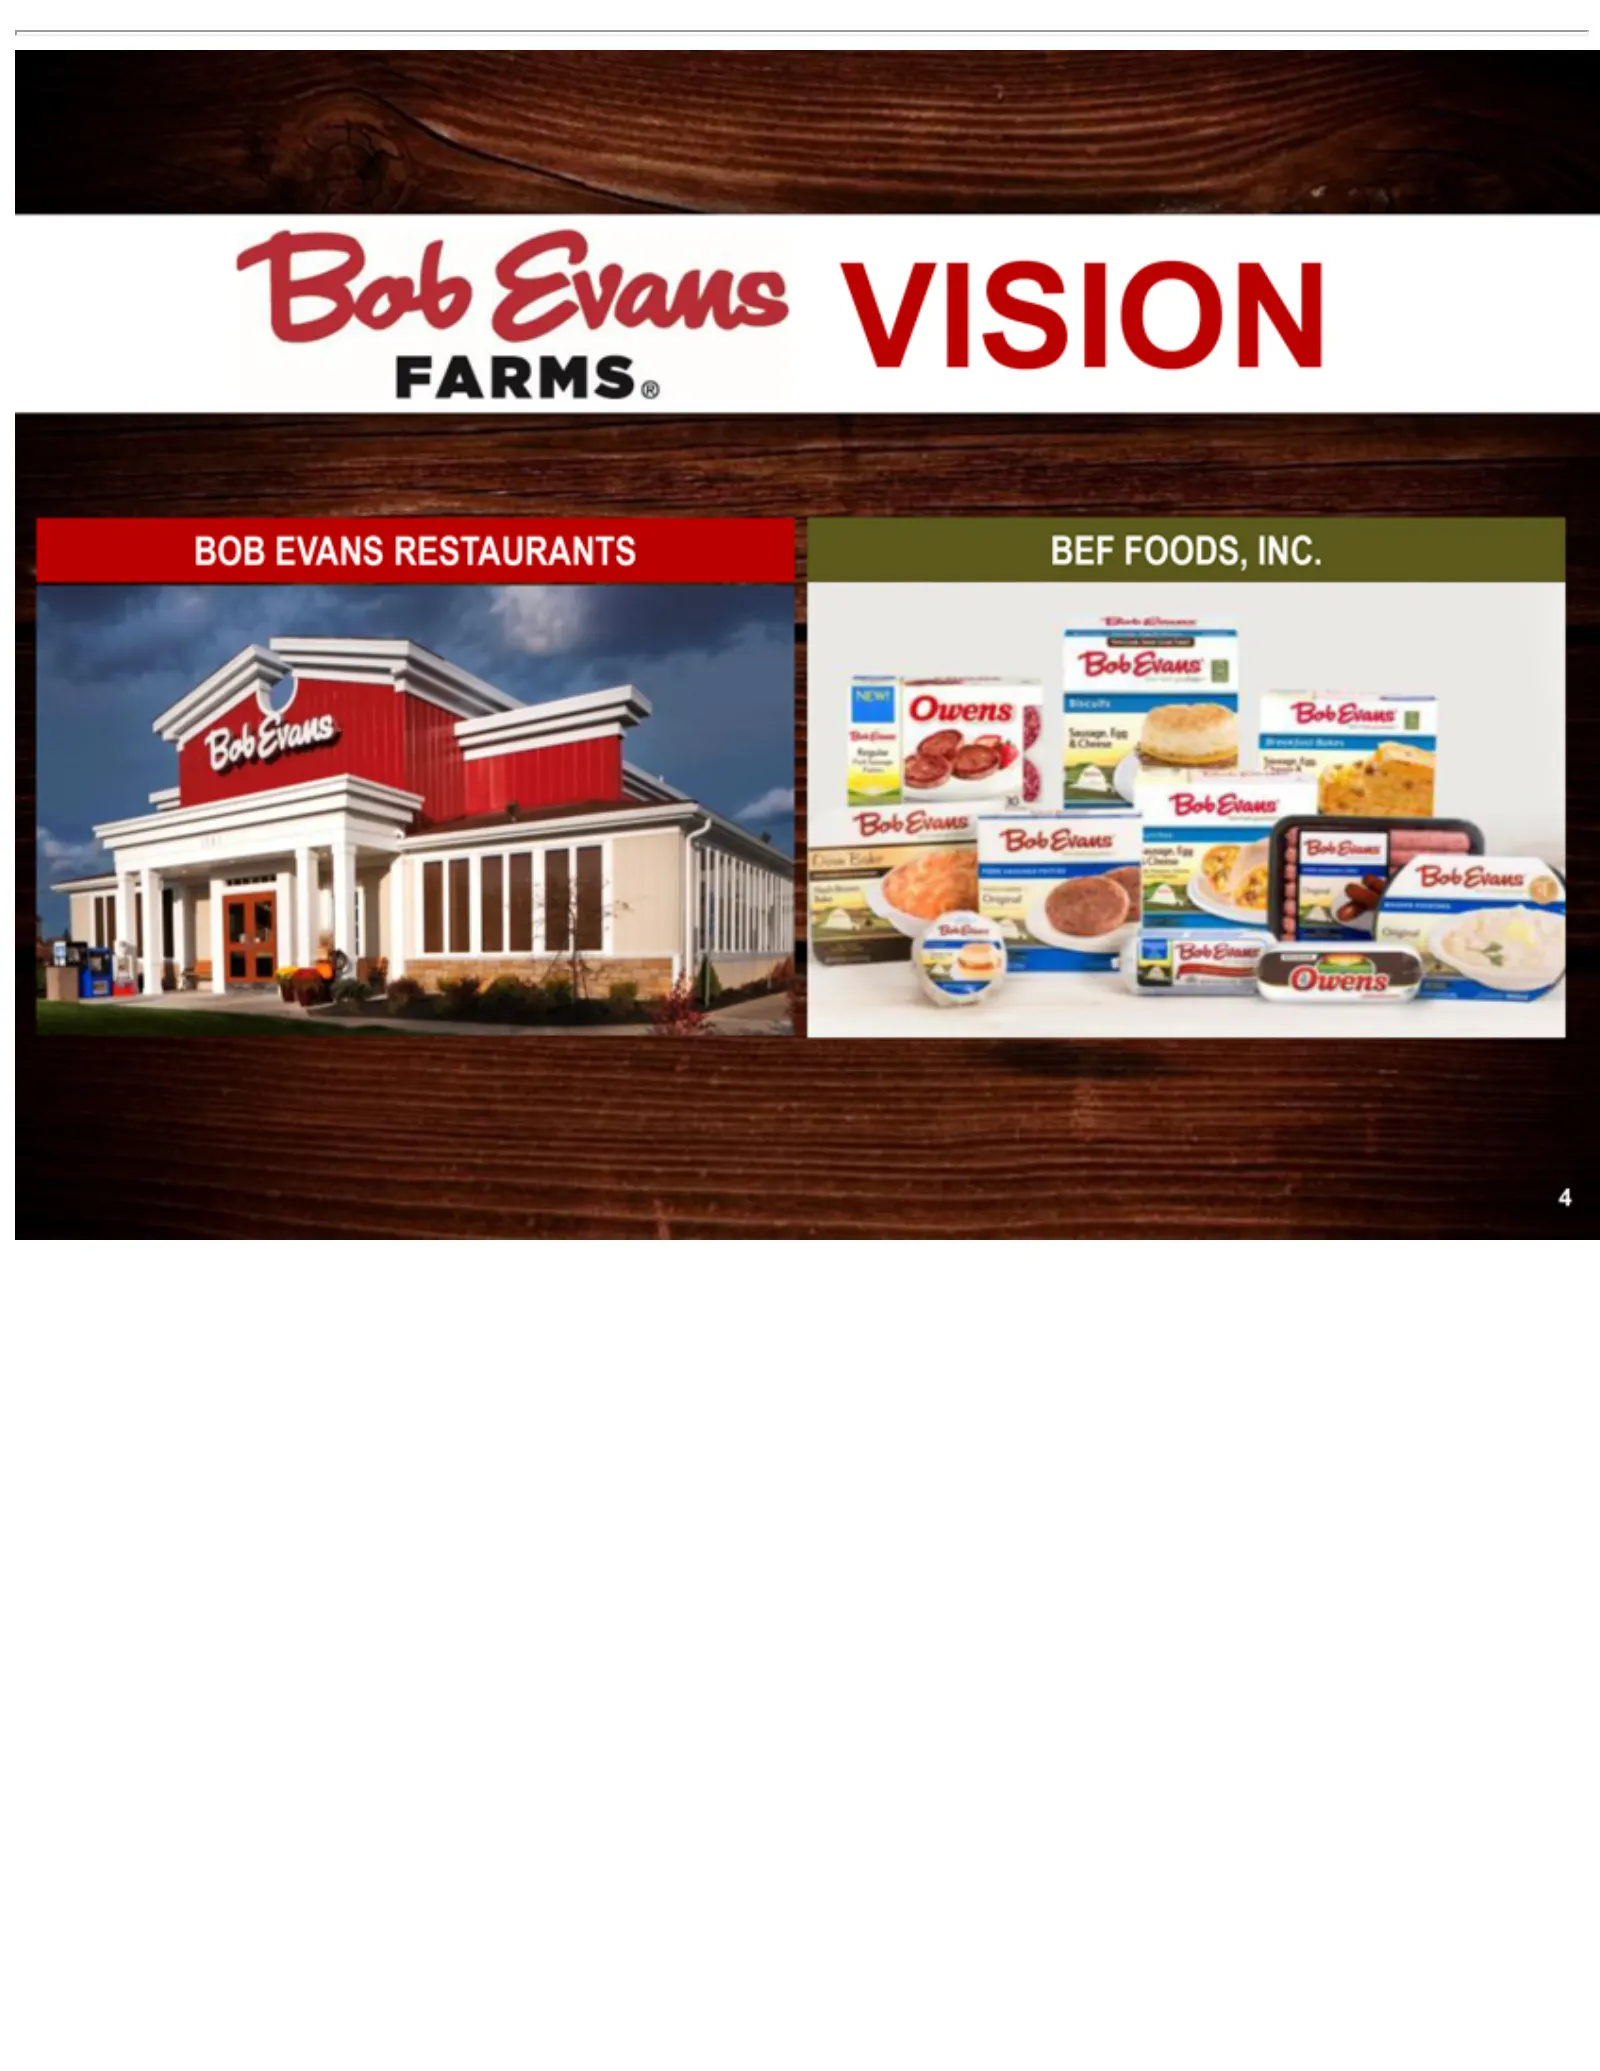
Slide 4: Bob Evans Farms, Inc. Vision
BOBFOODS, VISION 4BEF EVANS RESTAURANTS INC.
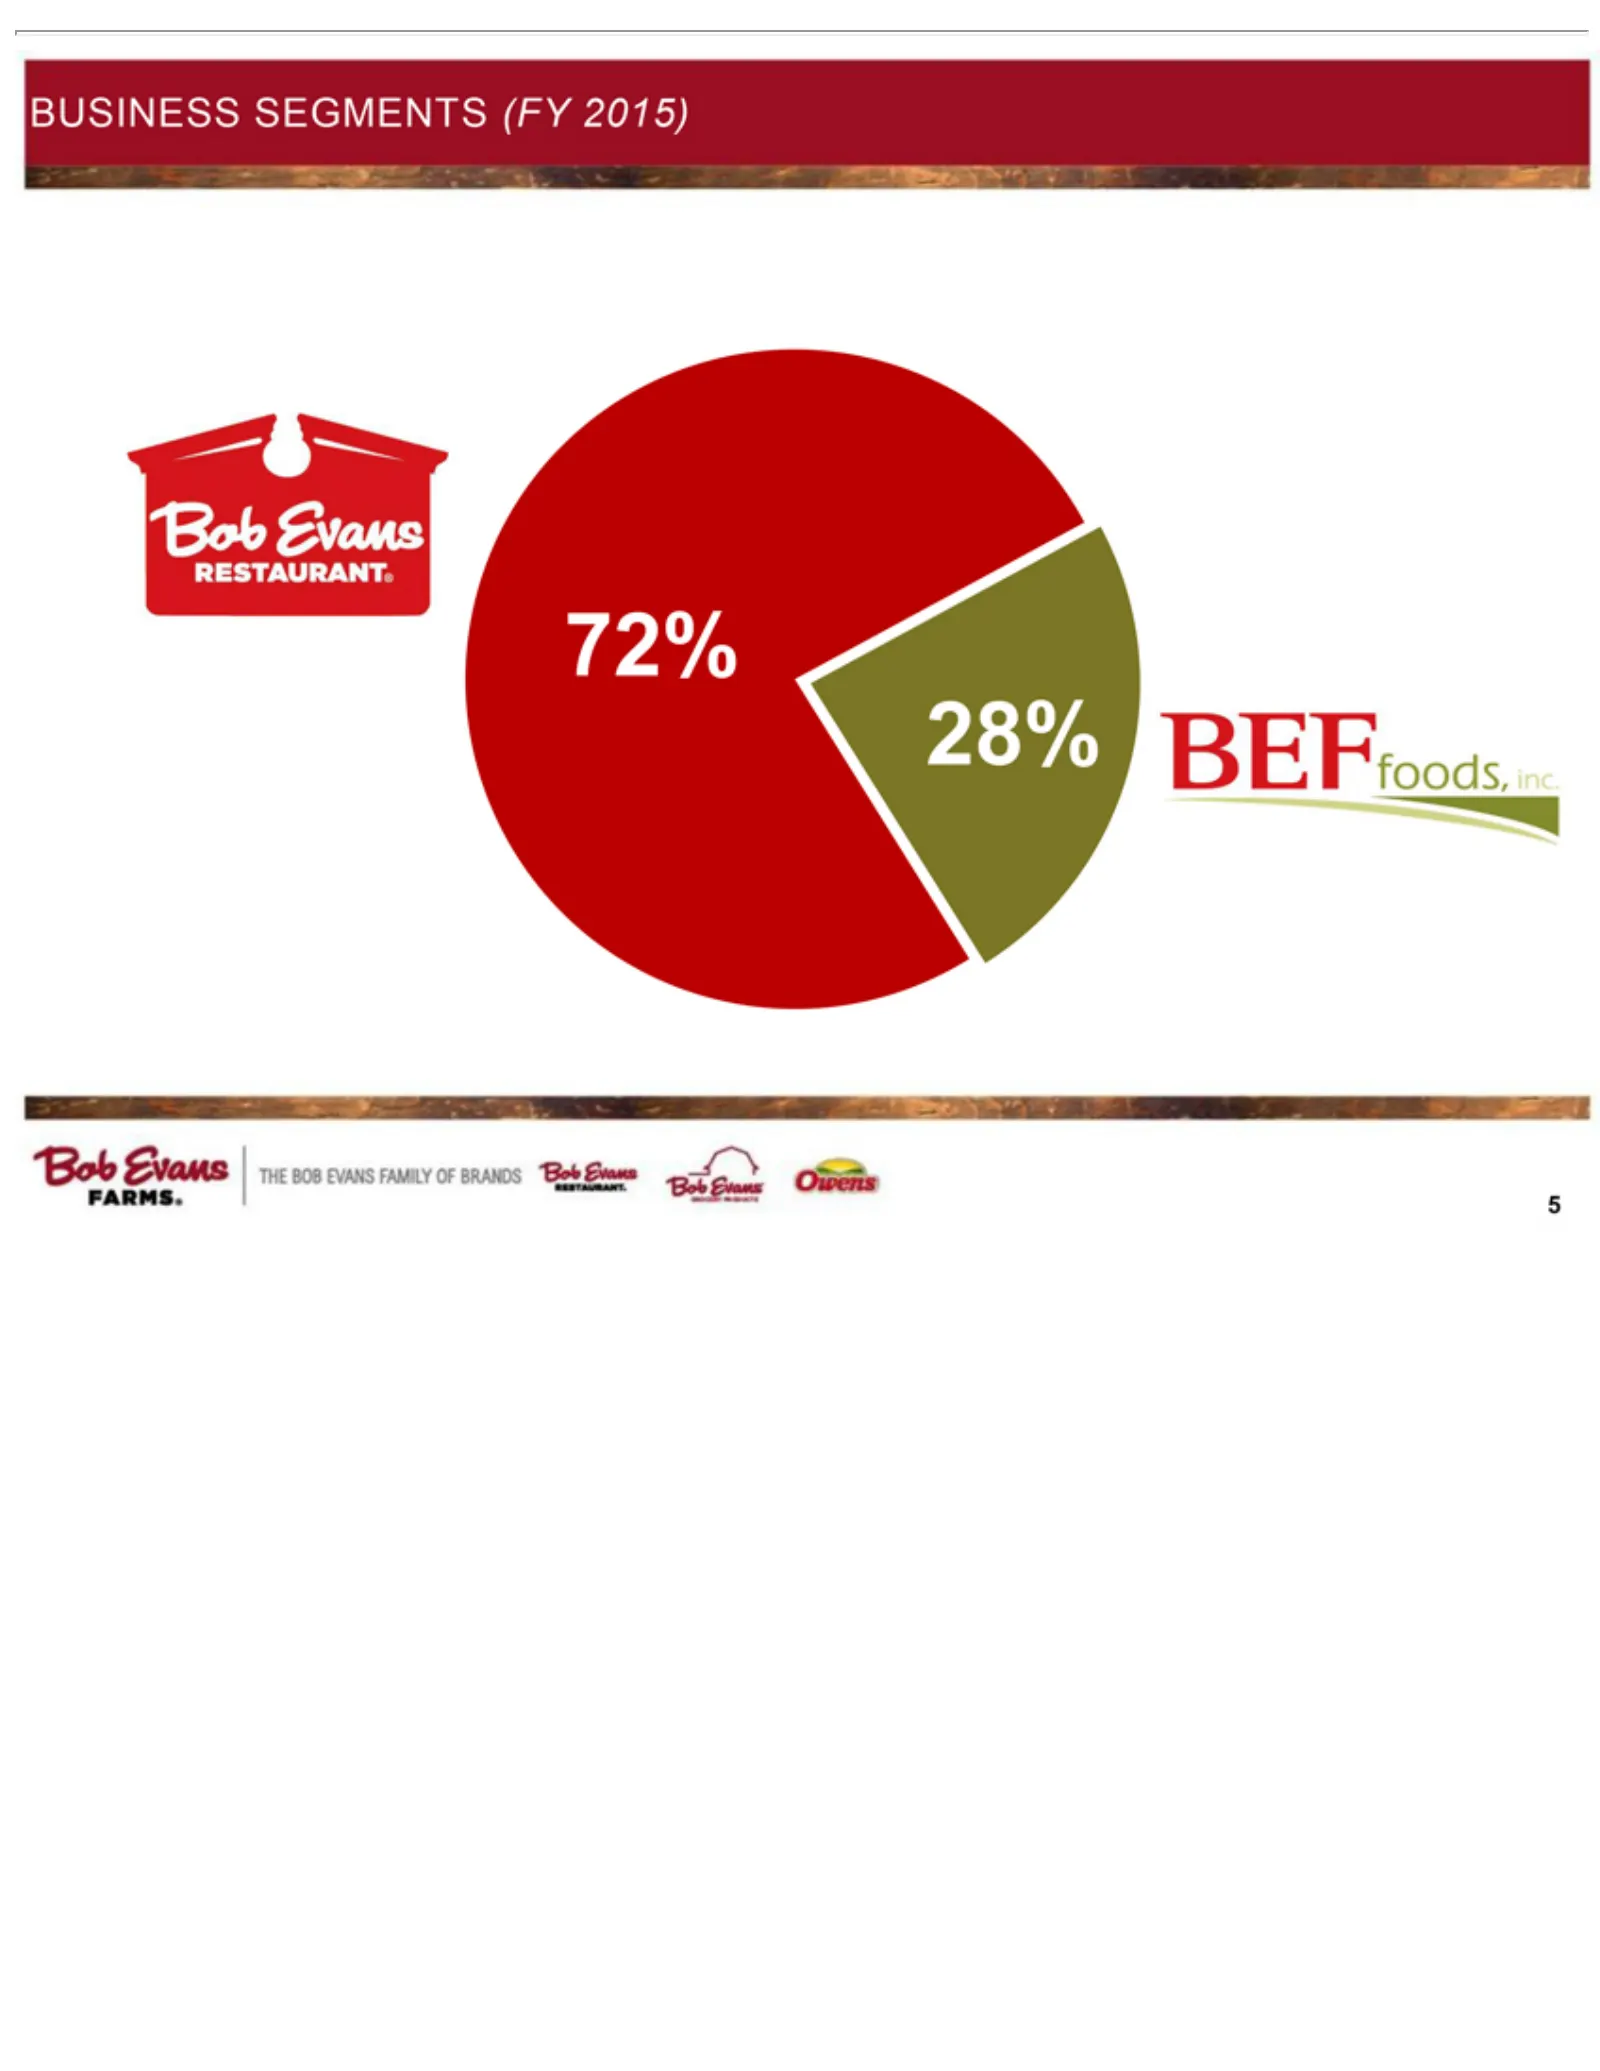
Slide 5: Two Business Segments (FY 2015)
5Business Segments (FY 2015) 28% 72%
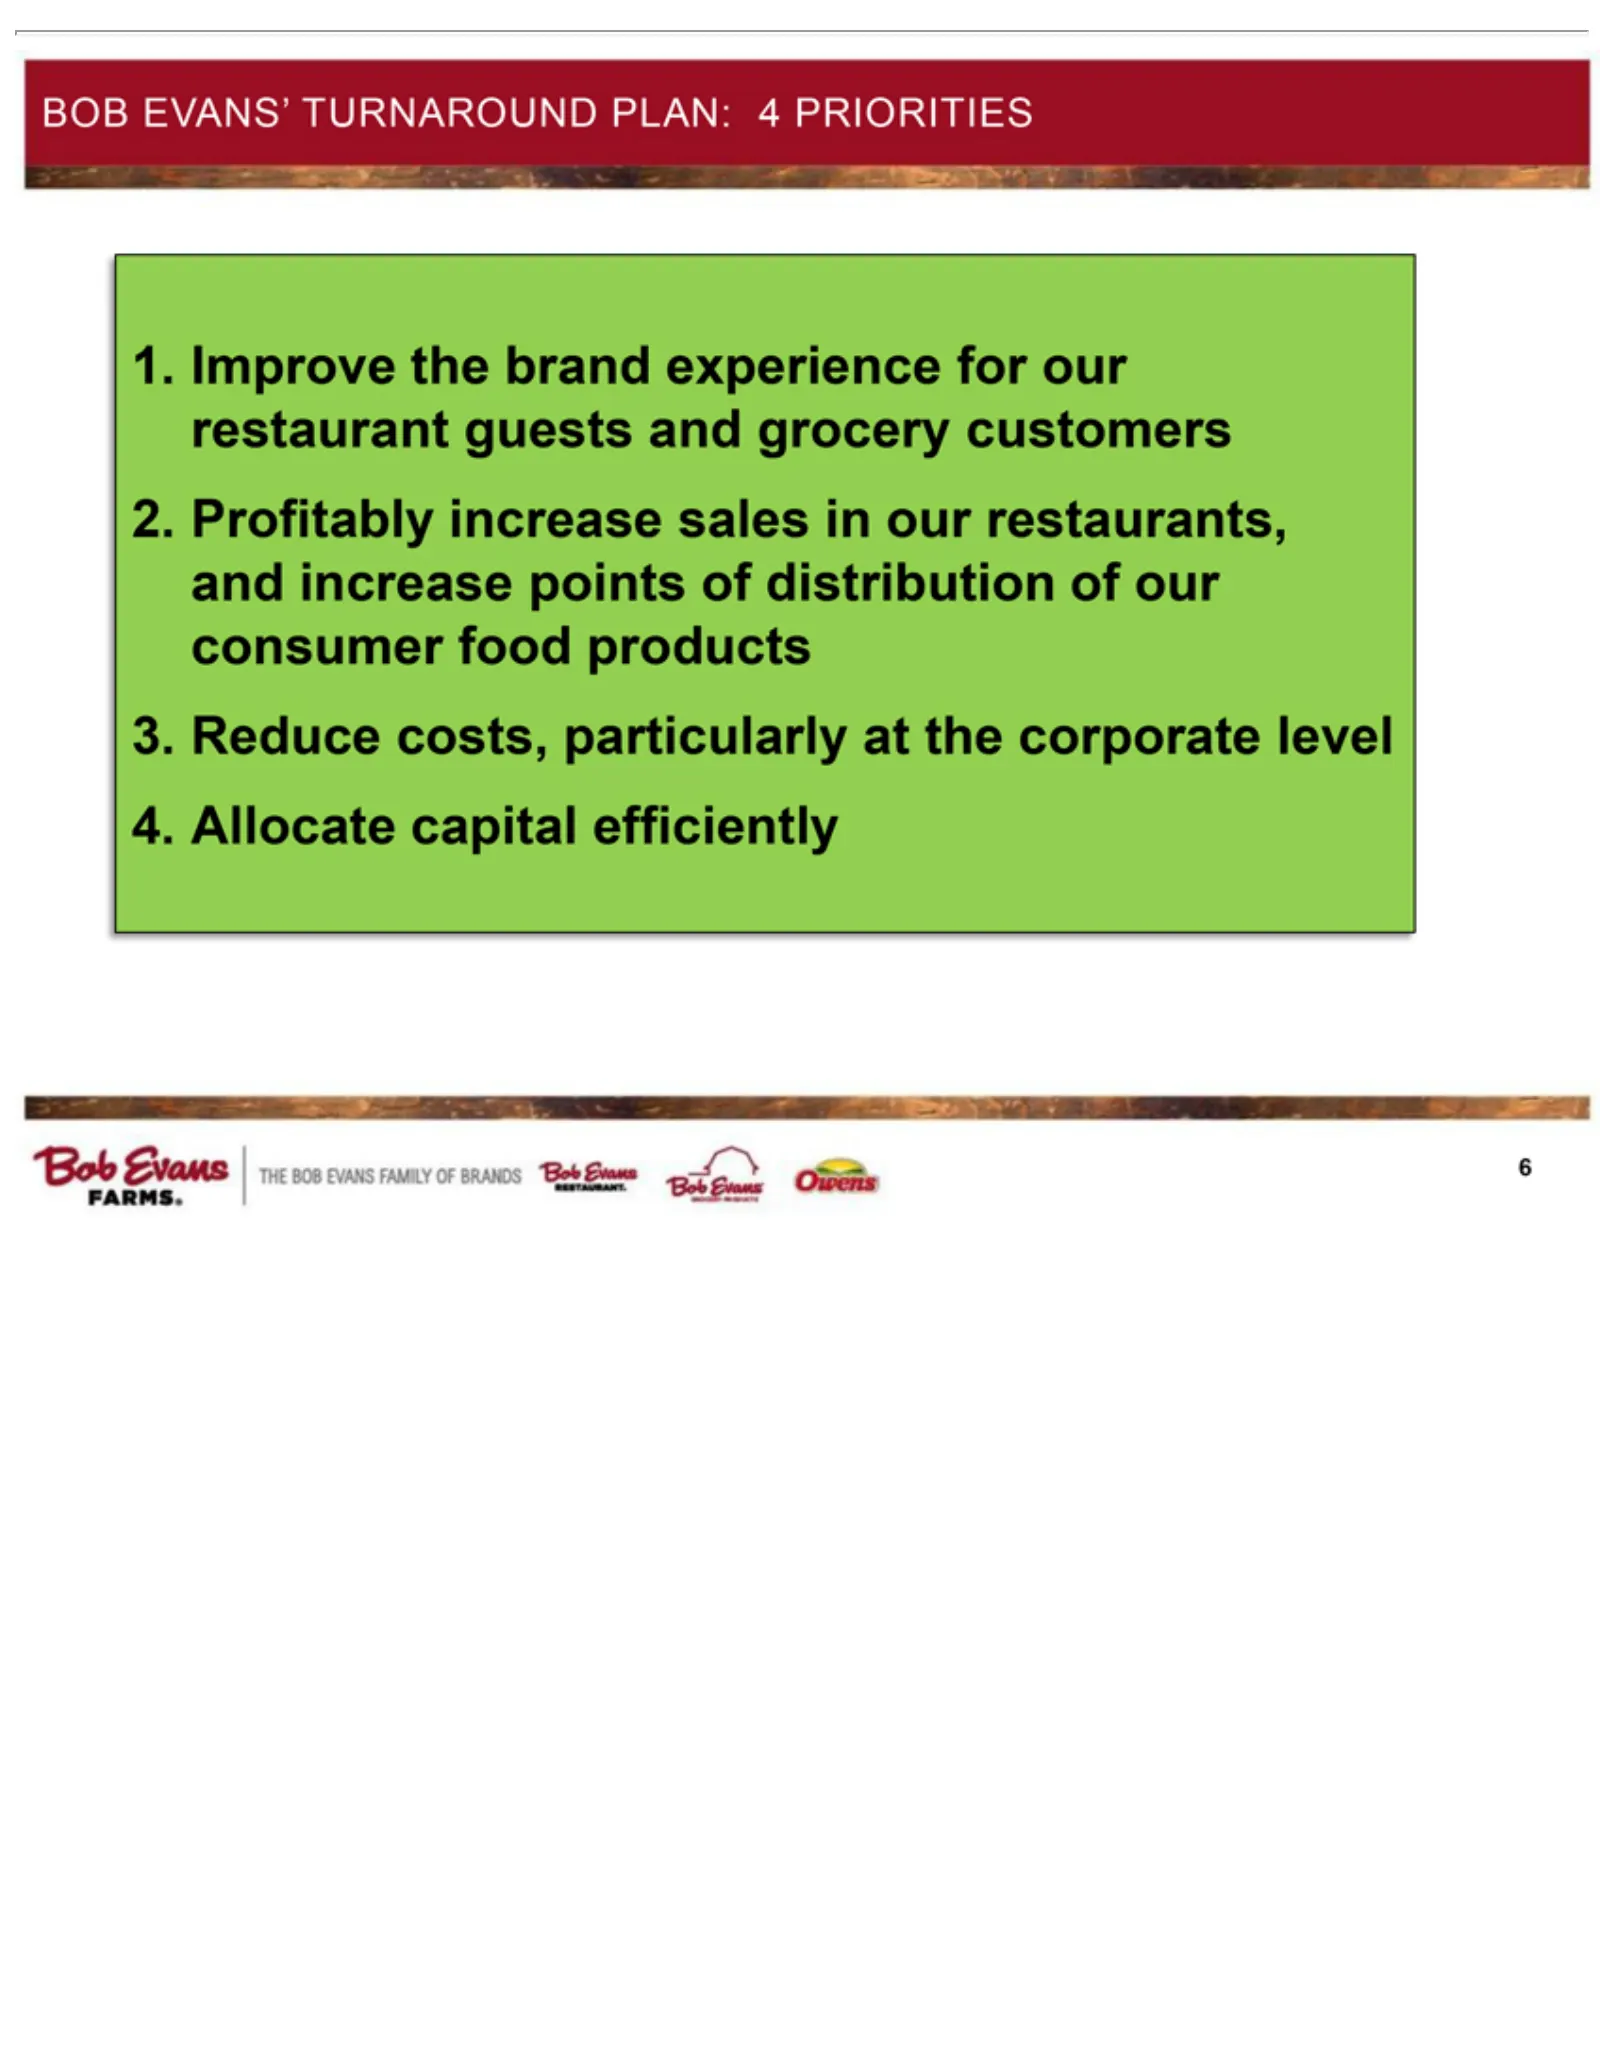
Slide 6: Bob Evans' Turnaround Plan: 4 Priorities
BOB 1. 2. 3. 64. Allocate Improve Profitably Reduce EVANS’ costs, capital the increase TURNAROUND brand particularly efficiently experience sales inatour the for PLAN: restaurants, corporate our restaurant 4 PRIORITIES level and increase guests and points grocery of distribution customers of our con
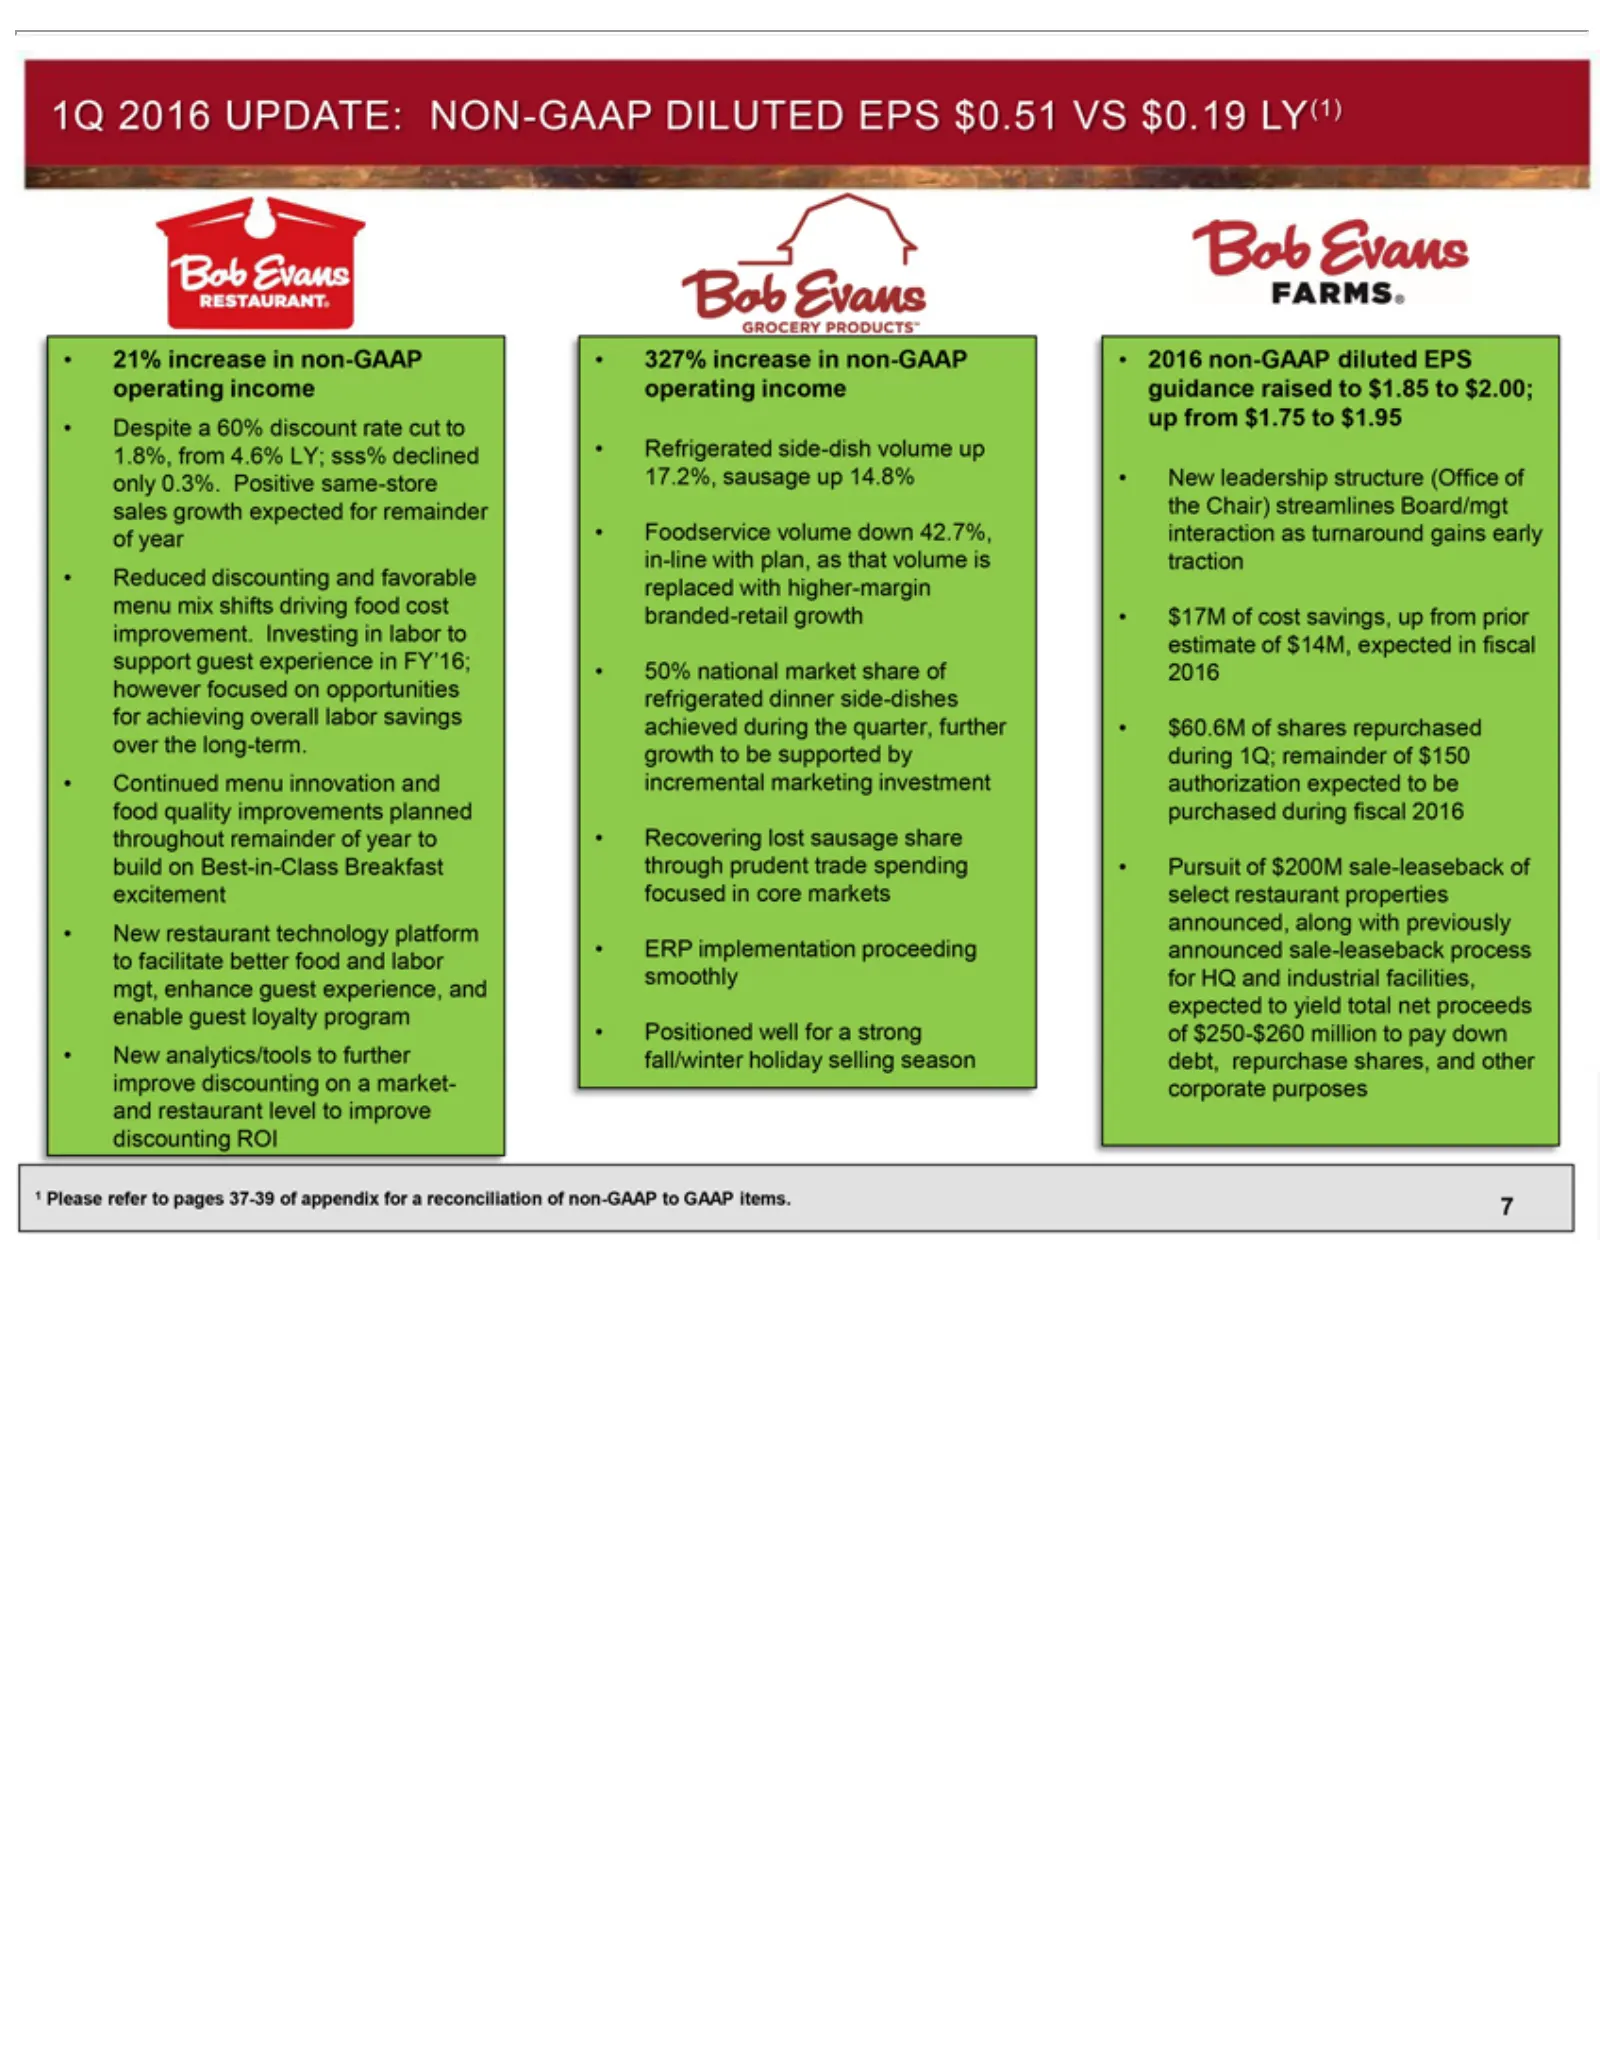
Slide 7: 1Q FY2016 Update
1Q$200M 21% Despite Reduced savings Continued New 327% branded-retail share 2016 $17M of 71million 2016 increase restaurant analytics/tools non-GAAP through increase ofto over aPlease UPDATE: cost discounting 60% pay sale-leaseback menu the savings, in prudent growth down discount in refer technolog
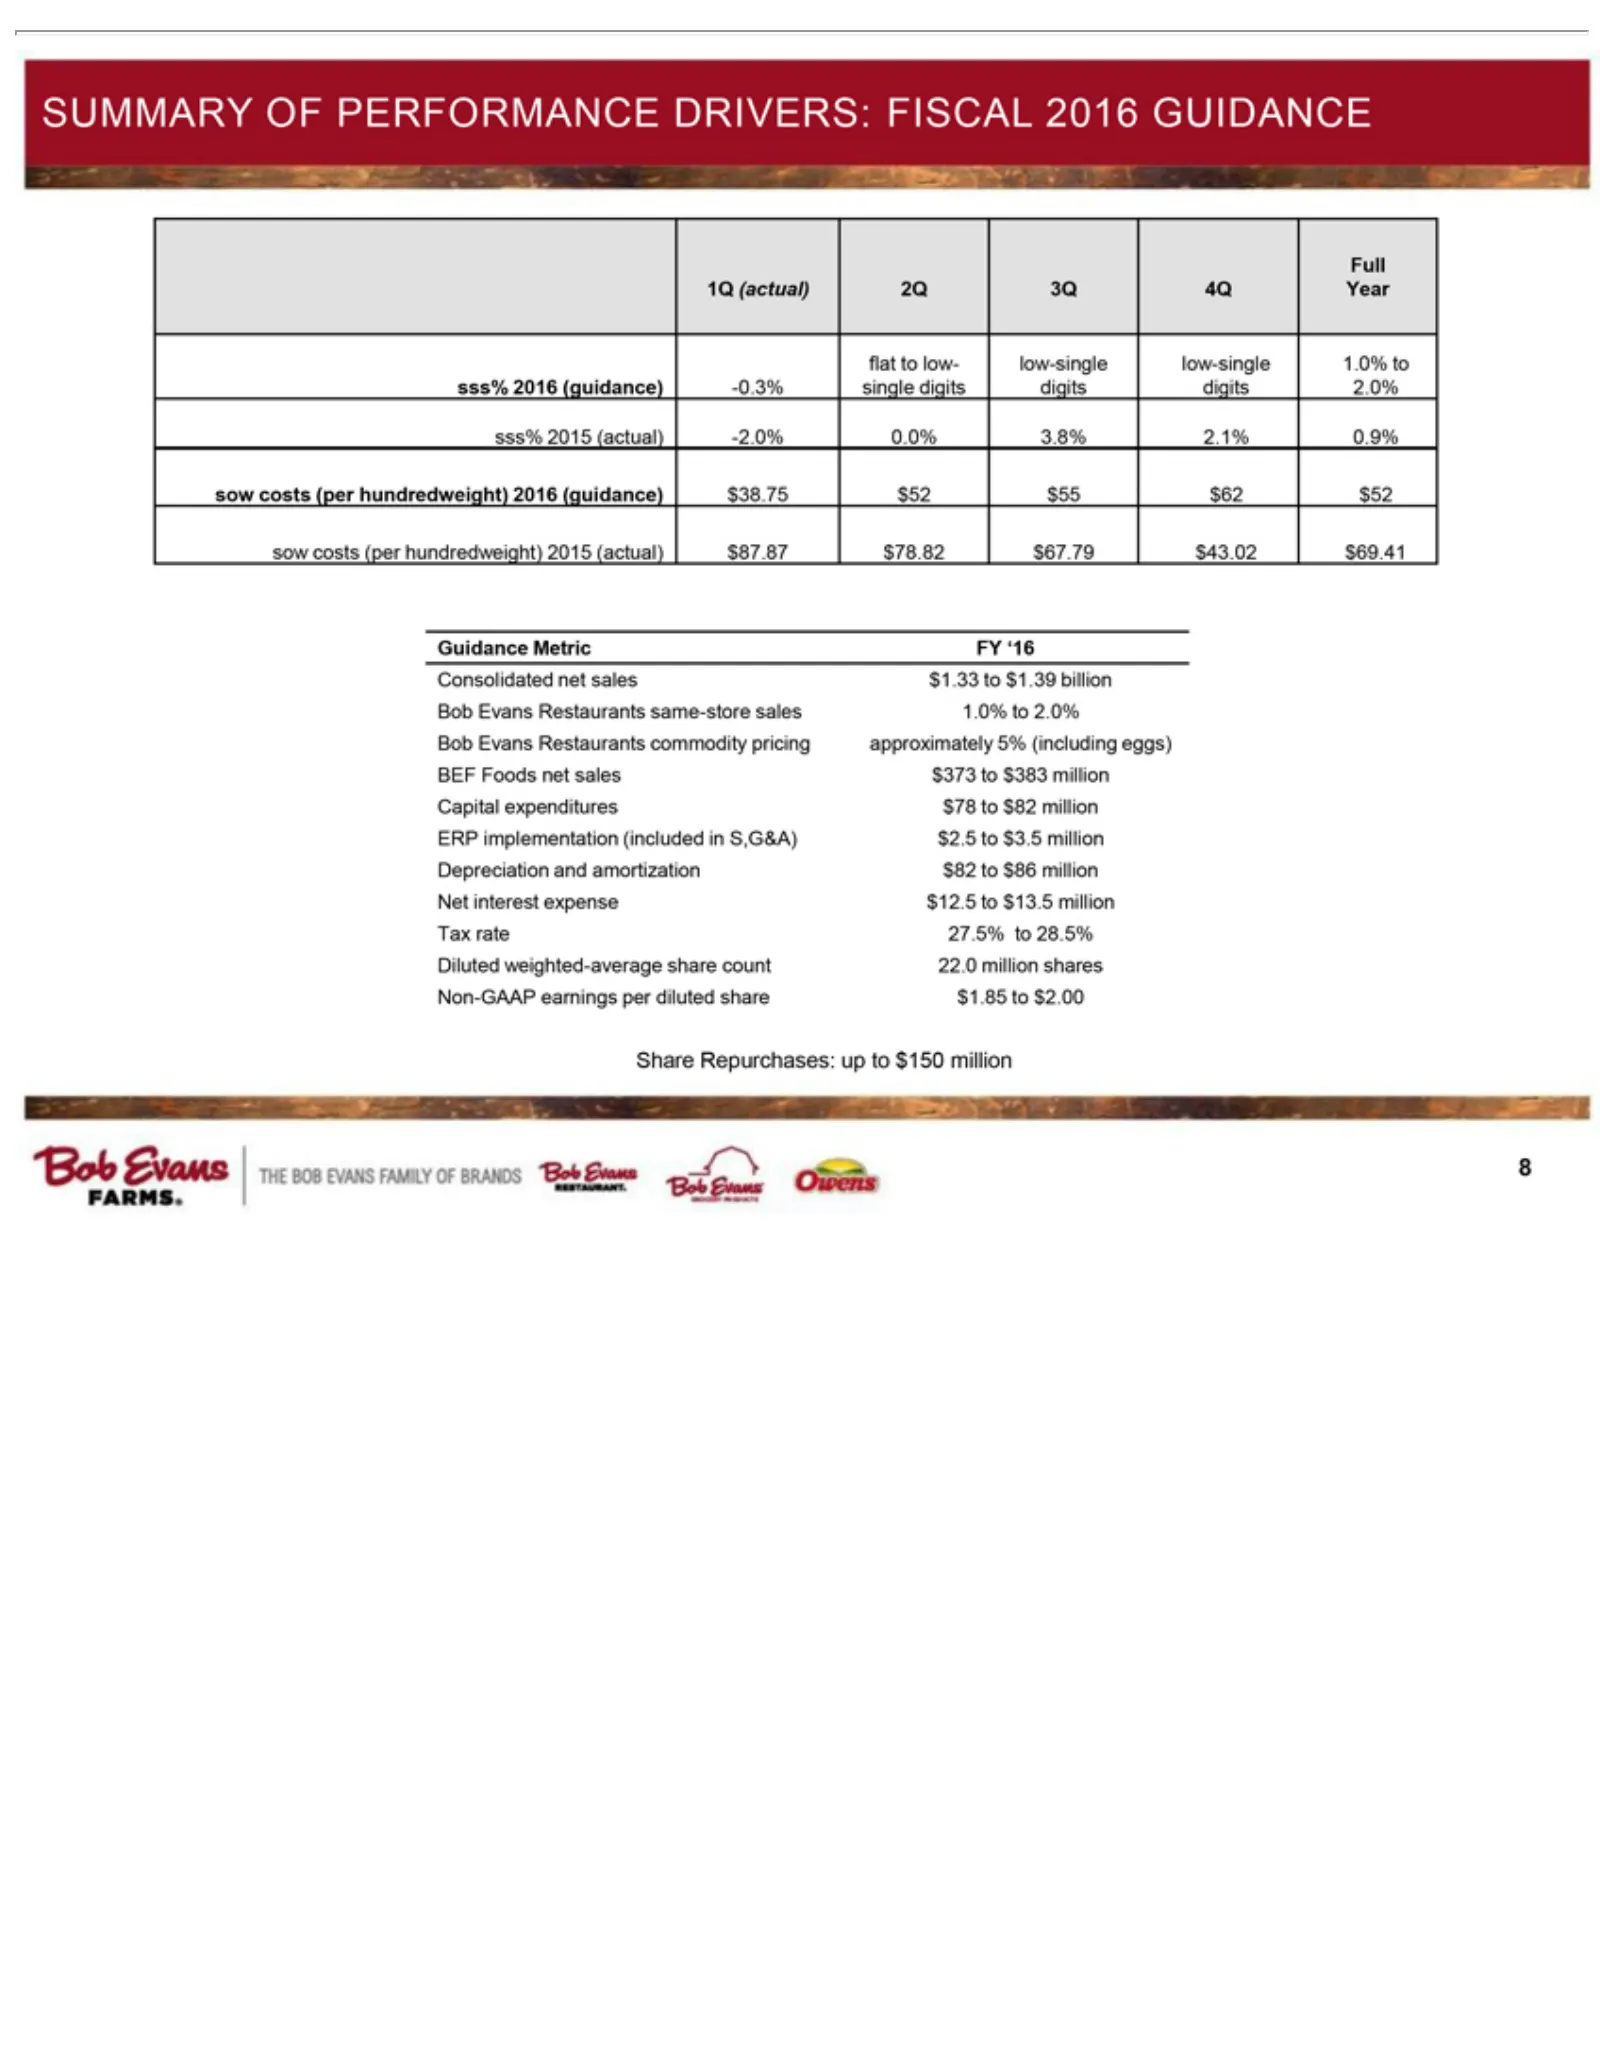
Slide 8: Summary 2016 Guidance
Summary 1Q Year Full 4Q 3Q 2Q flat -0.3% low-single sss% 0.9% 2.1% 3.8% 0.0% -2.0% sow $62 $55 $52 $38.75 $69.41 $43.02 $67.79 $78.82 $87.87 FY Consolidated $1.33 1.0% Bob approximately BEF $373 Capital $78 ERP $2.5 Depreciation $82 Net $12.5 Tax 27.5% Diluted 22.0 Non-GAAP $1.85 8Share (actual) ‘16
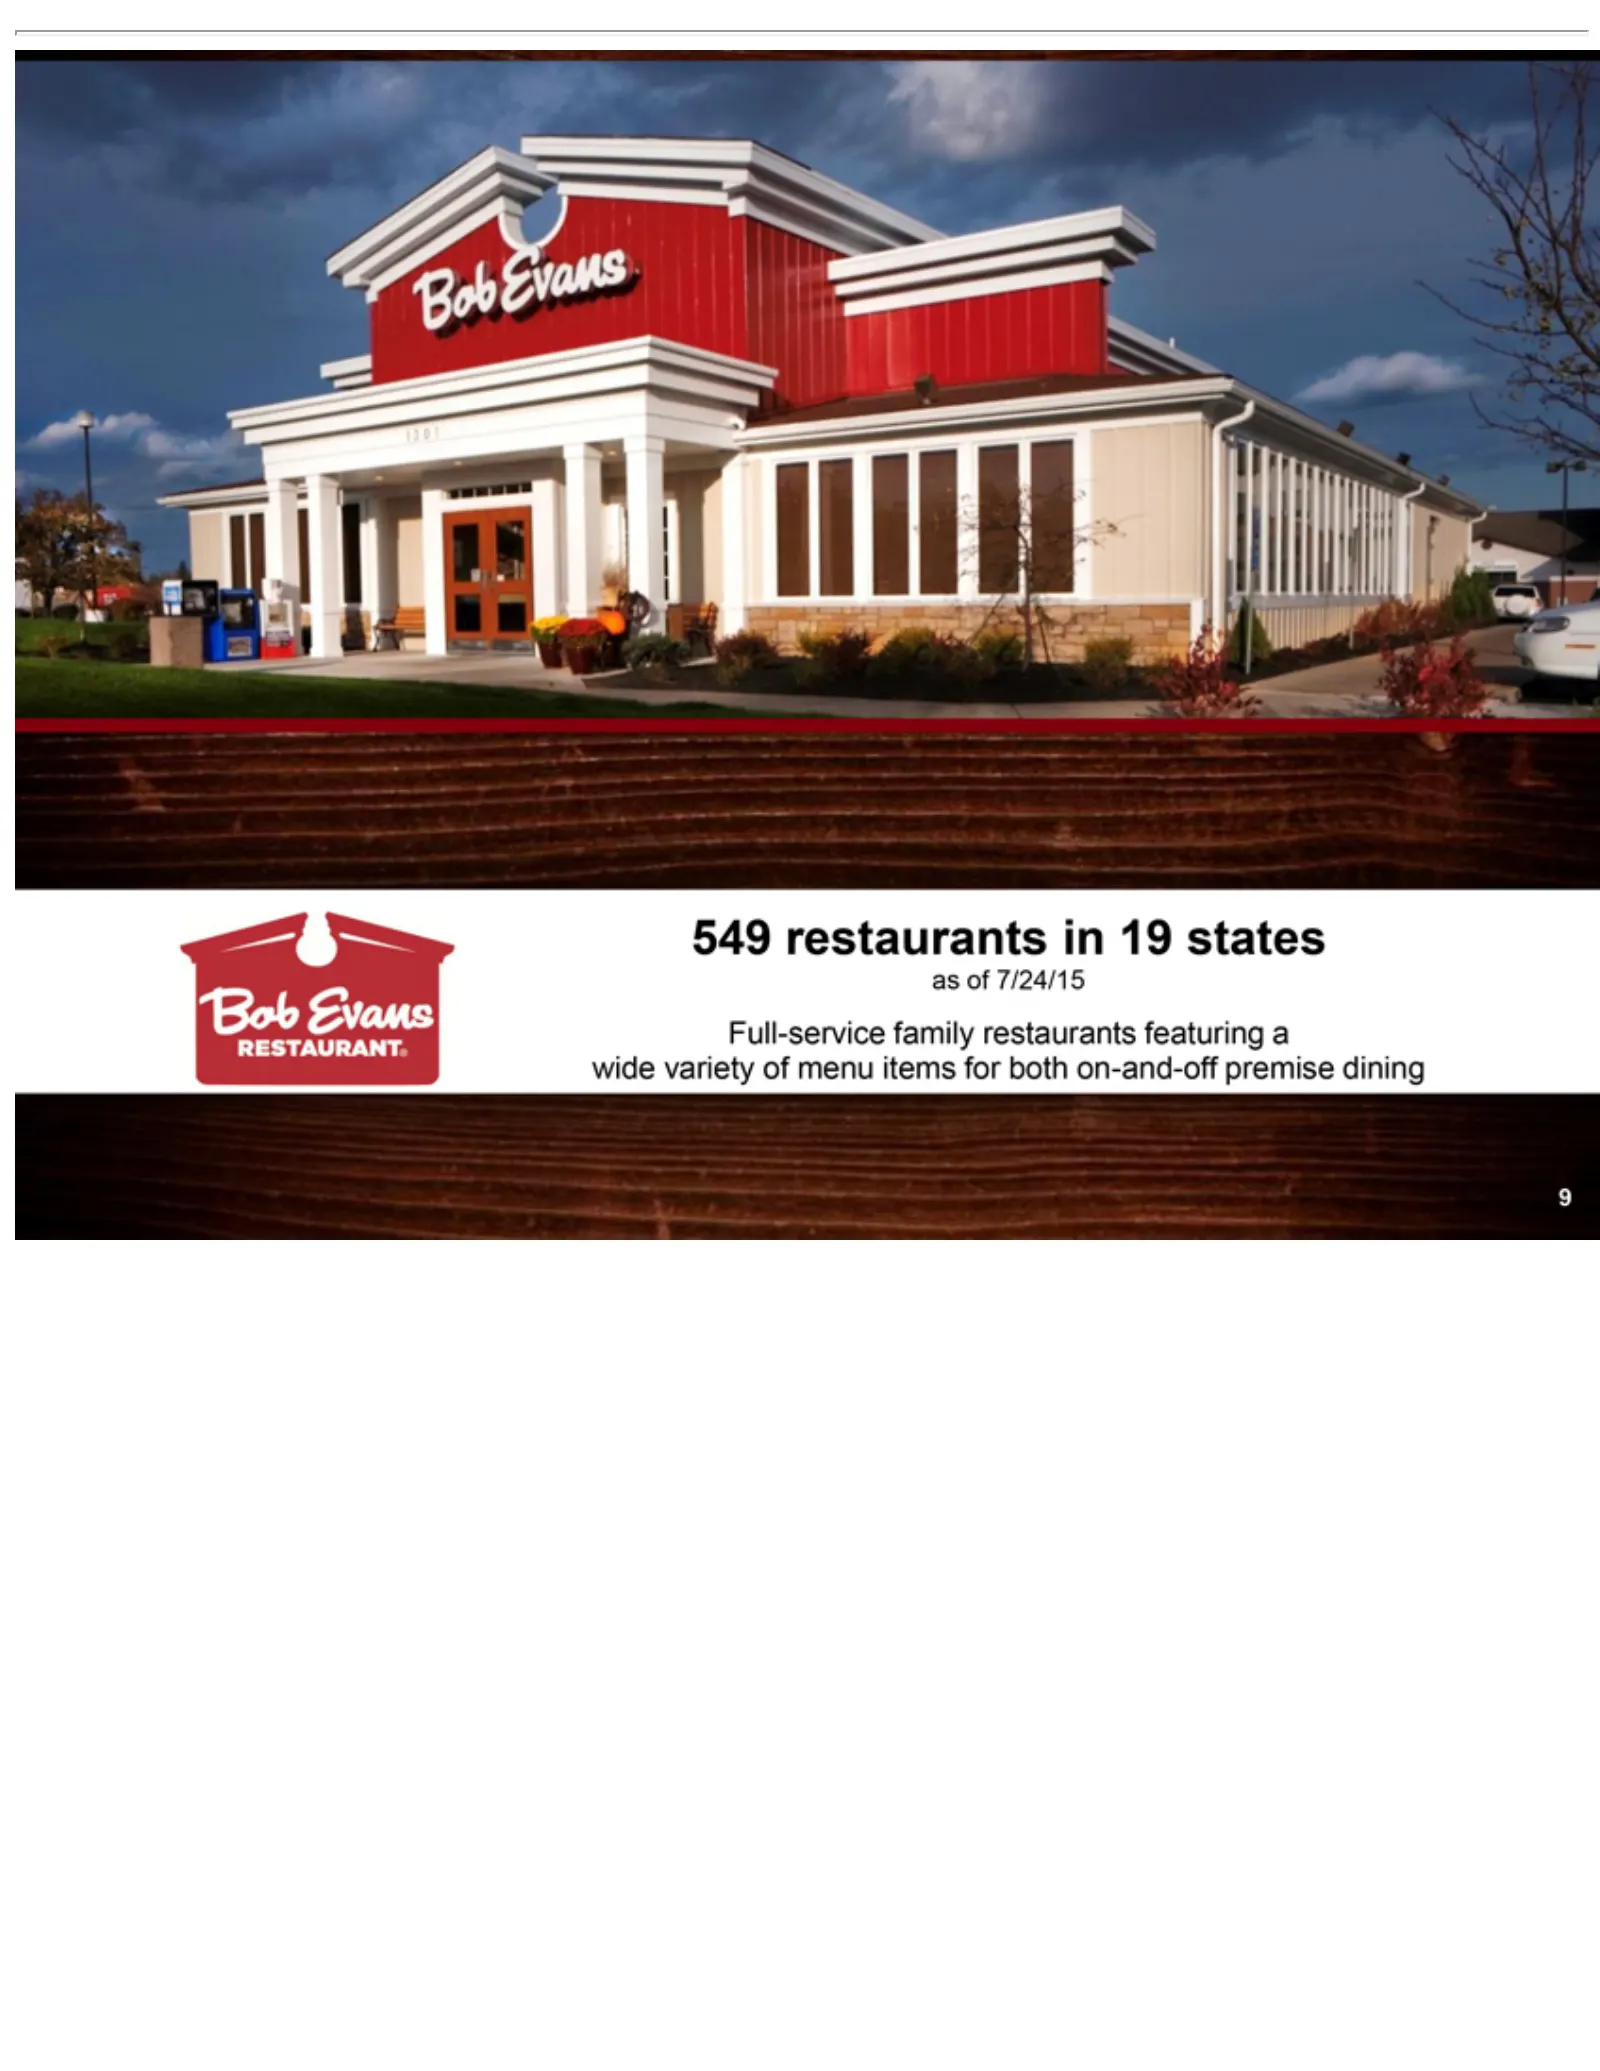
Slide 9: Bob Evans Restaurants: Full-service restaurants
549 restaurants Full-service 9wide variety family of menu in 19restaurants states items as forof featuring both 7/24/15 on-and-off a premise dining
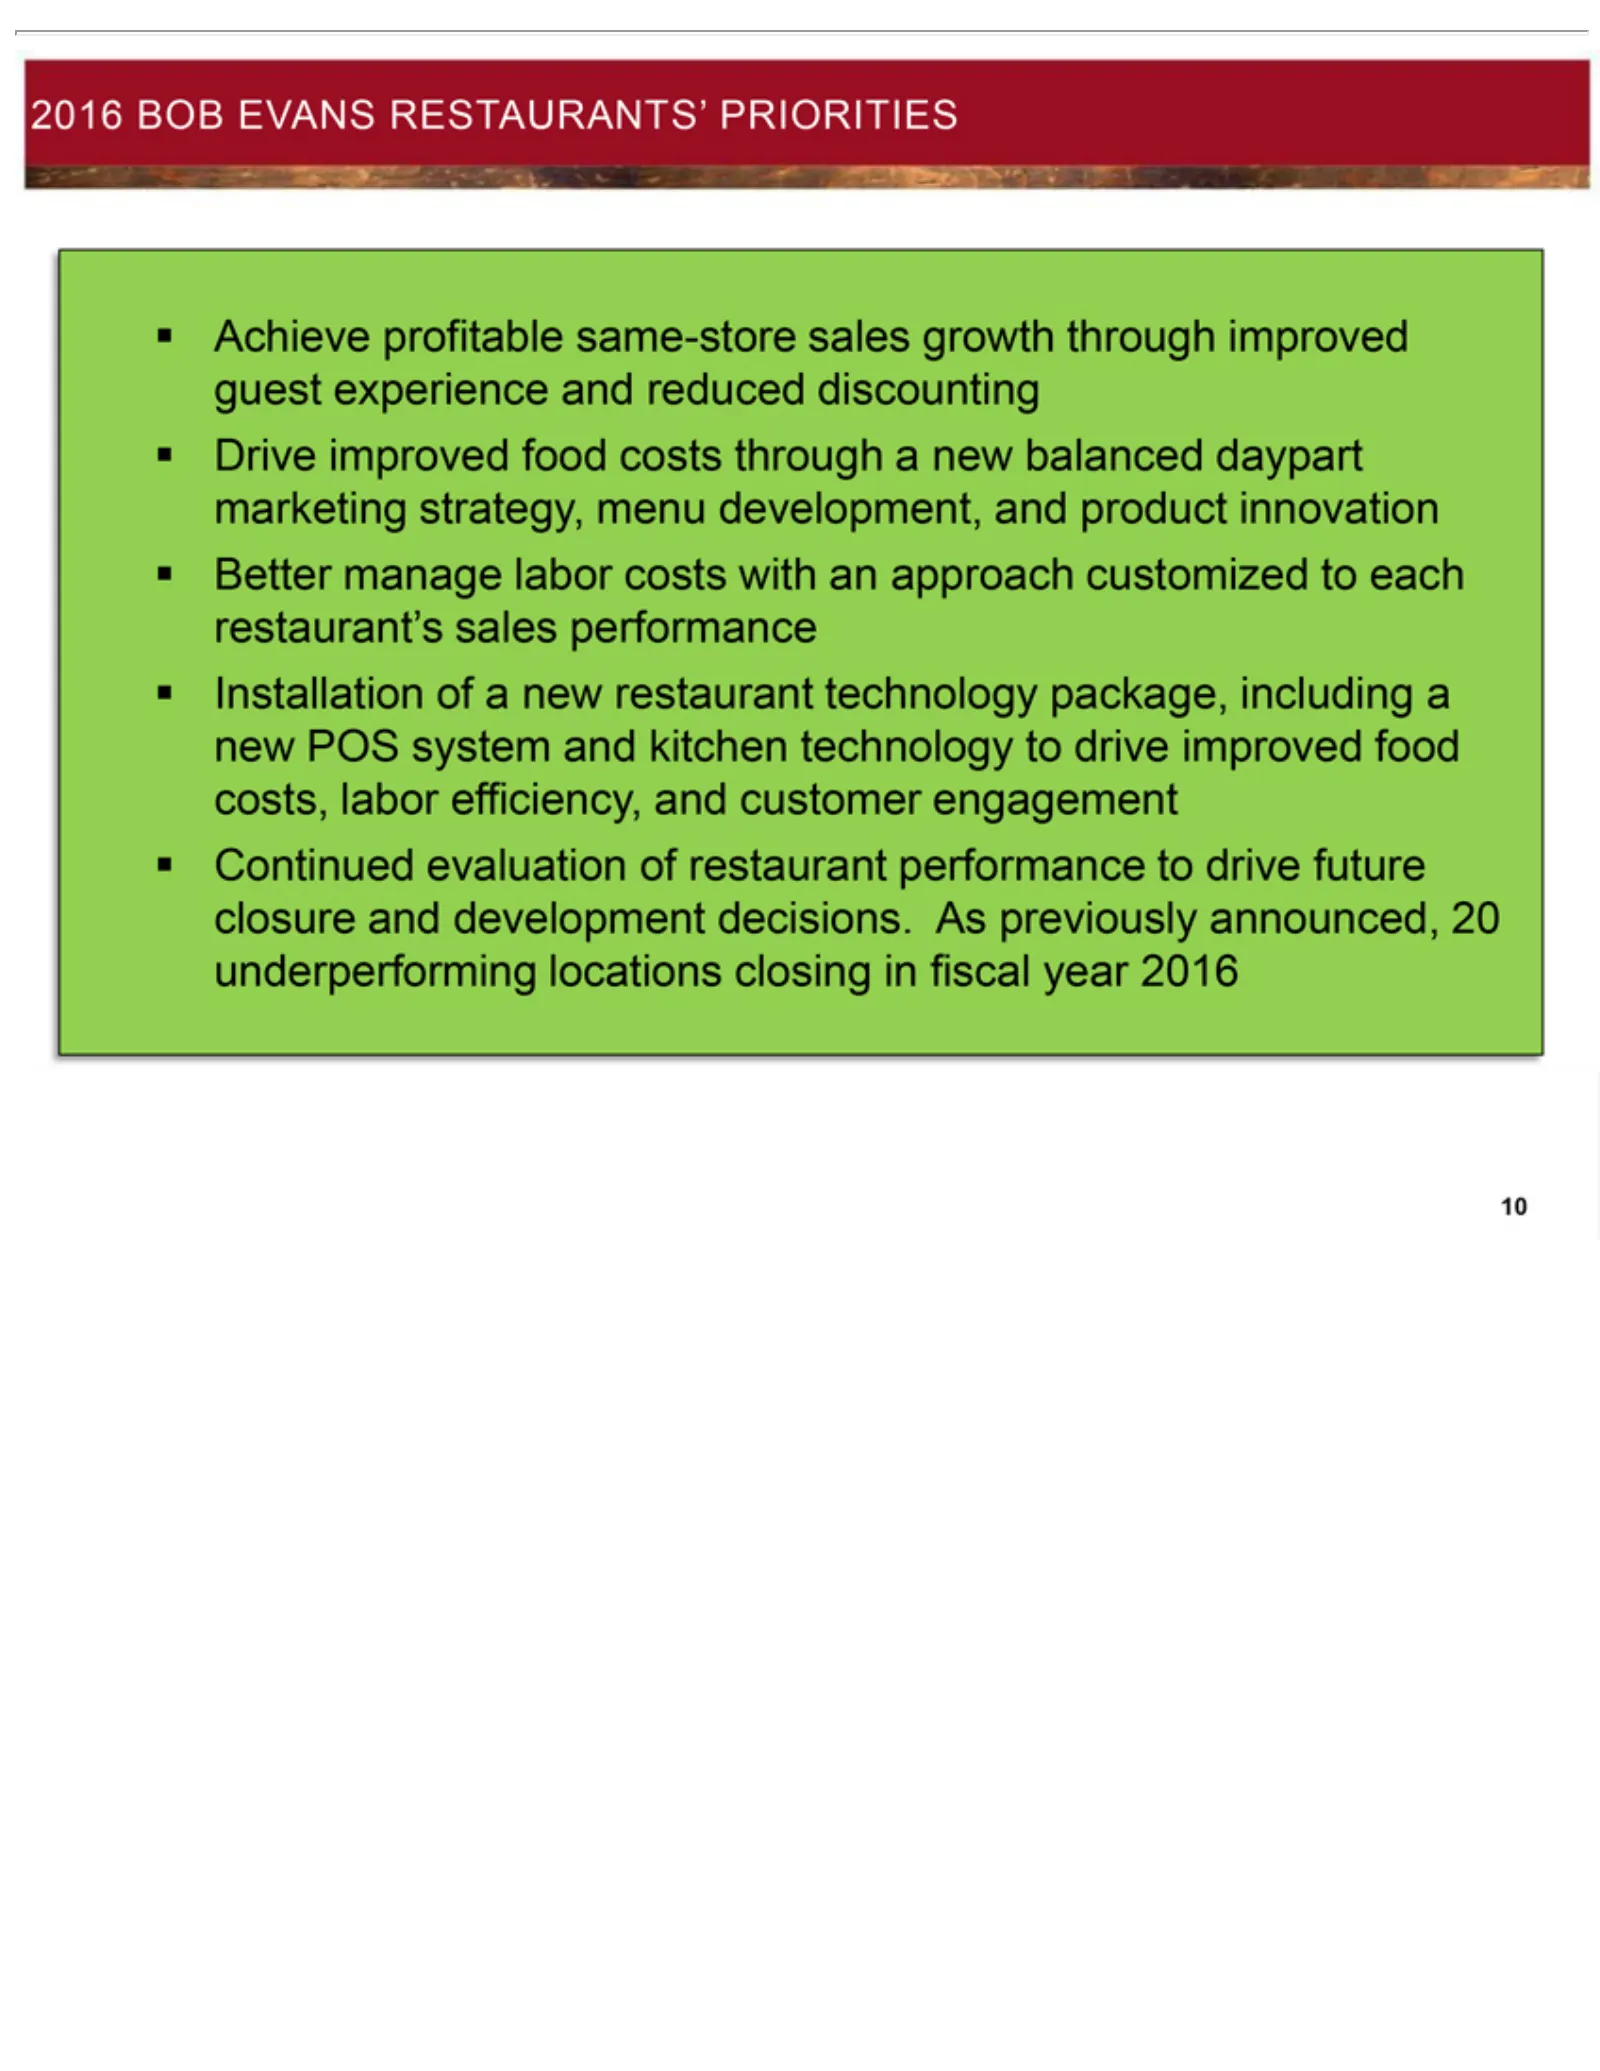
Slide 10: 2016 Bob Evans Restaurants' Priorities
2016 BOB Achieve Drive Better Installation Continued 10 improved manage profitable evaluation EVANS of alabor new food same-store RESTAURANTS’ costs restaurant costs of restaurant with through sales technology an approach performance agrowth new PRIORITIES balanced package, through customized to dri
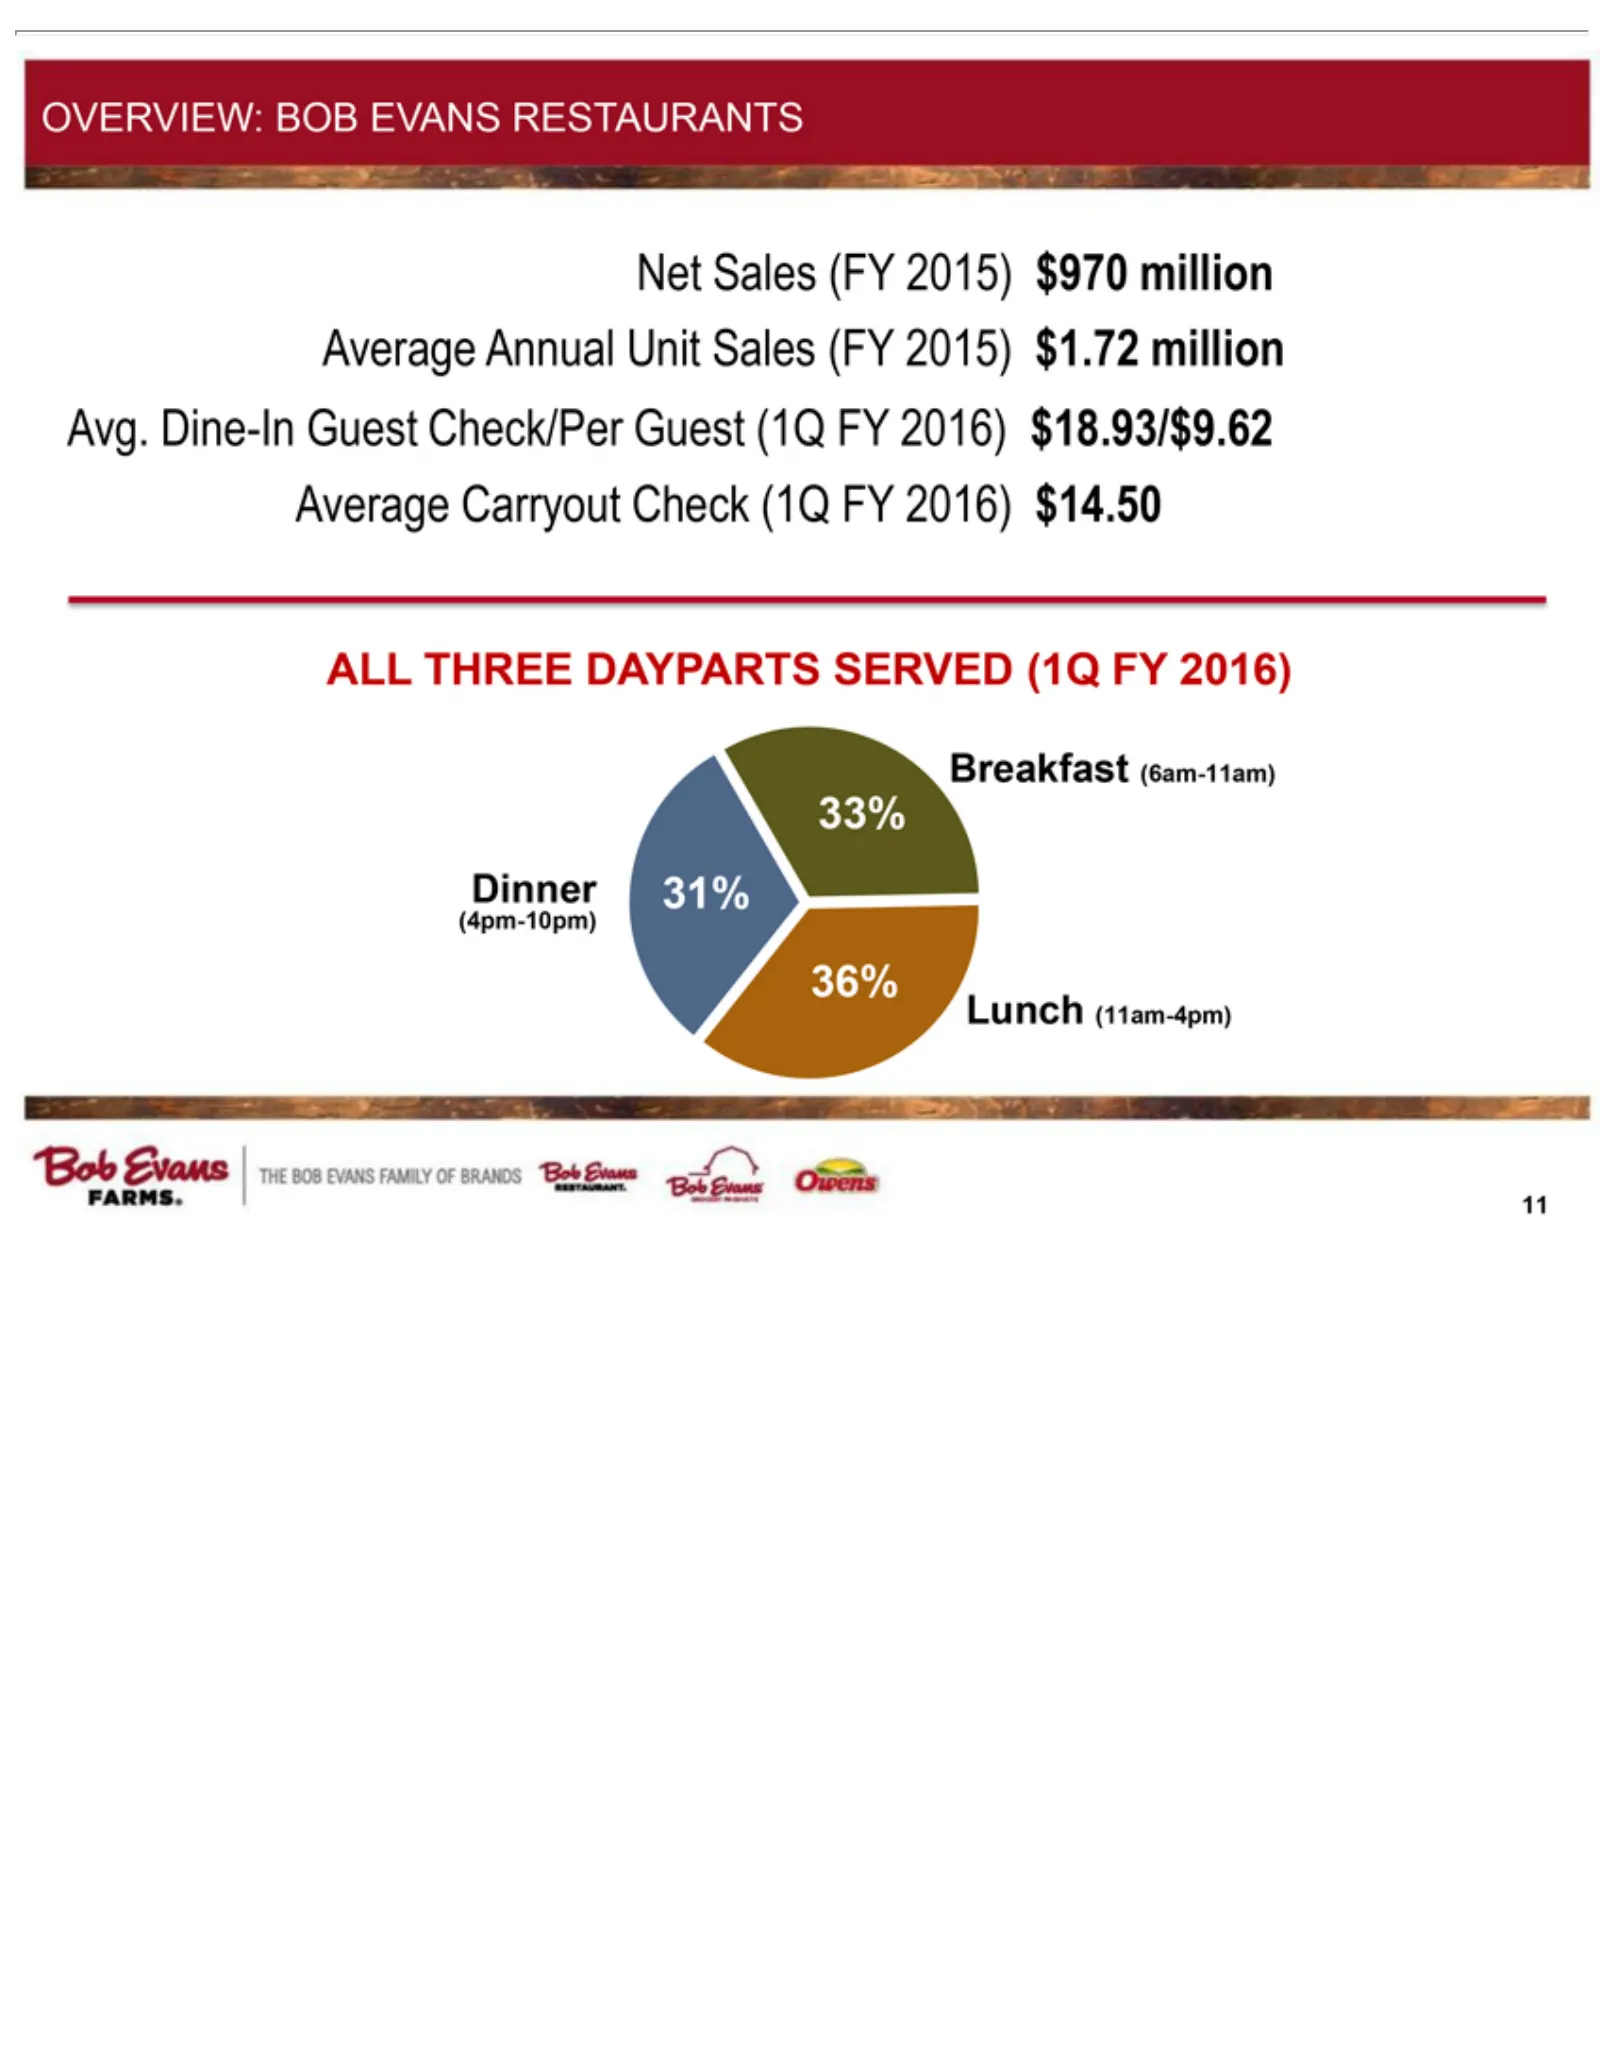
Slide 11: Overview: Bob Evans Restaurants
OVERVIEW: Net Avg. Average ALL Breakfast (4pm-10pm) Dinner Lunch 11 36% 31% 33% Sales THREE Dine-In (11am-4pm) Annual Carryout (FY (6am-11am) Guest DAYPARTS BOB 2015) Unit Check EVANS Check/Per $970 Sales (1Q million SERVED (FY RESTAURANTS FYGuest 2015) 2016) (1Q (1Q $1.72 $14.50 FY FYmillion 2016)
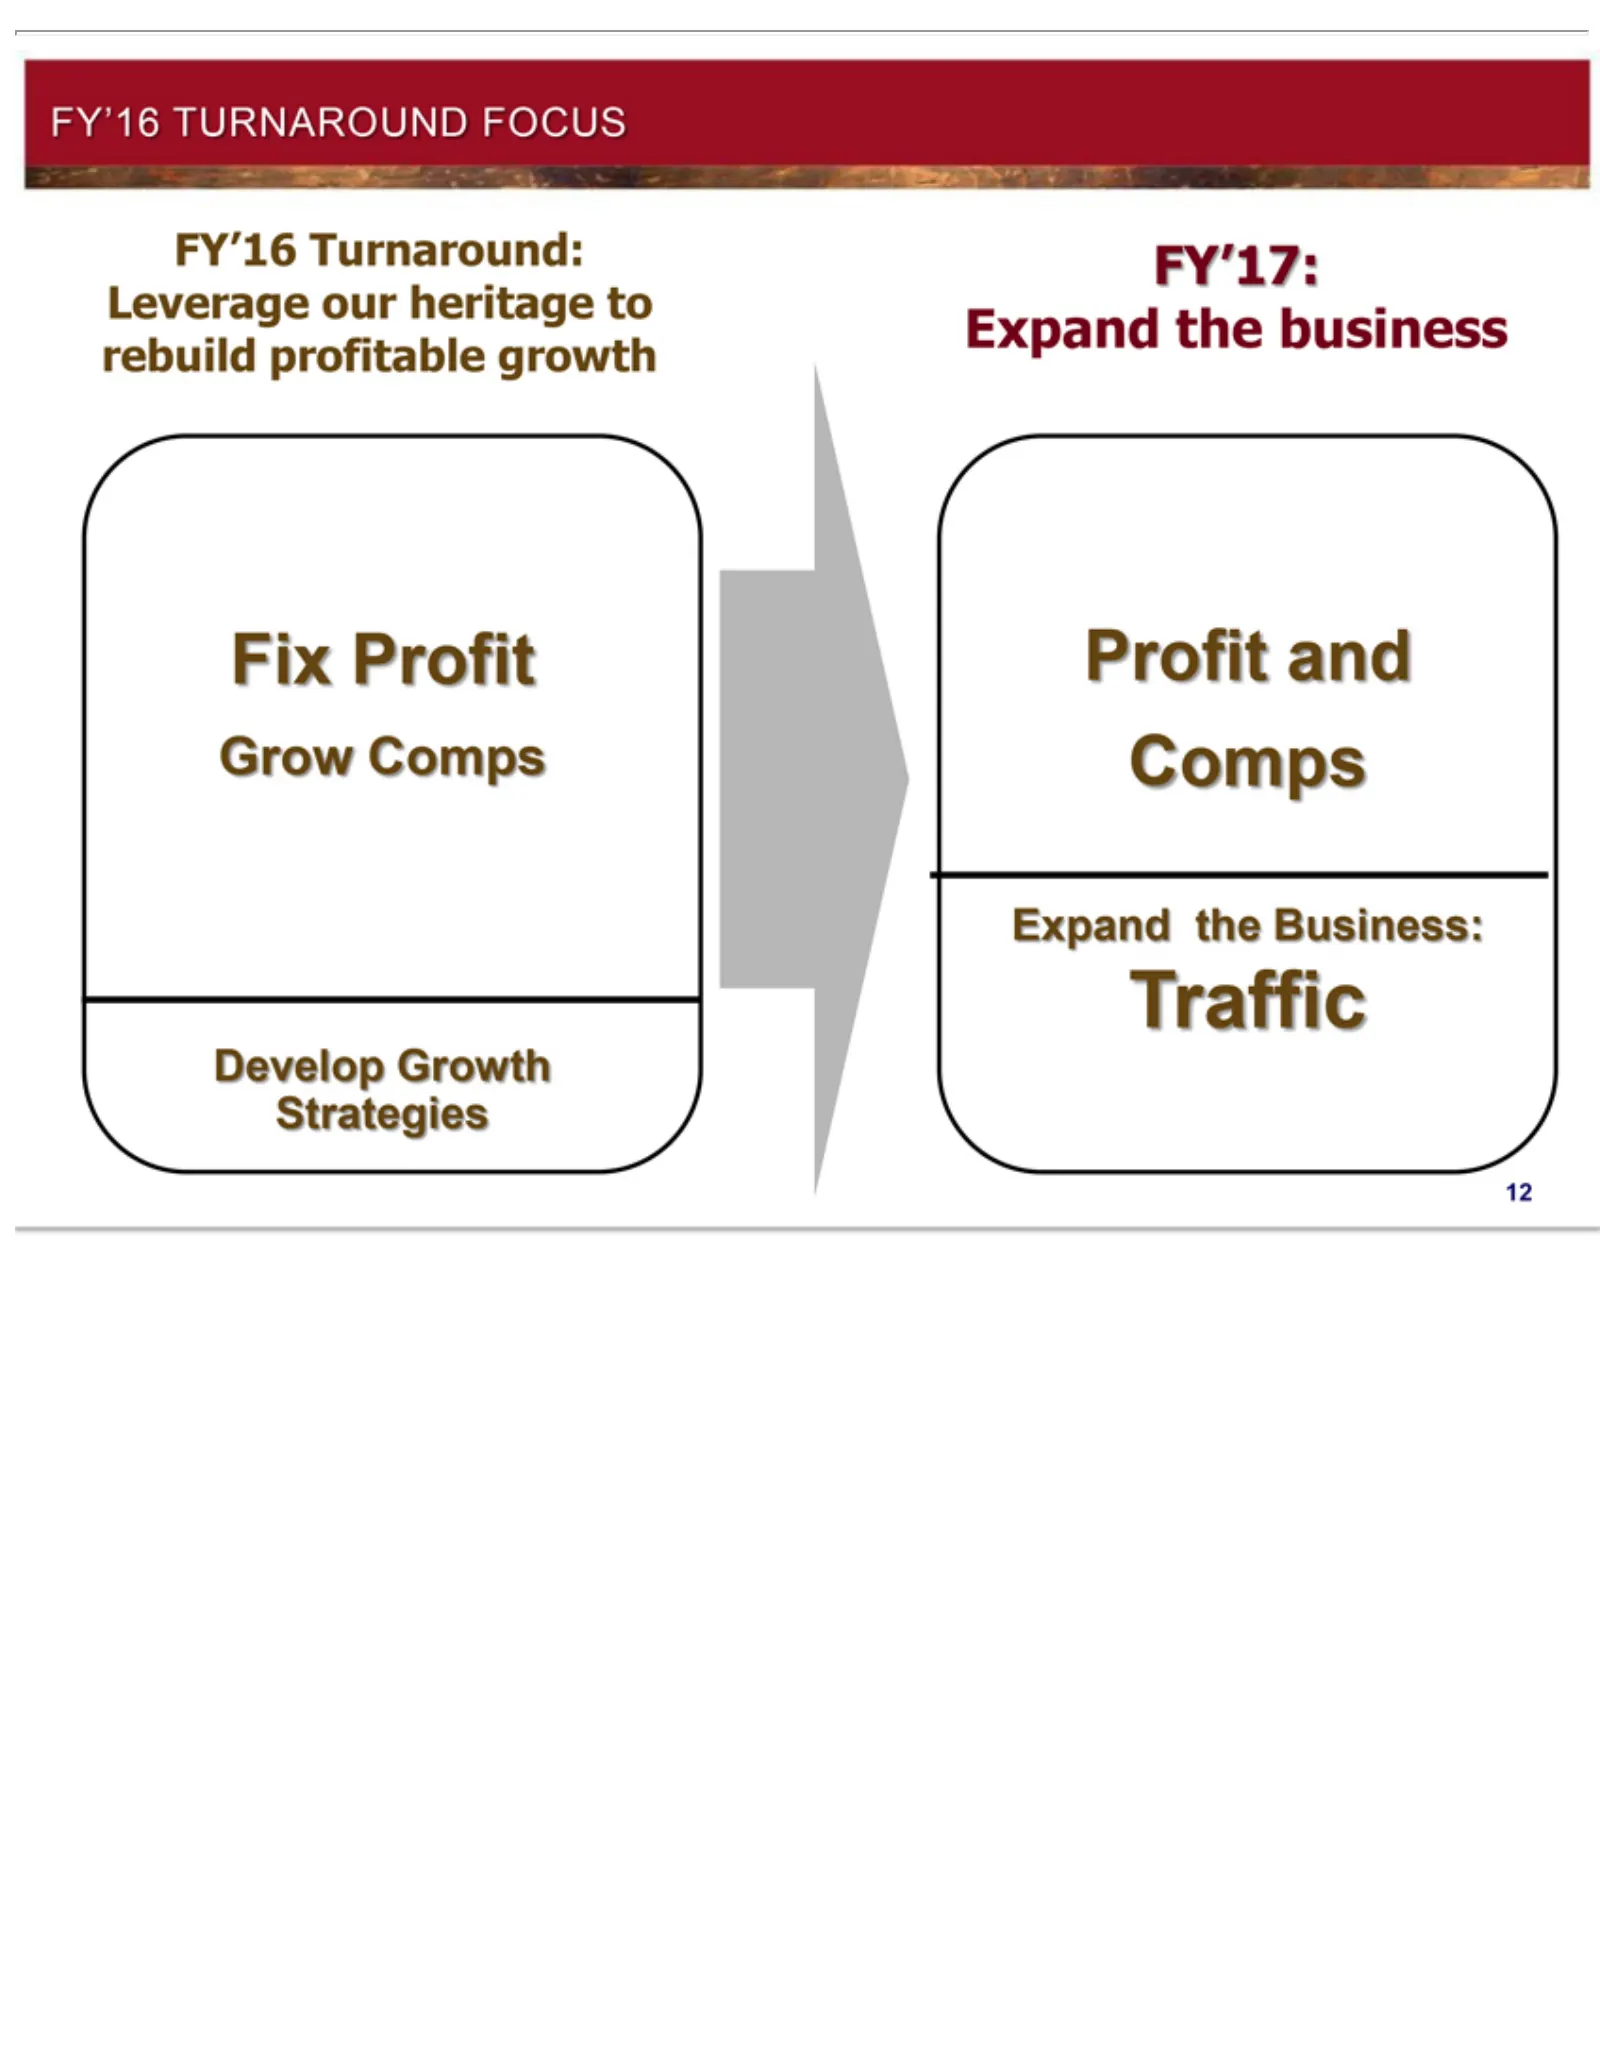
Slide 12: FY'16 Turnaround Focus
FY’16Comps Leverage Expand Grow Comps 12 TURNAROUND Turnaround: Expand the our business heritage Develop the Business: Fix to Growth Profit rebuild FOCUSTraffic Strategies profitableProfit growthandFY’17:
Slide 13: Volume-Band Analysis
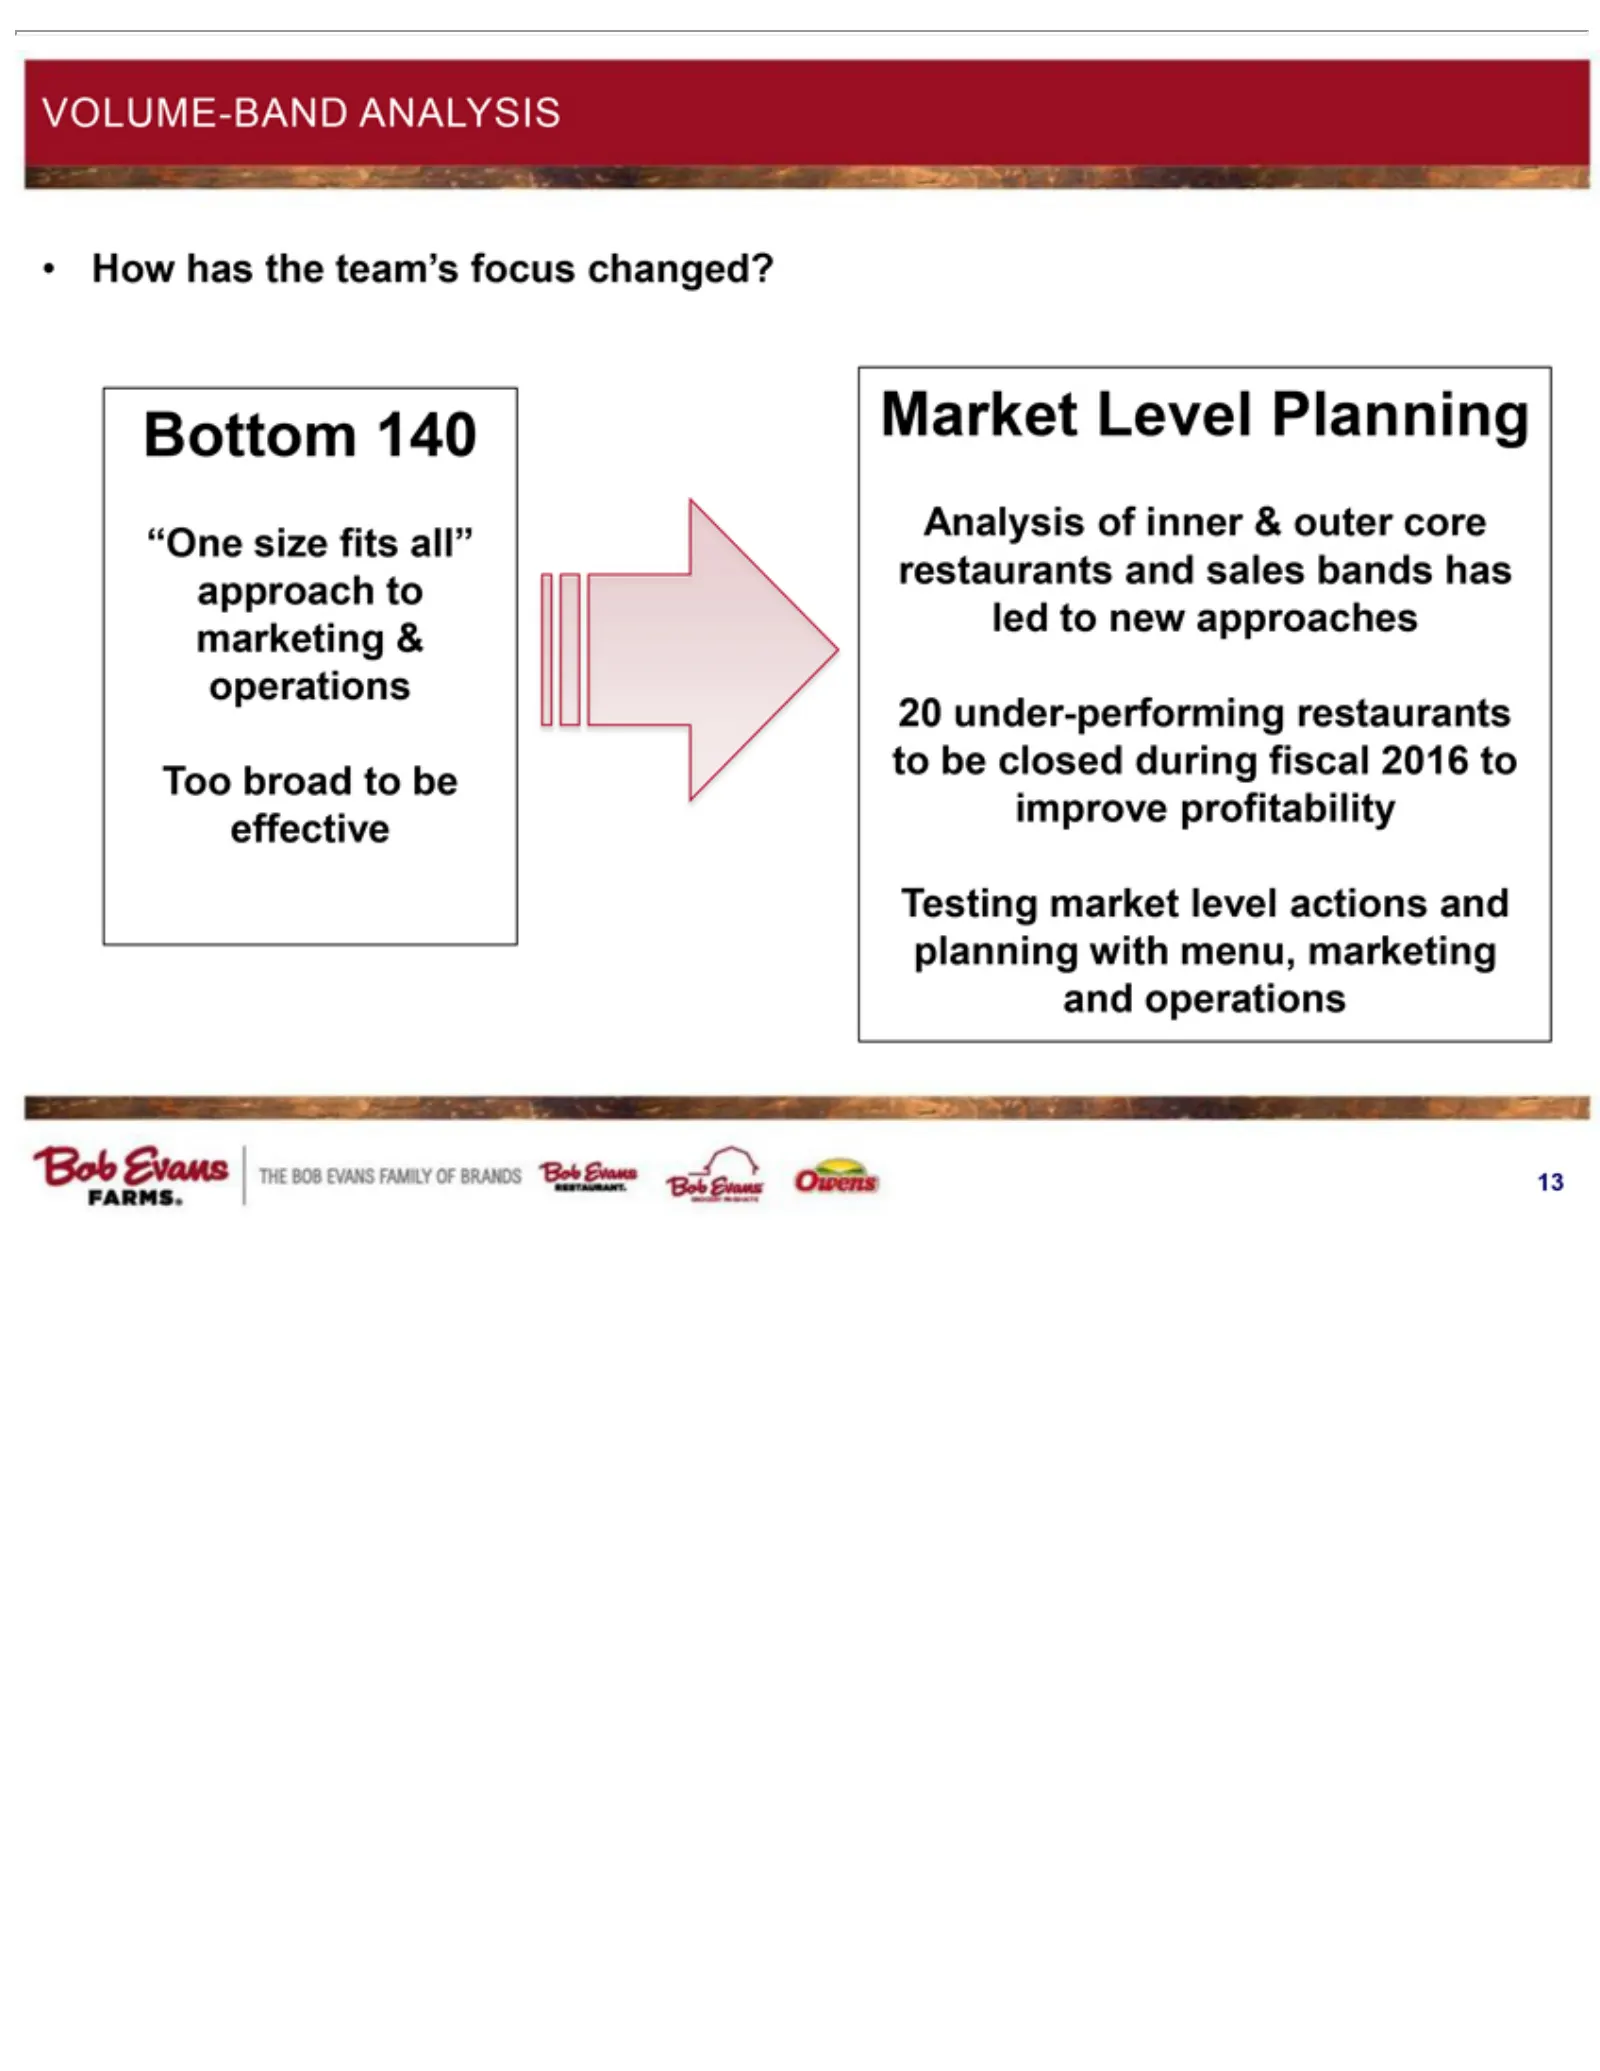
VOLUME-BAND Bottom Market market 13 level Level 140 “One actions Planning size ANALYSIS and fits Analysis planning all” approach How ofwith inner hasmenu, to the &marketing outer team’s marketing core focus & restaurants operations and changed? operations and Toosales broad bands to behas effective
Slide 14: Evolving Menu
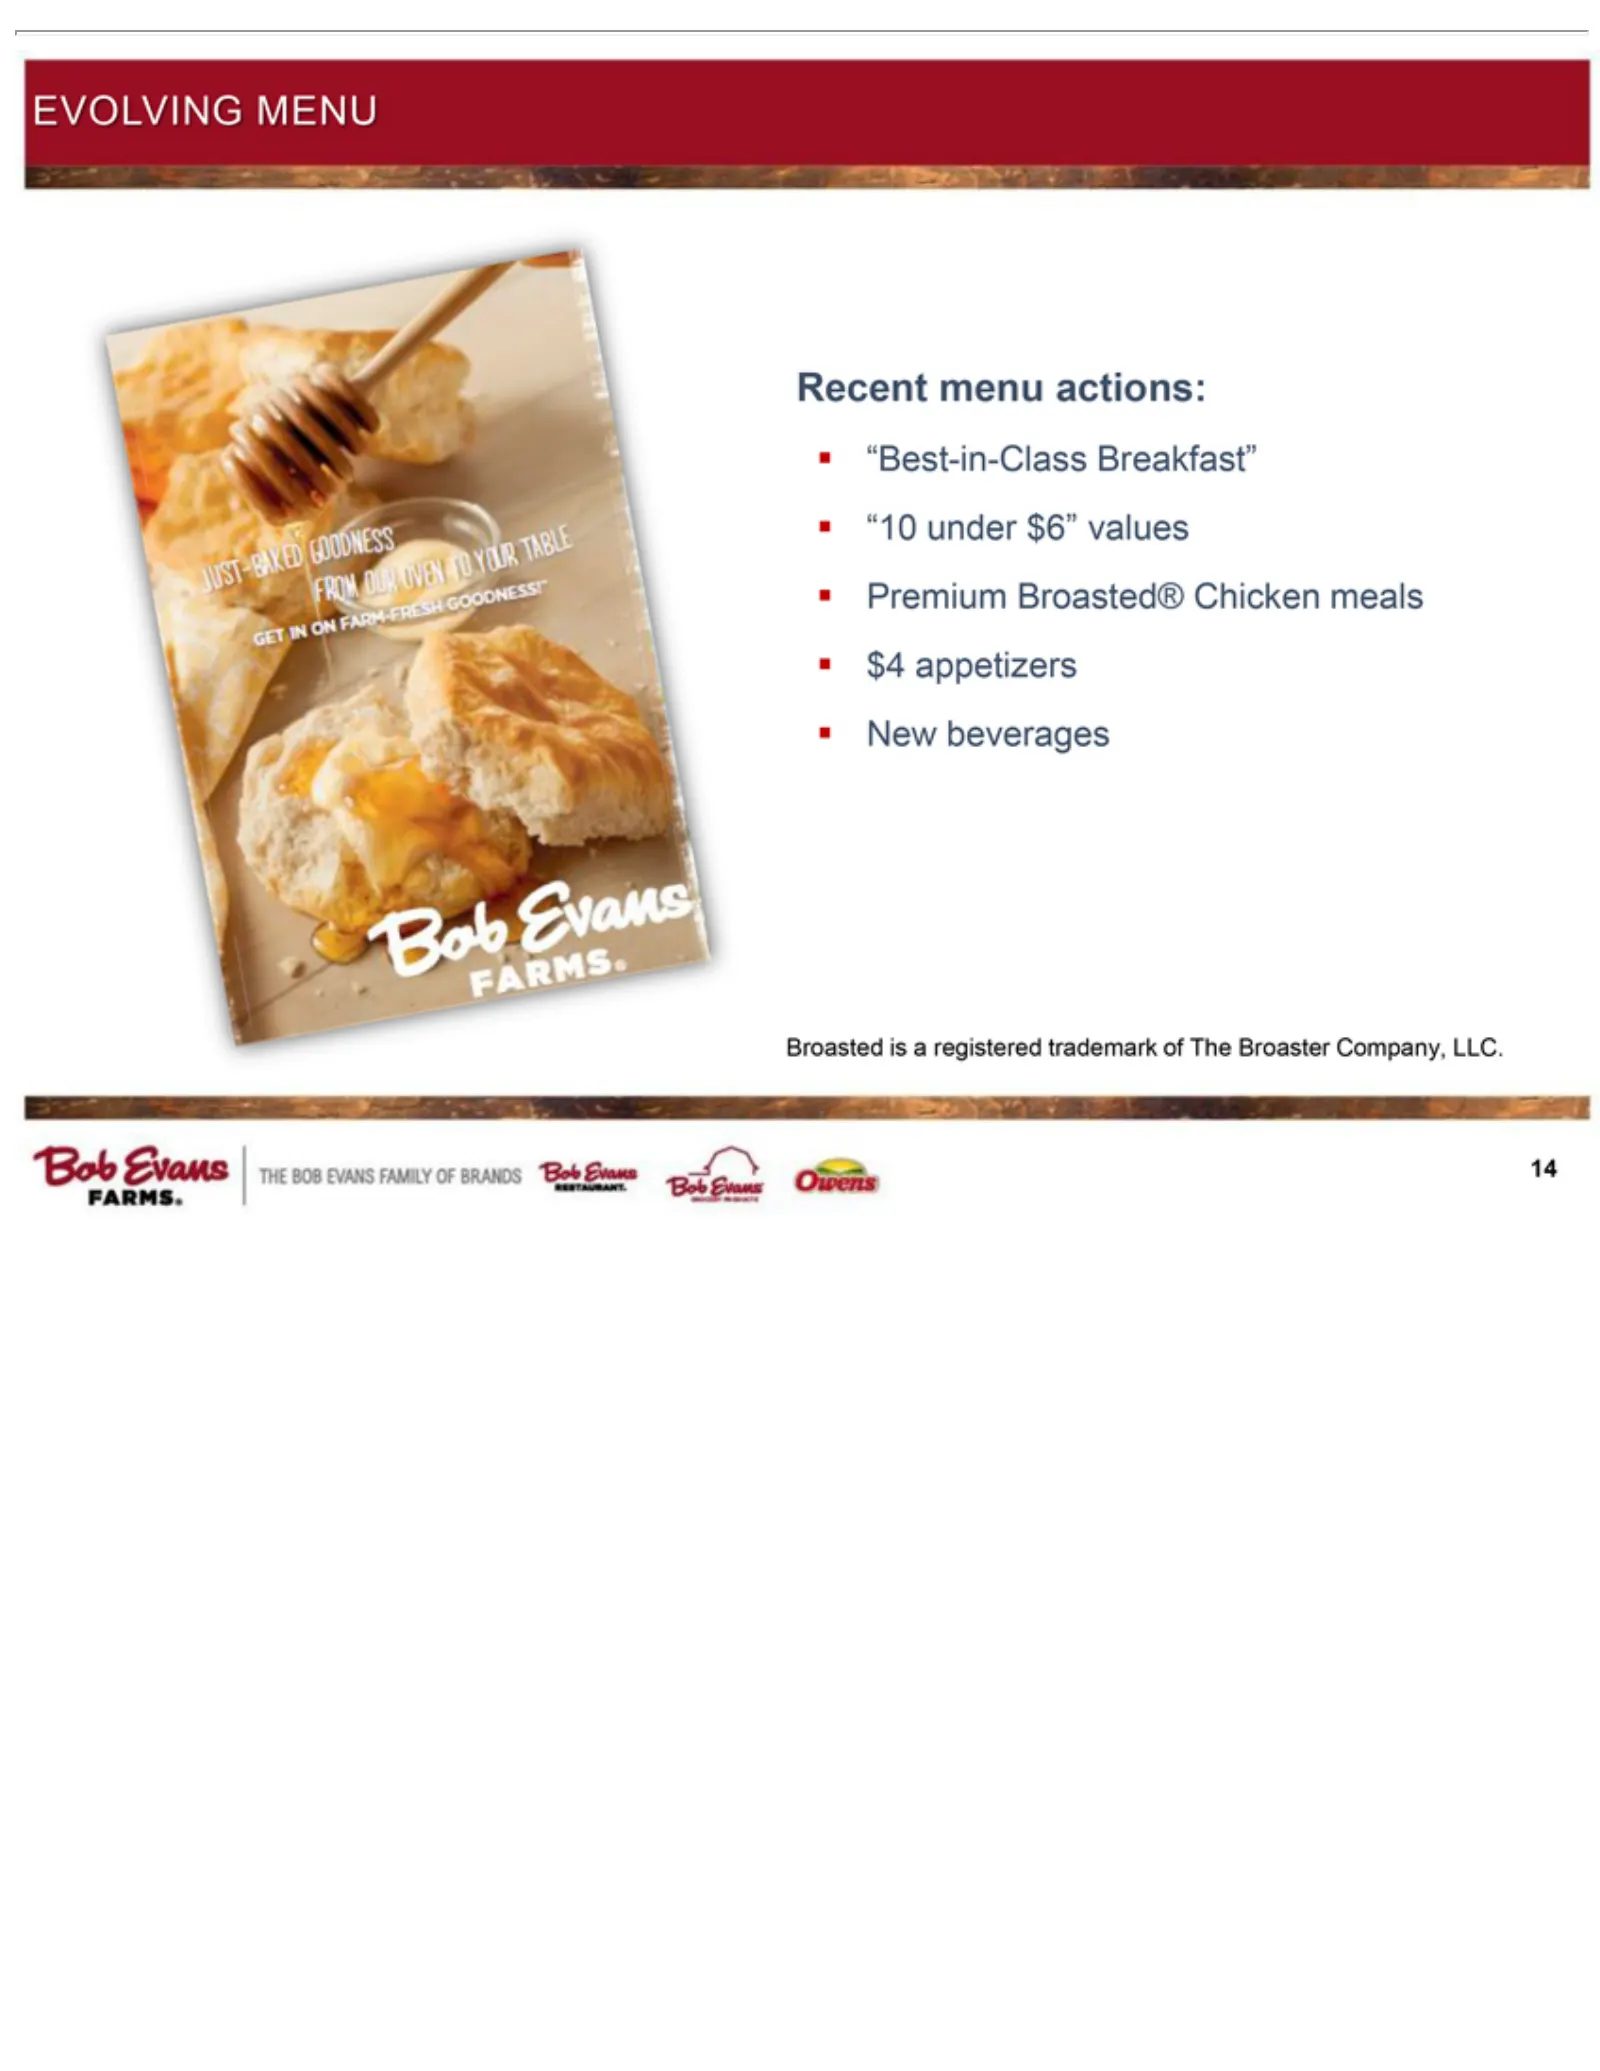
EVOLVING Recent “Best-in-Class “10 Premium $4 New Broasted 14 appetizers under beverages menu is Broasted® $6” a MENU registered actions: values Breakfast” Chicken trademark mealsof The Broaster Company, LLC.
Slide 15: Best-in-Class Breakfast
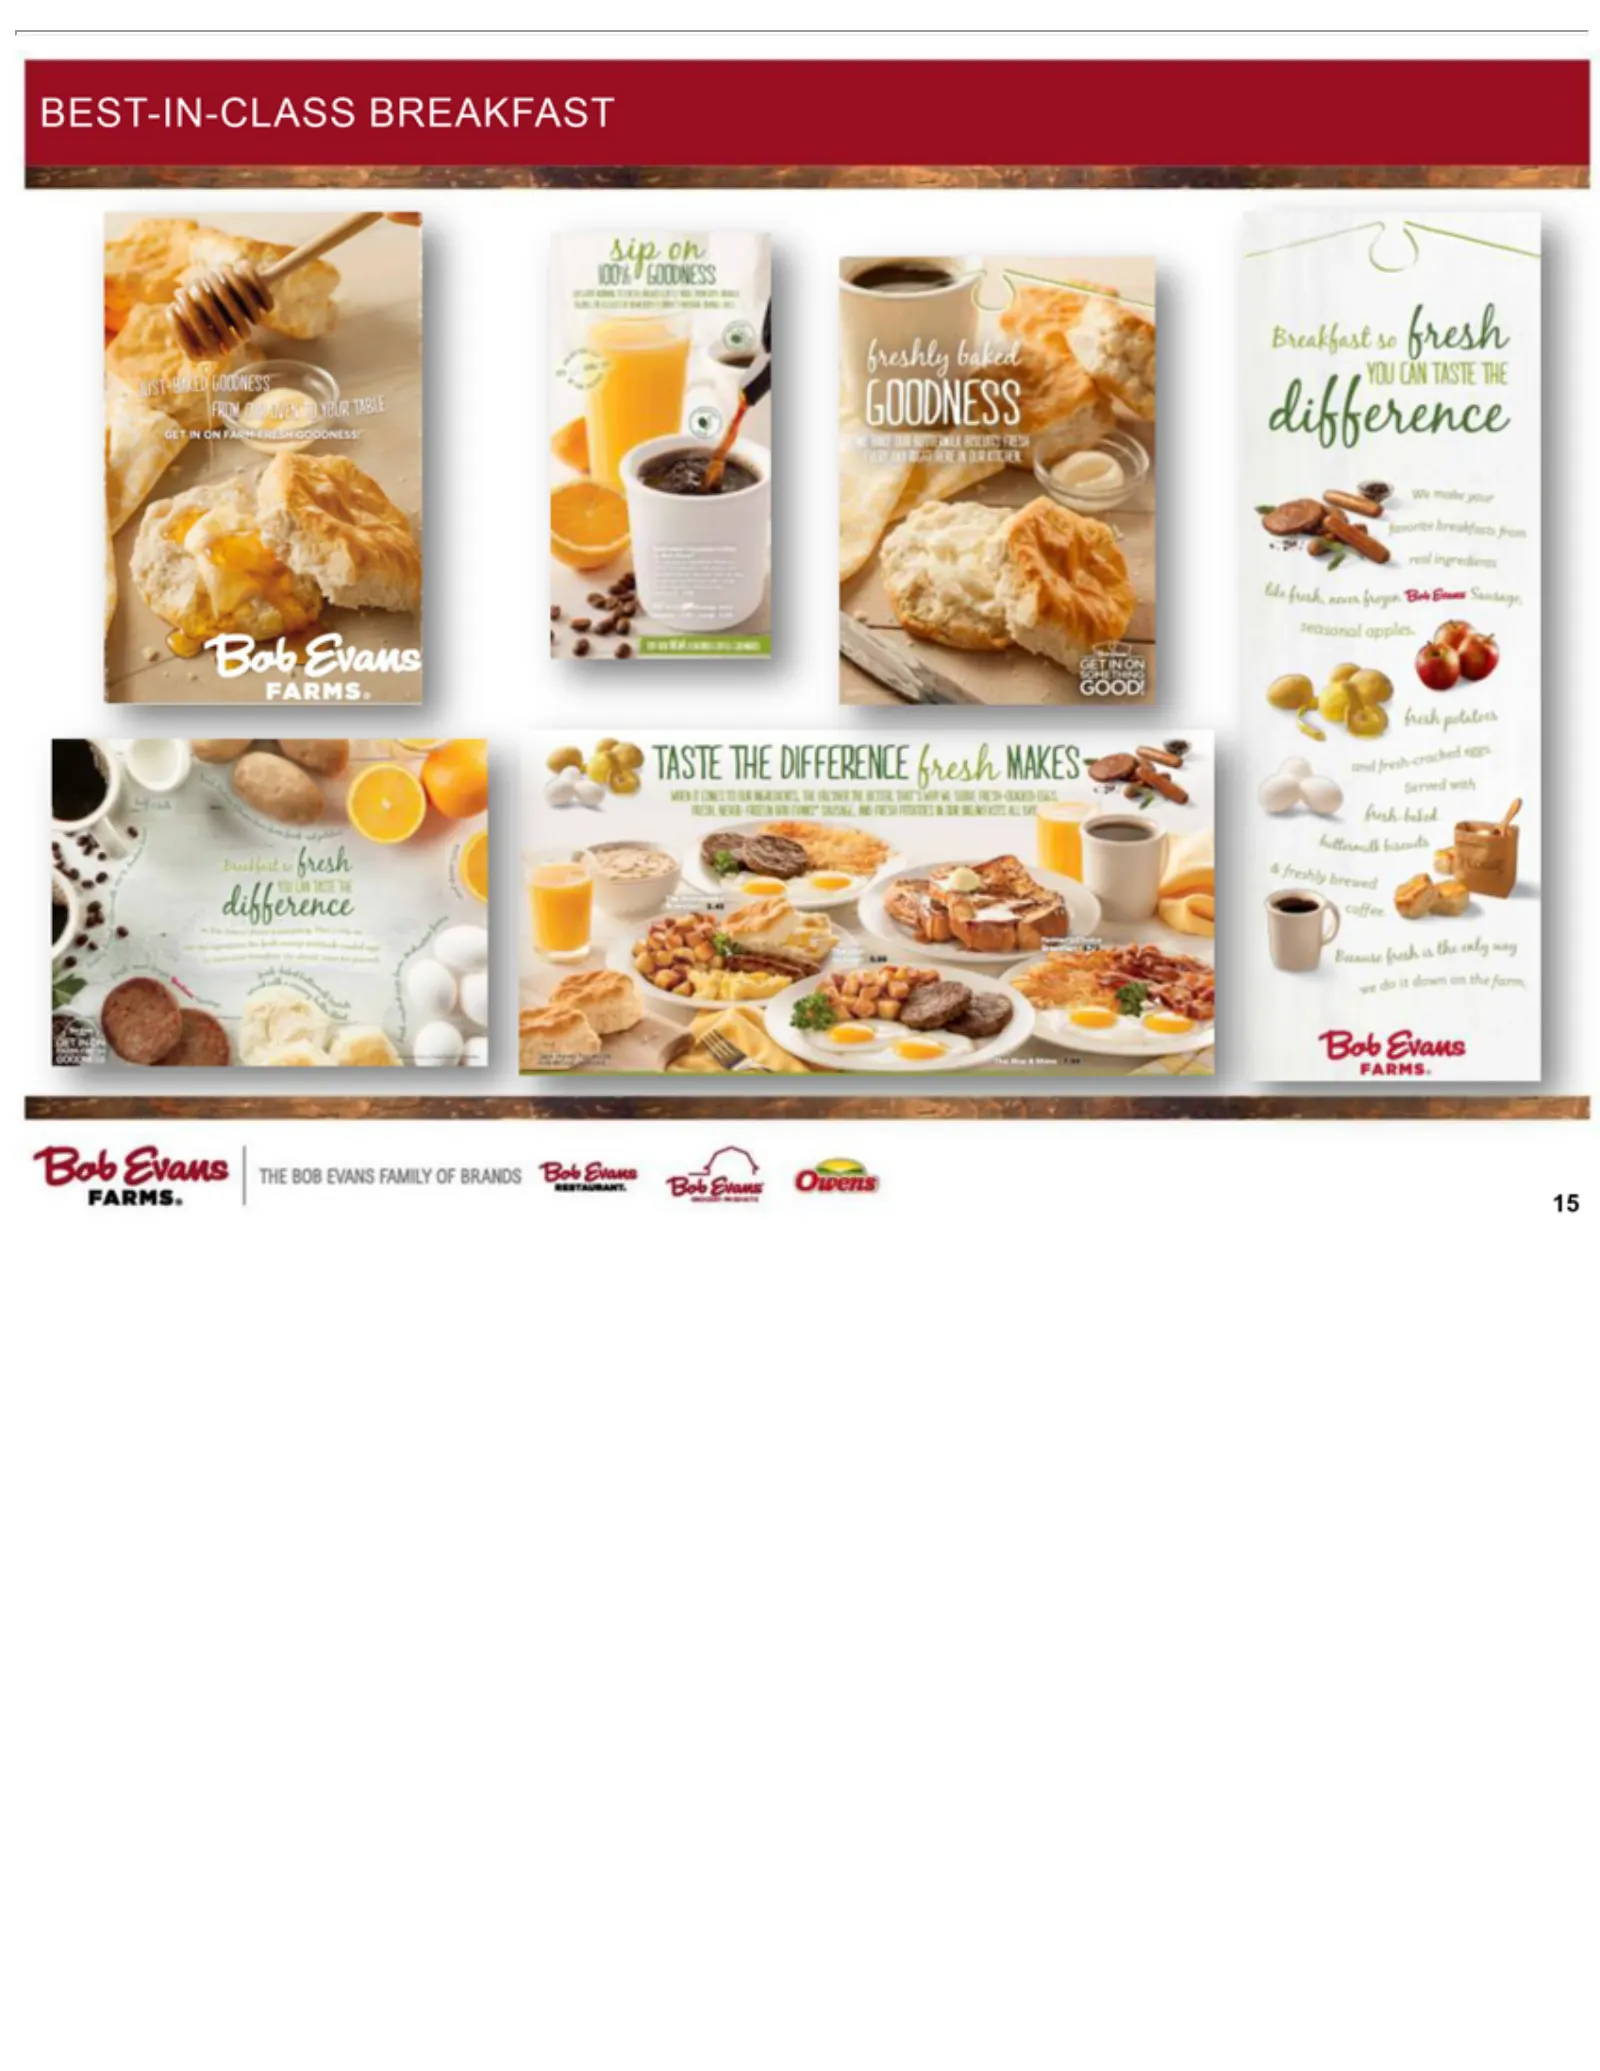
BEST-IN-CLASS BREAKFAST ie rence he birh. never (reyen Ceo Grae Saorsarye TST DFE hag ée= hesh baled “Bob Evans | THE BOB EVANS FAMILY OF BRANDS “Blob Gian oven Osa. 15
Slide 16: Best-in-Class Breakfast: Recent/Upcoming Actions
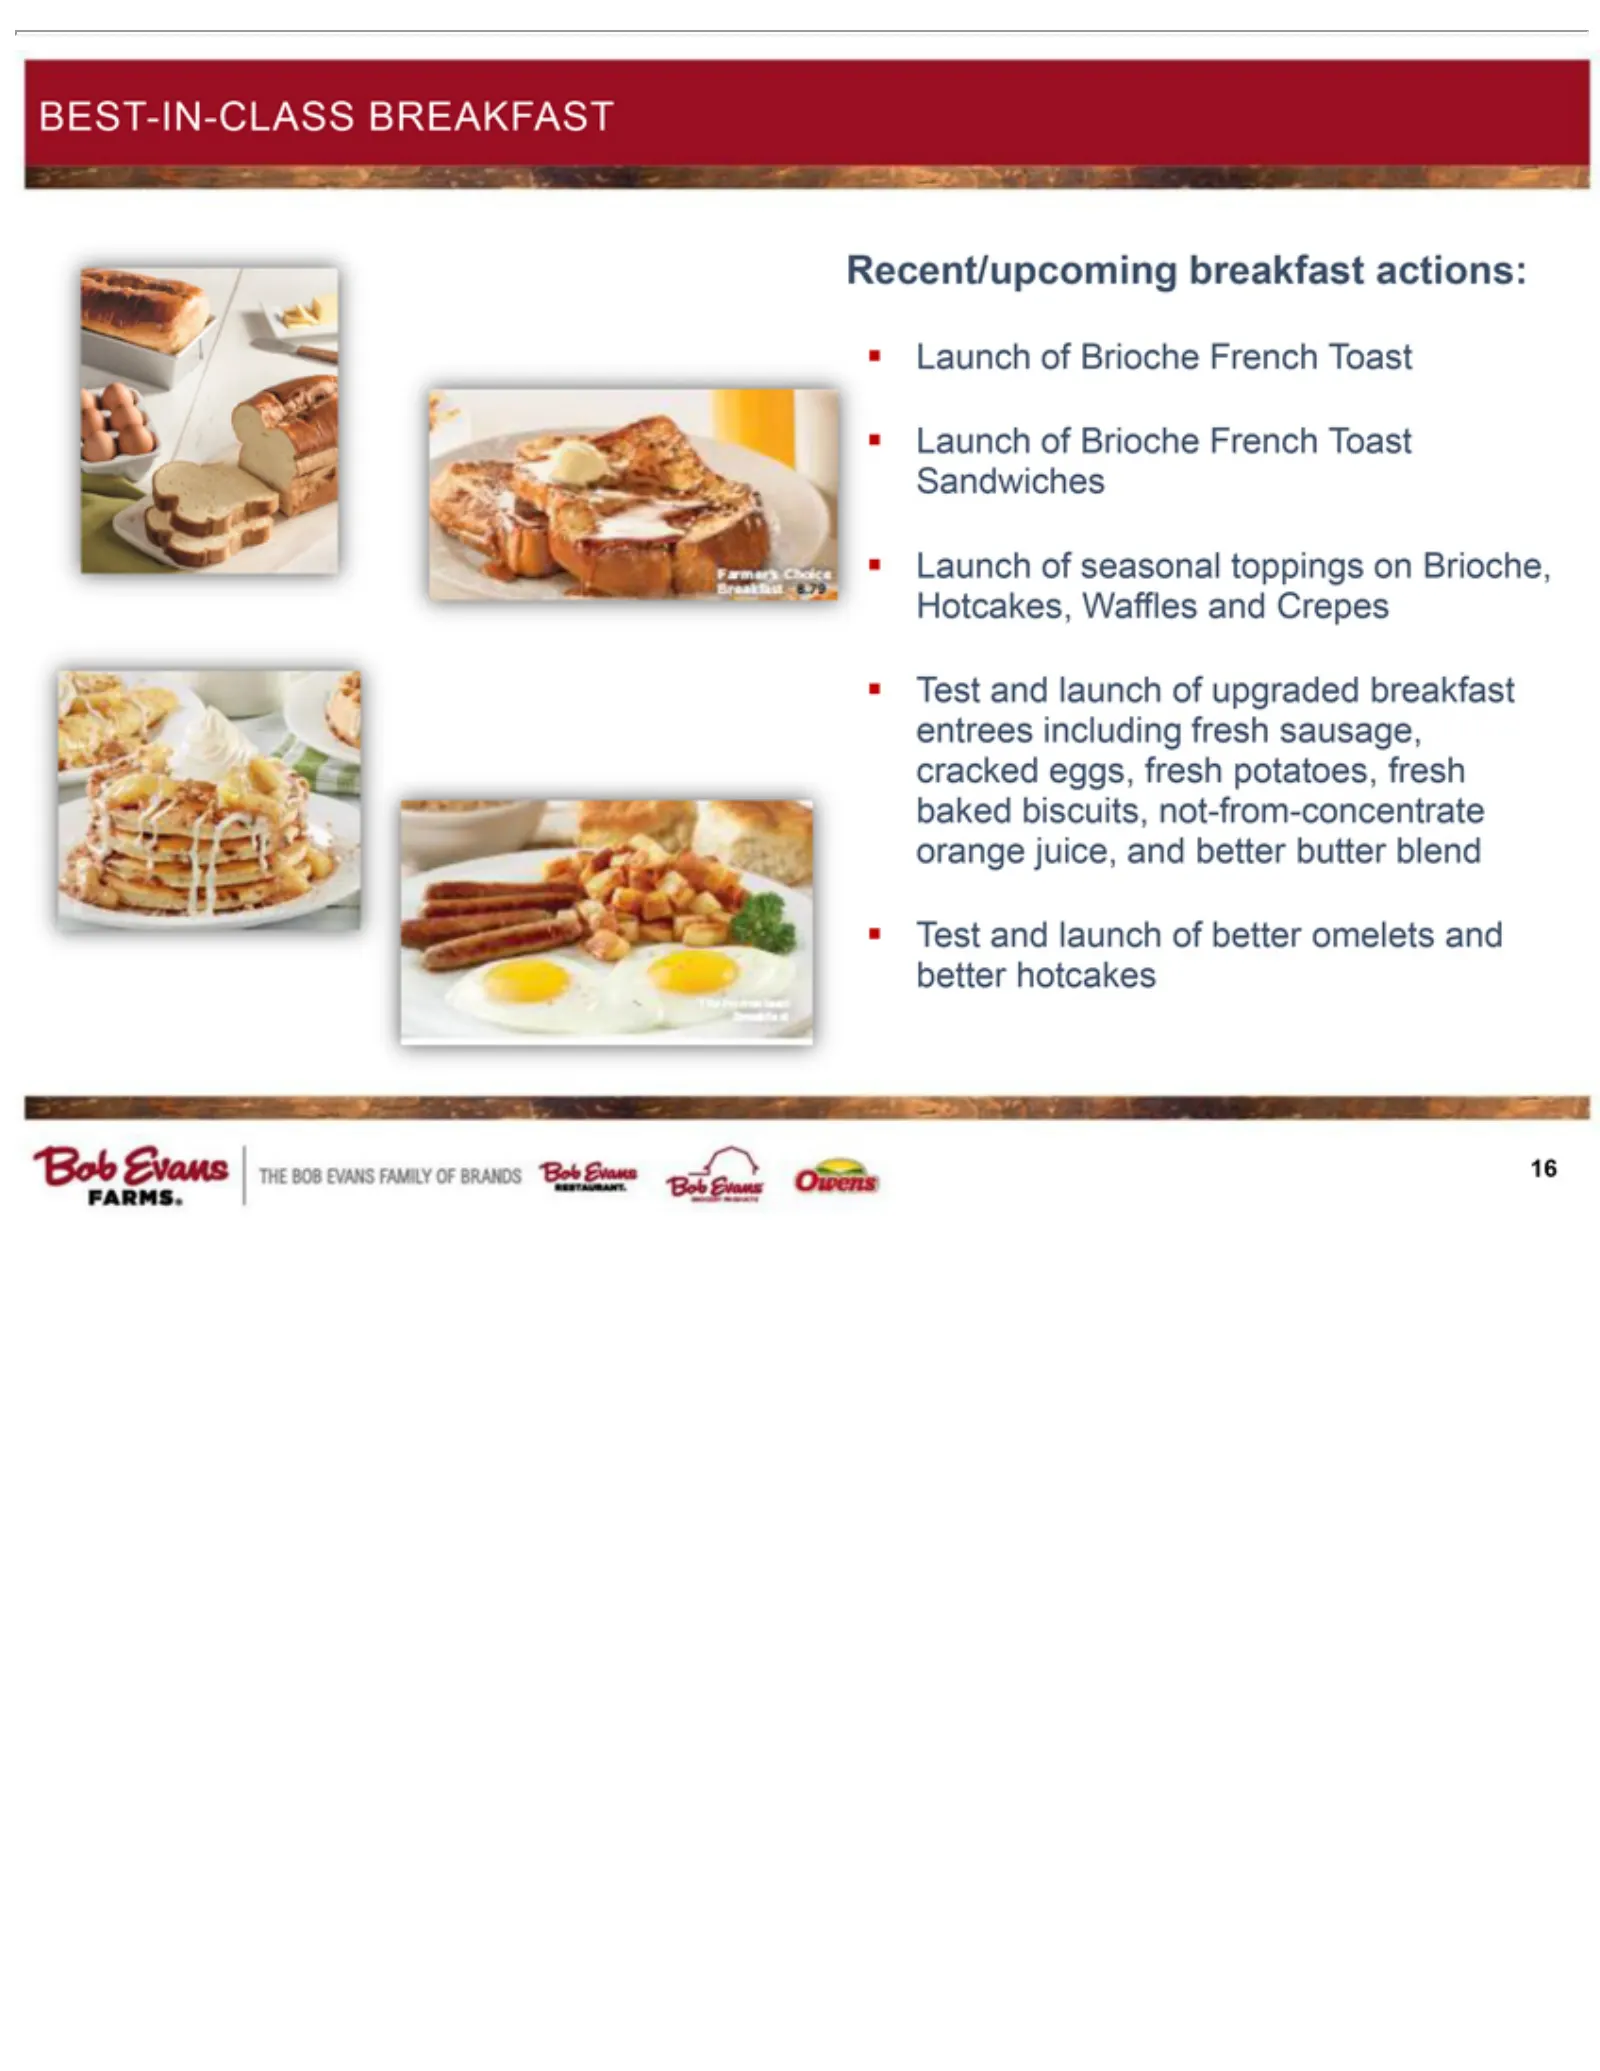
BEST-IN-CLASS Recent/upcoming Launch Test 16 andoflaunch Brioche seasonal ofbreakfast BREAKFAST upgraded better French toppings omelets Toast actions: breakfast on Brioche, Sandwiches and better entrees Hotcakes, hotcakes including Waffles freshand sausage, Crepescracked eggs, fresh potatoes, fresh
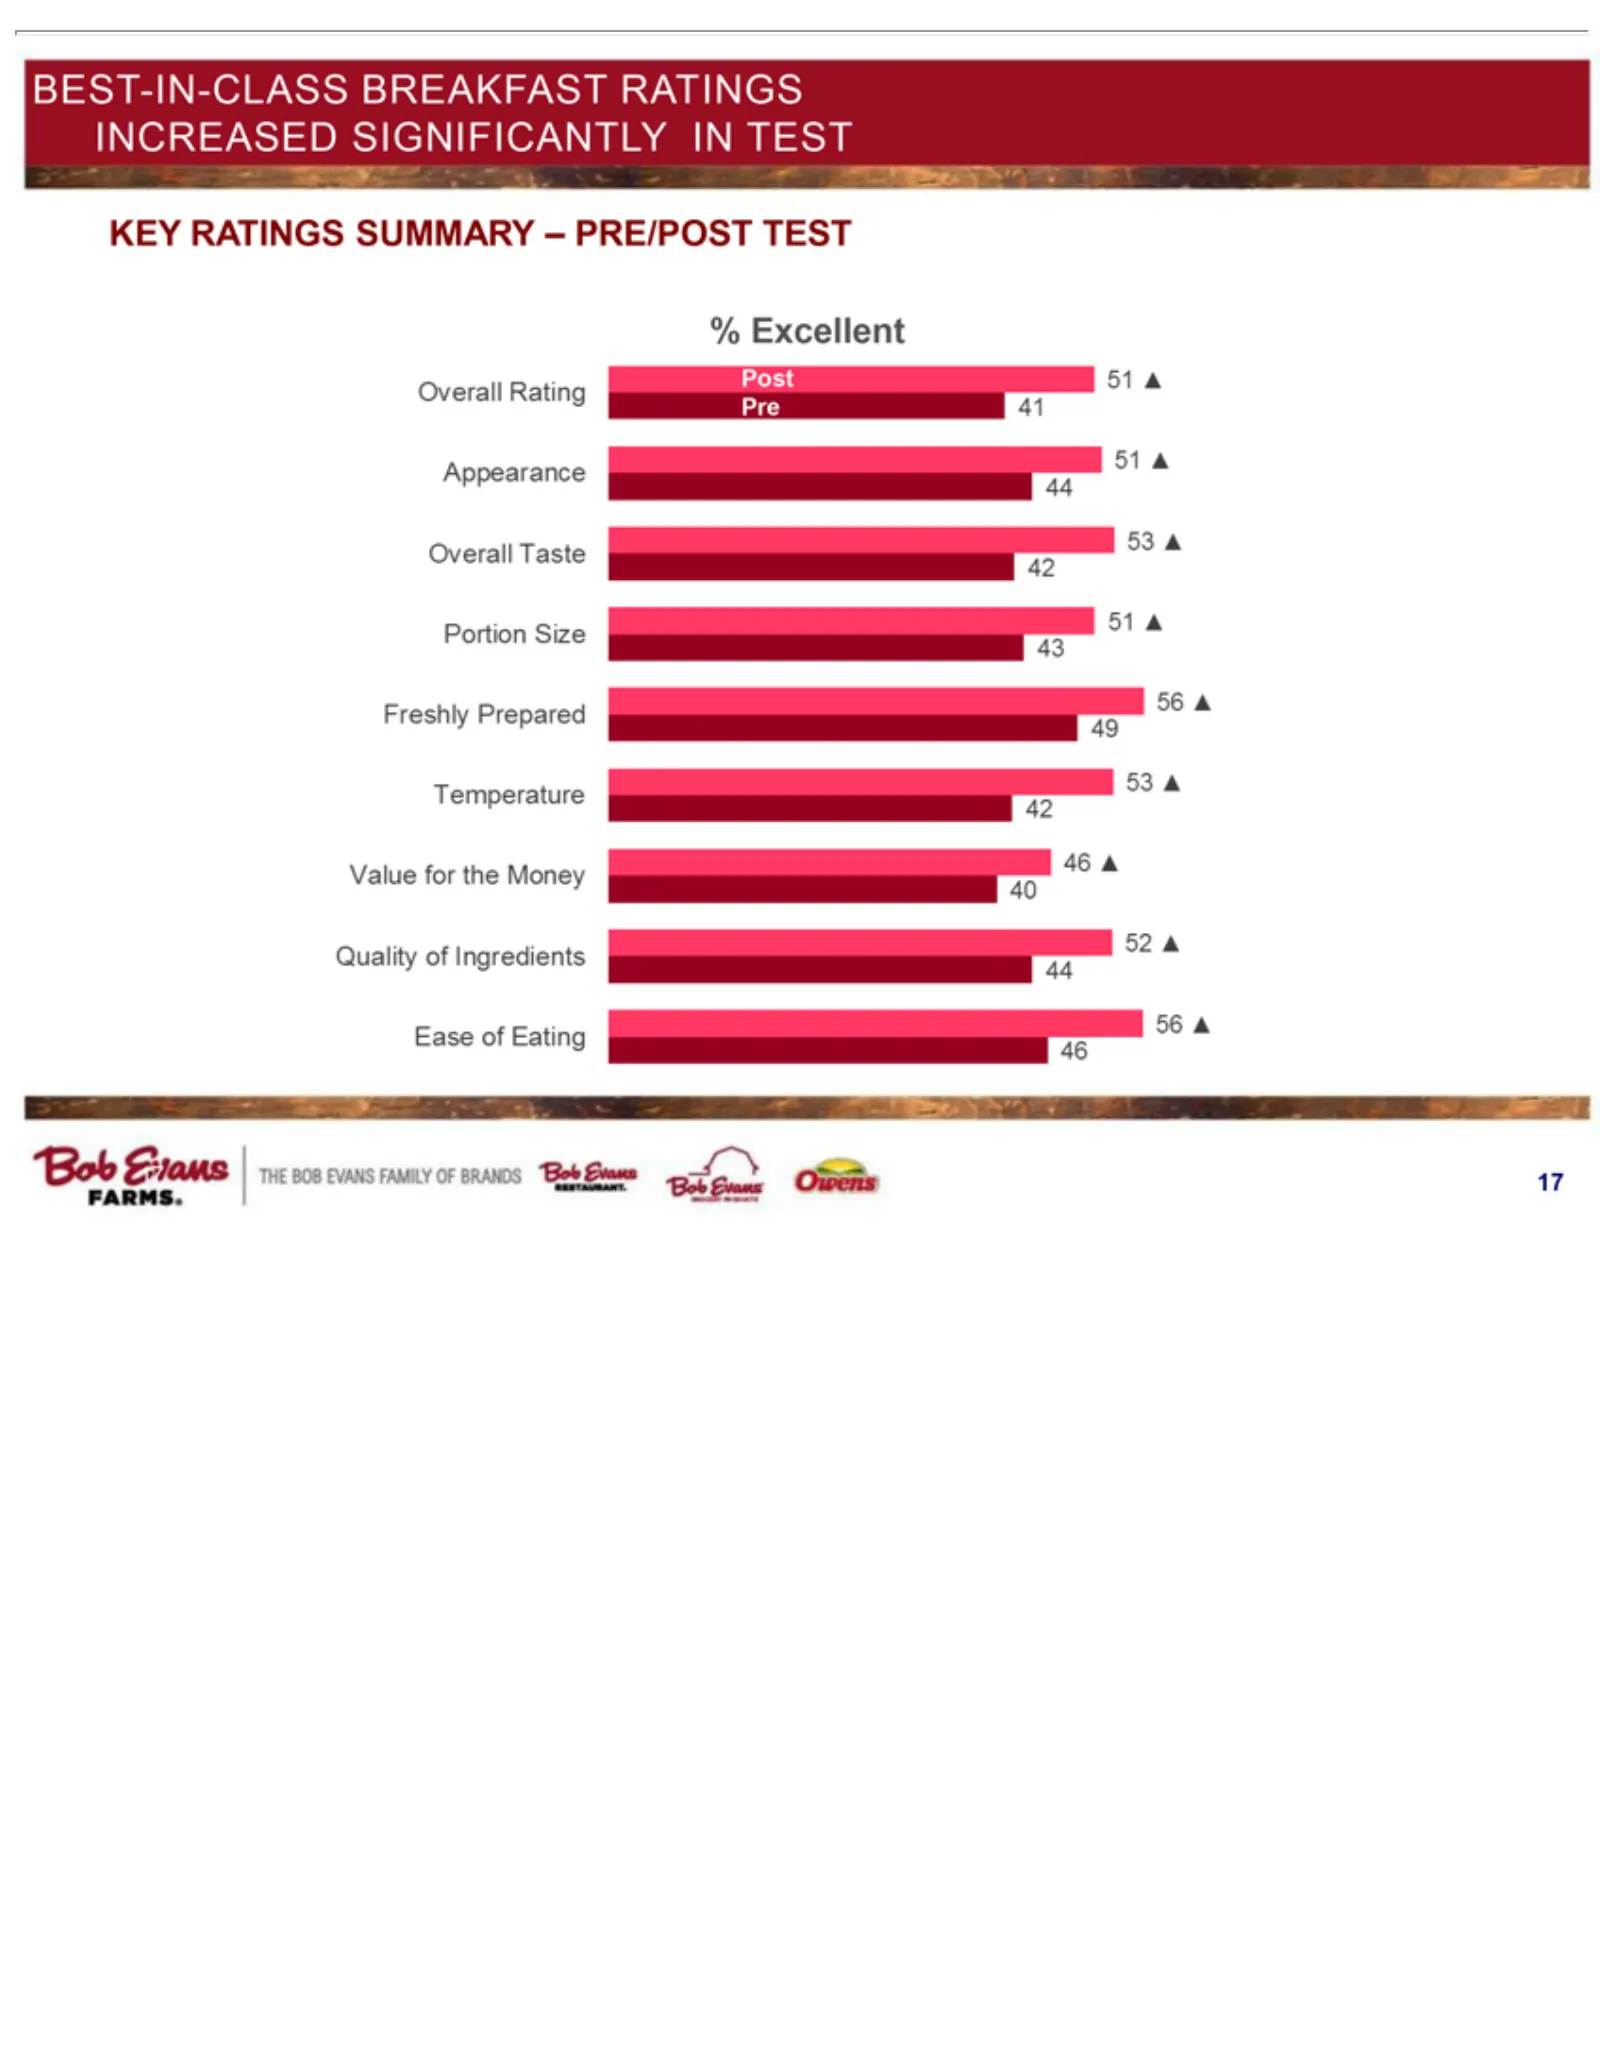
Slide 17: Best-in-Class Breakfast: Pre/Post Test Ratings
BEST-IN-CLASS KEY % Appearance Overall Portion Freshly Temperature Value Quality Ease 17 Excellent of RATINGS forSize Eating Taste Rating of Prepared the Ingredients 51 51 53 Money 5356 Post 44 43 42 SUMMARY 42 56 46 BREAKFAST 51 49 4652 Pre 404441 – PRE/POST RATINGSTEST INCREASED SIGNIFICANTLY IN T
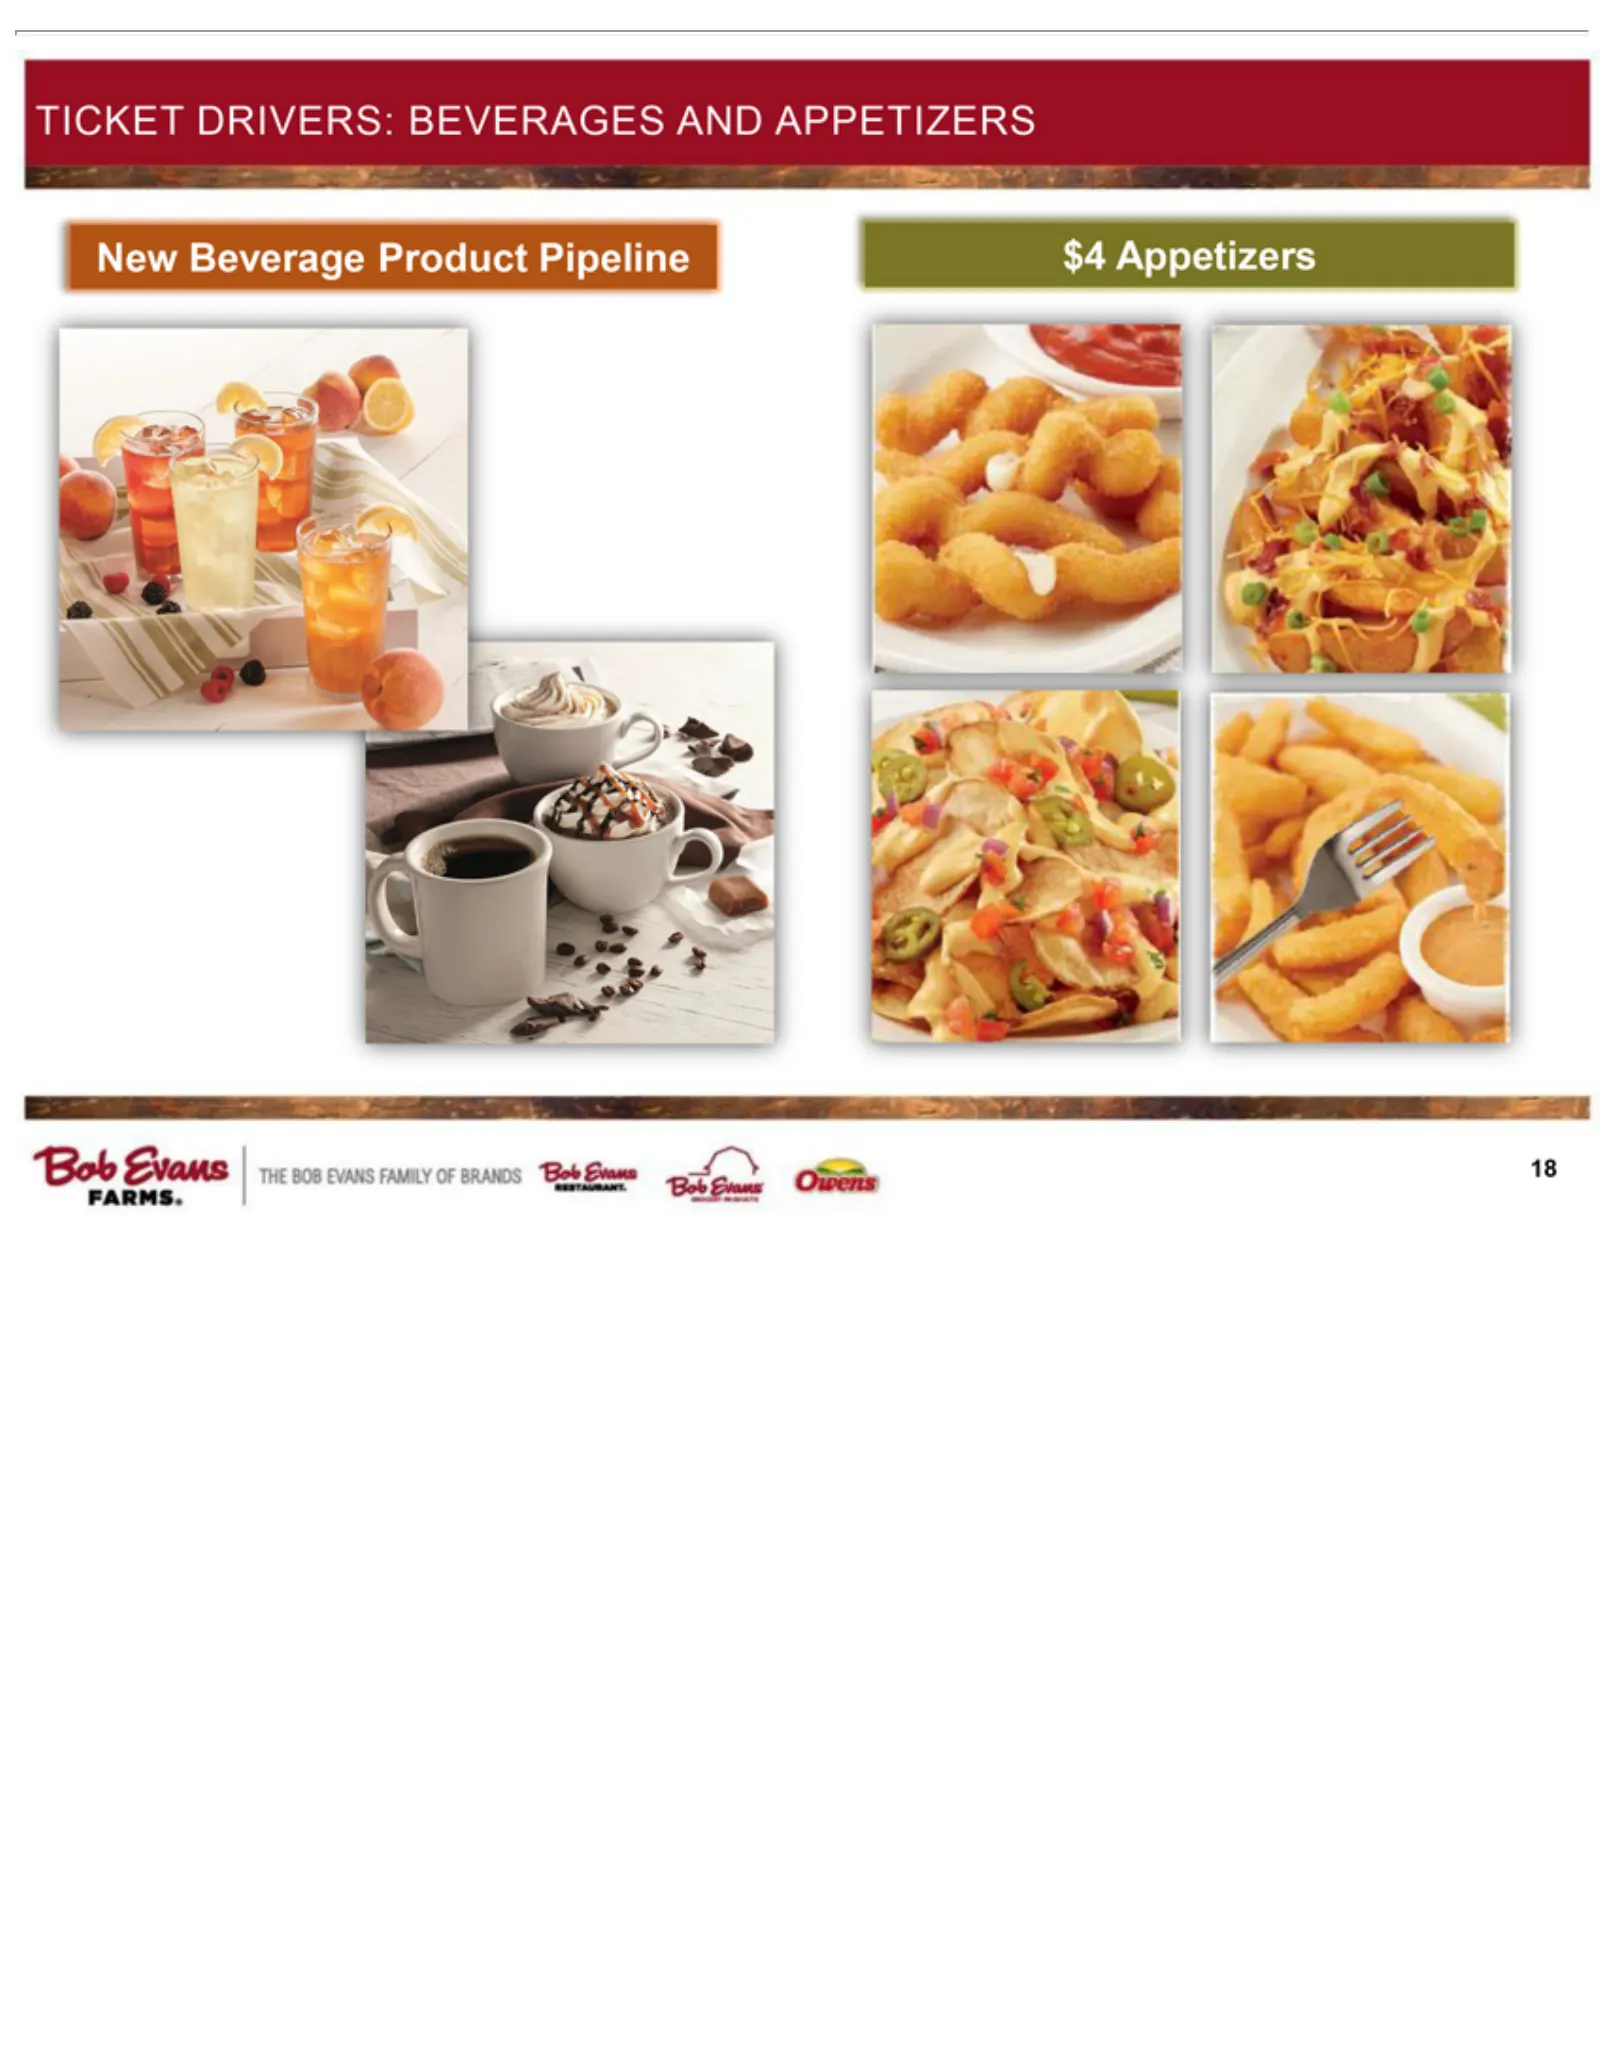
Slide 18: Ticket Drivers: Beverages and Appetizers
TICKET New $4 18 Appetizers Beverage DRIVERS: Product BEVERAGES Pipeline AND APPETIZERS
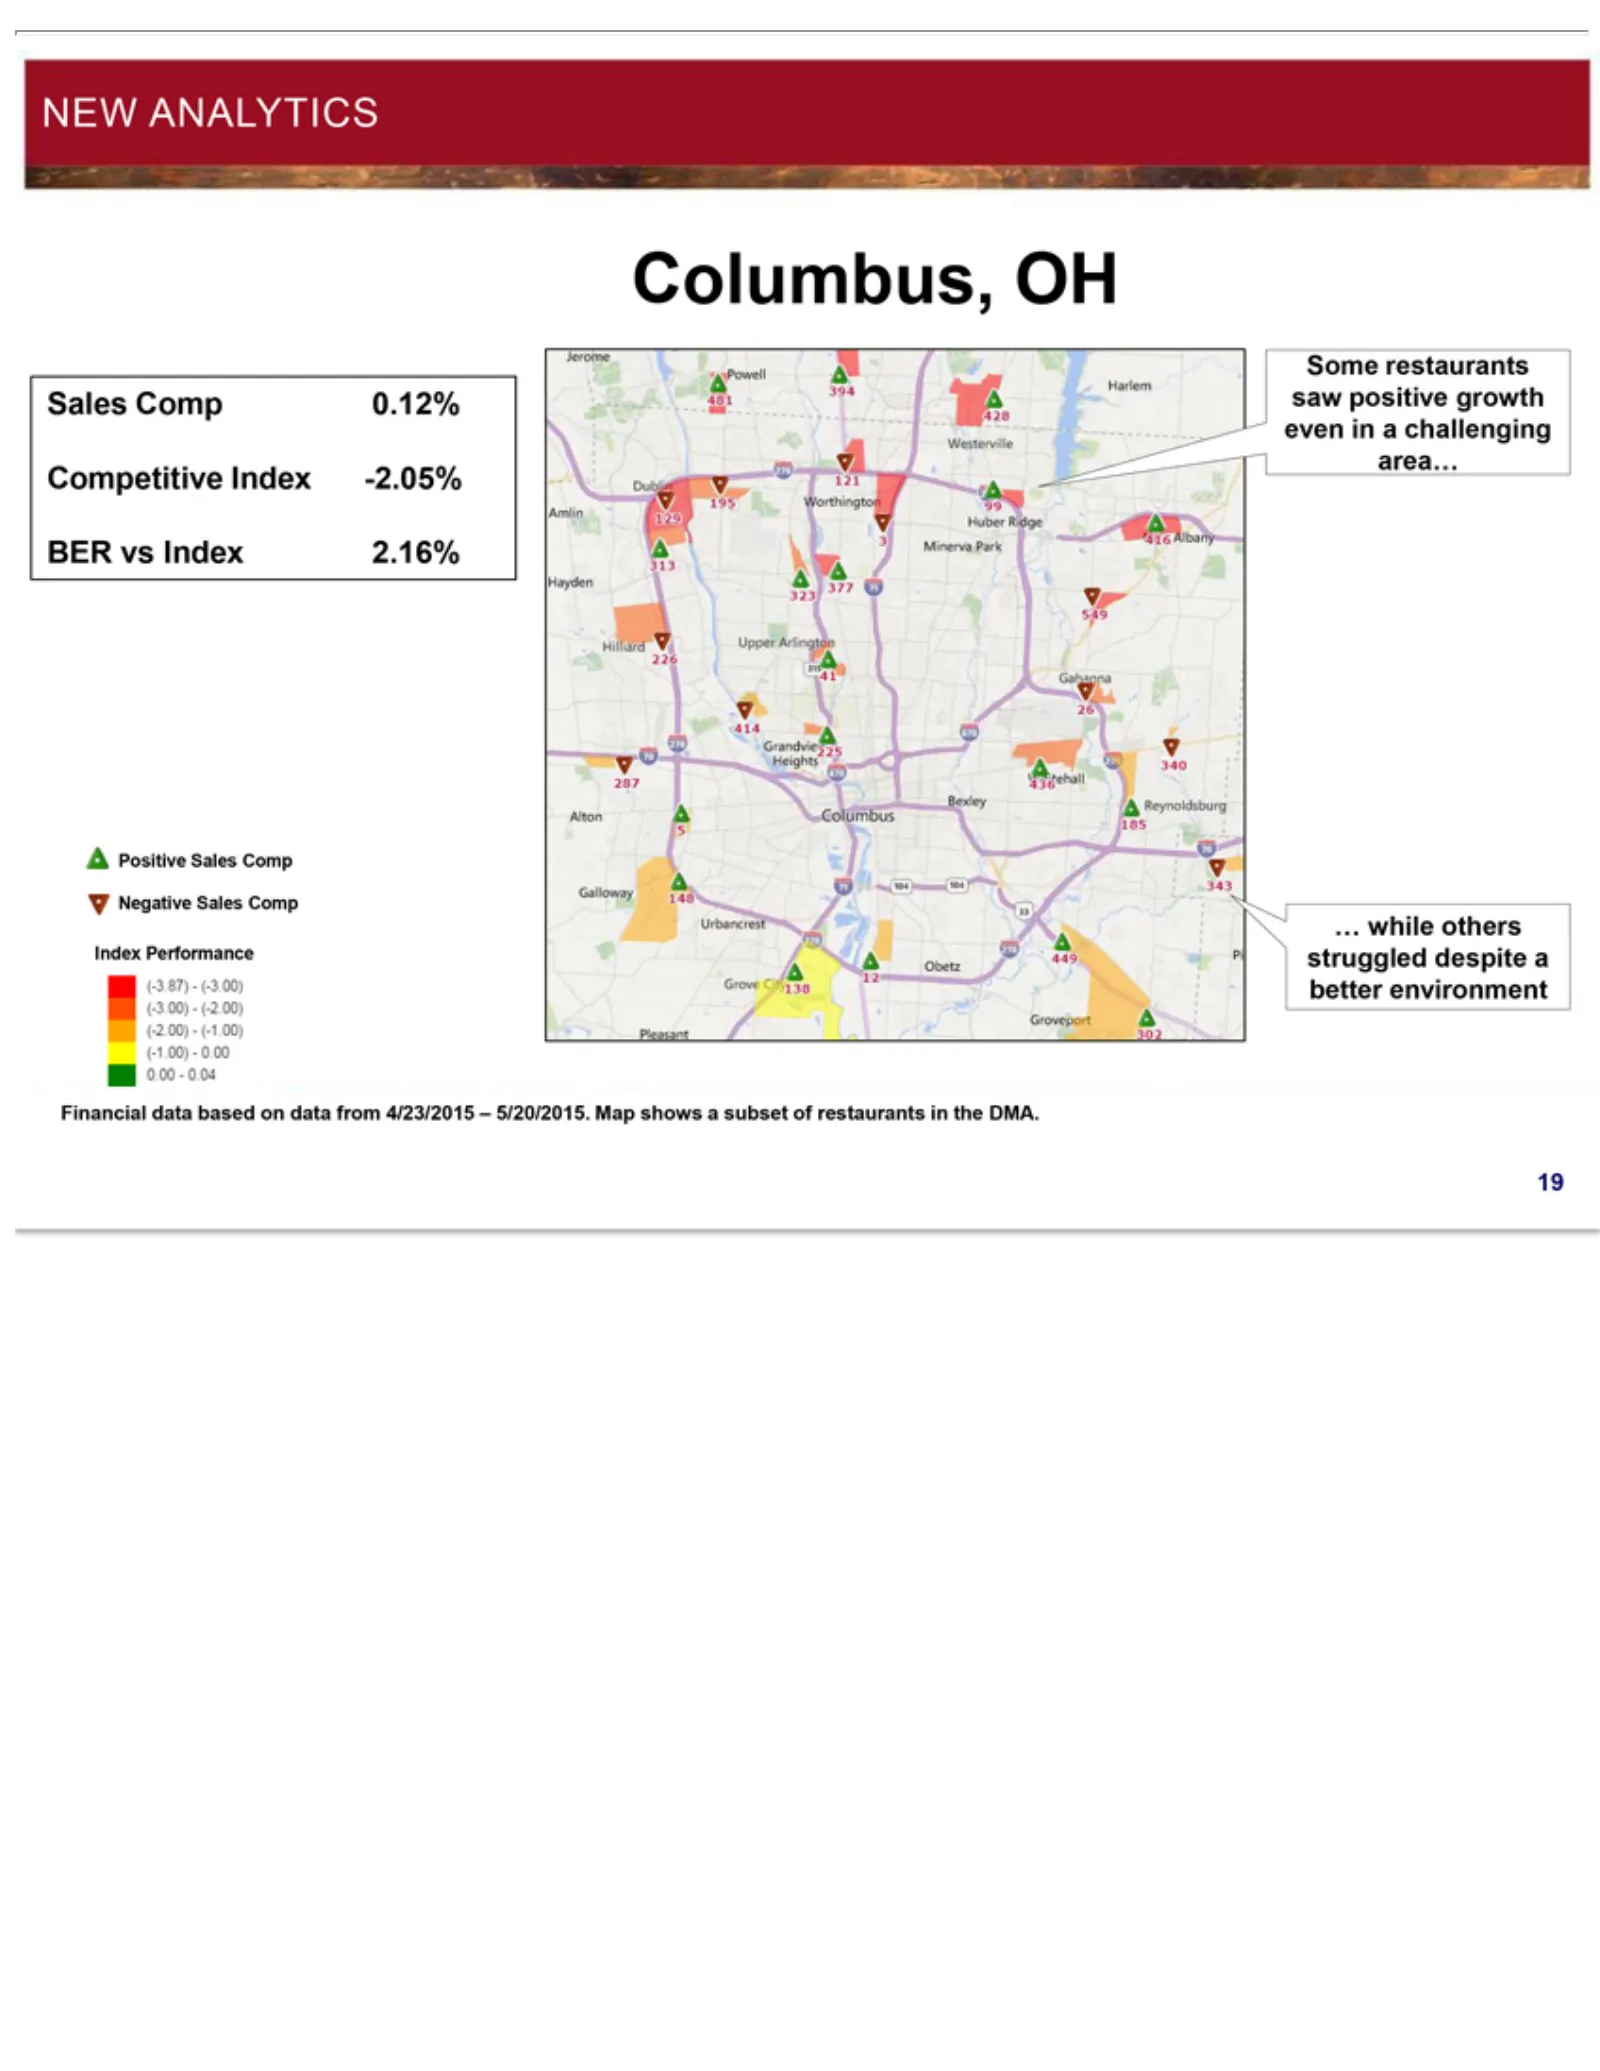
Slide 19: New Analytics: Columbus, OH Sales Index
NEW Columbus, Sales Competitive BER Some Positive Negative Index … Financial 19 while vs Comp ANALYTICS Performance restaurants Index Sales others Sales data OH0.12% Index Comp 2.16% based Comp struggled saw -2.05% onpositive data despite from growth a4/23/2015 better evenenvironment in–a5/20/2015.
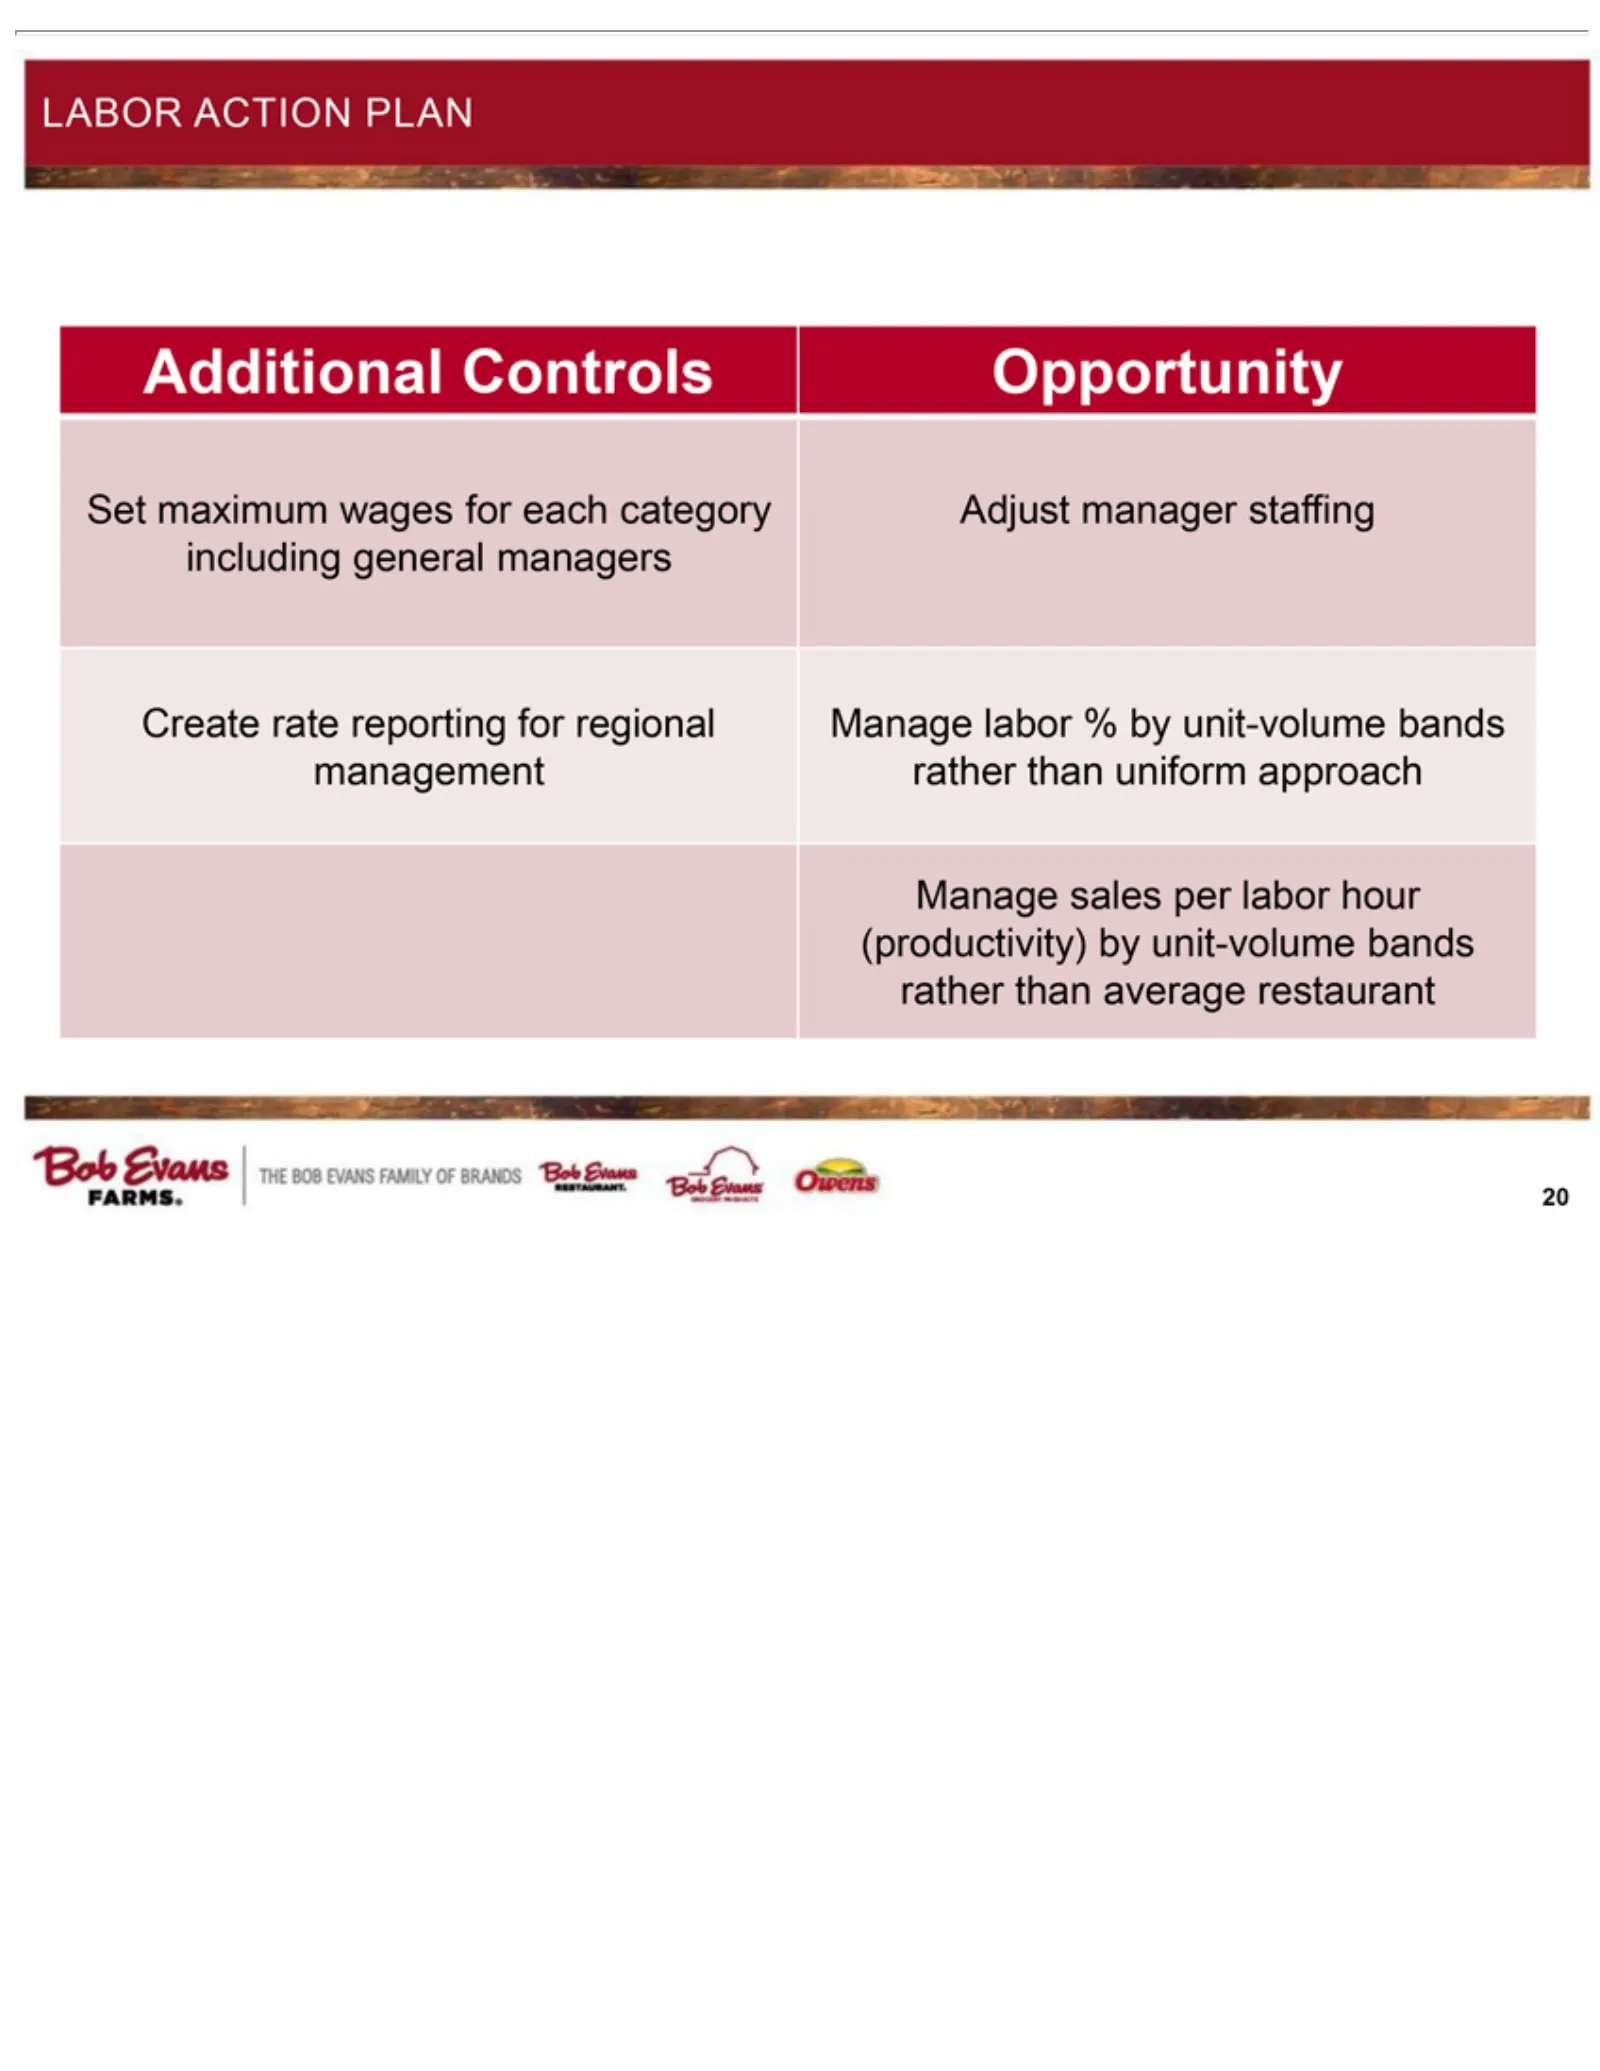
Slide 20: Labor Opportunity and Action Plan
LABOR Additional Set Opportunity Adjust Create Manage 20 maximum rate manager labor ACTION Controls reporting % wages staffing byPLAN unit-volume for regional each category bands management including rather thangeneral uniformmanagers approach Manage sales per labor hour (productivity) by unit-volum
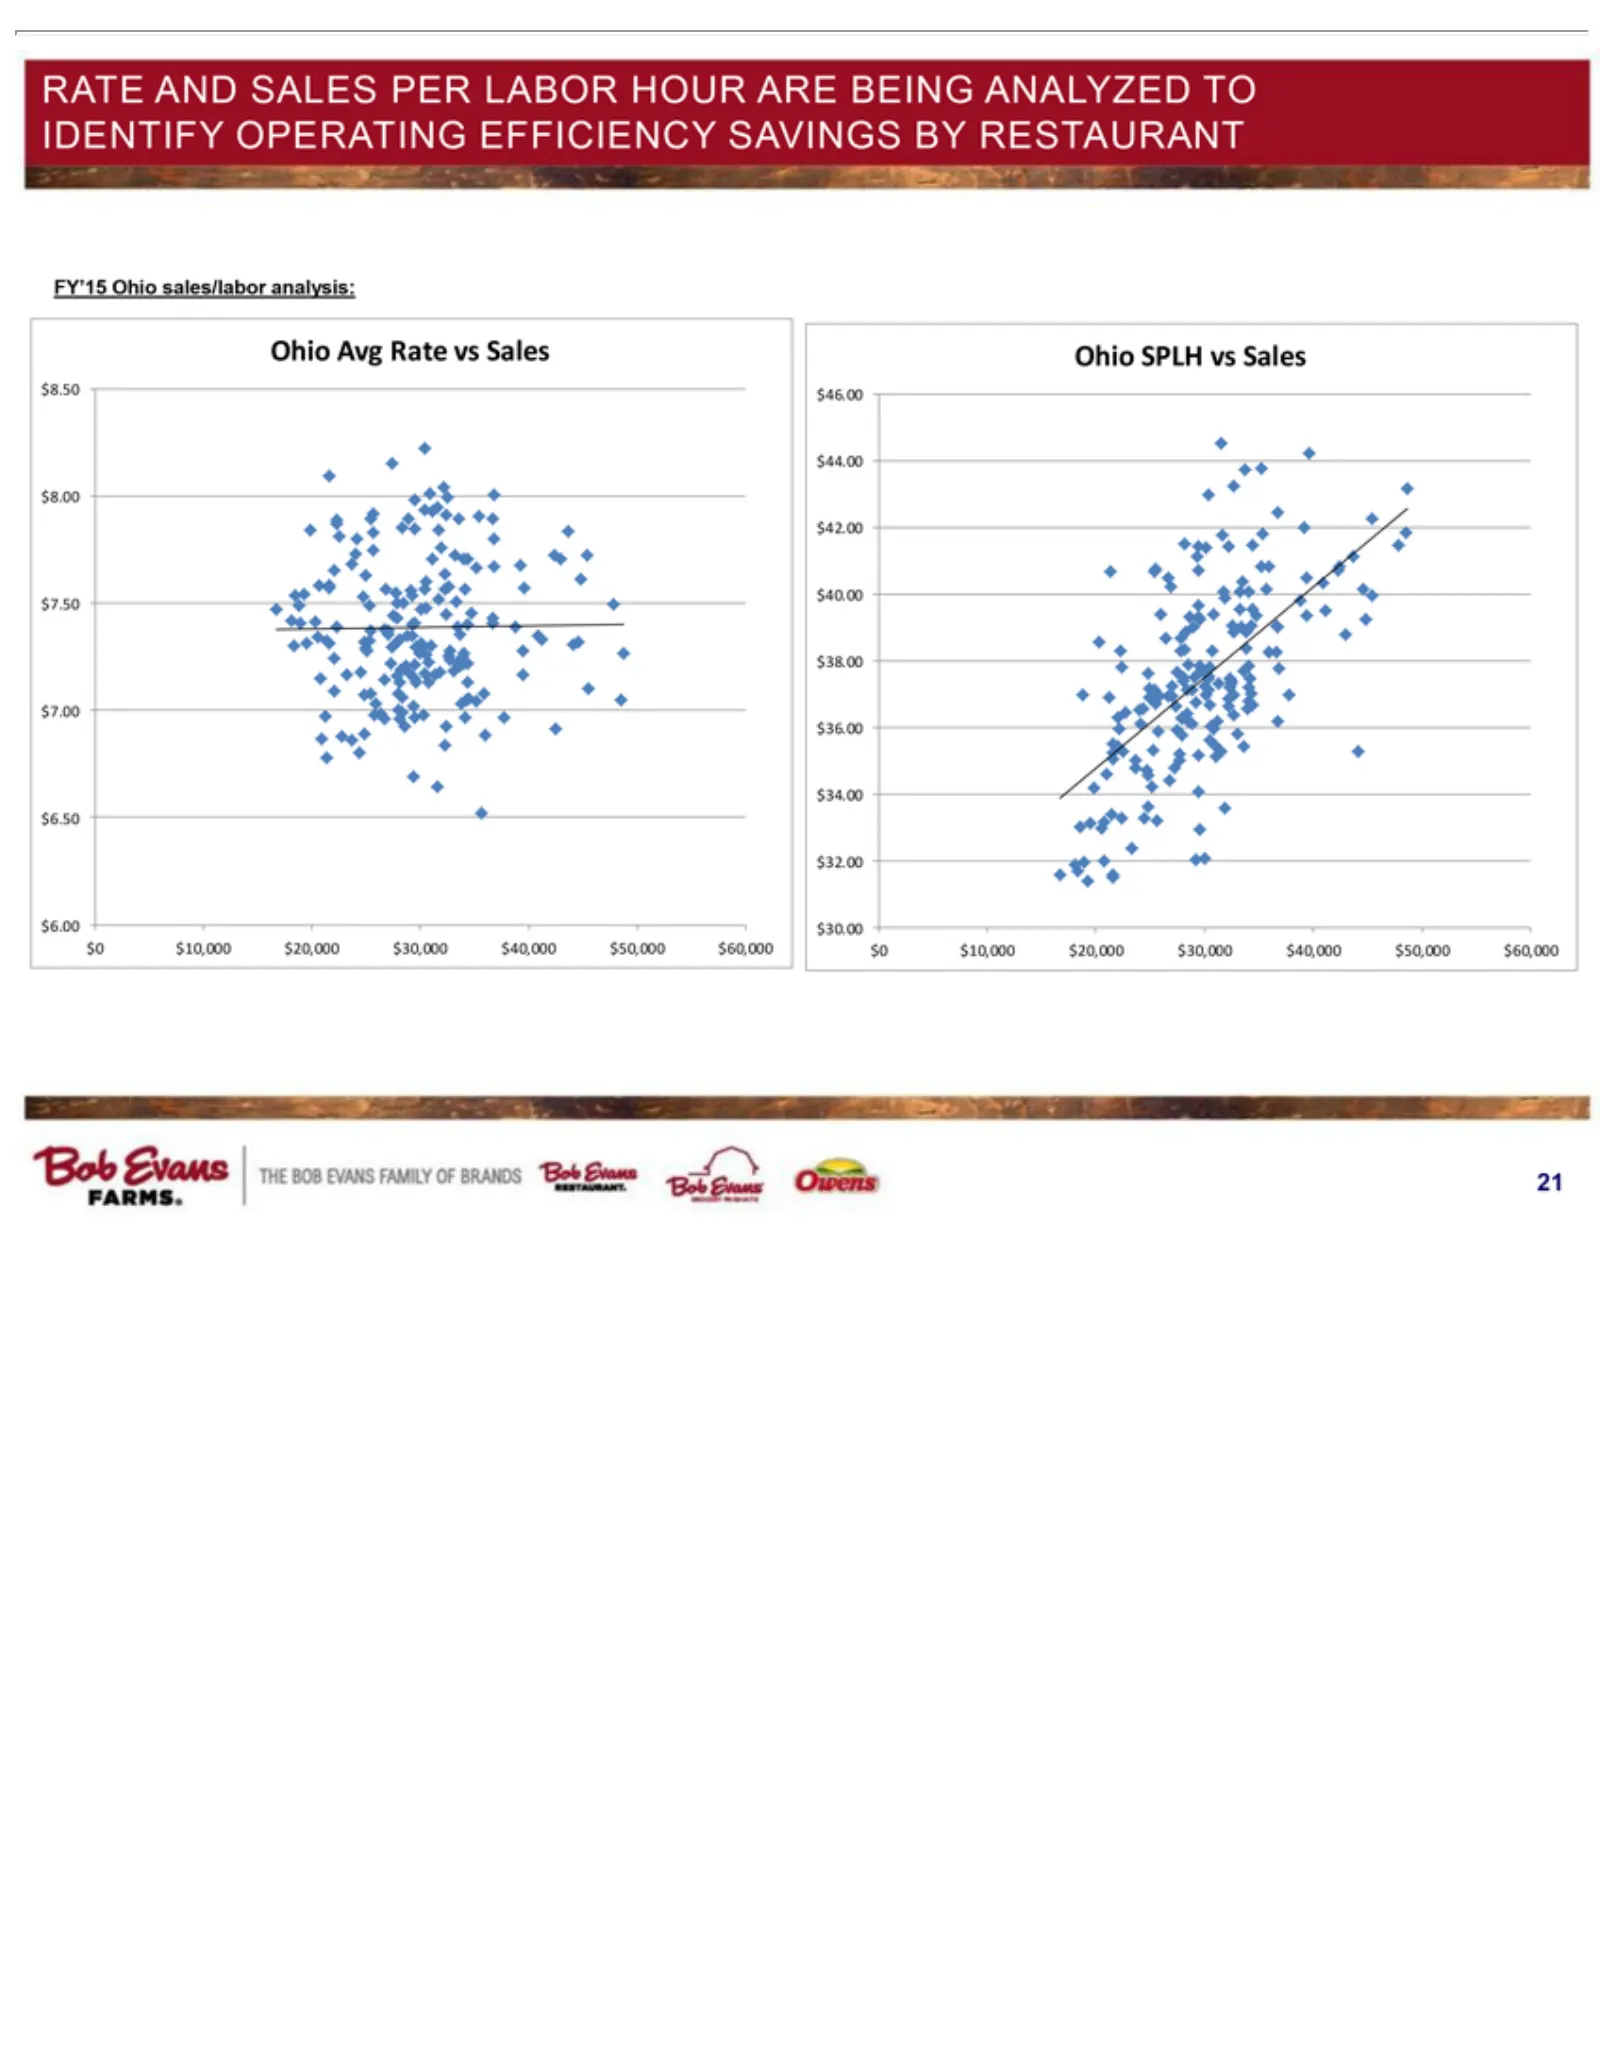
Slide 21: Rate and Sales per Labor Hour Analysis
RATEAvg FY’15 Ohio 21 SPLH AND Ohio Rate vs sales/labor SALES Sales vs Sales PER $30.00 analysis: $6.00 LABOR $32.00 $6.50HOUR $34.00 $7.00 ARE $7.50 $36.00 BEING $8.00 $38.00 $8.50 ANALYZED $40.00 $0 $10,000 $42.00 TO$20,000 $44.00 IDENTIFY $46.00 $30,000 OPERATING $0$40,000 $10,000$50,000 $20,000
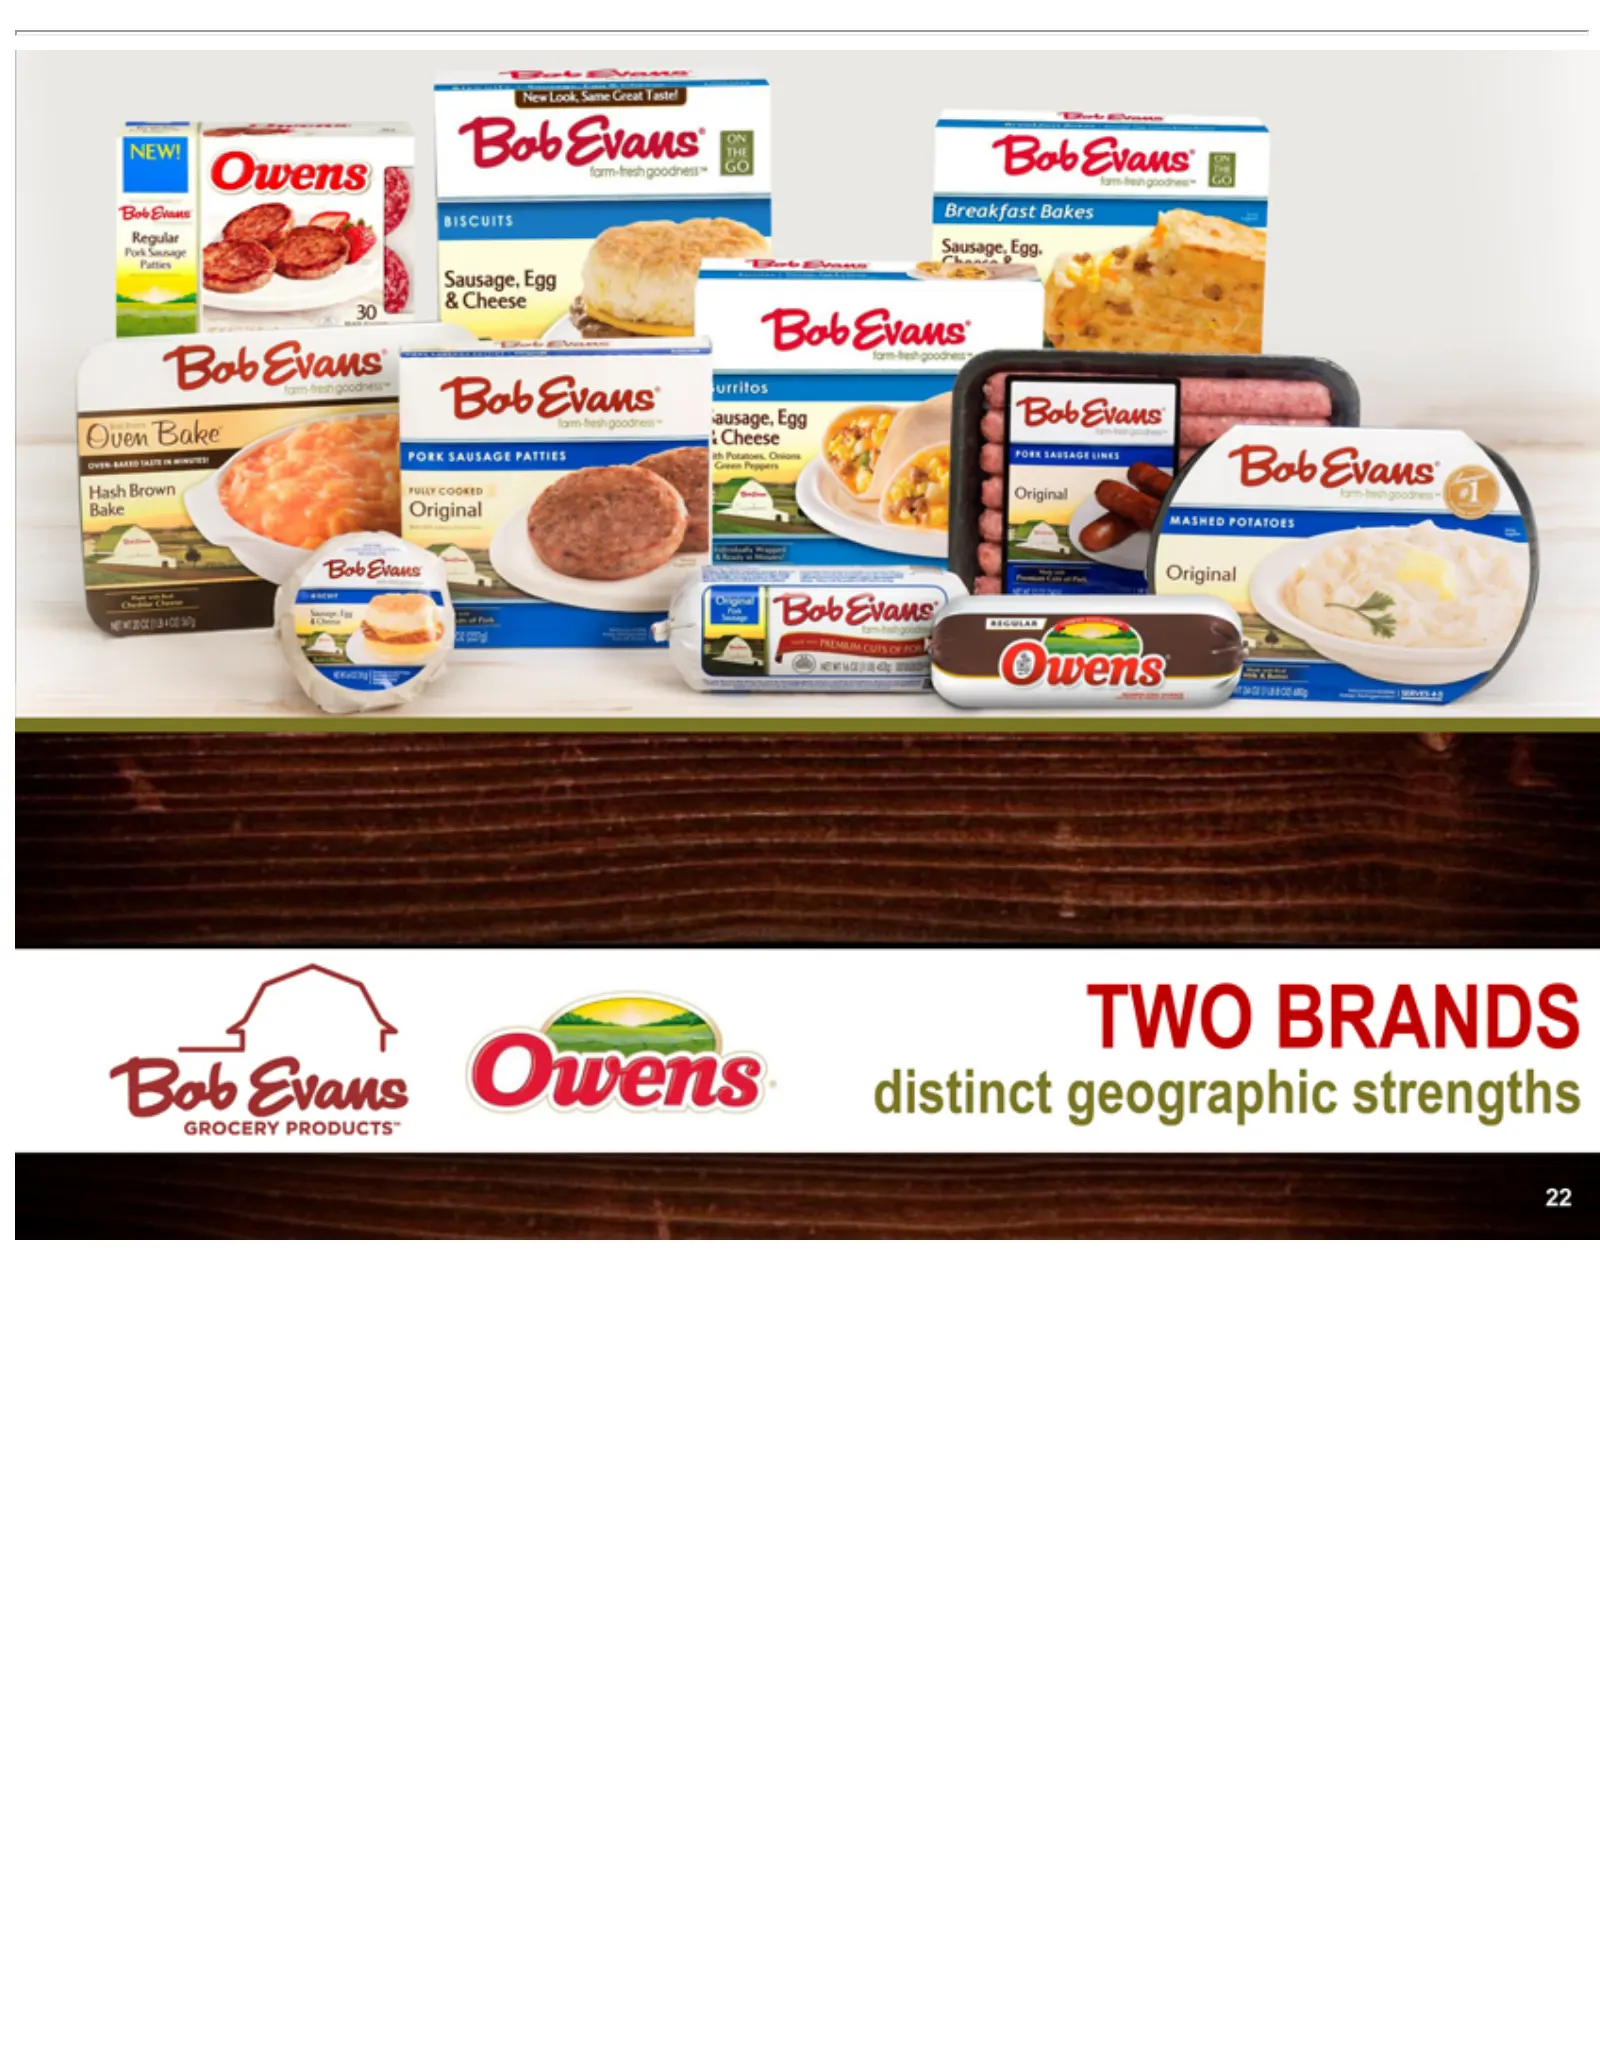
Slide 22: Two Brands, Distinct Geographic Strengths
TWO BRANDS distinct geographic strengths 22
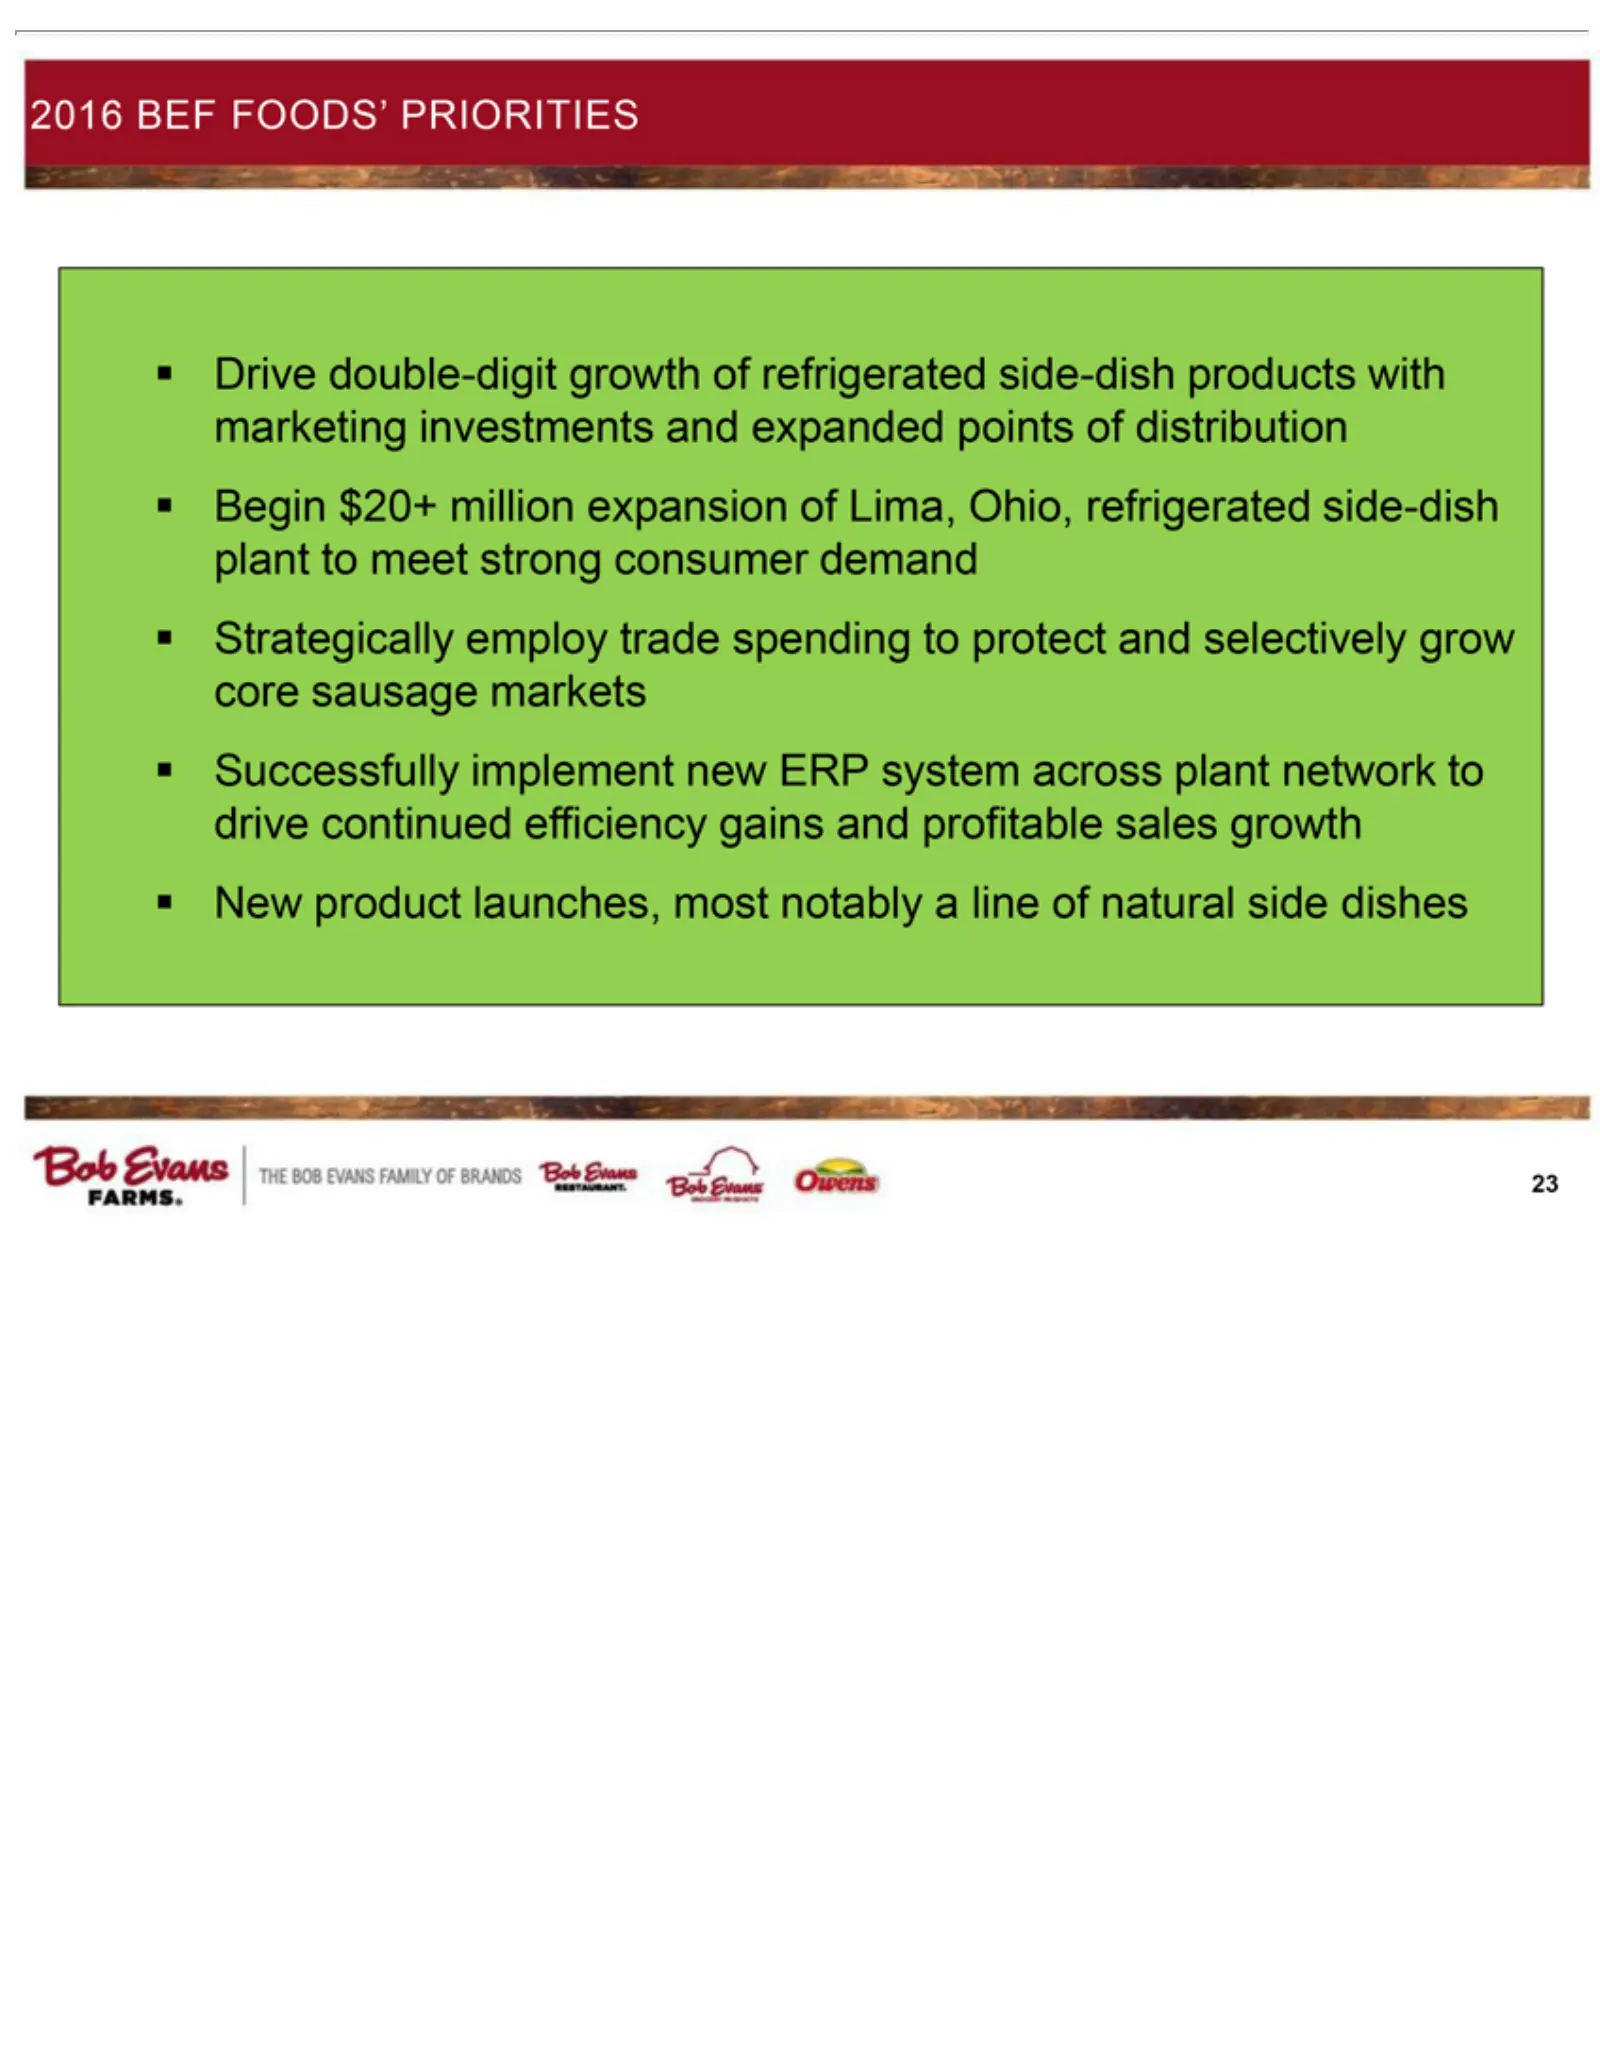
Slide 23: 2016 BEF Foods' Priorities
2016 product Drive Begin Strategically Successfully New 23 BEF double-digit $20+FOODS’ million employ implement launches, growth expansion PRIORITIES trade most new of spending notably ERP refrigerated of Lima, system to a line protect Ohio, side-dish across of natural refrigerated and plant selecti
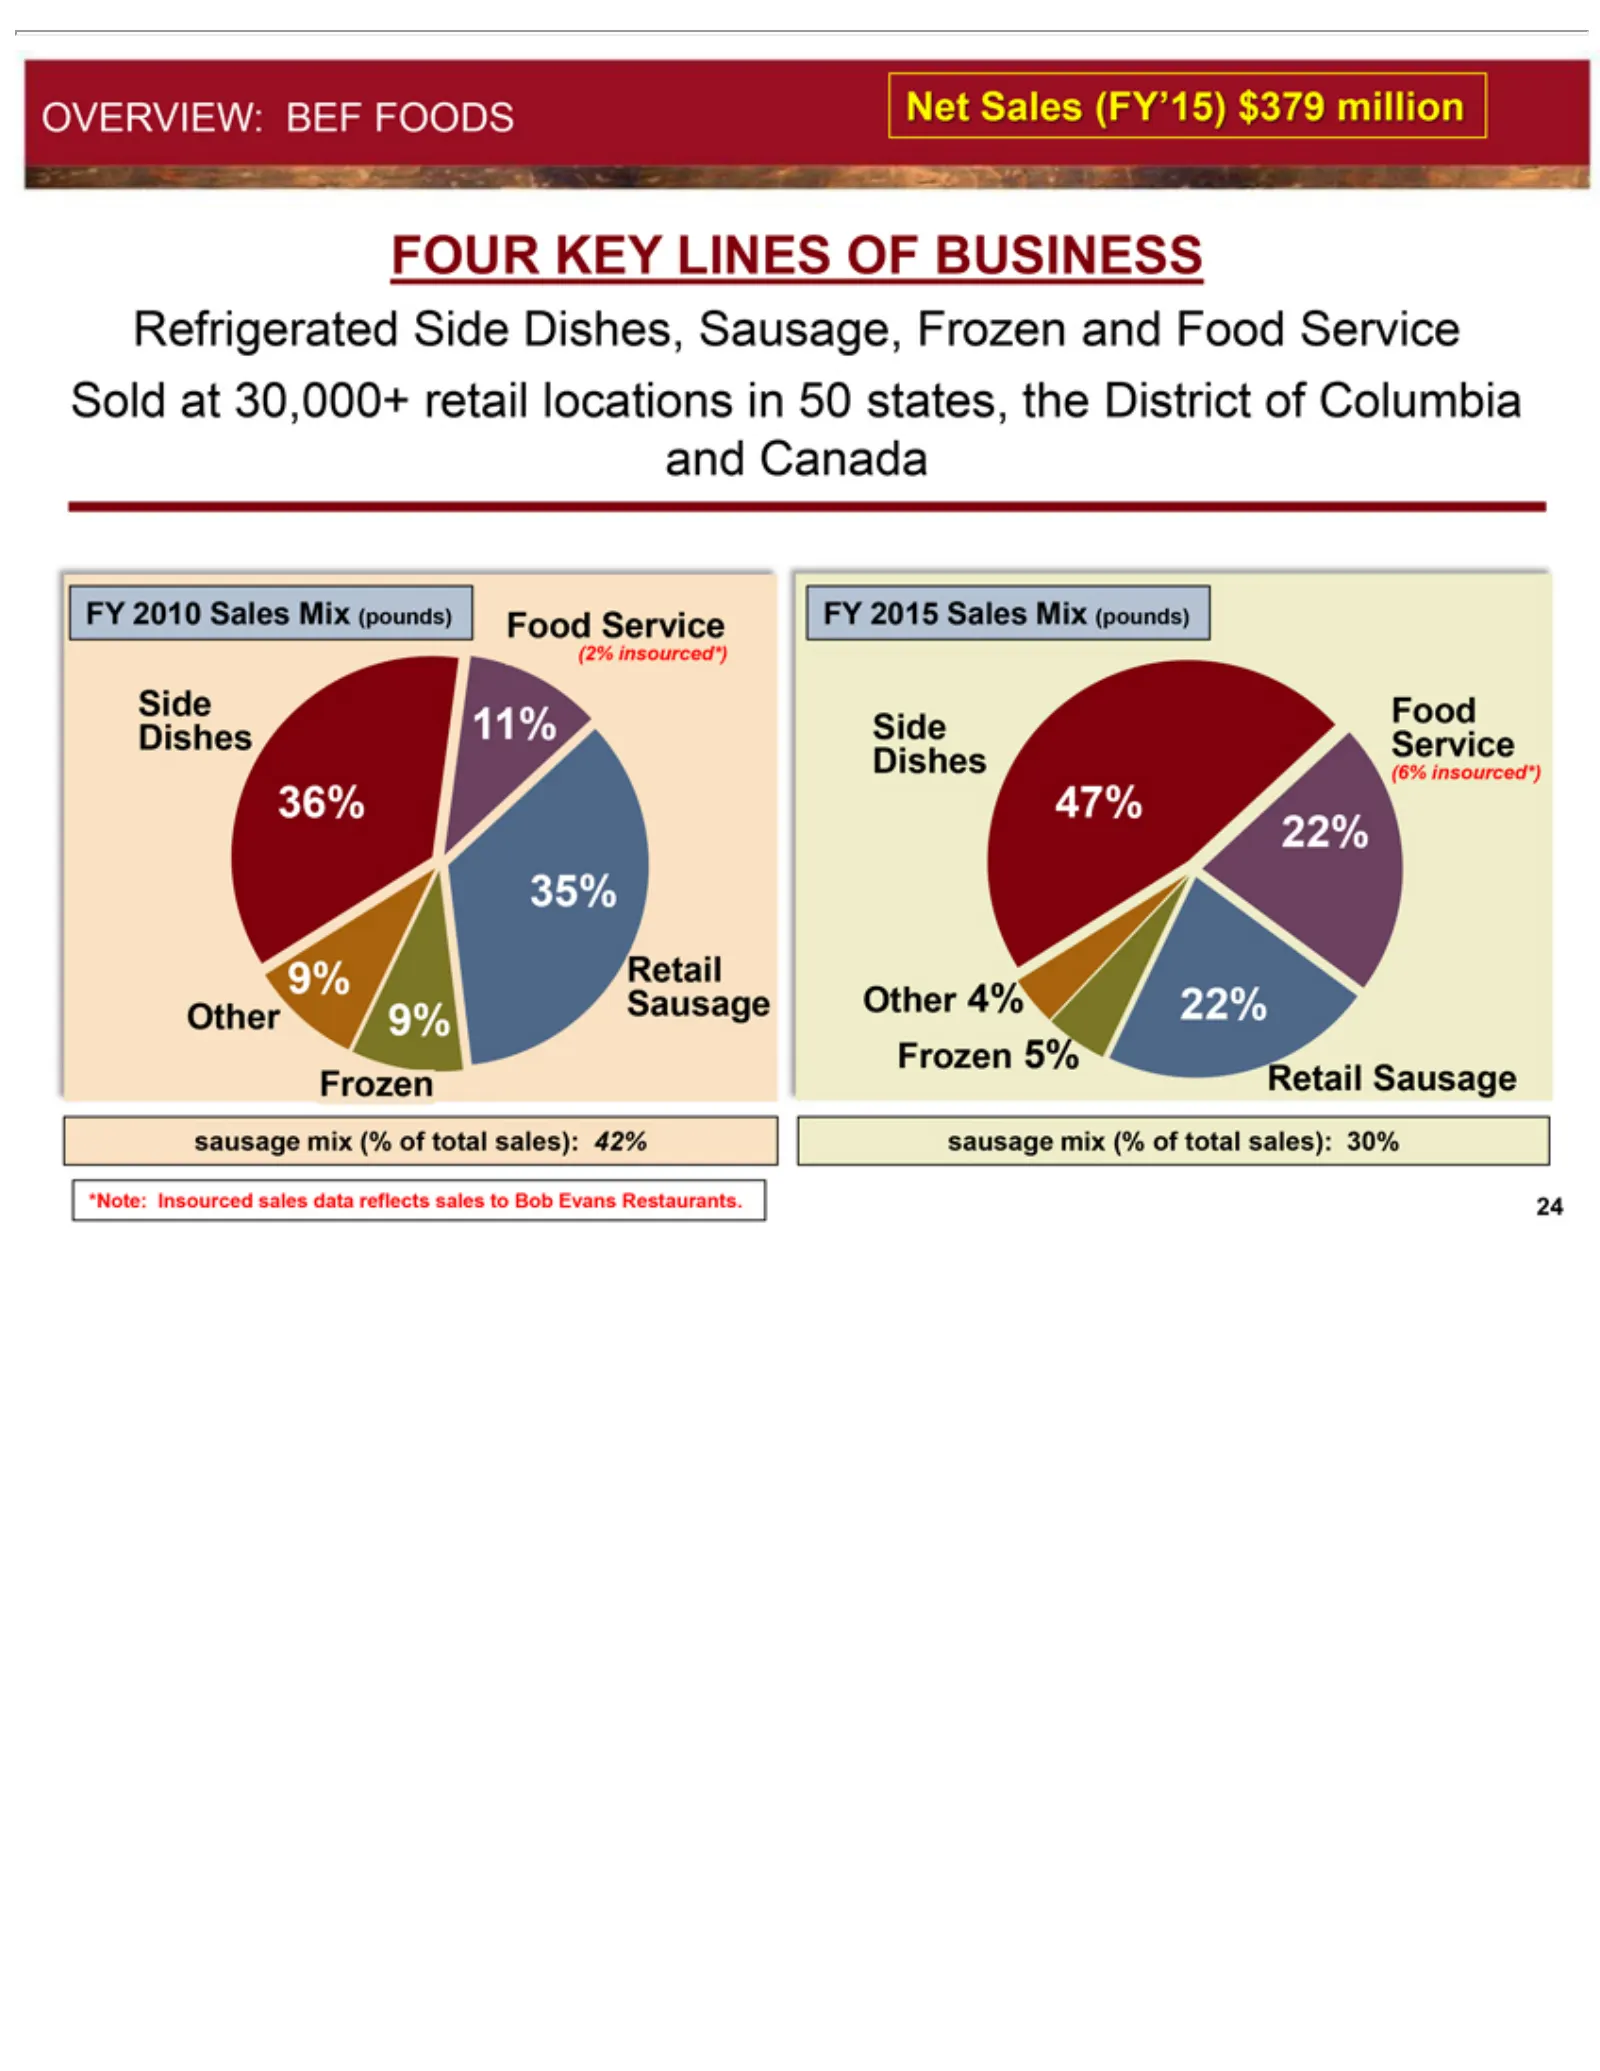
Slide 24: Overview: BEF Foods
OVERVIEW: Net FOUR Refrigerated Sold (2% 35% 11% 9% 36% Sausage FY (6% Service Food Dishes Side Other Frozen Retail sausage 22% 47% *Note: 24 2010 2015 Sales insourced*) atService 4% Sausage KEY Insourced 5% 30,000+ mix Sales (FY’15) (% LINES Side BEF Mix of retail sales Dishes, $379 total FOODS (po
Slide 25: The Big Picture: Today and Tomorrow
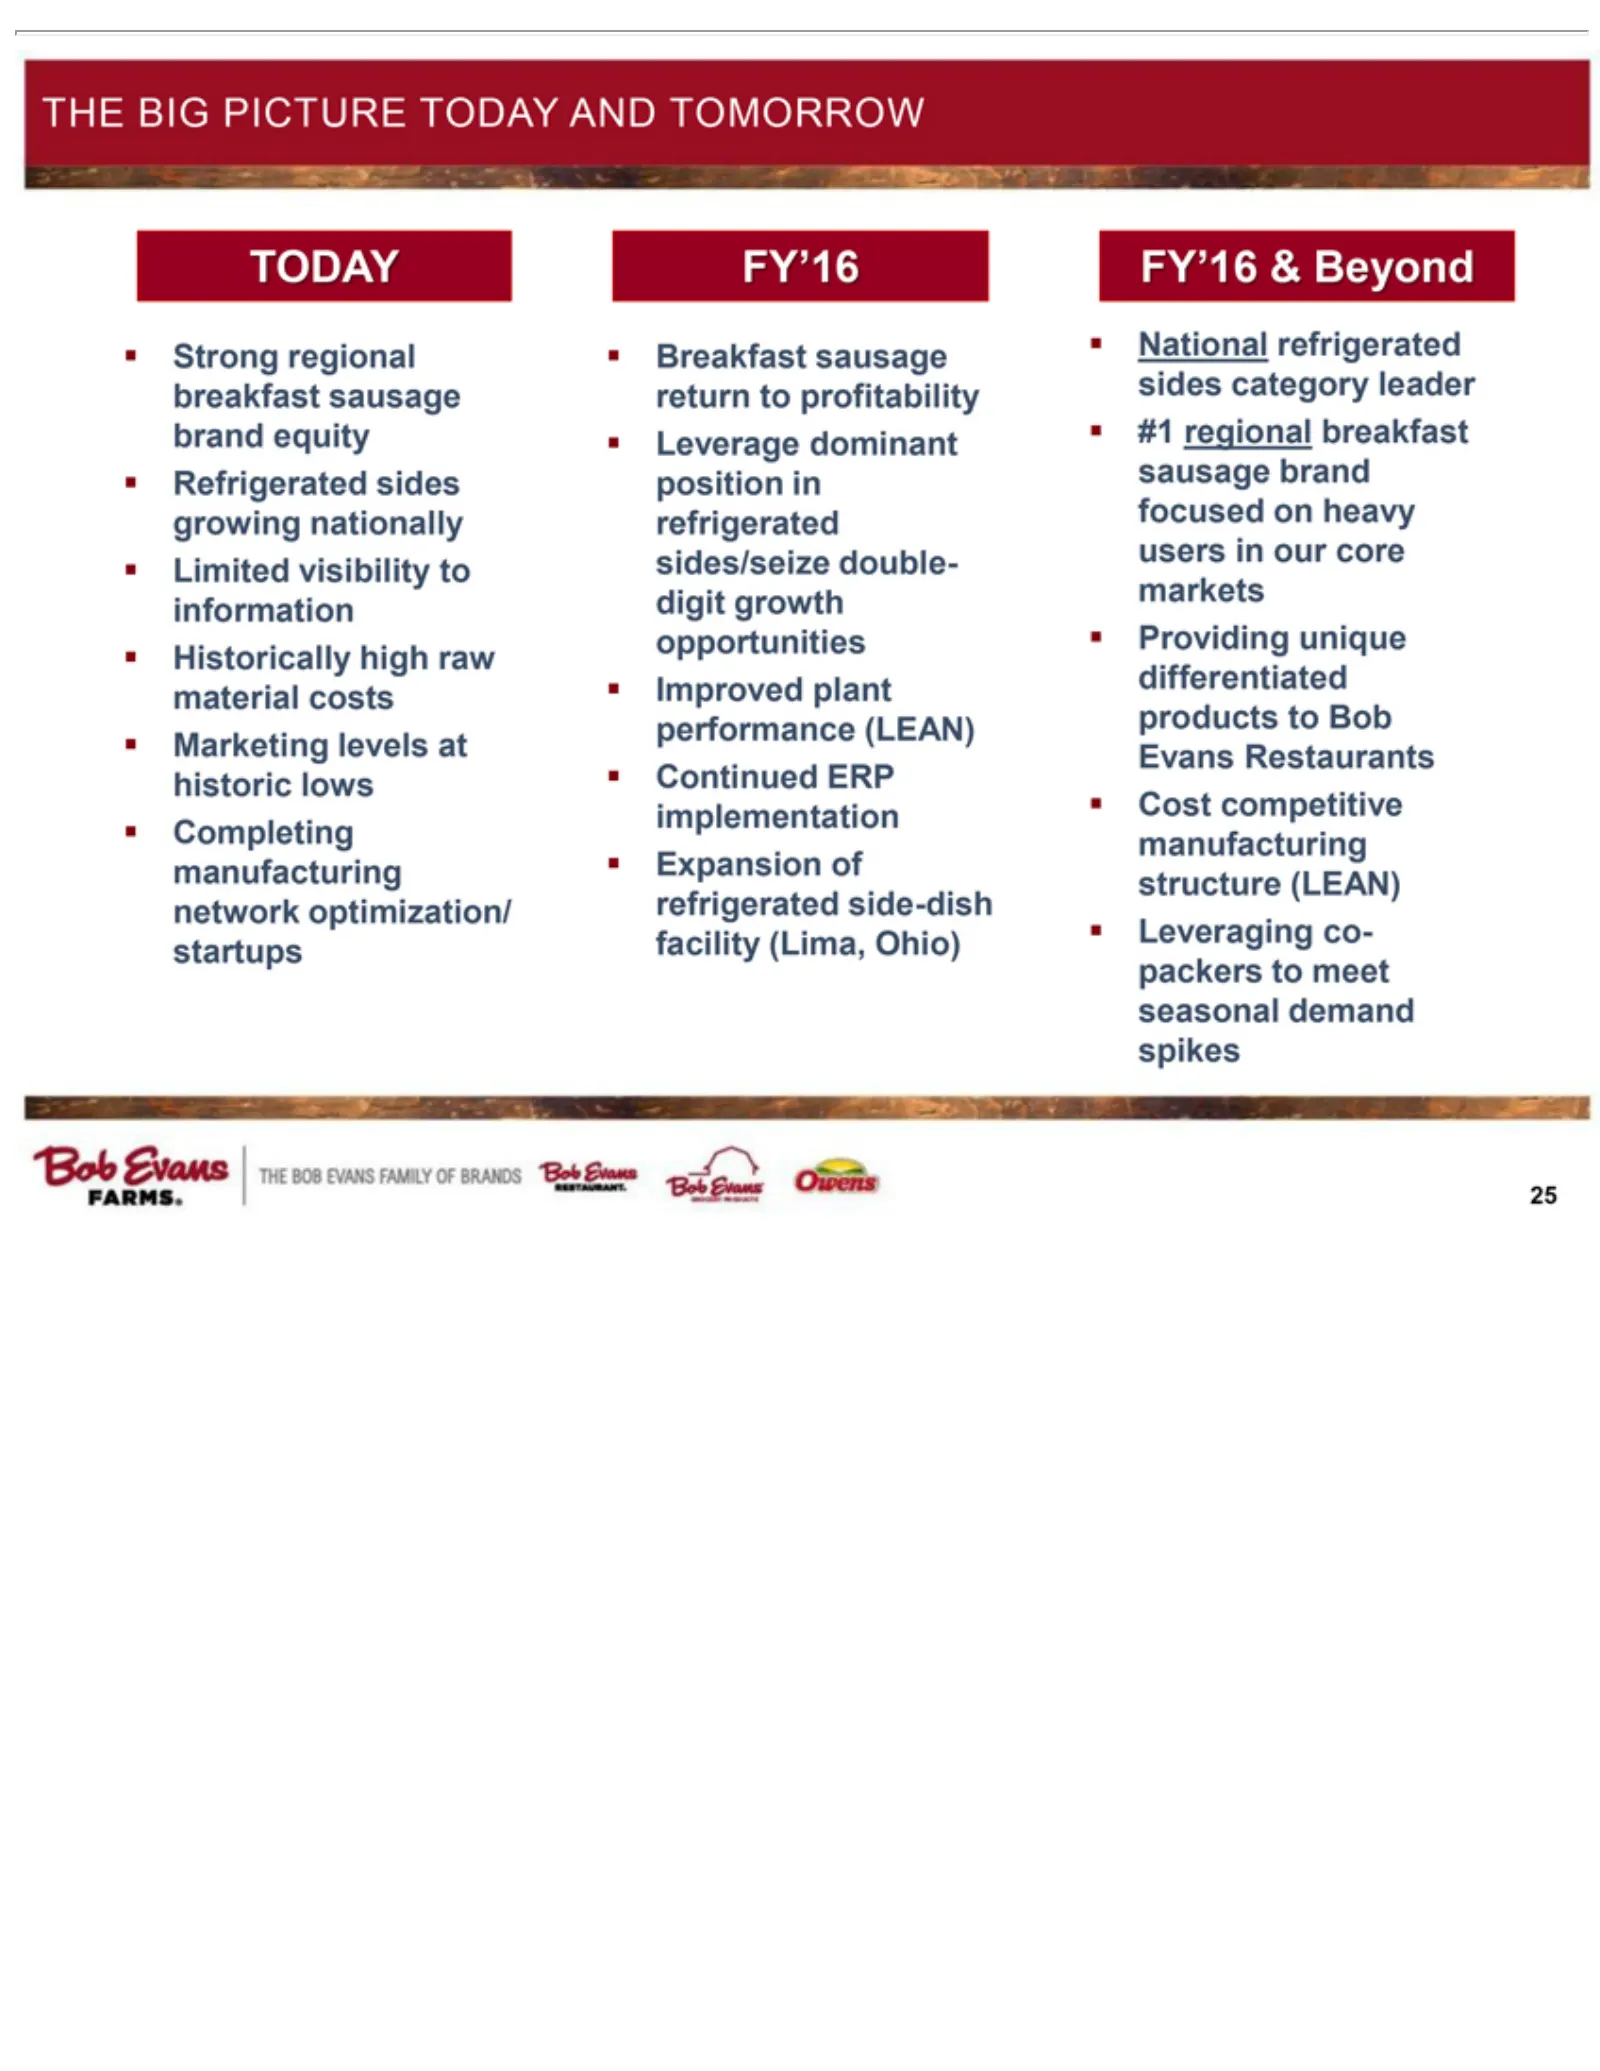
THE Strong TODAY Refrigerated Limited Historically Marketing Completing Breakfast Leverage Improved Continued Expansion FY’16 National #1 Providing Cost Leveraging 25 regional competitive BIG & regional visibility refrigerated Beyond dominant sausage plant PICTURE unique levels ERP of breakfast co-p
Slide 26: BEF Foods Business Strategy
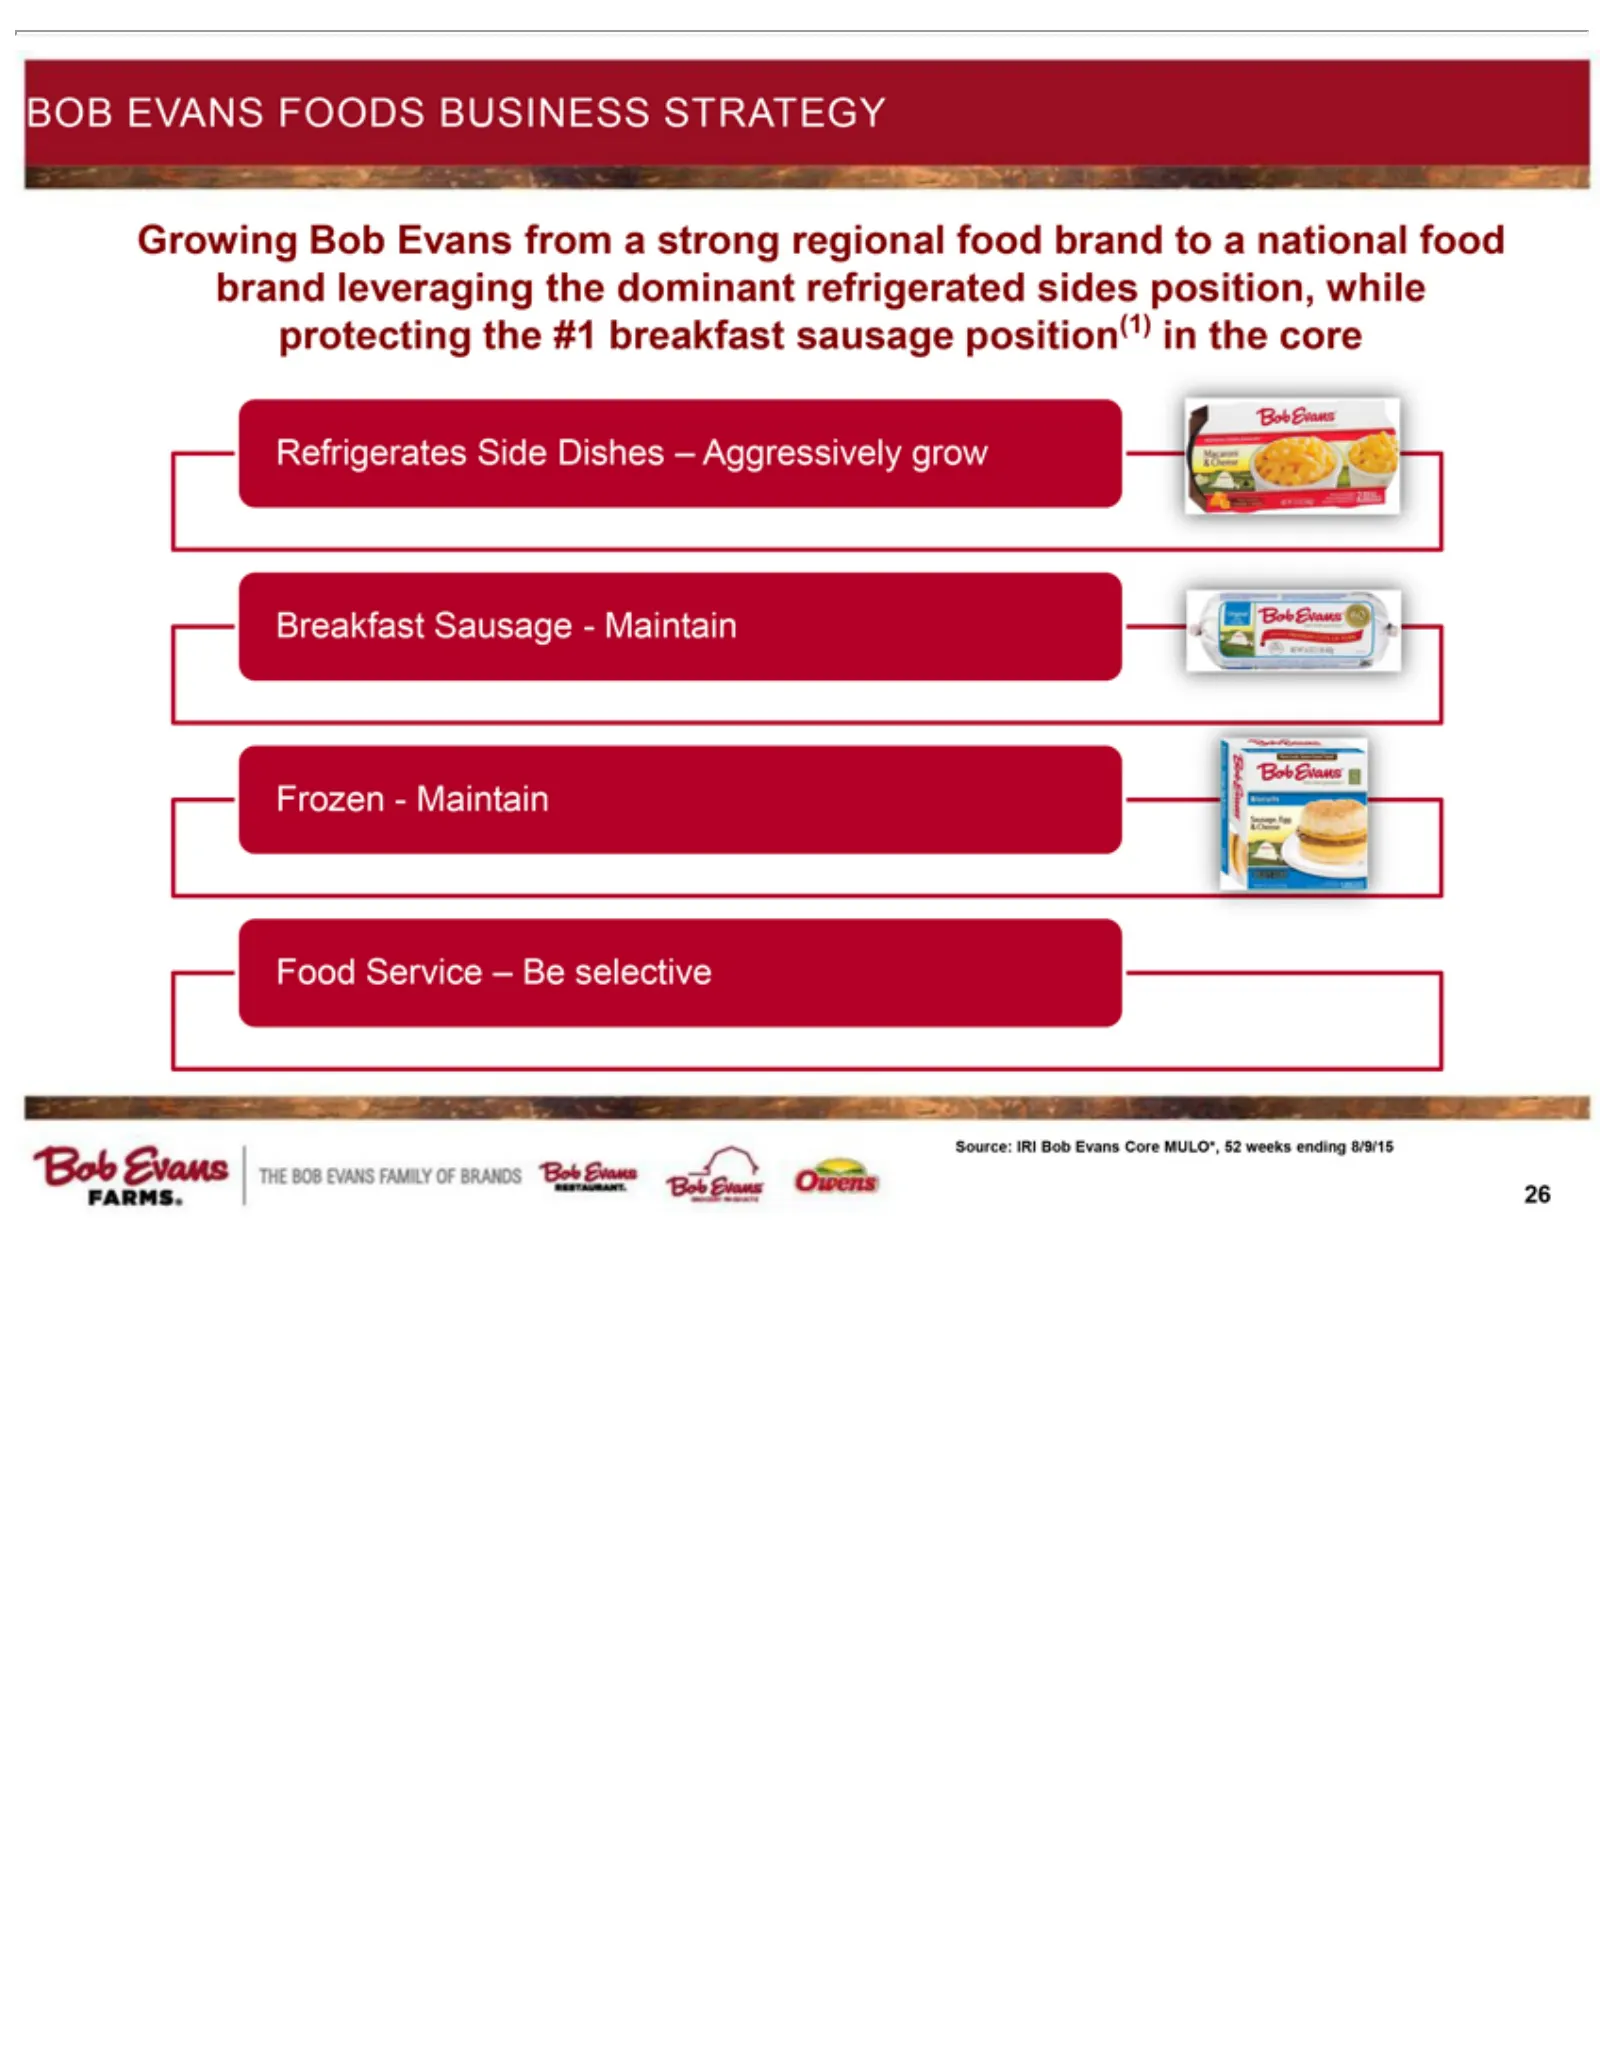
BOB Service Growing Refrigerates Breakfast Frozen Food Source: 26 EVANS -IRI Maintain Bob Sausage Bob Side –Evans FOODS Be Evans Dishes -selective Maintain from BUSINESS Core –aAggressively strong MULO*,regional STRATEGY 52grow weeks food ending brand to8/9/15 a national food brand leveraging the do
Slide 27: Bob Evans Foods Retail Product Categories
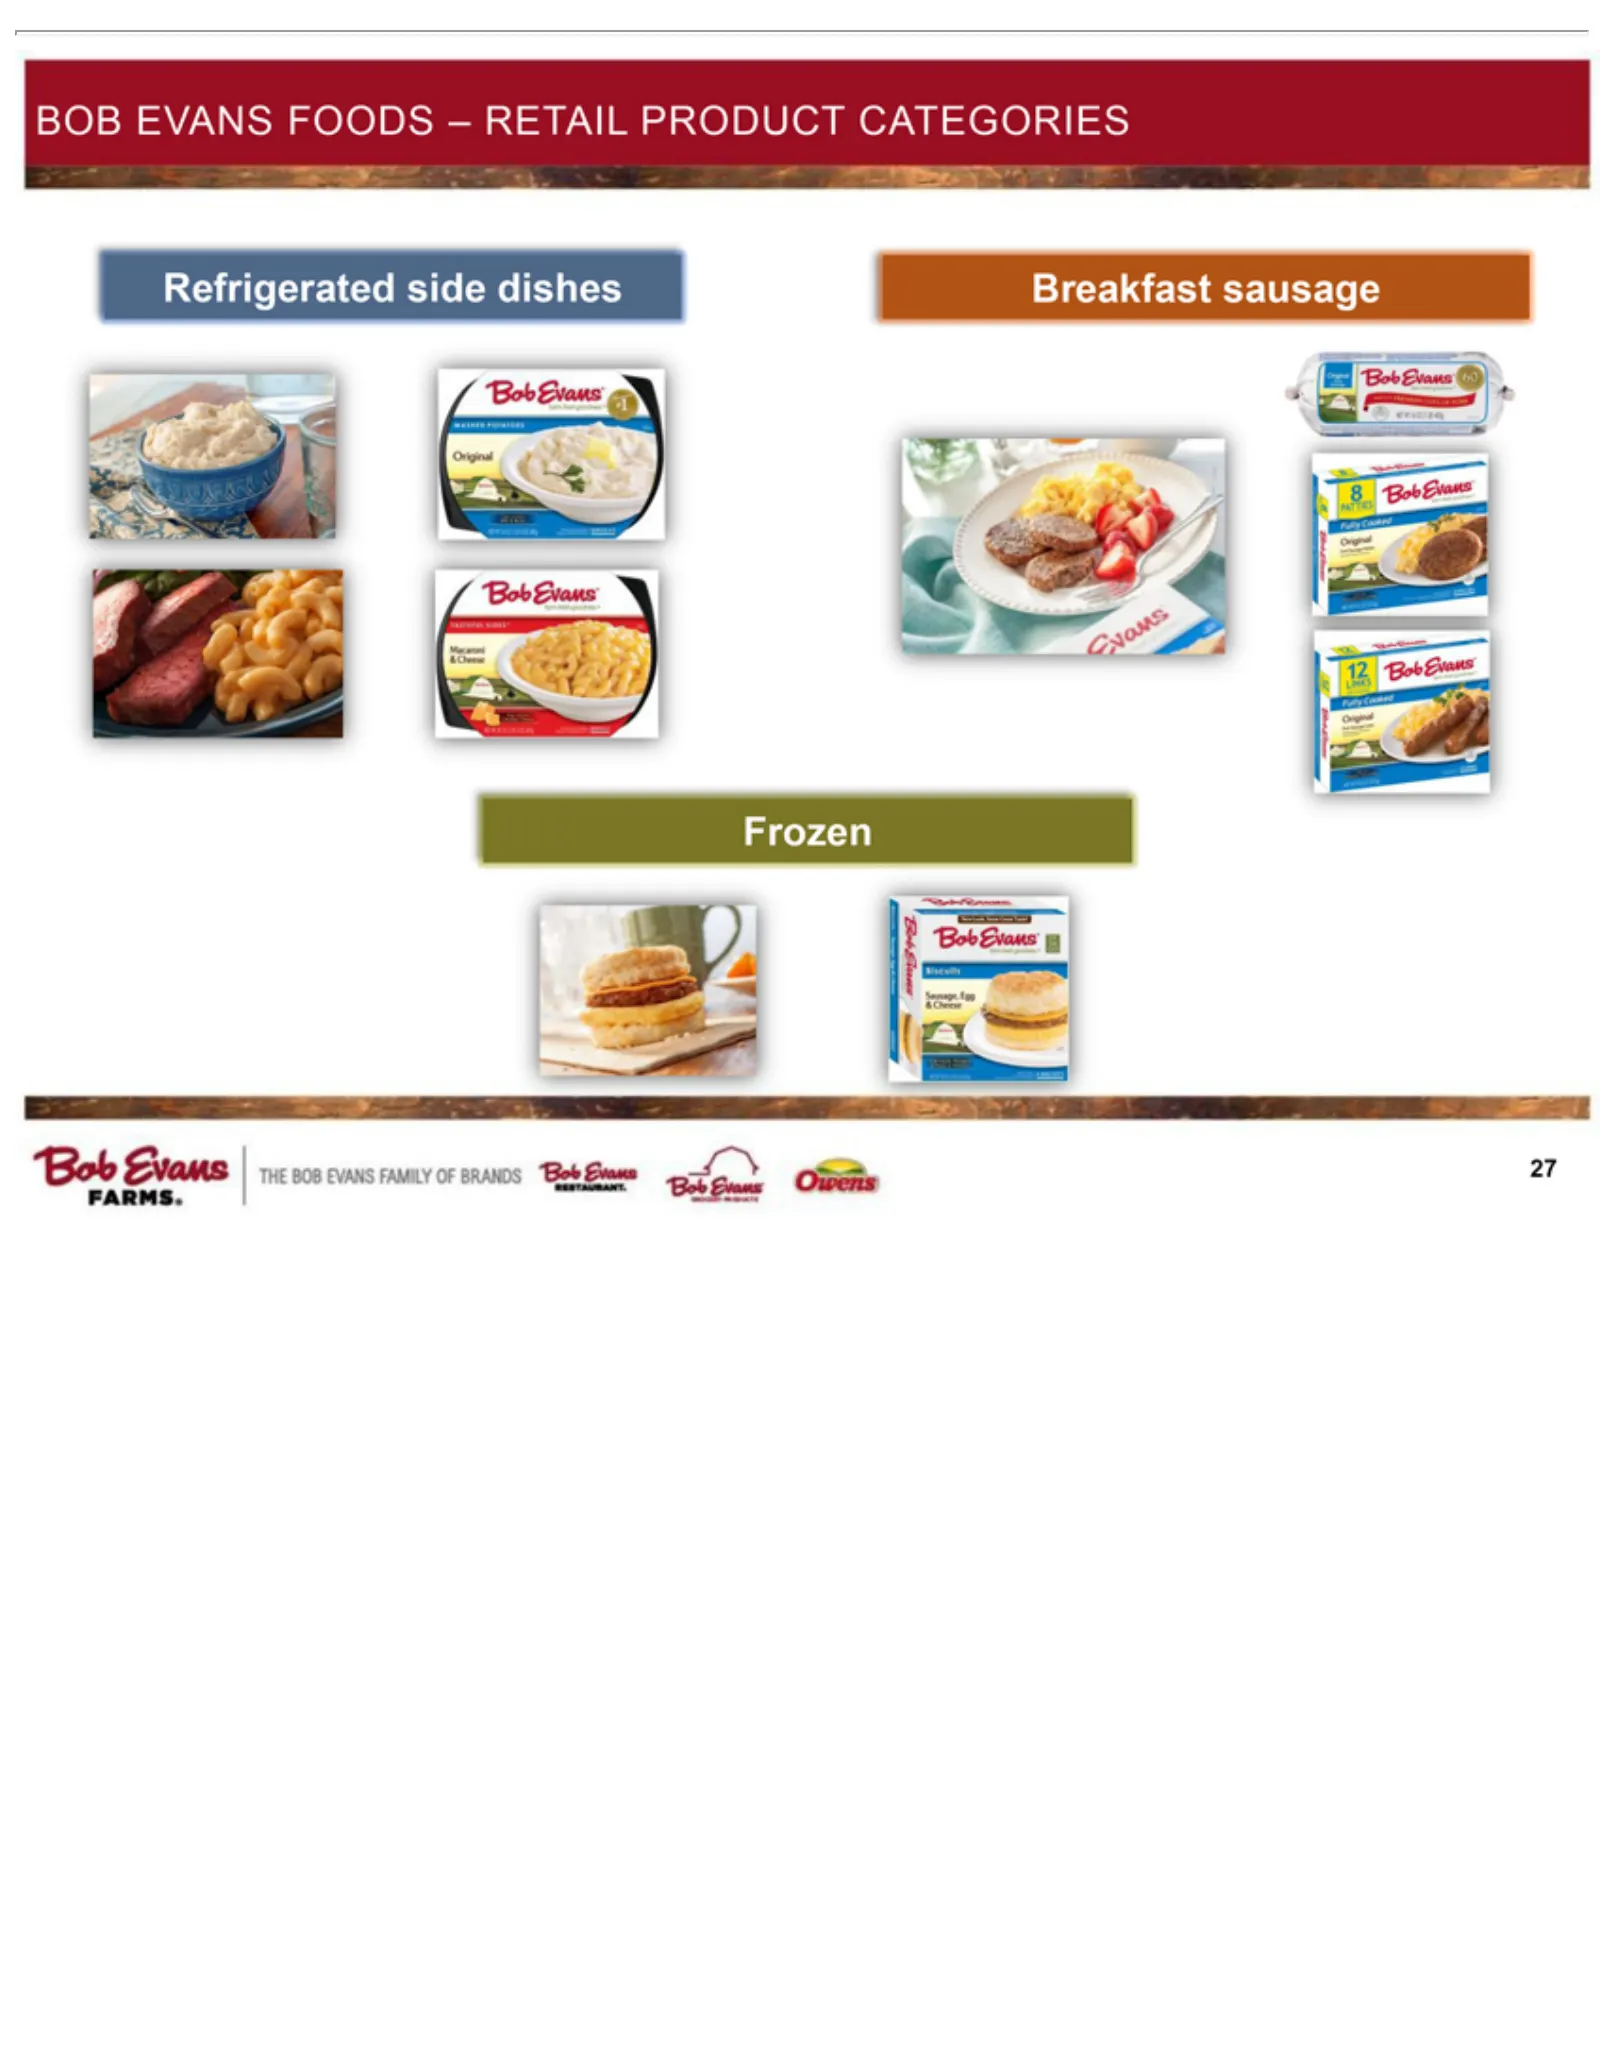
BOB EVANS Refrigerated Breakfast 27 Frozen sausage side FOODS dishes– RETAIL PRODUCT CATEGORIES
Slide 28: Our Sides Deliver Quality and Taste
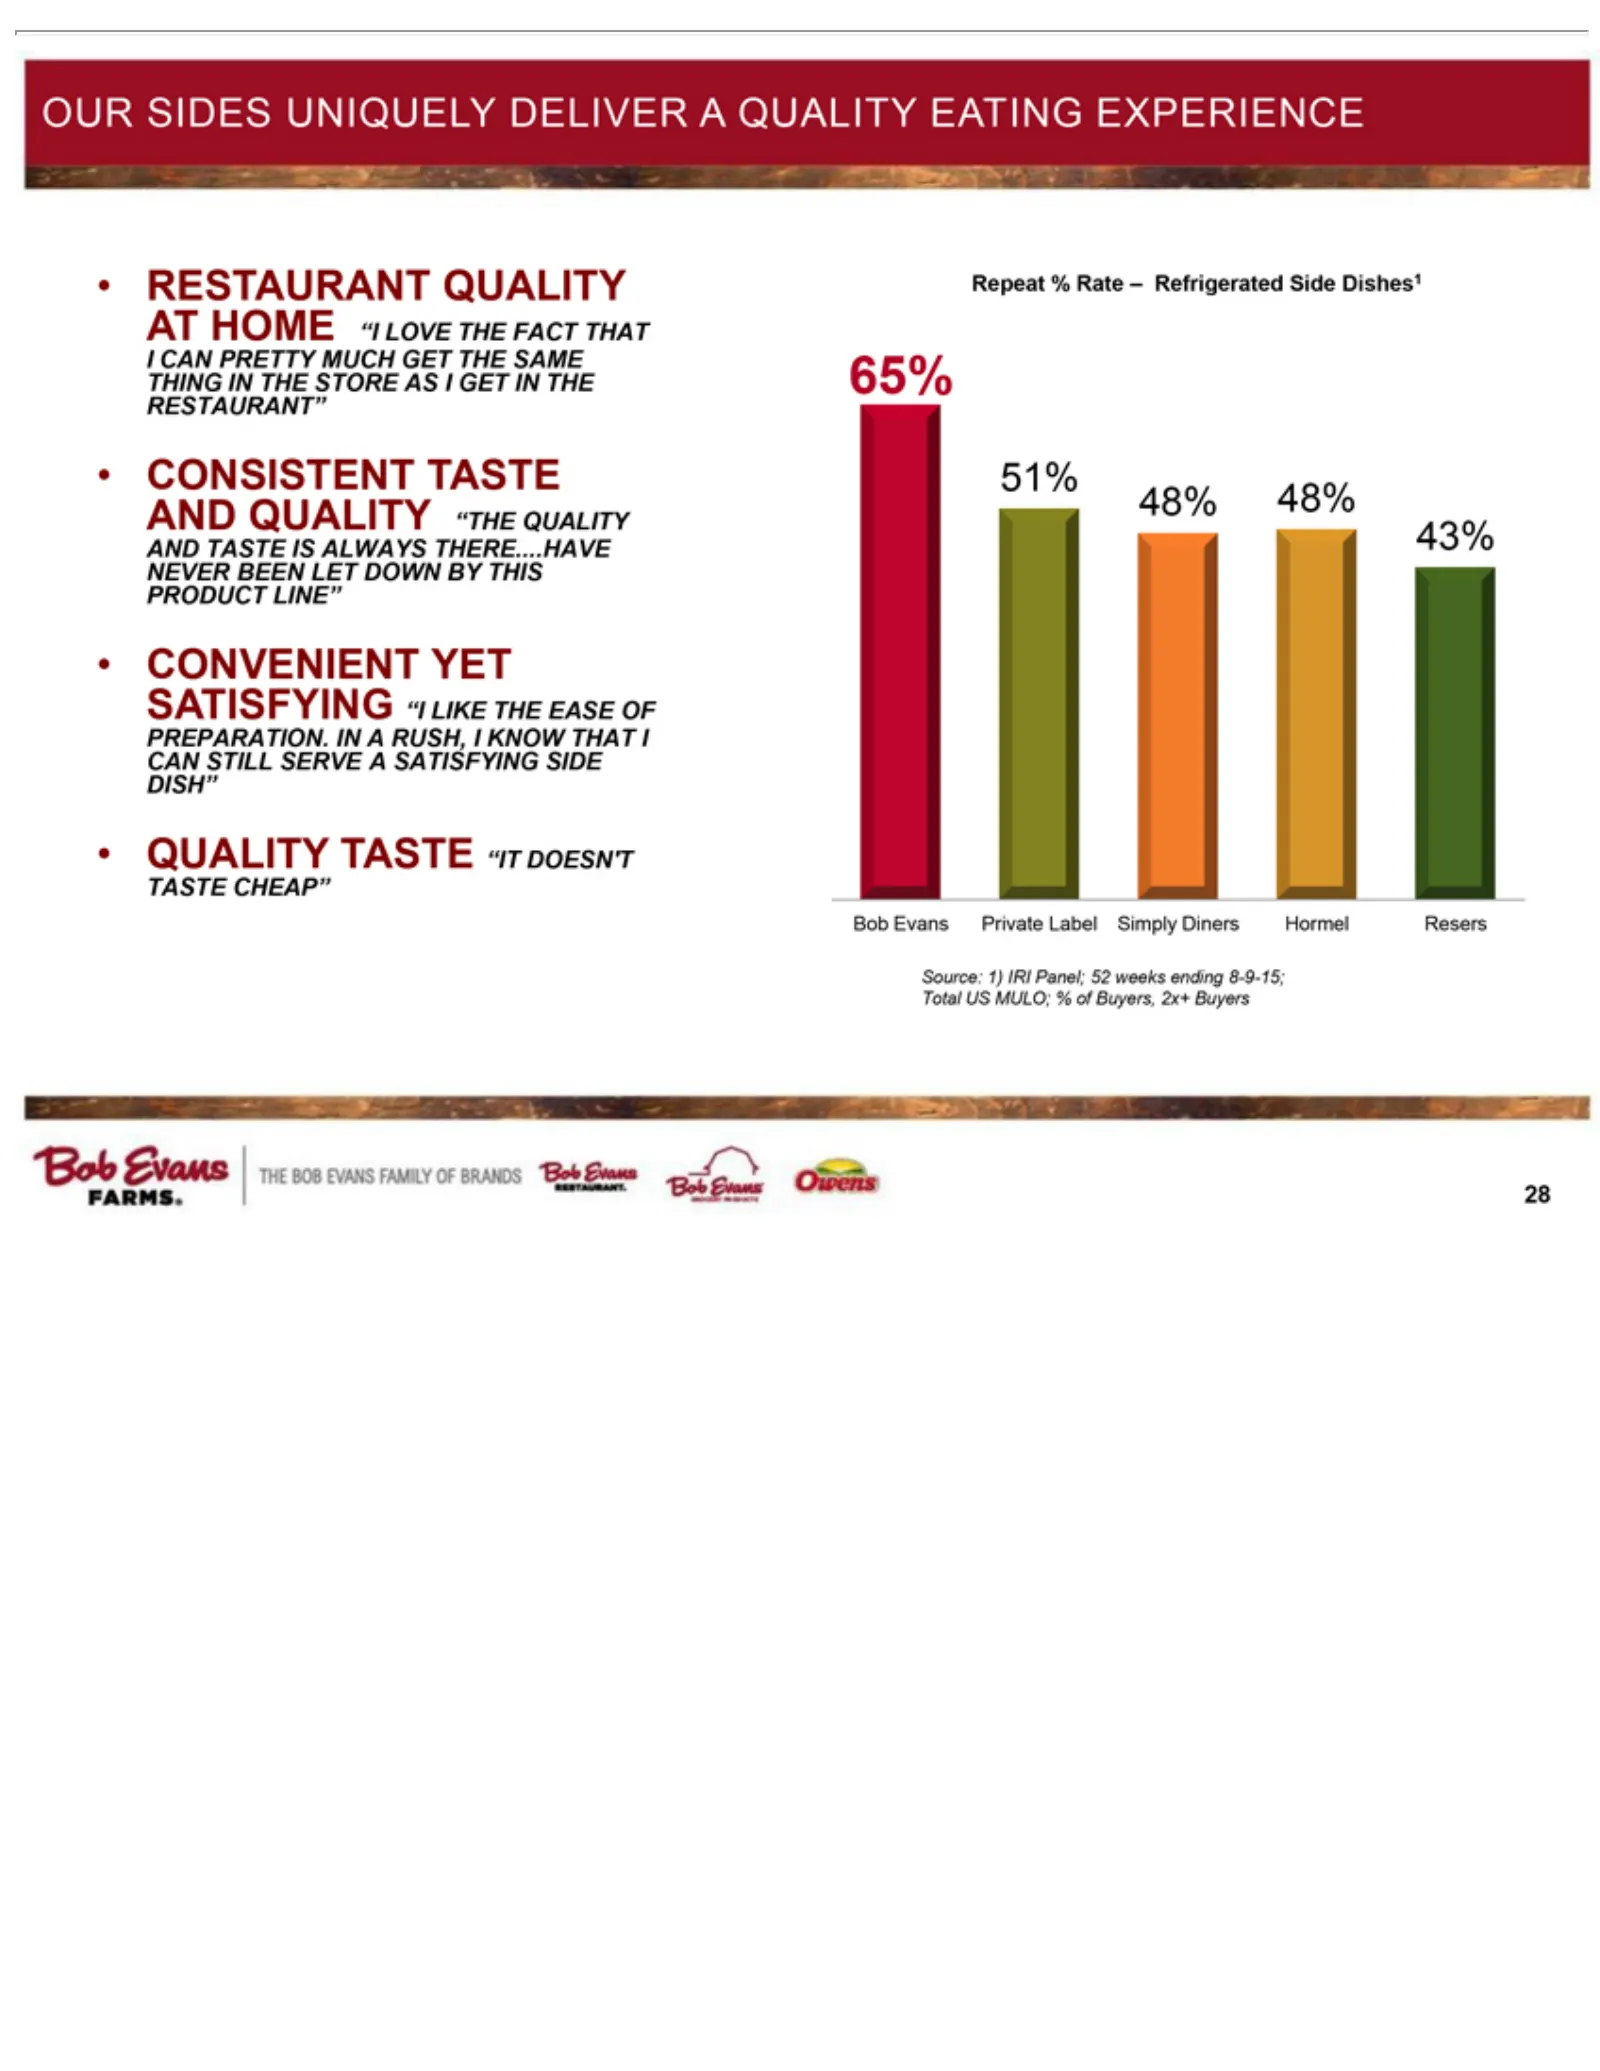
OUR43% •RESTAURANT •CONSISTENT •CONVENIENT •QUALITY Repeat 48% 51% 65% Private Simply Source: 28 SIDES % Label Diners 1)Rate Bob IRI TASTE UNIQUELY Panel; Hormel Evans –TASTE Refrigerated YET QUALITY “IT 52 SATISFYING Resers DOESN’T AND weeks DELIVER AT Side QUALITY ending HOME Dishes1 TASTE “I A8-9
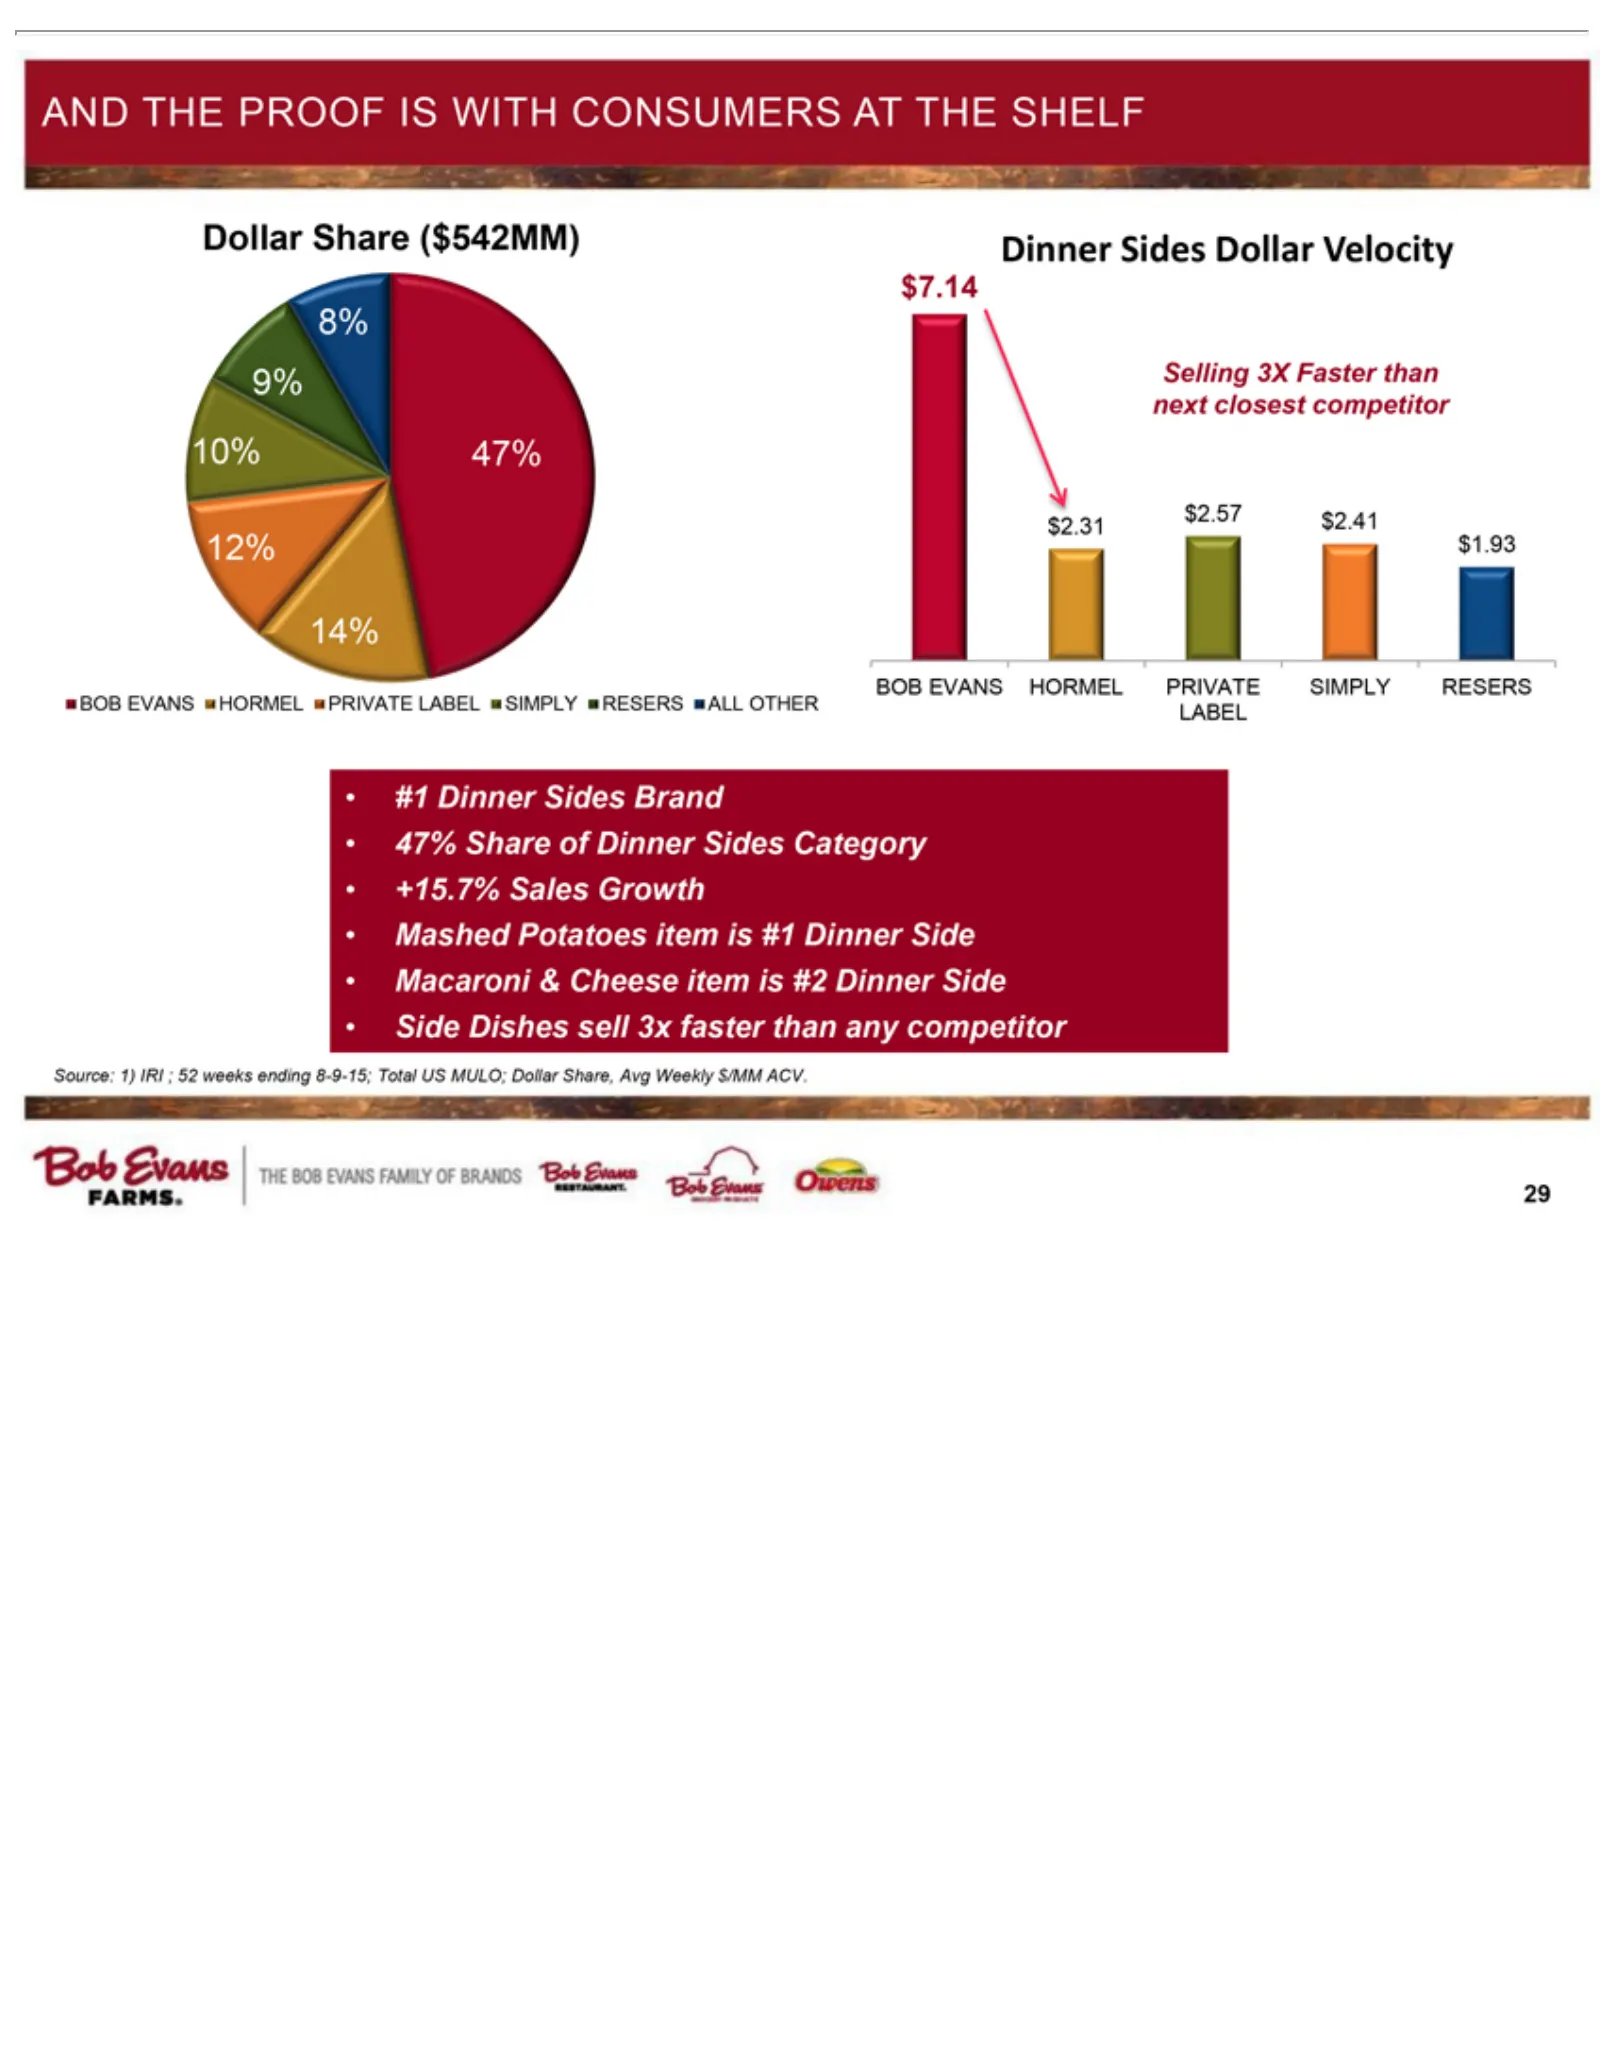
Slide 29: And the Proof Is at the Shelf
AND THE Dinner weeks closest 29 ending competitor Sides PROOF Dollar Category 8-9-15;IS Velocity Total WITH • +15.7% US 47% CONSUMERS MULO; Sales 14%Growth 12% Dollar 10% ATShare, • Mashed THE 9% Avg 8% SHELF Potatoes BOB Weekly EVANS item $/MMisHORMEL #1 ACV. Dinner $7.14 PRIVATE Side $2.31 • Macar
Slide 30: Appendix
30 Appendix
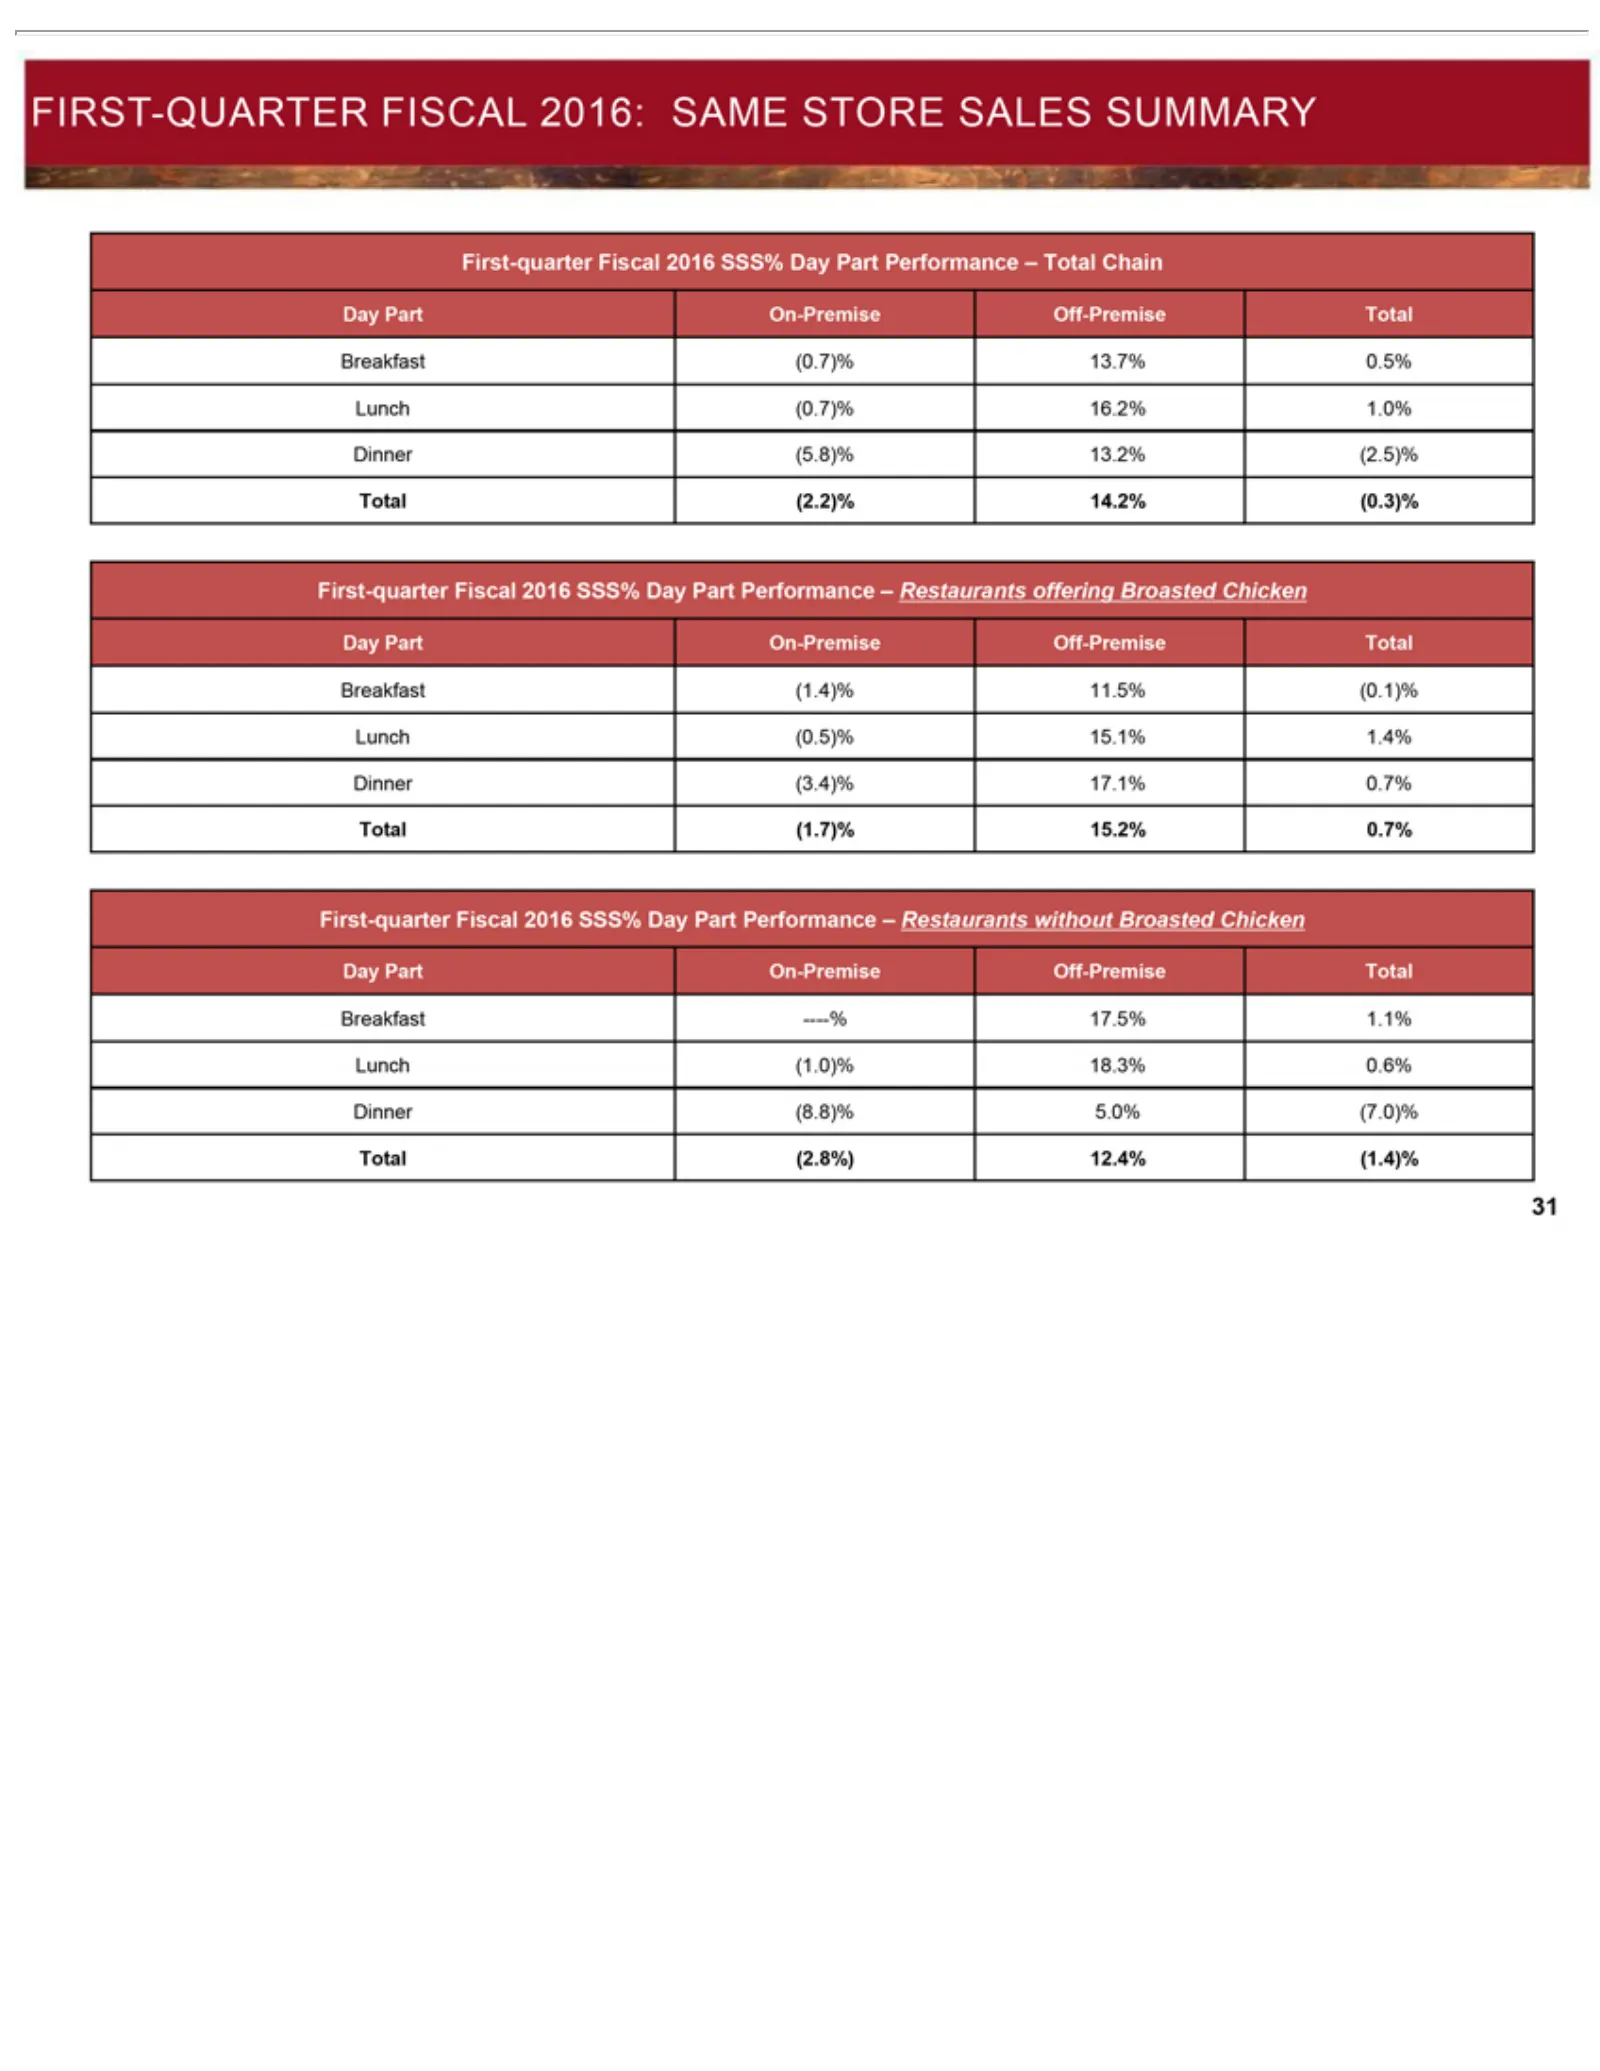
Slide 31: First-Quarter Same-Store Sales Summary
FIRST-QUARTER (0.3)% 14.2% (2.2)% (2.5)% 13.2% (5.8)% 1.0% 16.2% 0.5% 13.7% (0.7)% First-quarter 15.2% (1.7)% 0.7% 17.1% (3.4)% 1.4% 15.1% (0.5)% (0.1)% 11.5% Day 31 (1.4)% 12.4% (2.8%) (7.0)% 5.0% (8.8)% Dinner 0.6% 18.3% (1.0)% Lunch 1.1% 17.5% ----% Breakfast Total Off-Premise On-Premise Part Fis
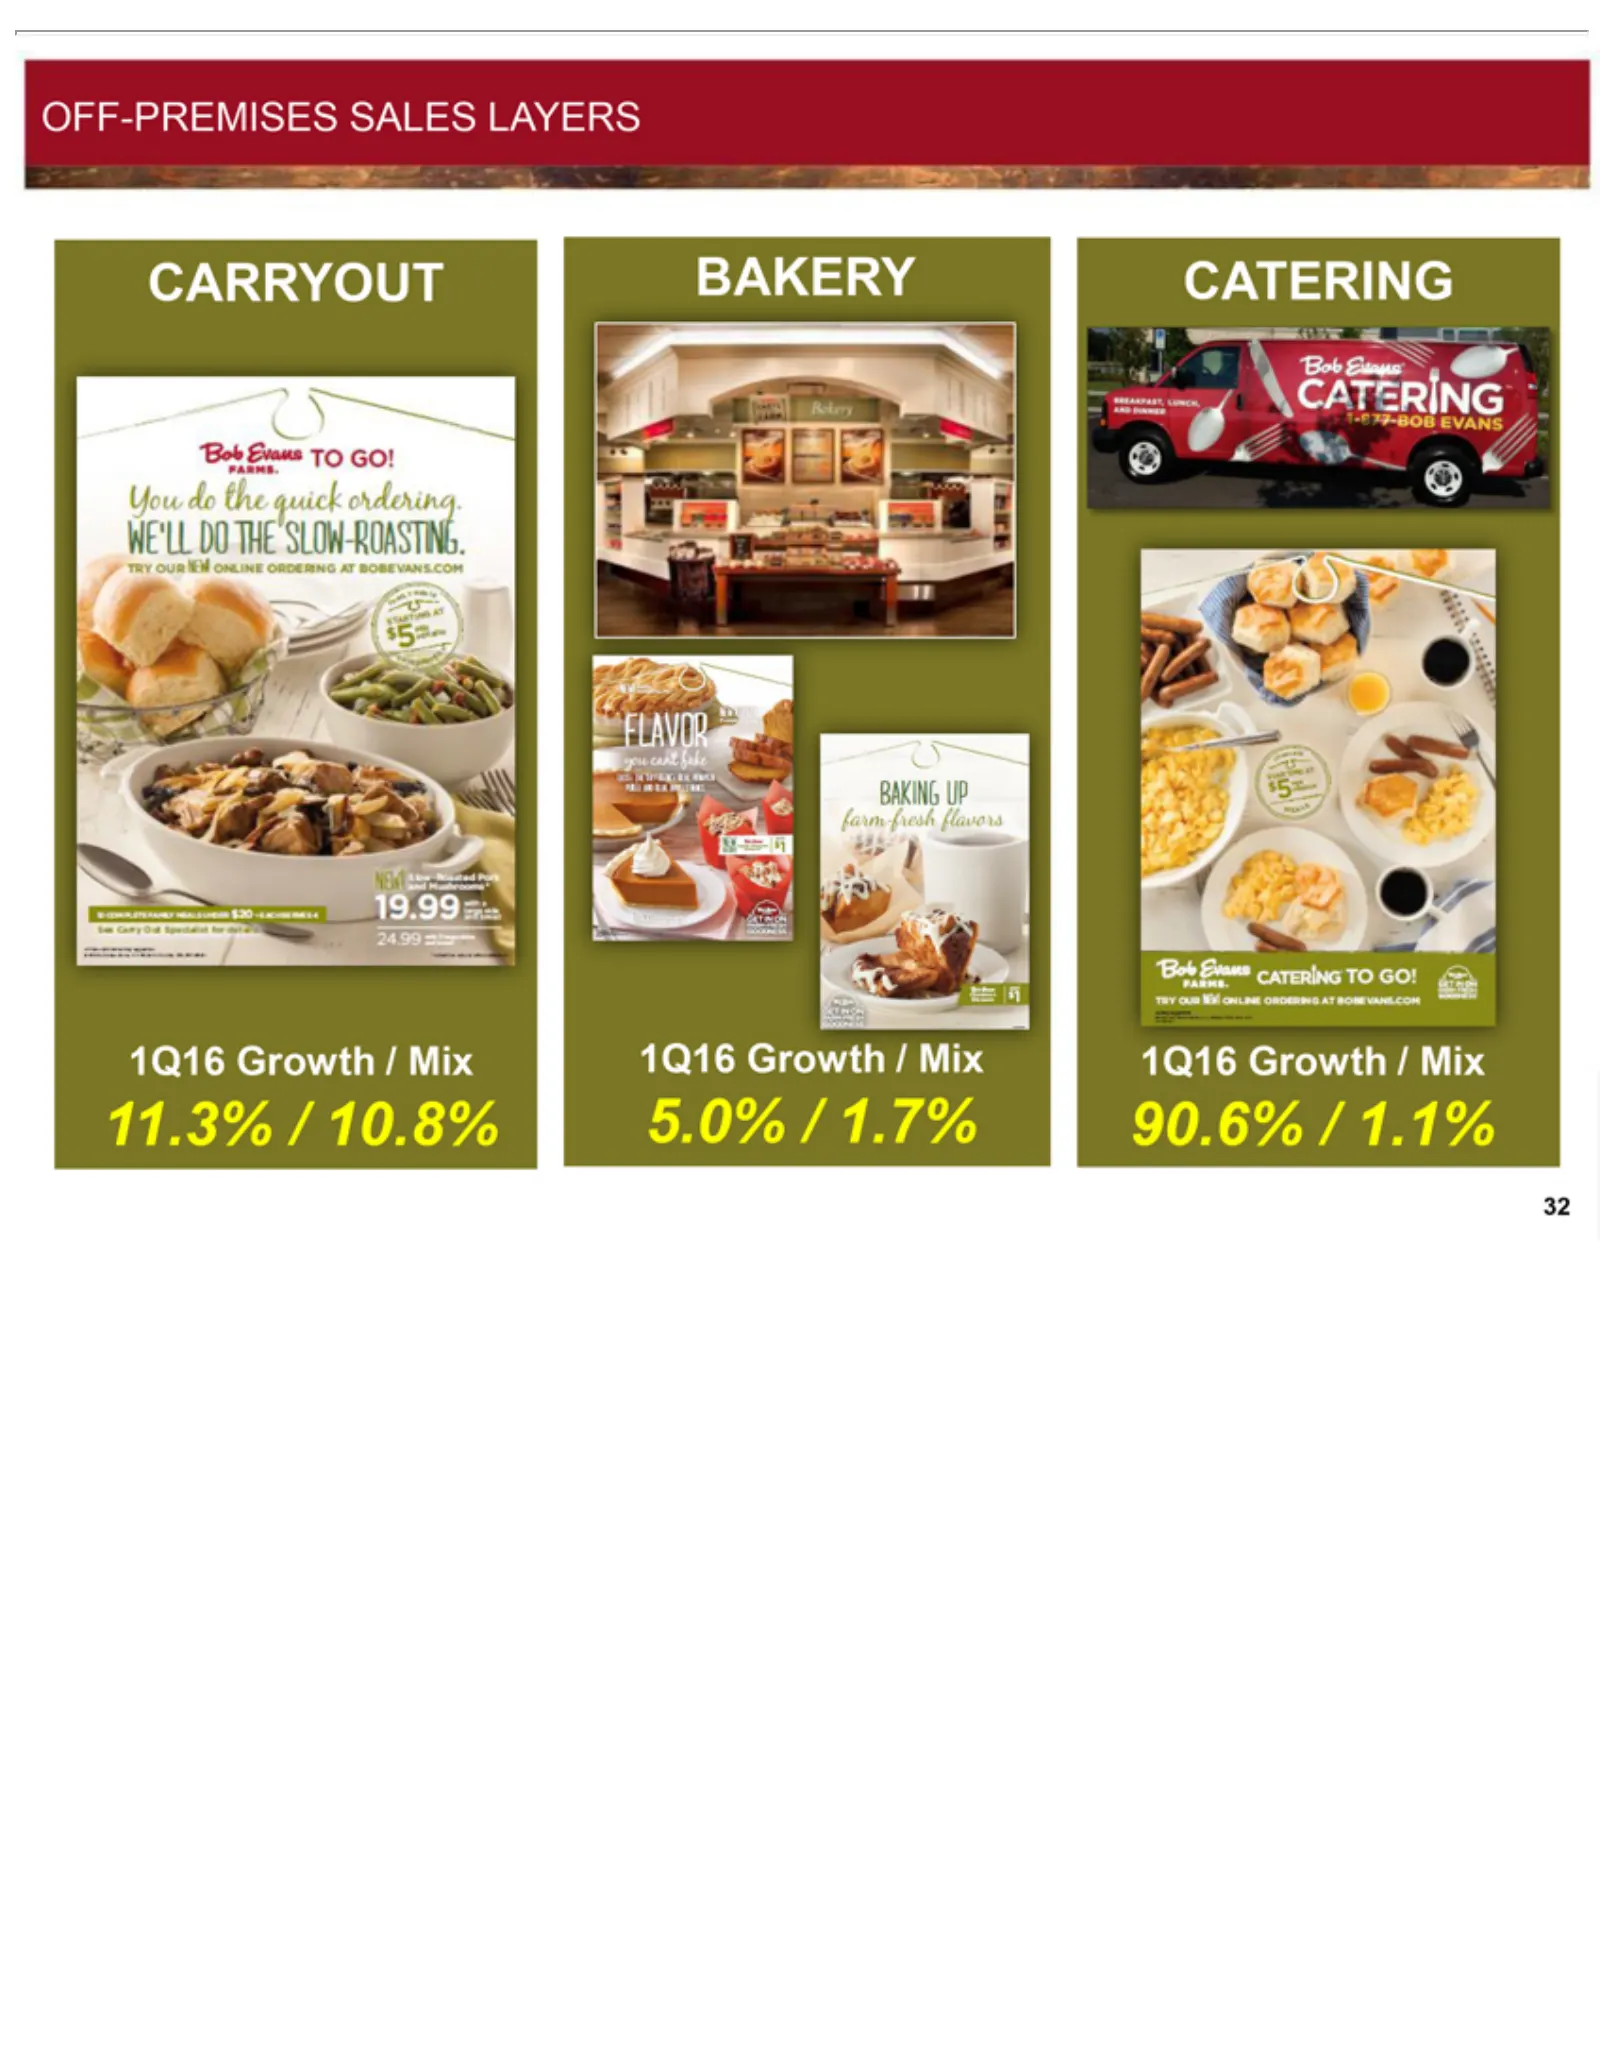
Slide 32: Off-Premises, Catering, Bakery, Carryout Sales
OFF-PREMISES CATERING BAKERY CARRYOUT 11.3% 5.0% 1Q16 90.6% 32 /Growth /1.7% 10.8% 1.1% / Mix SALES LAYERS
Slide 33: BEF Foods Network Optimization
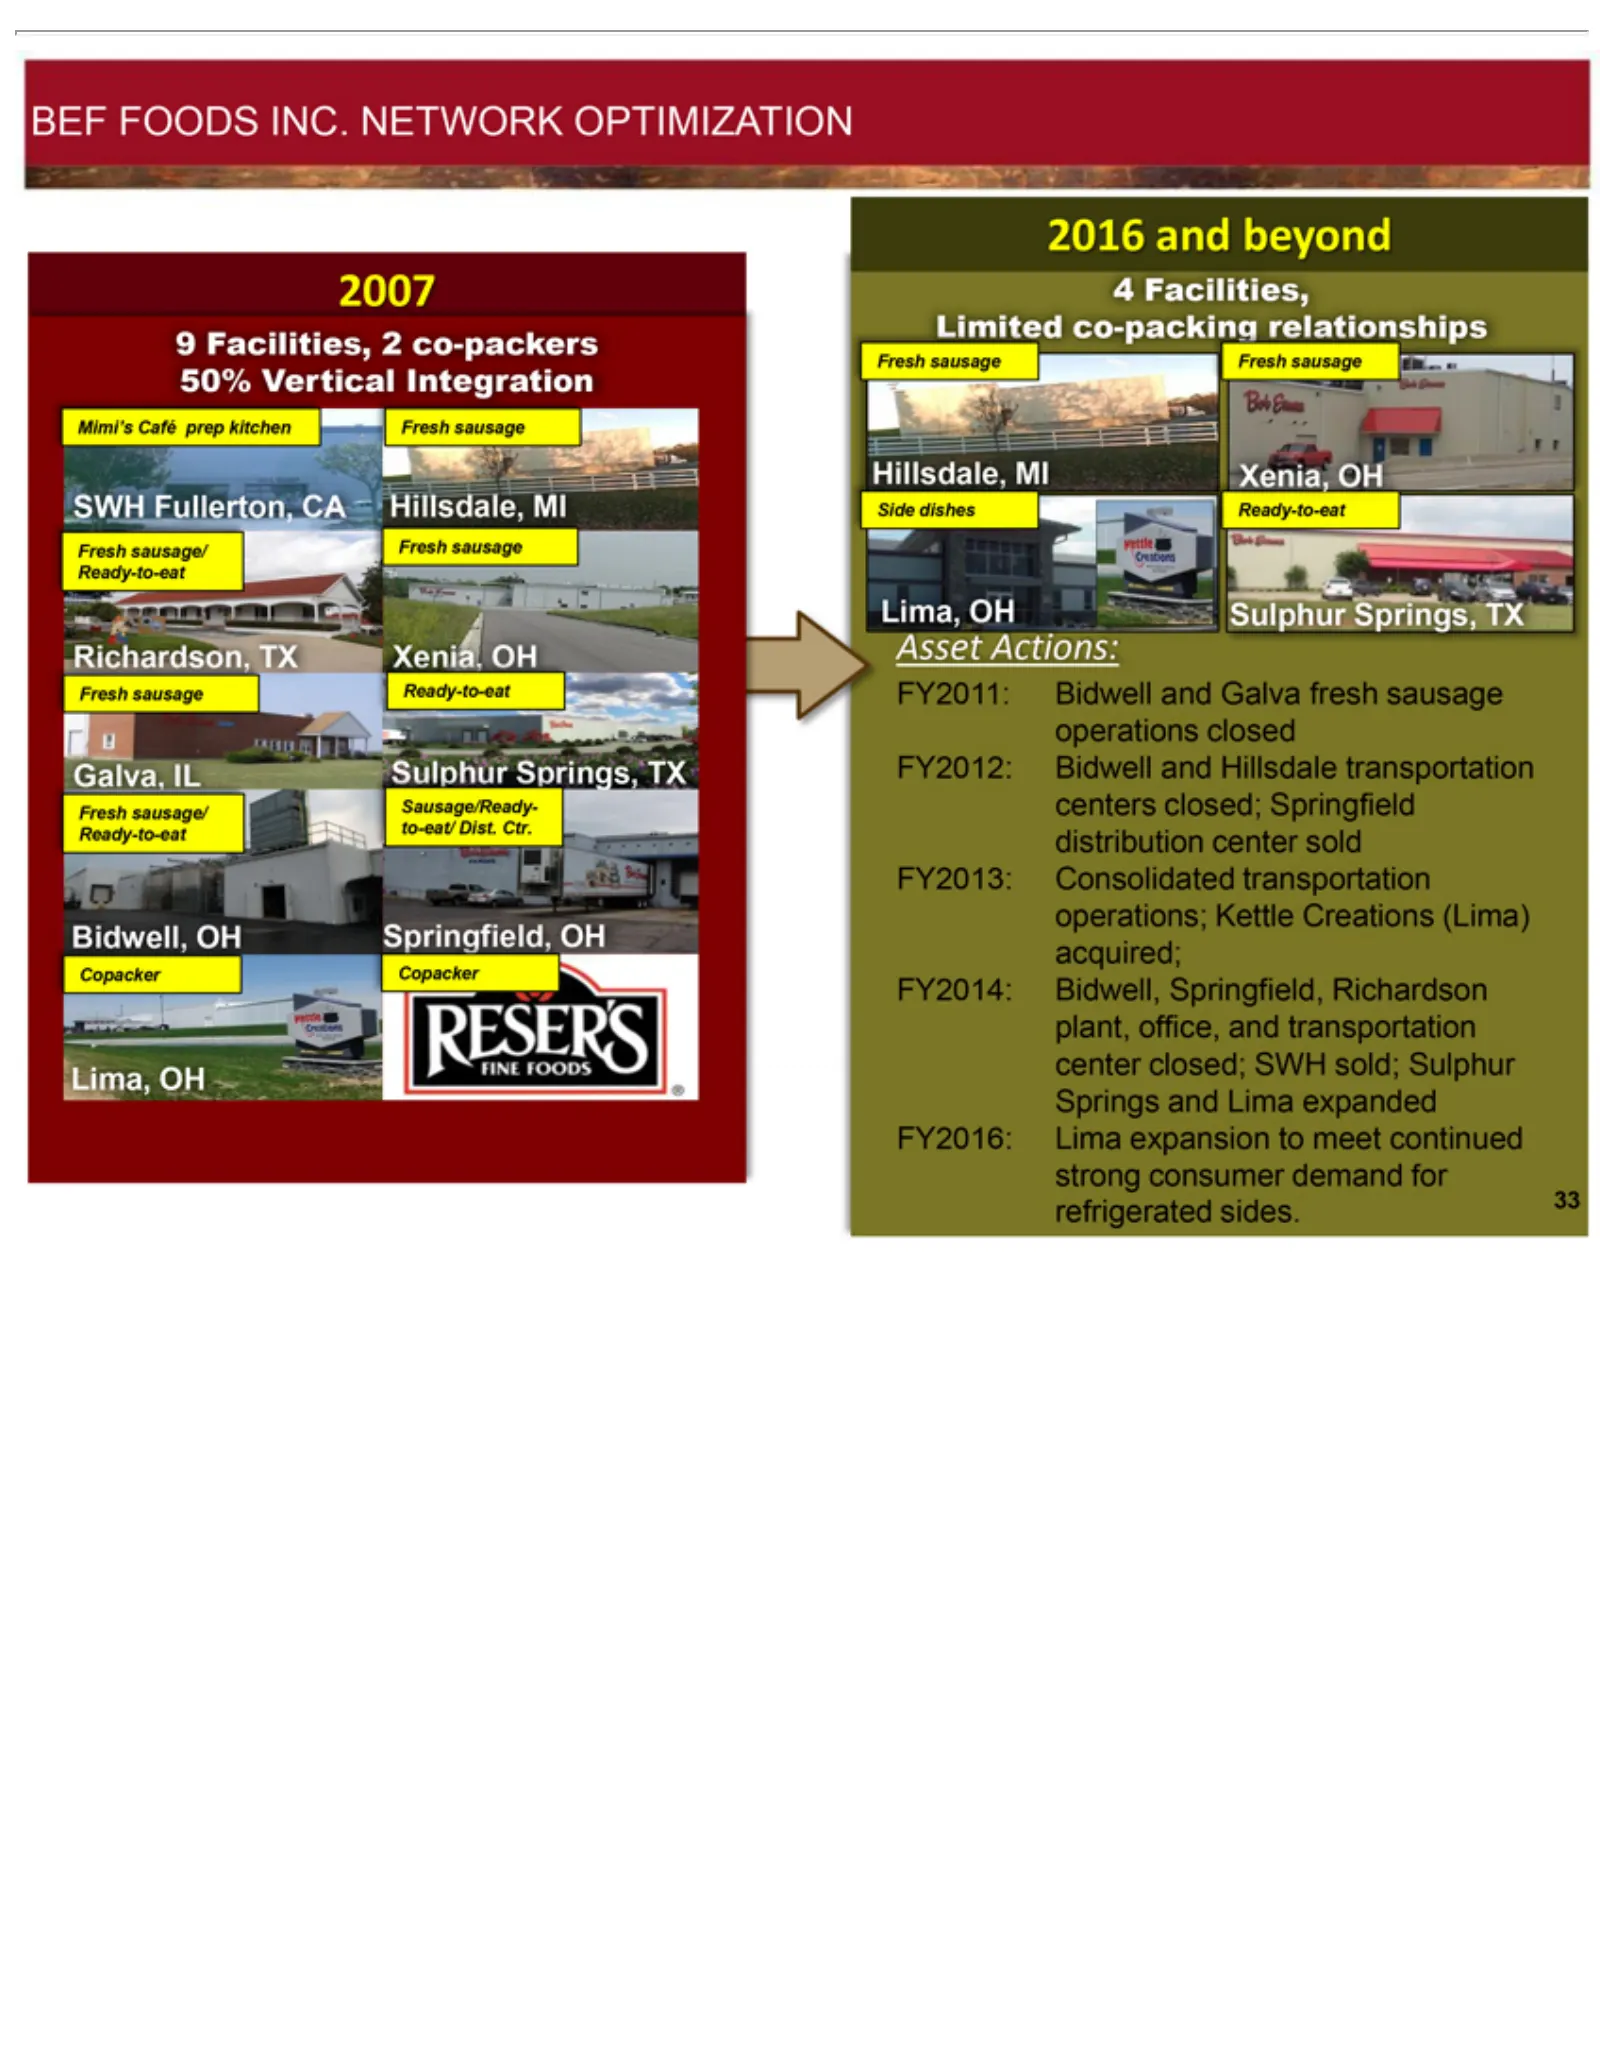
9BEF 2007 50% 42016 Limited Asset FY2011: FY2012: FY2013: FY2014: FY2016: 33Facilities, Vertical FOODS and Actions: co-packing Bidwell Consolidated Bidwell, Lima beyond 2Integration INC. co-packers expansion and Springfield, NETWORK relationships Galva Hillsdale transportation to meet fresh Richards
Slide 34: Historical and Forecasted Sow Cost Pricing
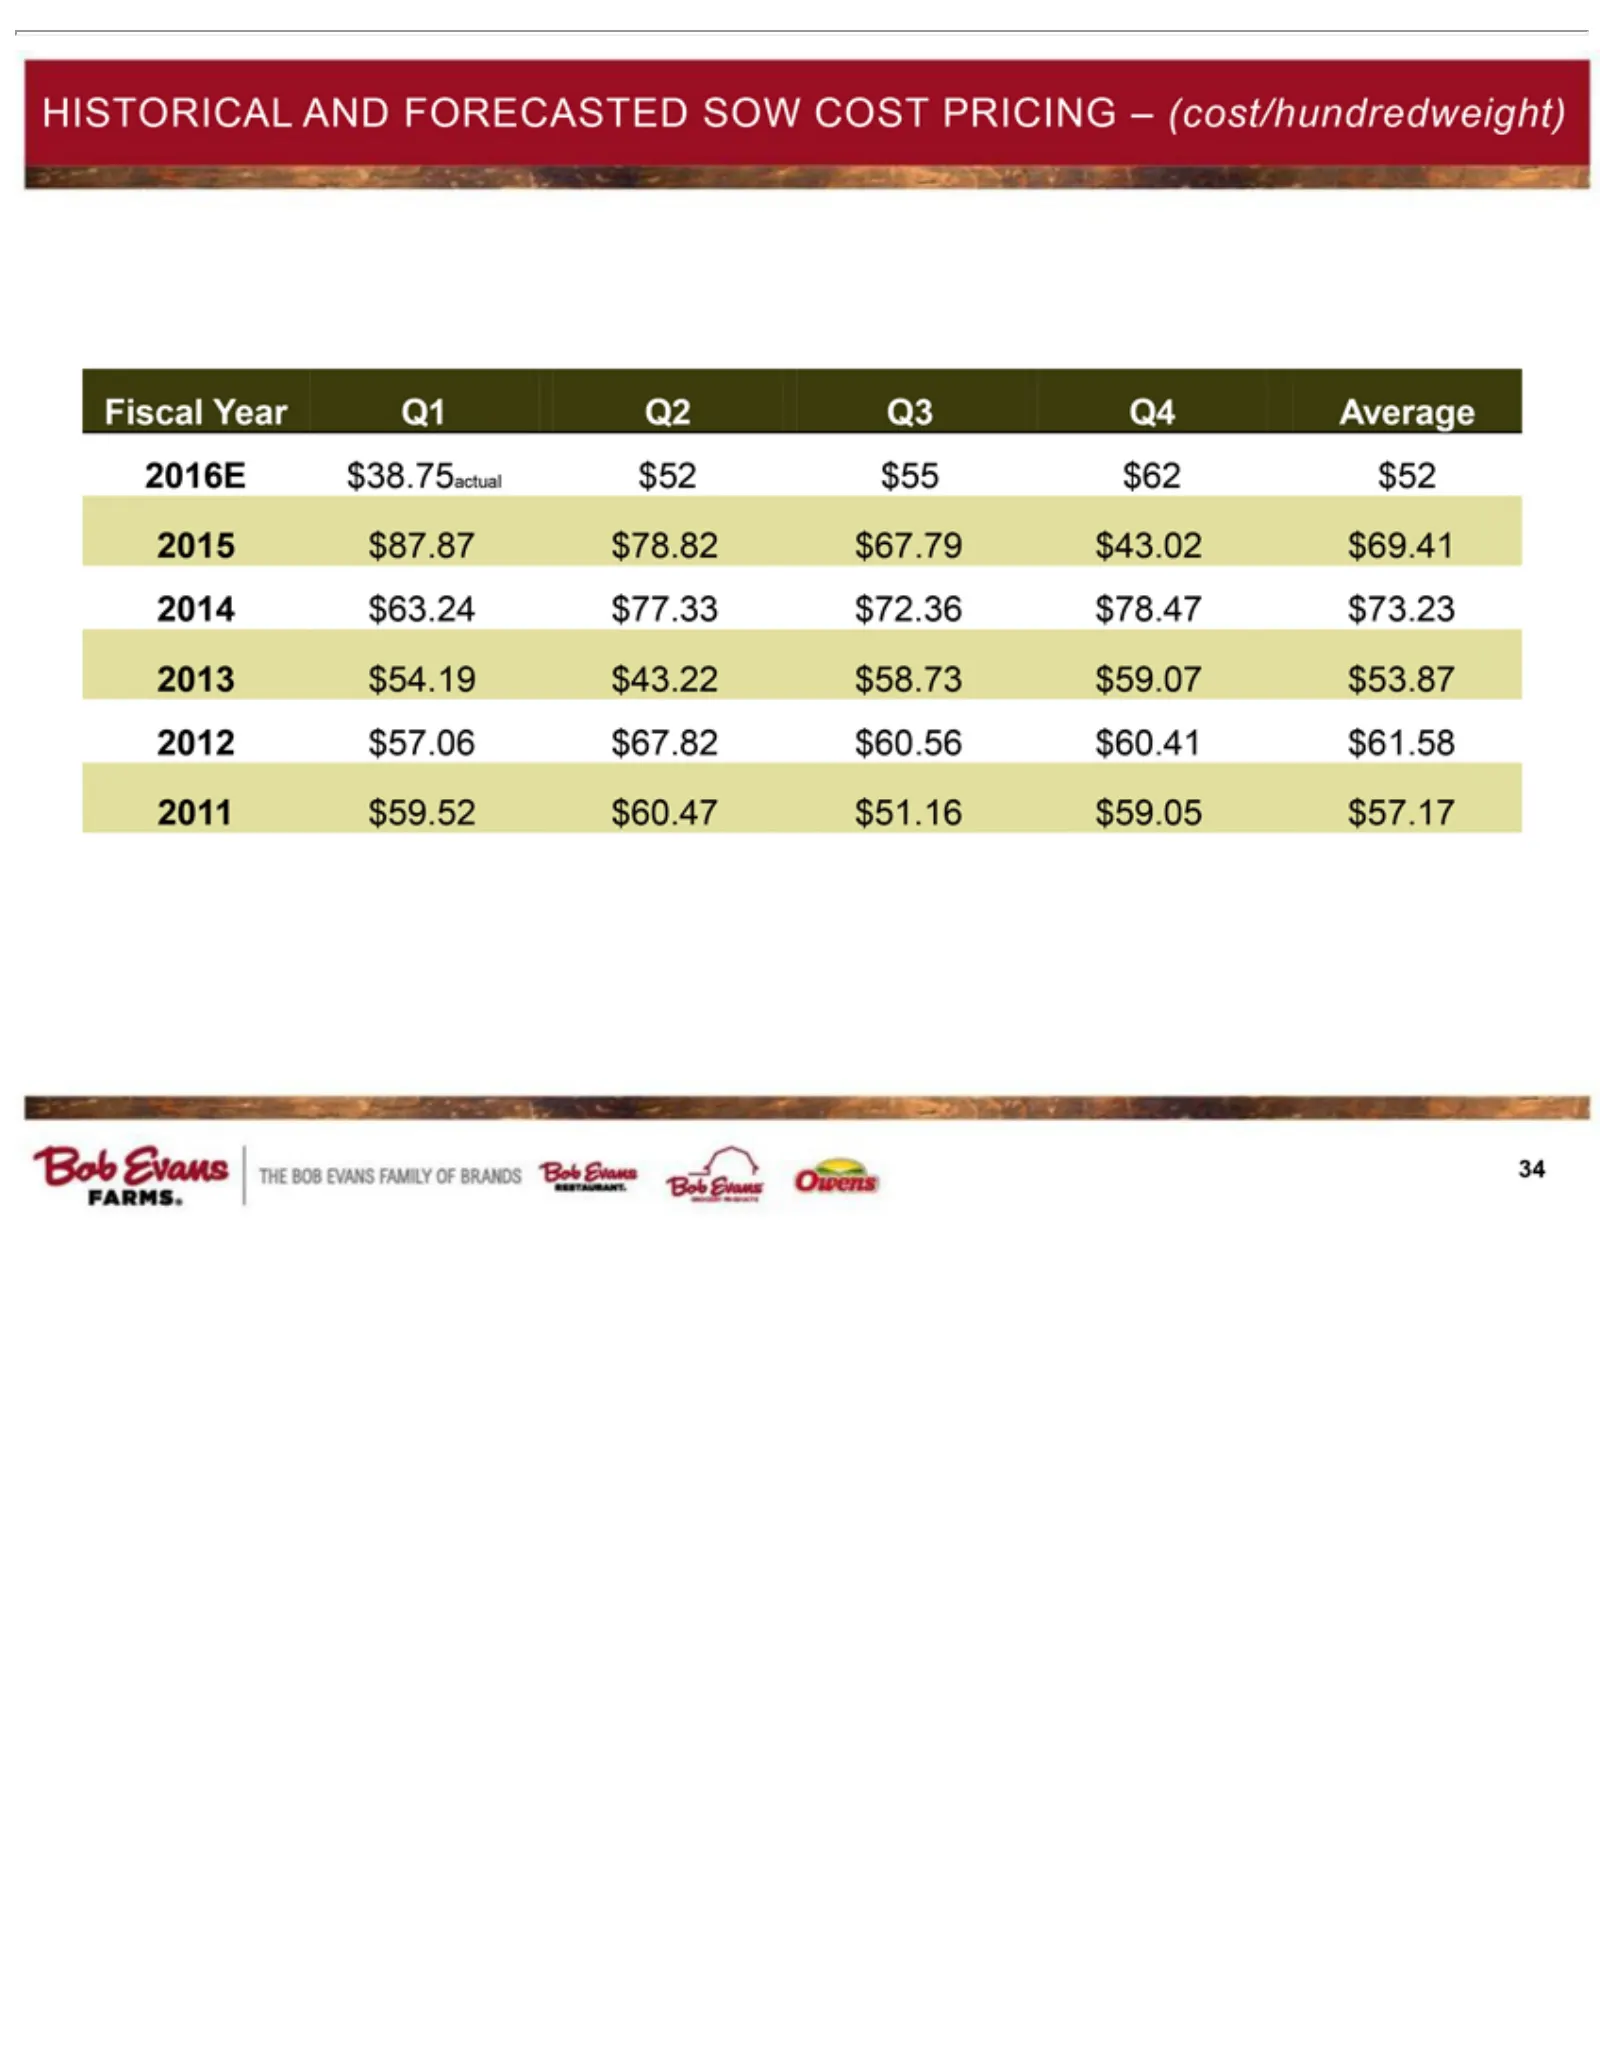
HISTORICAL Fiscal 34 $57.17 $59.05 $51.16 $60.47 $59.52 2011 $61.58 $60.41 $60.56 $67.82 $57.06 2012 $53.87 $59.07 $58.73 $43.22 $54.19 2013 $73.23 $78.47 $72.36 $77.33 $63.24 2014 $69.41 $43.02 $67.79 $78.82 $87.87 2015 $62 $55 $52 $38.75actual 2016E Average Q4 Q3 Q2 Q1 Year AND FORECASTED SOW COST
Slide 35: Share Repurchase/CapEx/Dividend History
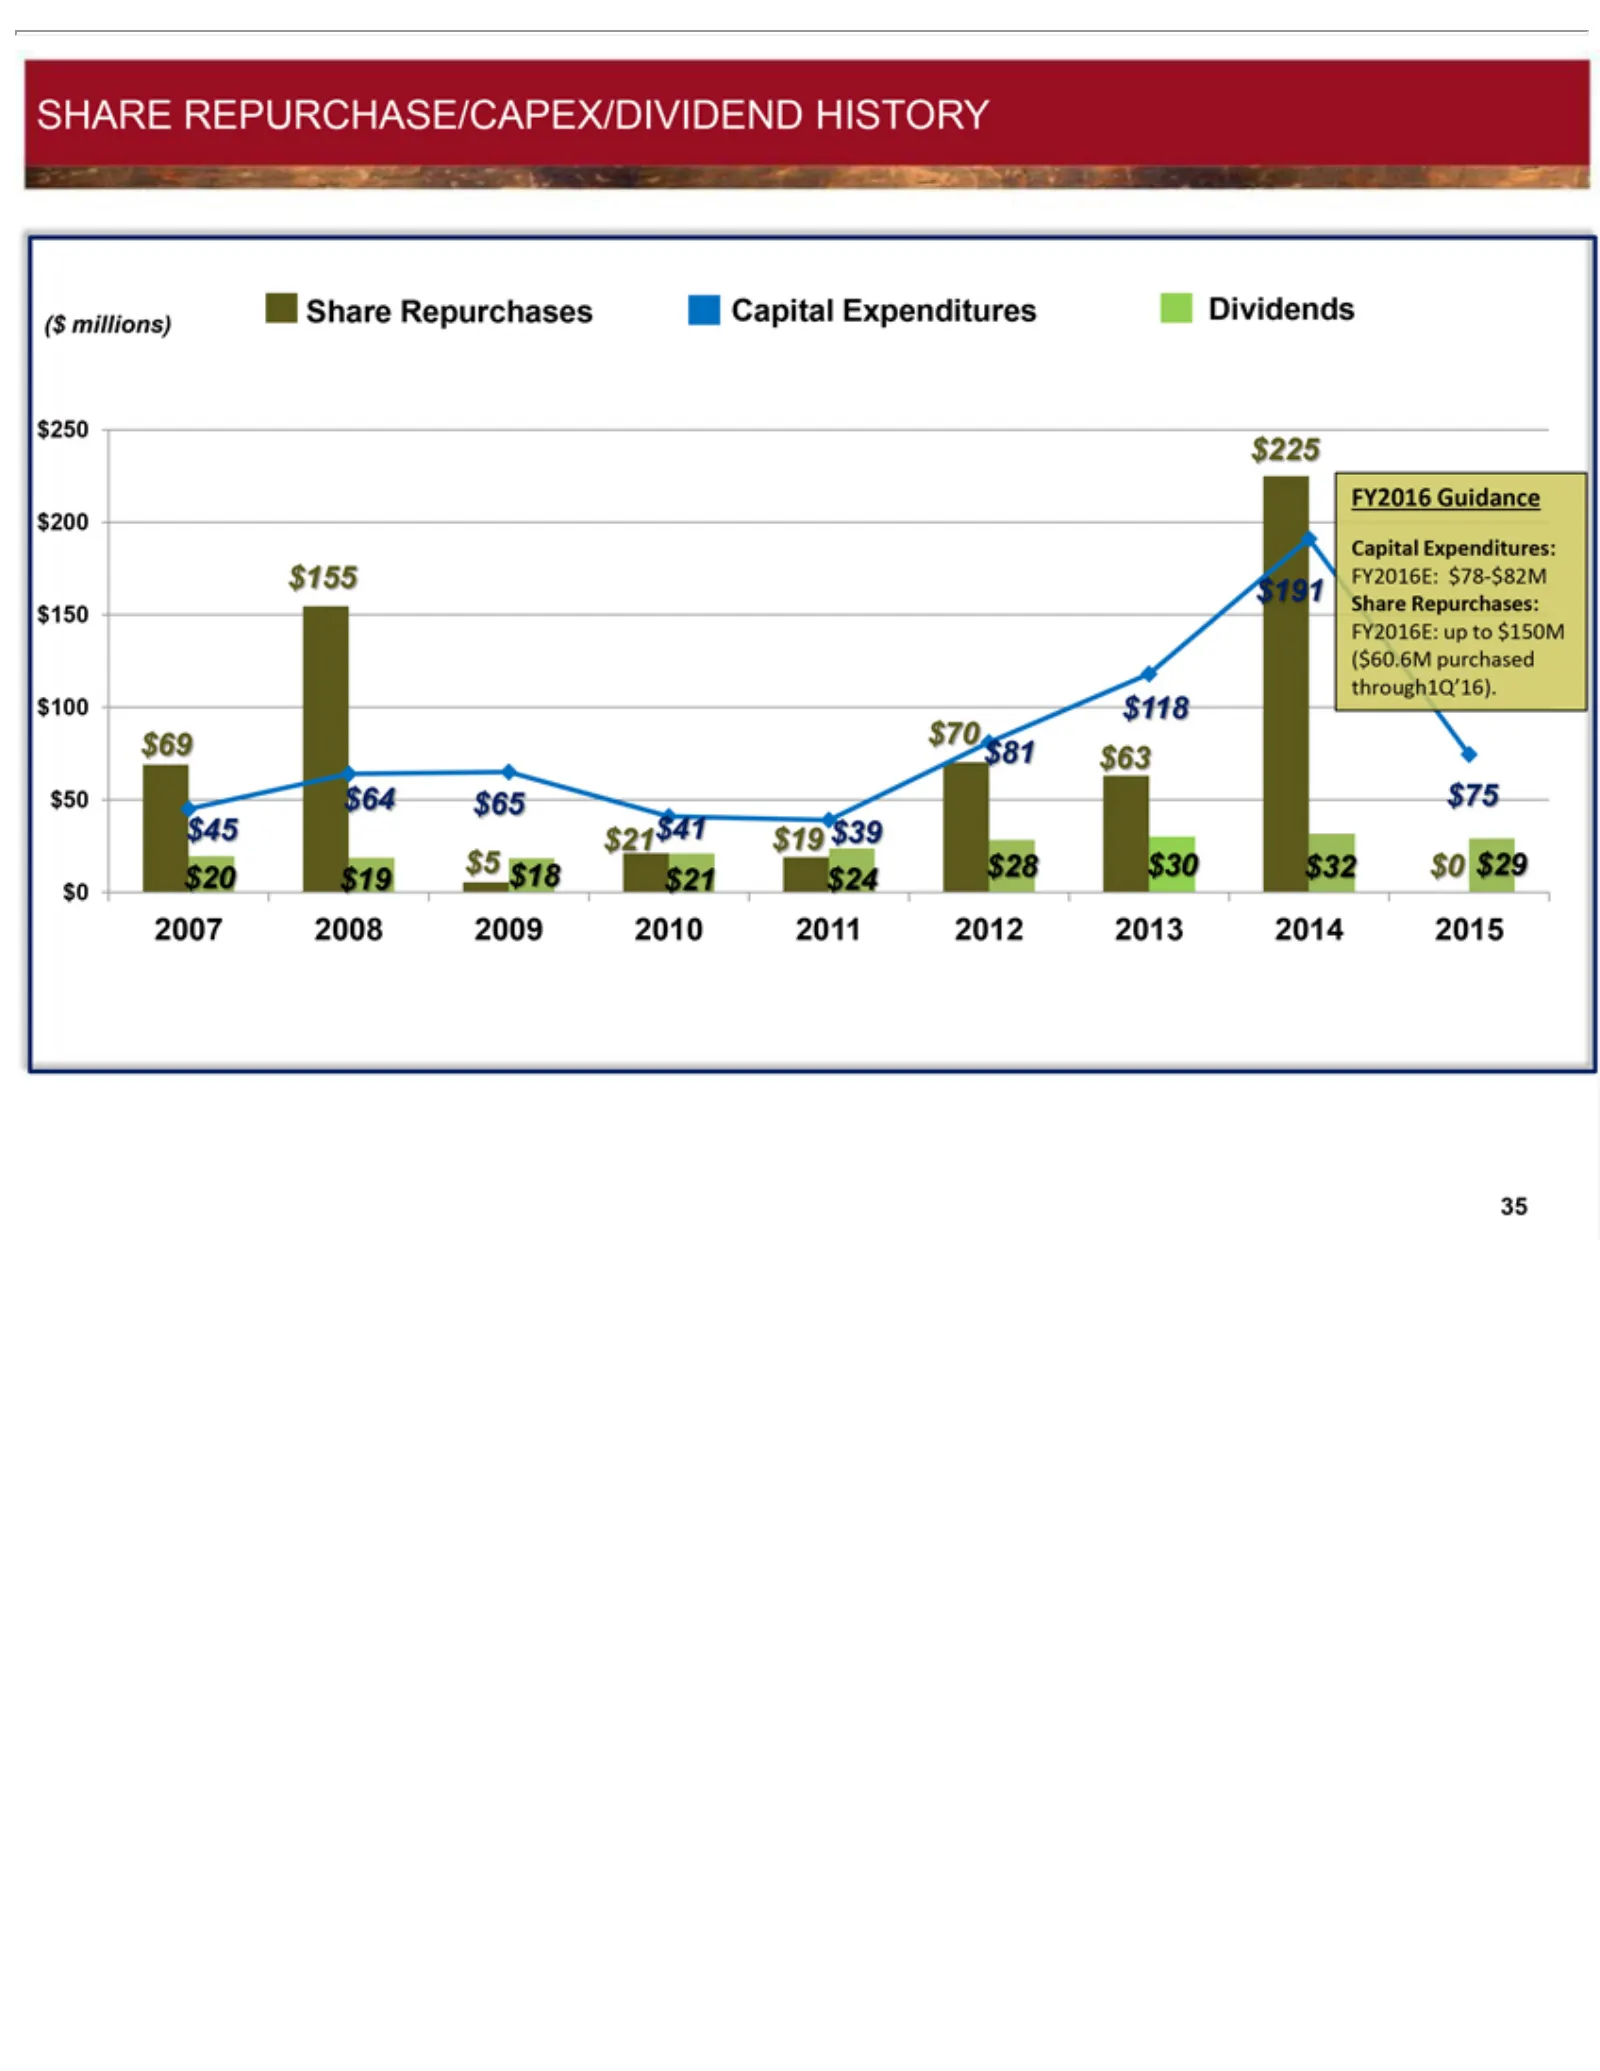
SHARE Share ($ FY2016 $225 $250 Capital FY2016E: ($60.6M $69 $118 $81 $50 $45 $5 $20 2007 $0 35 millions) $18 $70 $63 $64 $41 $19 2008 Repurchases $28 Expenditures: $65 $19 $21 REPURCHASE/CAPEX/DIVIDEND Guidance purchased up 2009 $30 $75 $39 $24 to $32 $150M 2010 $200 Capital $100 $0$155 2011 $29 th
Slide 36: Dividend History
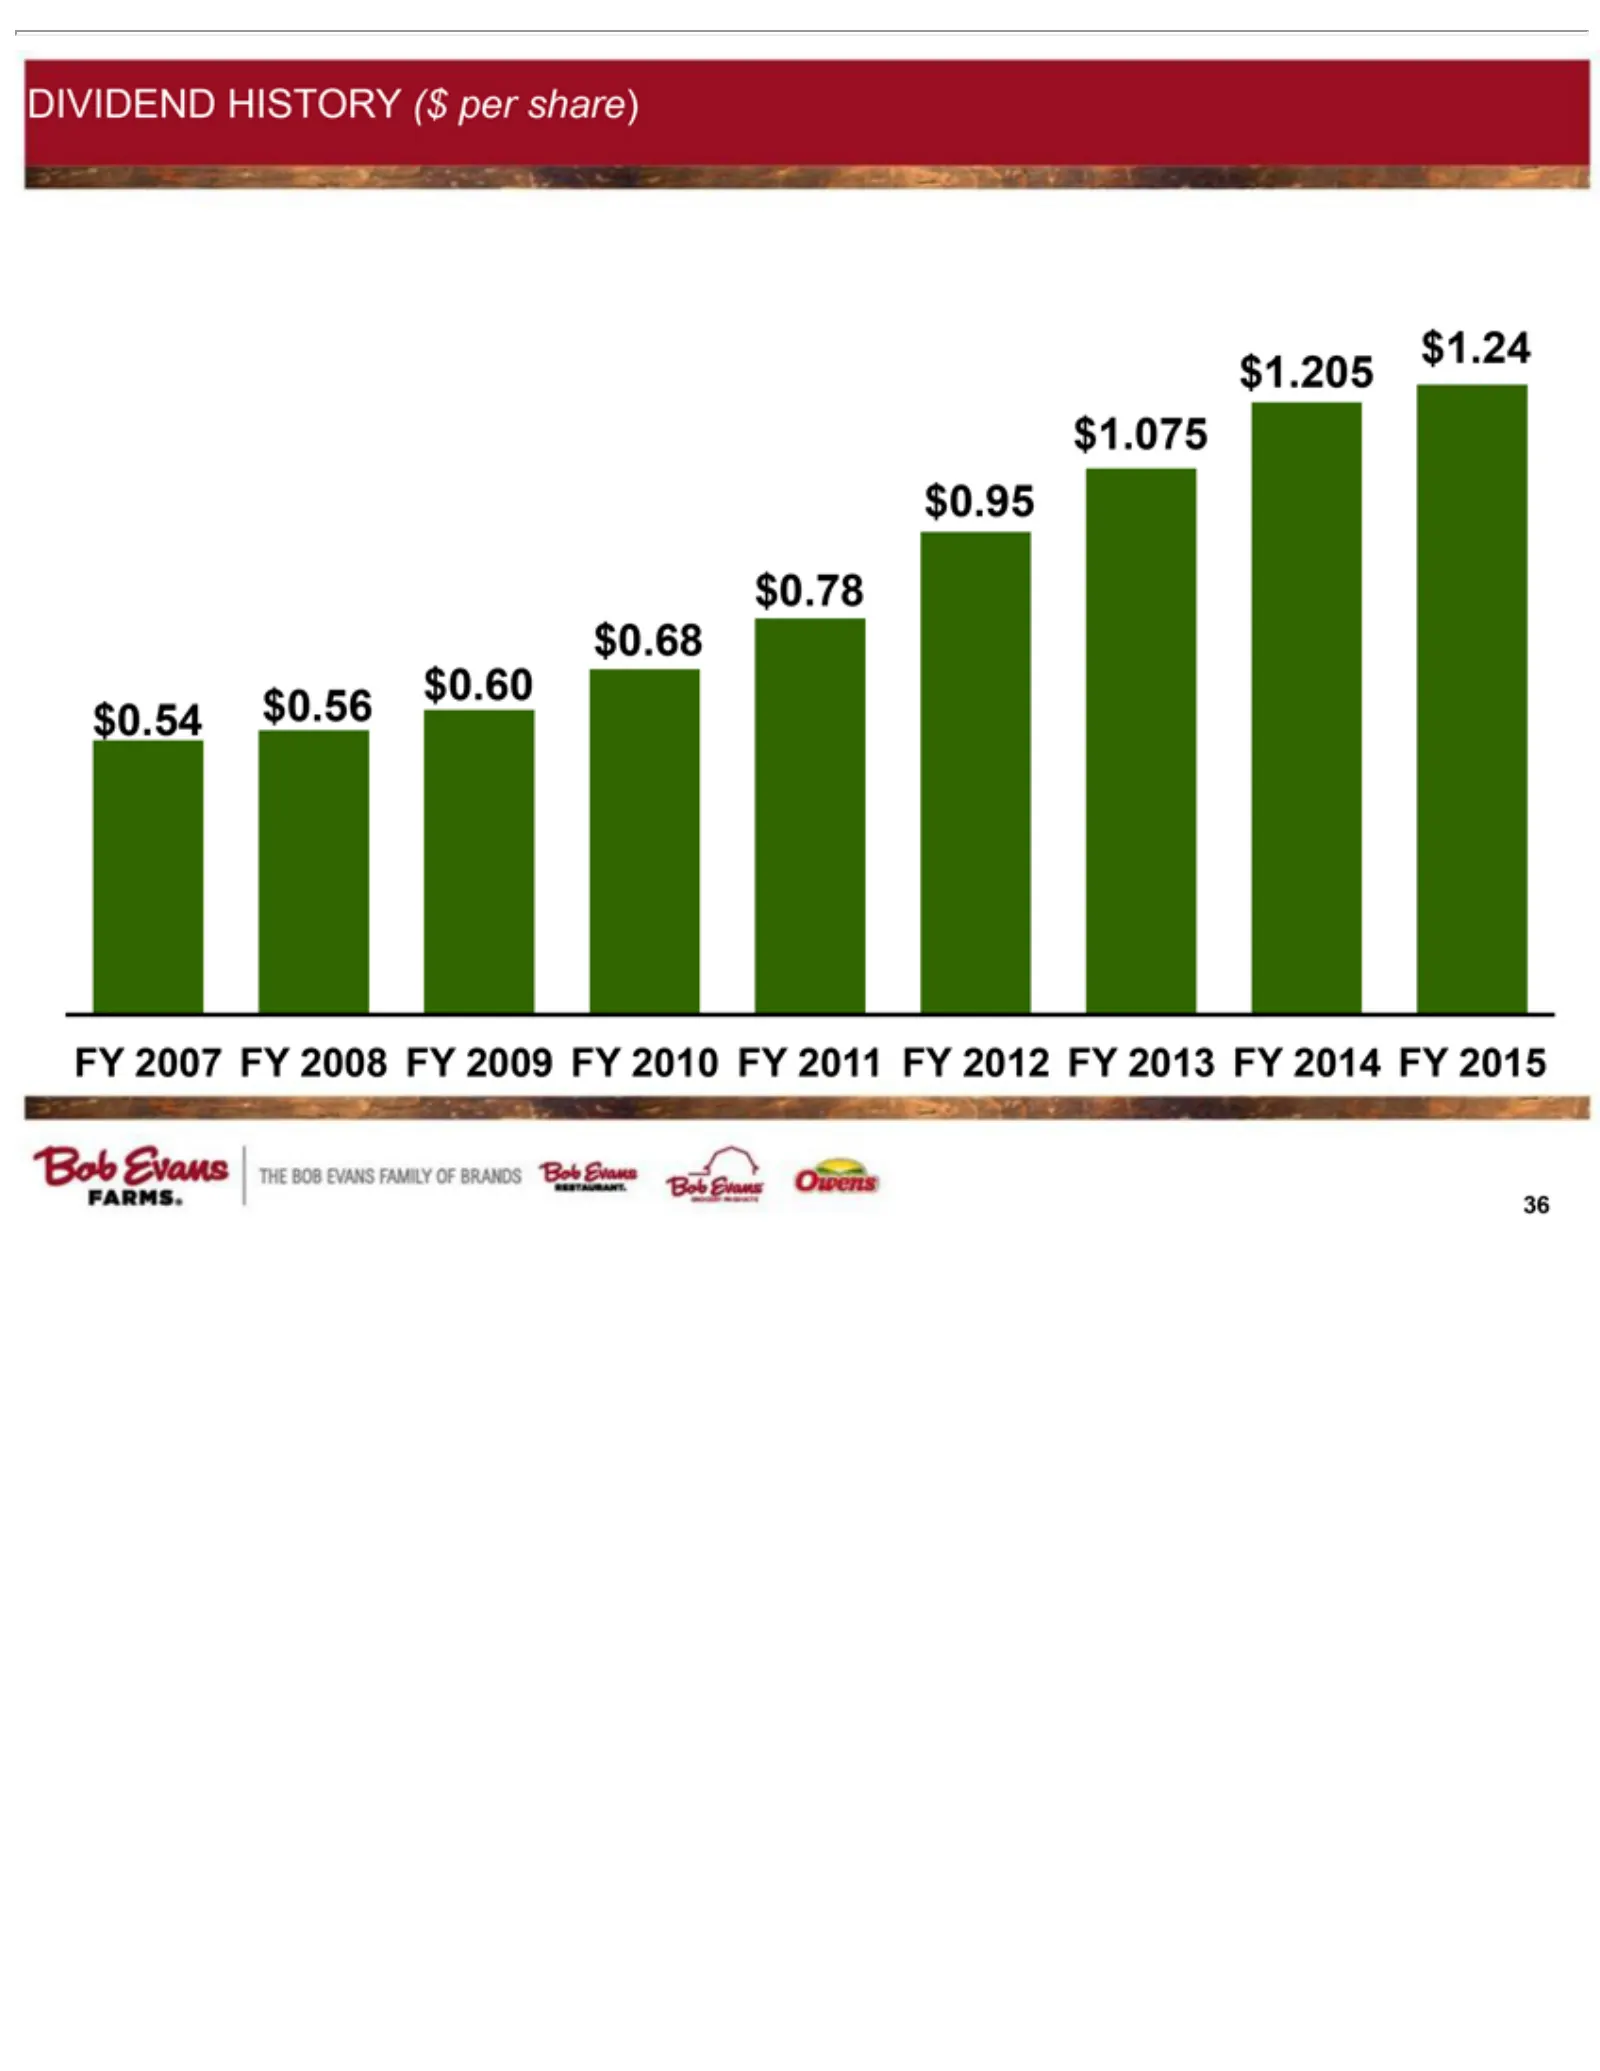
DIVIDEND $0.54 $0.60 $0.68 $0.78 $0.95 $1.075 $1.205 $1.24 FY 36 2007 $0.56 FY HISTORY 2008 FY 2009 ($ per FYshare) 2010 FY 2011 FY 2012 FY 2013 FY 2014 FY 2015
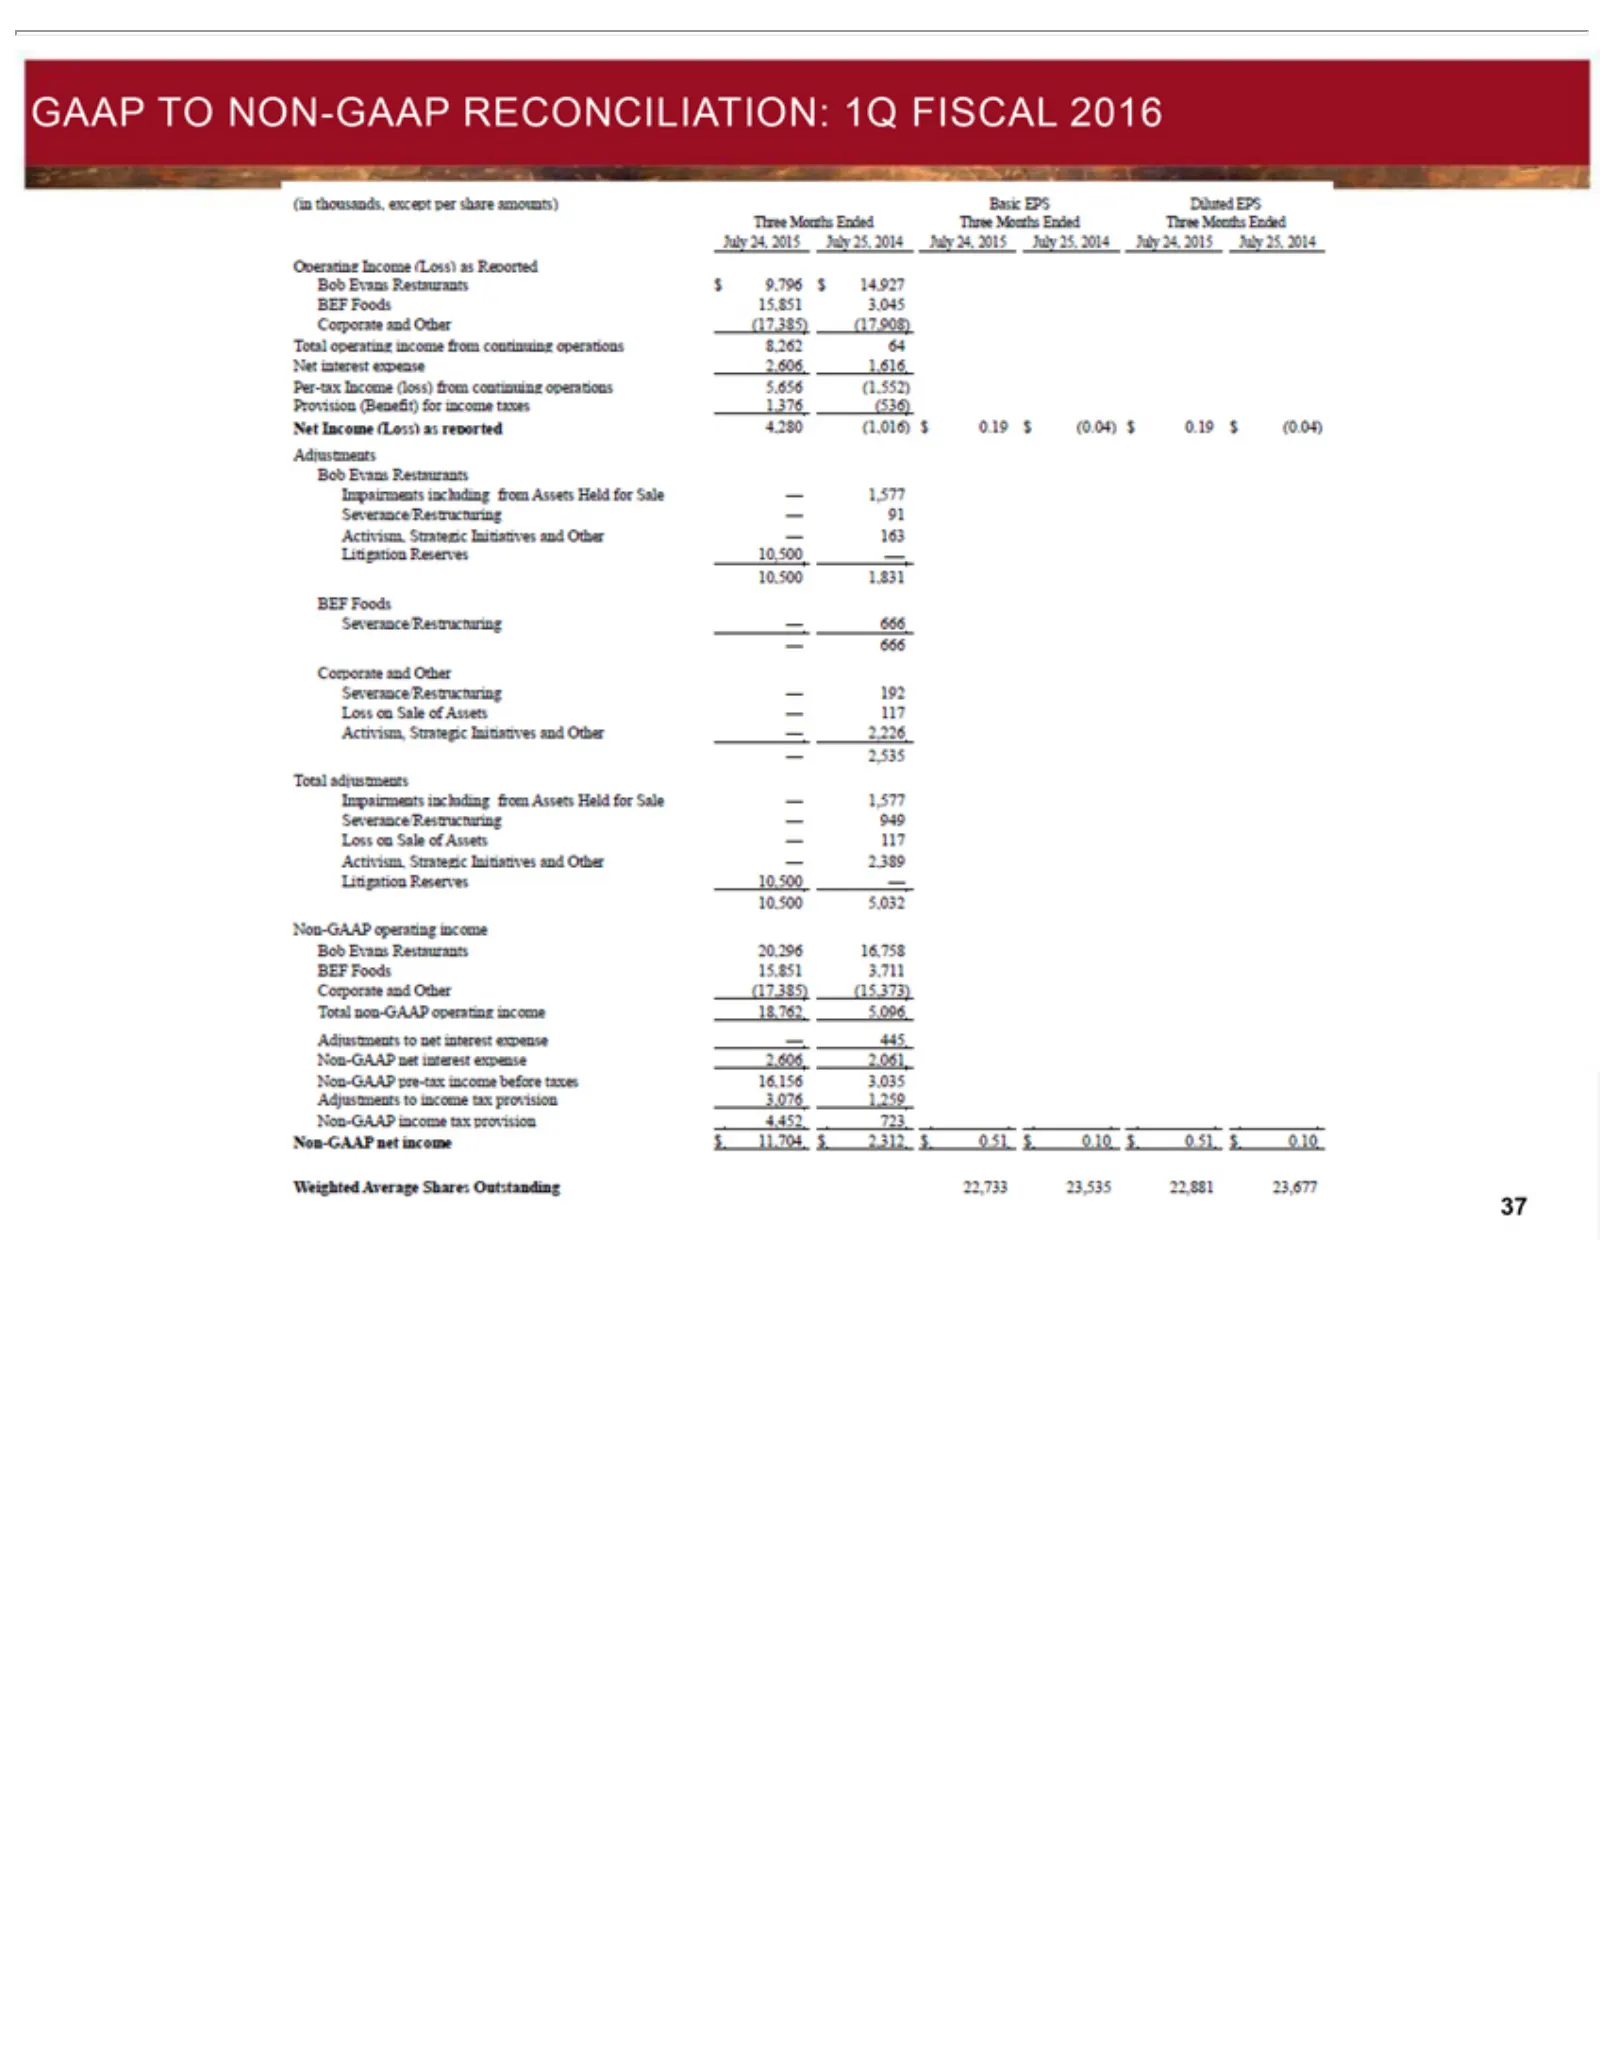
Slide 37: GAAP to Non-GAAP Reconciliation: 1Q Fiscal 2016
GAAP TO NON-GAAP RECONCILIATION: 1Q FISCAL 2016 37
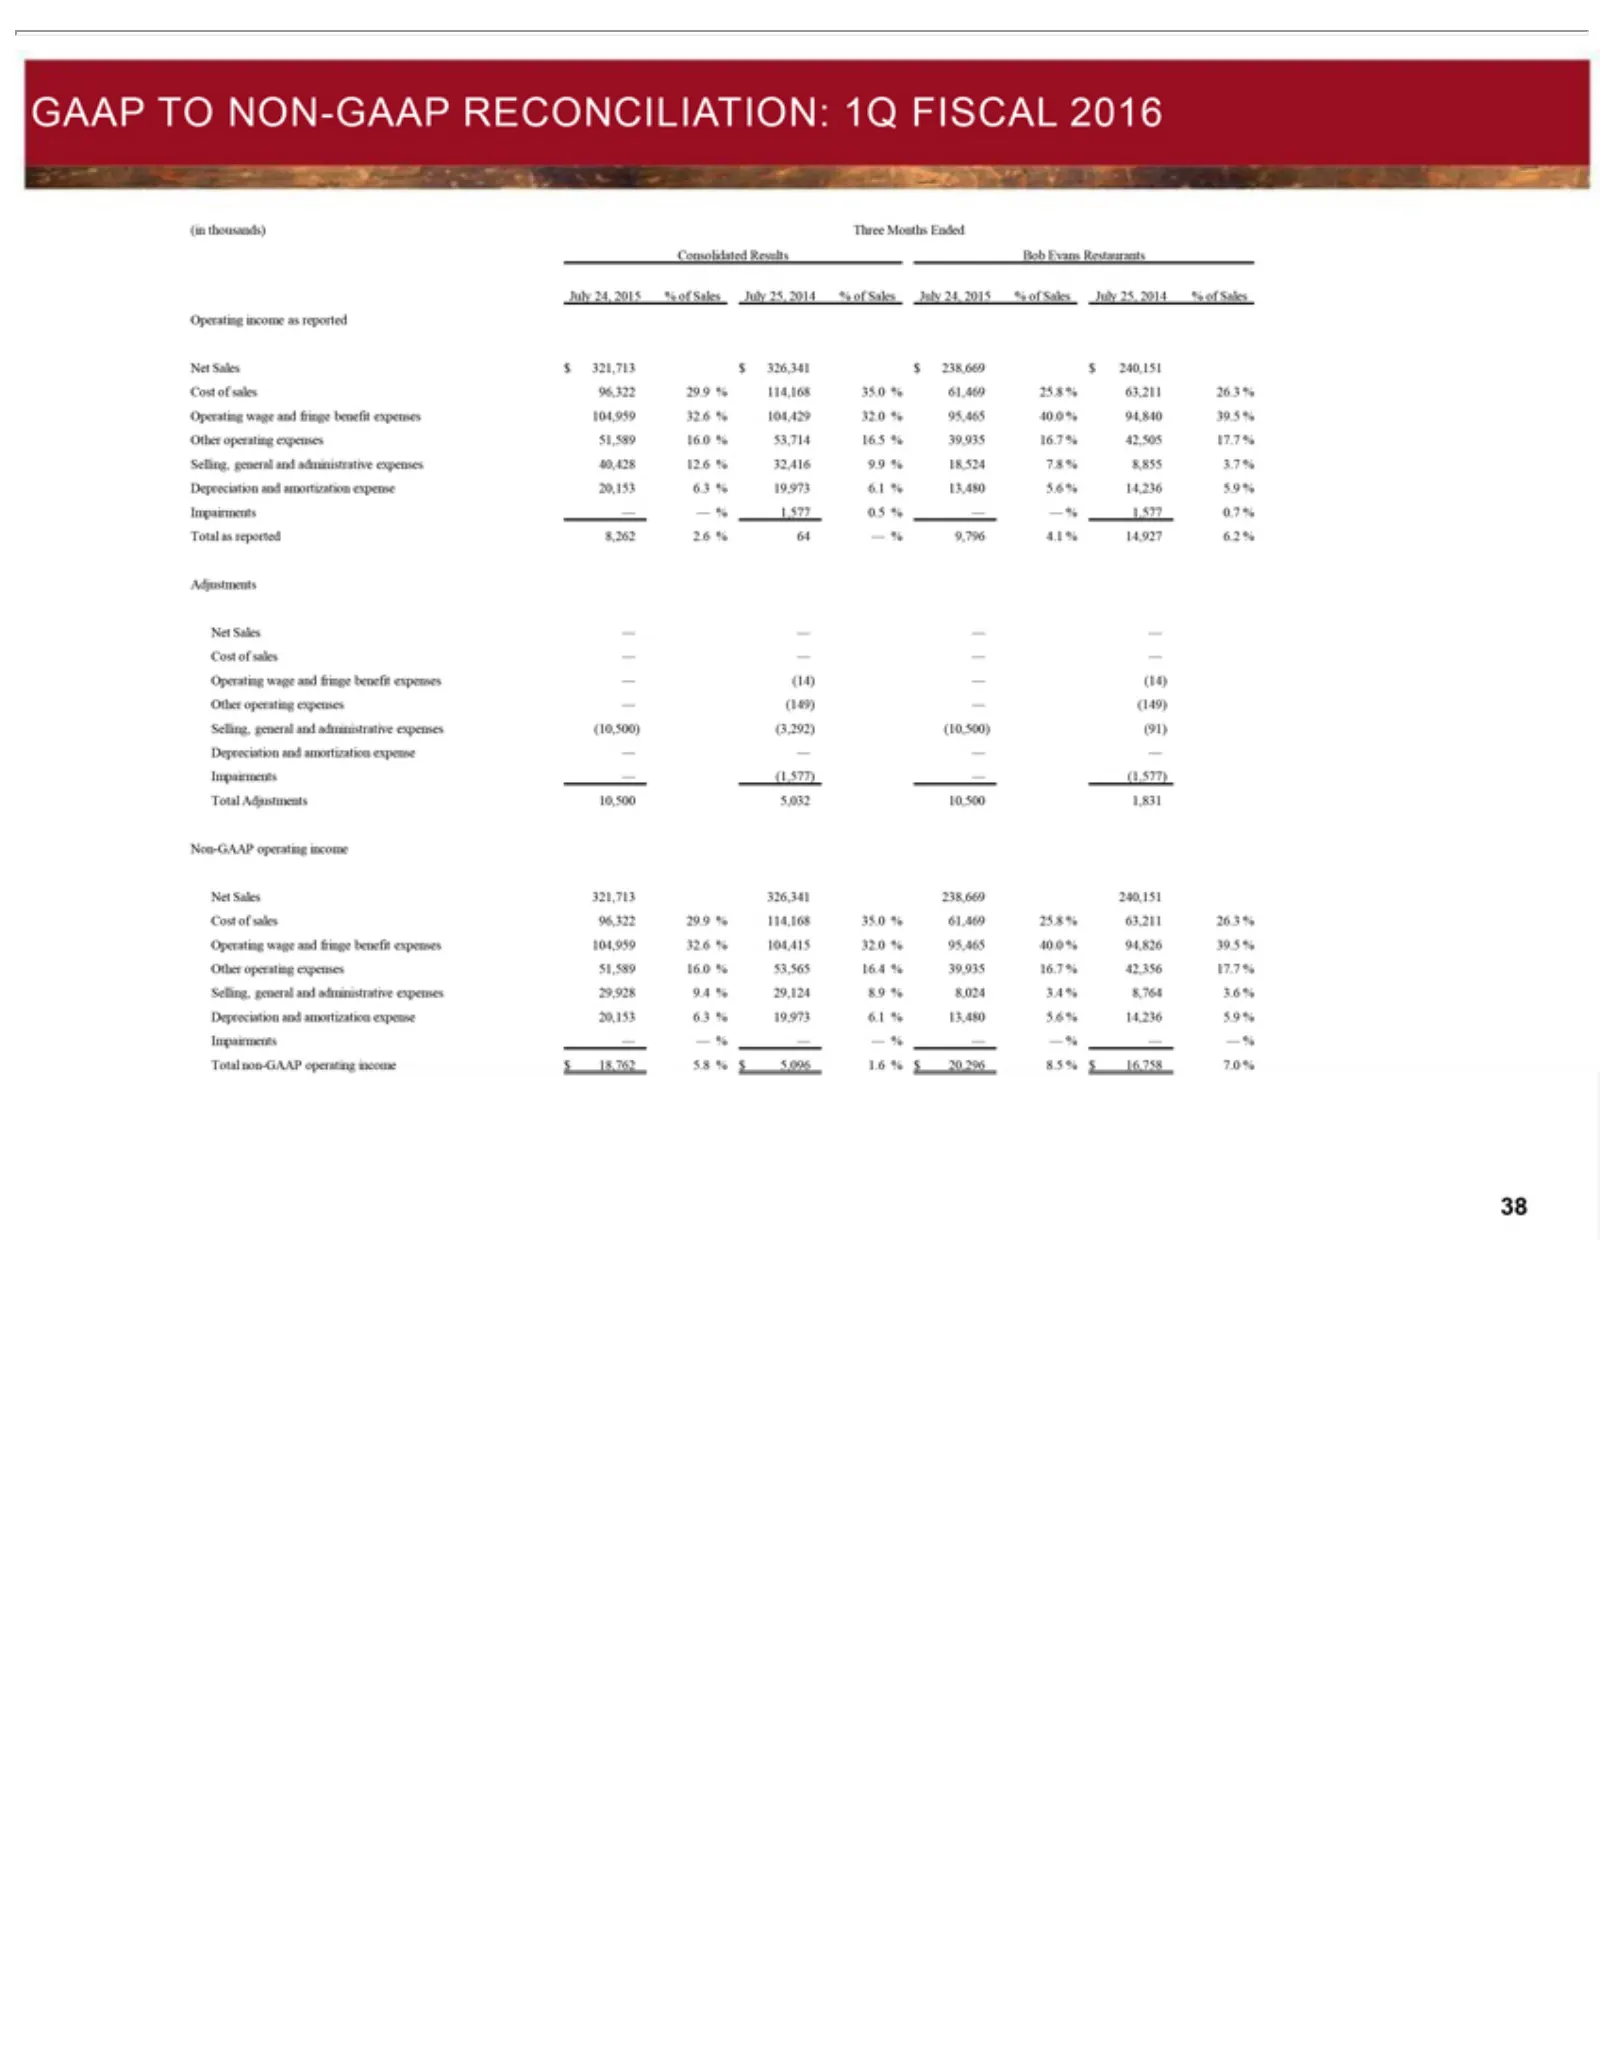
Slide 38: GAAP to Non-GAAP Reconciliation: Bob Evans Restaurants
GAAP (in Three Consolidated Bob July $Operating Cost 29.9 96,322 35.0 25.8 26.3 32.6 104,959 32.0 40.0 539.5 16.0 51,589 416.5 16.7 S 317.7 12.6 40,428 89.9 7.8 D 3.7 6.3 20,153 6.1 I5.6 5.9 0.5 T 60.7 2.6 198,262 4.1 A % 6.2 Net C (O — Other Selling, (91) (3,292) (10,500) 7.0% 96,322 635.0 25.8 26.
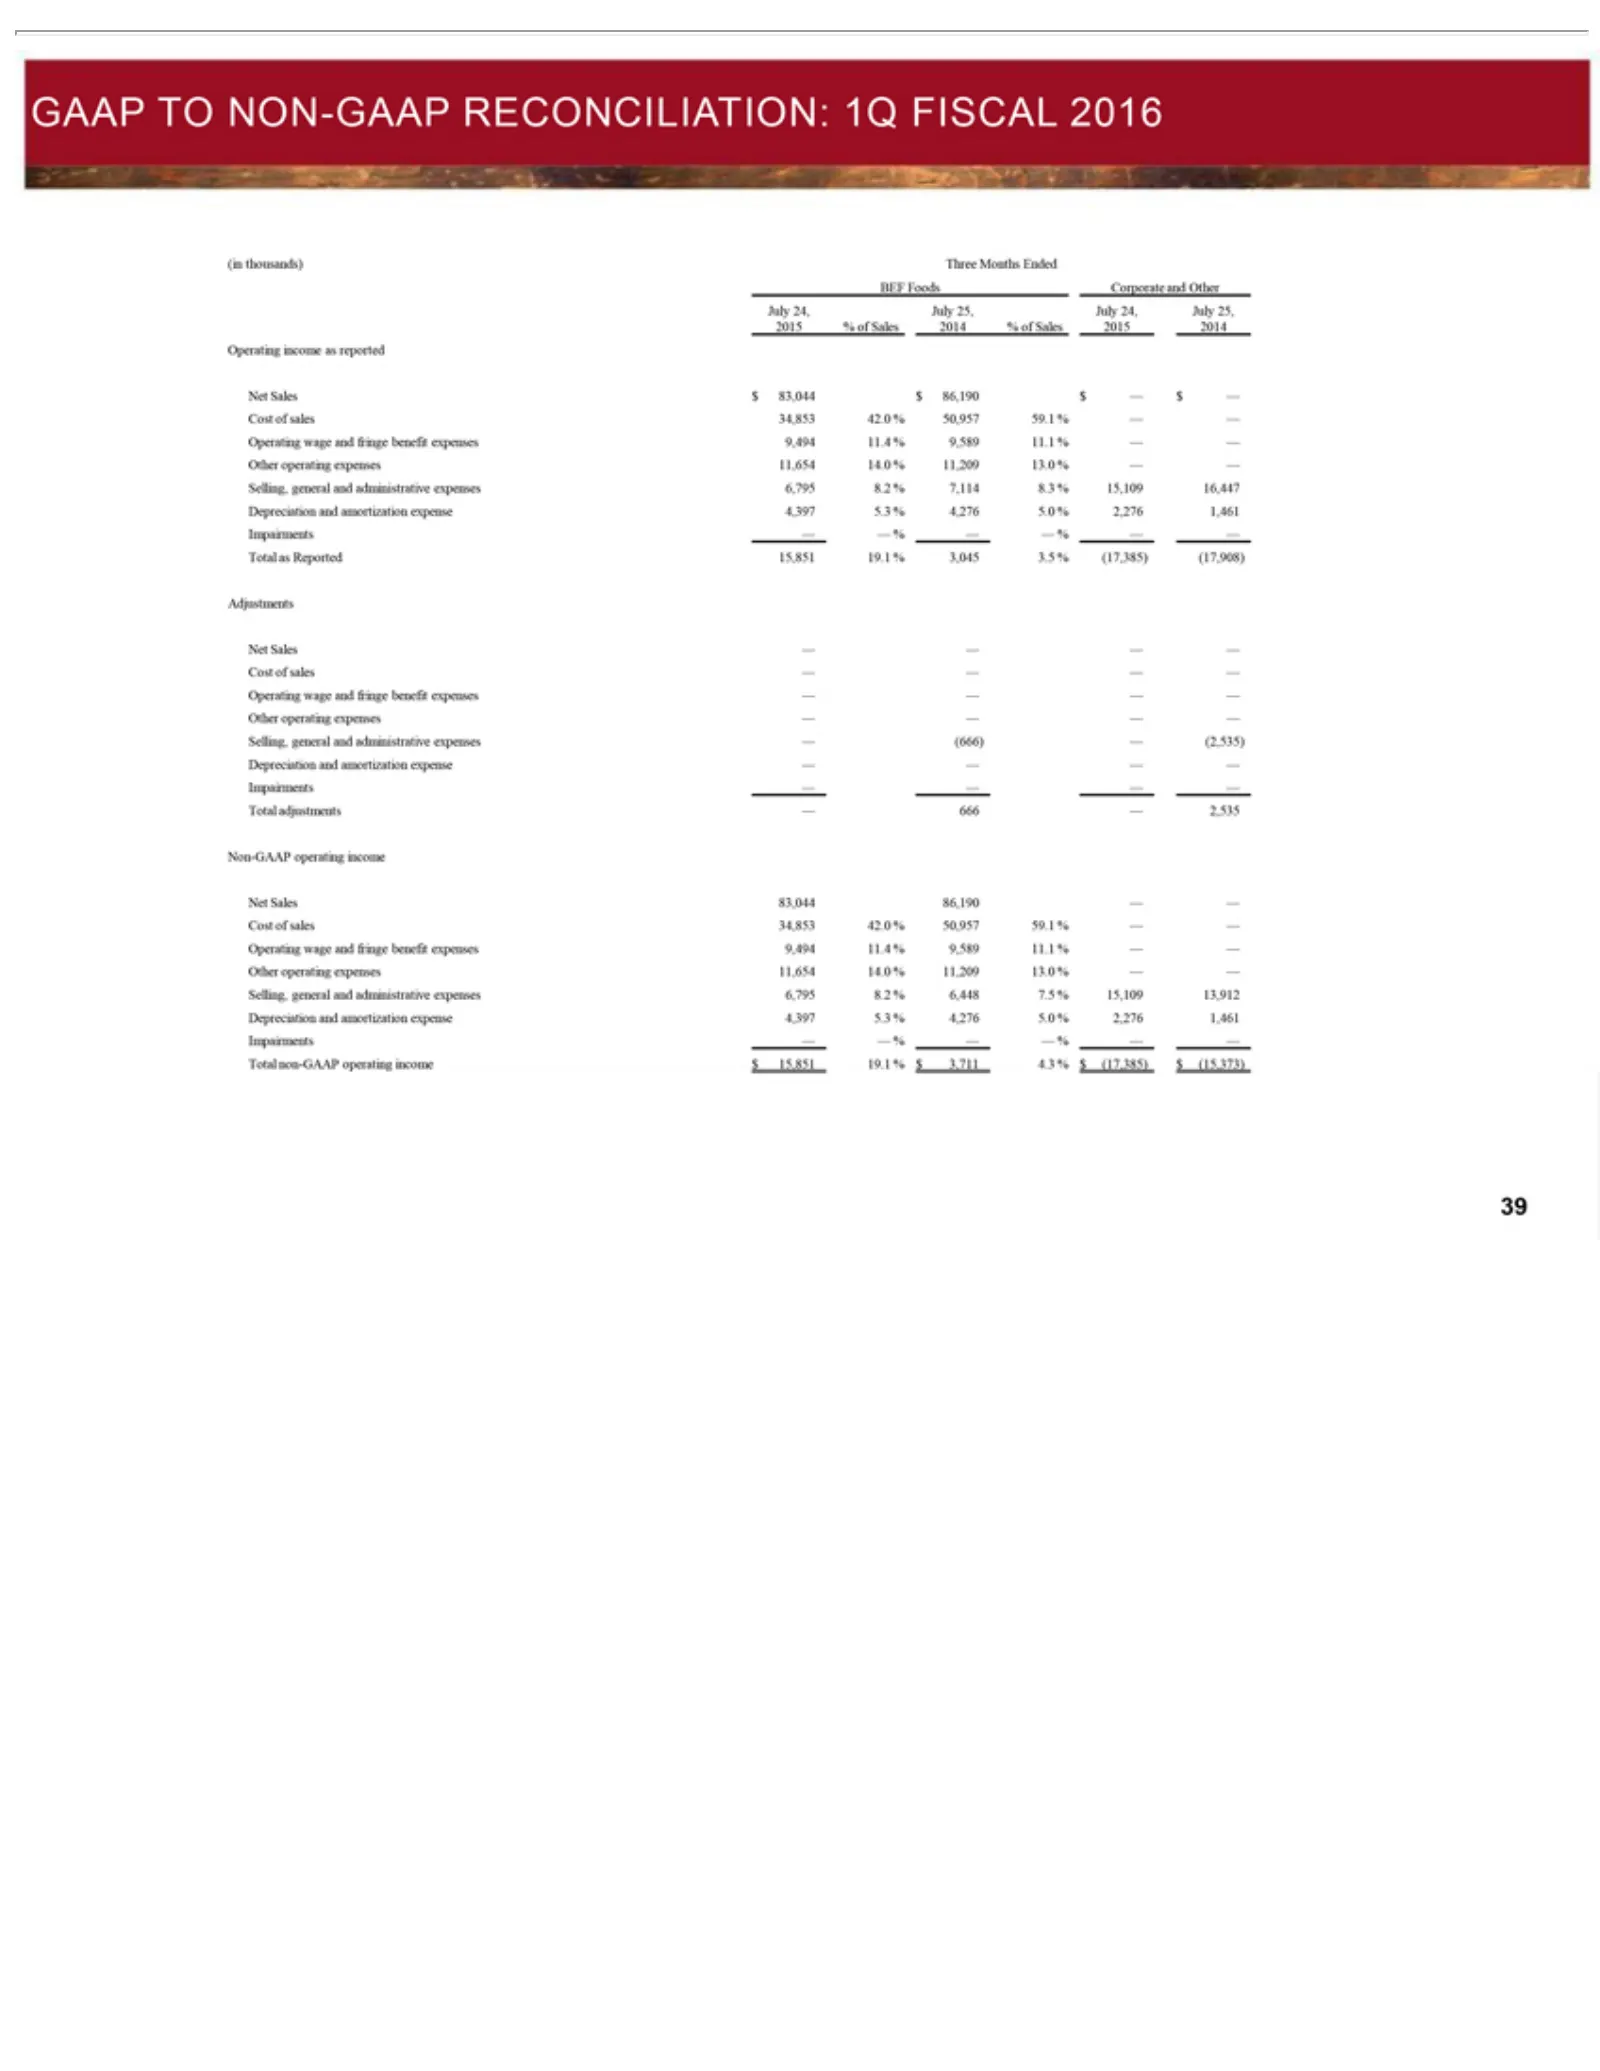
Slide 39: GAAP to Non-GAAP Reconciliation: BEF Foods
GAAP (in Three BEF Corporate July Adjustments Non-GAAP Net Cost Operating Other Selling, Depreciation Total Impairments 83,044 4,397 6,795 11,654 9,494 34,853 42.0 % 8.3 7,114 16,447 3.5 3,045 (17,908) 426((17,385) 86,190 59.1 50,957 11.1 9,589 13.0 811,209 7.5 6,448 5.3 13,912 15,109 5.0 4,276 1,46
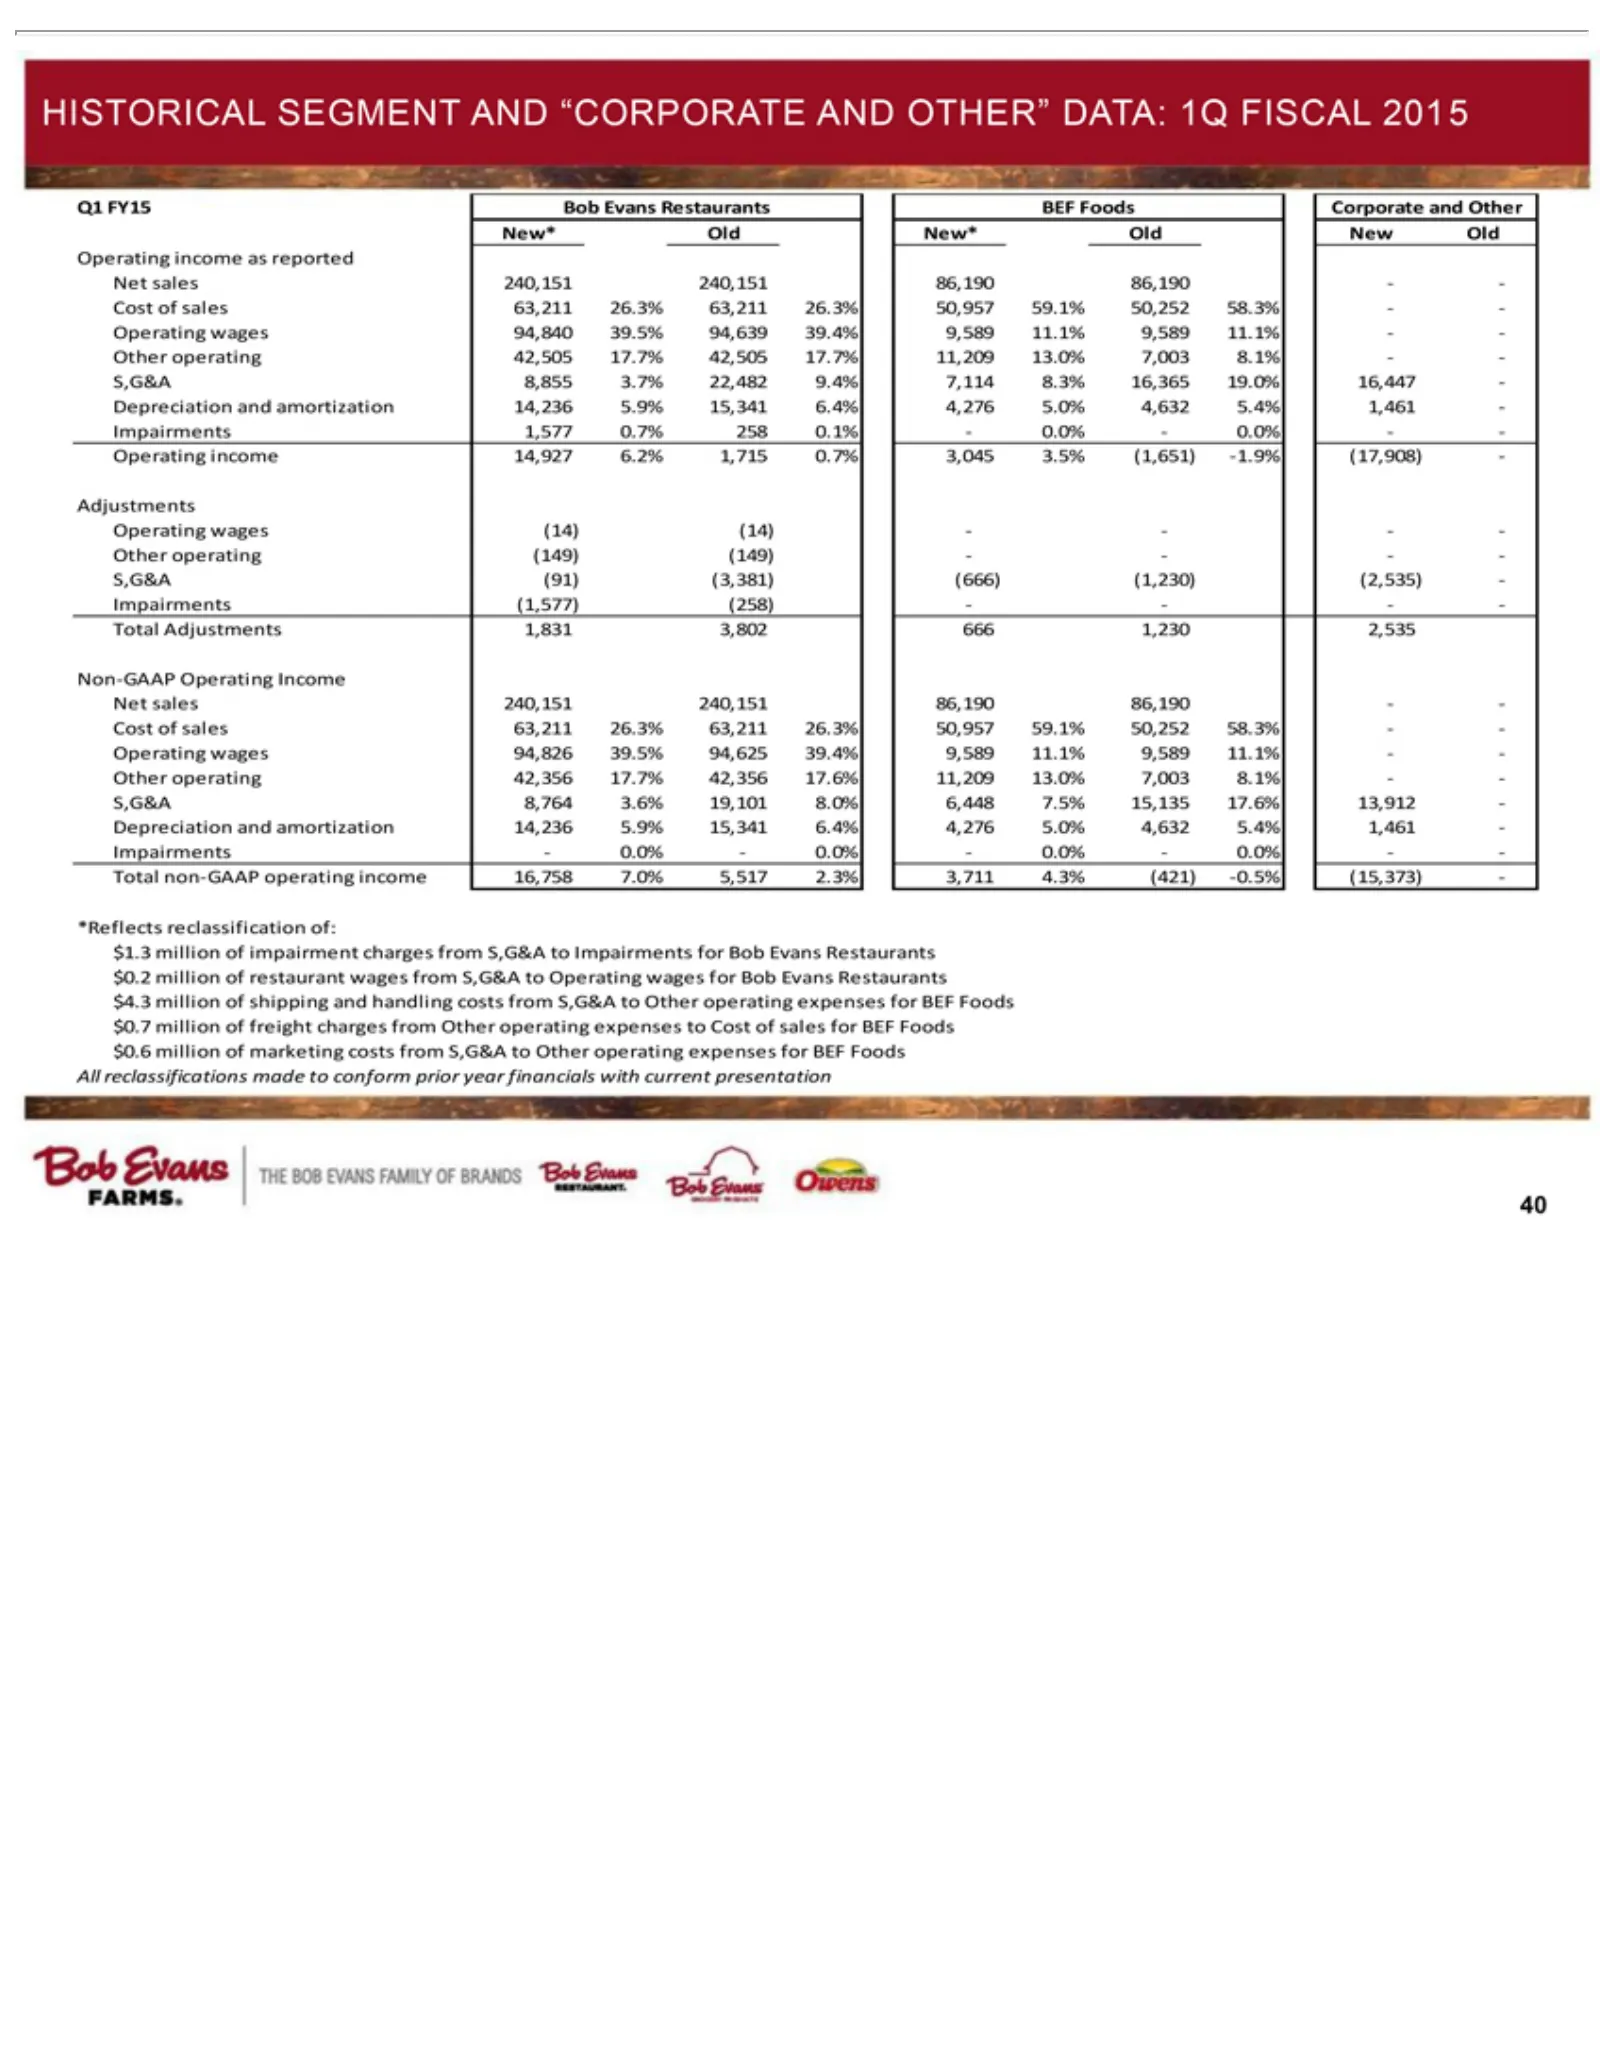
Slide 40: Historical Q1 Segment Results
HISTORICAL Q1 Bob Operating Old 94,639 94,840 42,505 16,447 19.0% 16,365 8.3% 7,114 9.4% 22,482 3.7% 8,855 0.1% 258 1,577 A (17,908) -1.9% (1,651) 3.5% 3,045 0.7% 1,715 6.2% 14,927 (14) (149) (91) (1,577) 1,831 240,151 C 58.3% 50,252 59.1% 50,957 26.3% 63,211 O 11.1% 9,589 39.4% 94,625 39.5% 94,826
Slide 41: Historical Q2 Segment Results
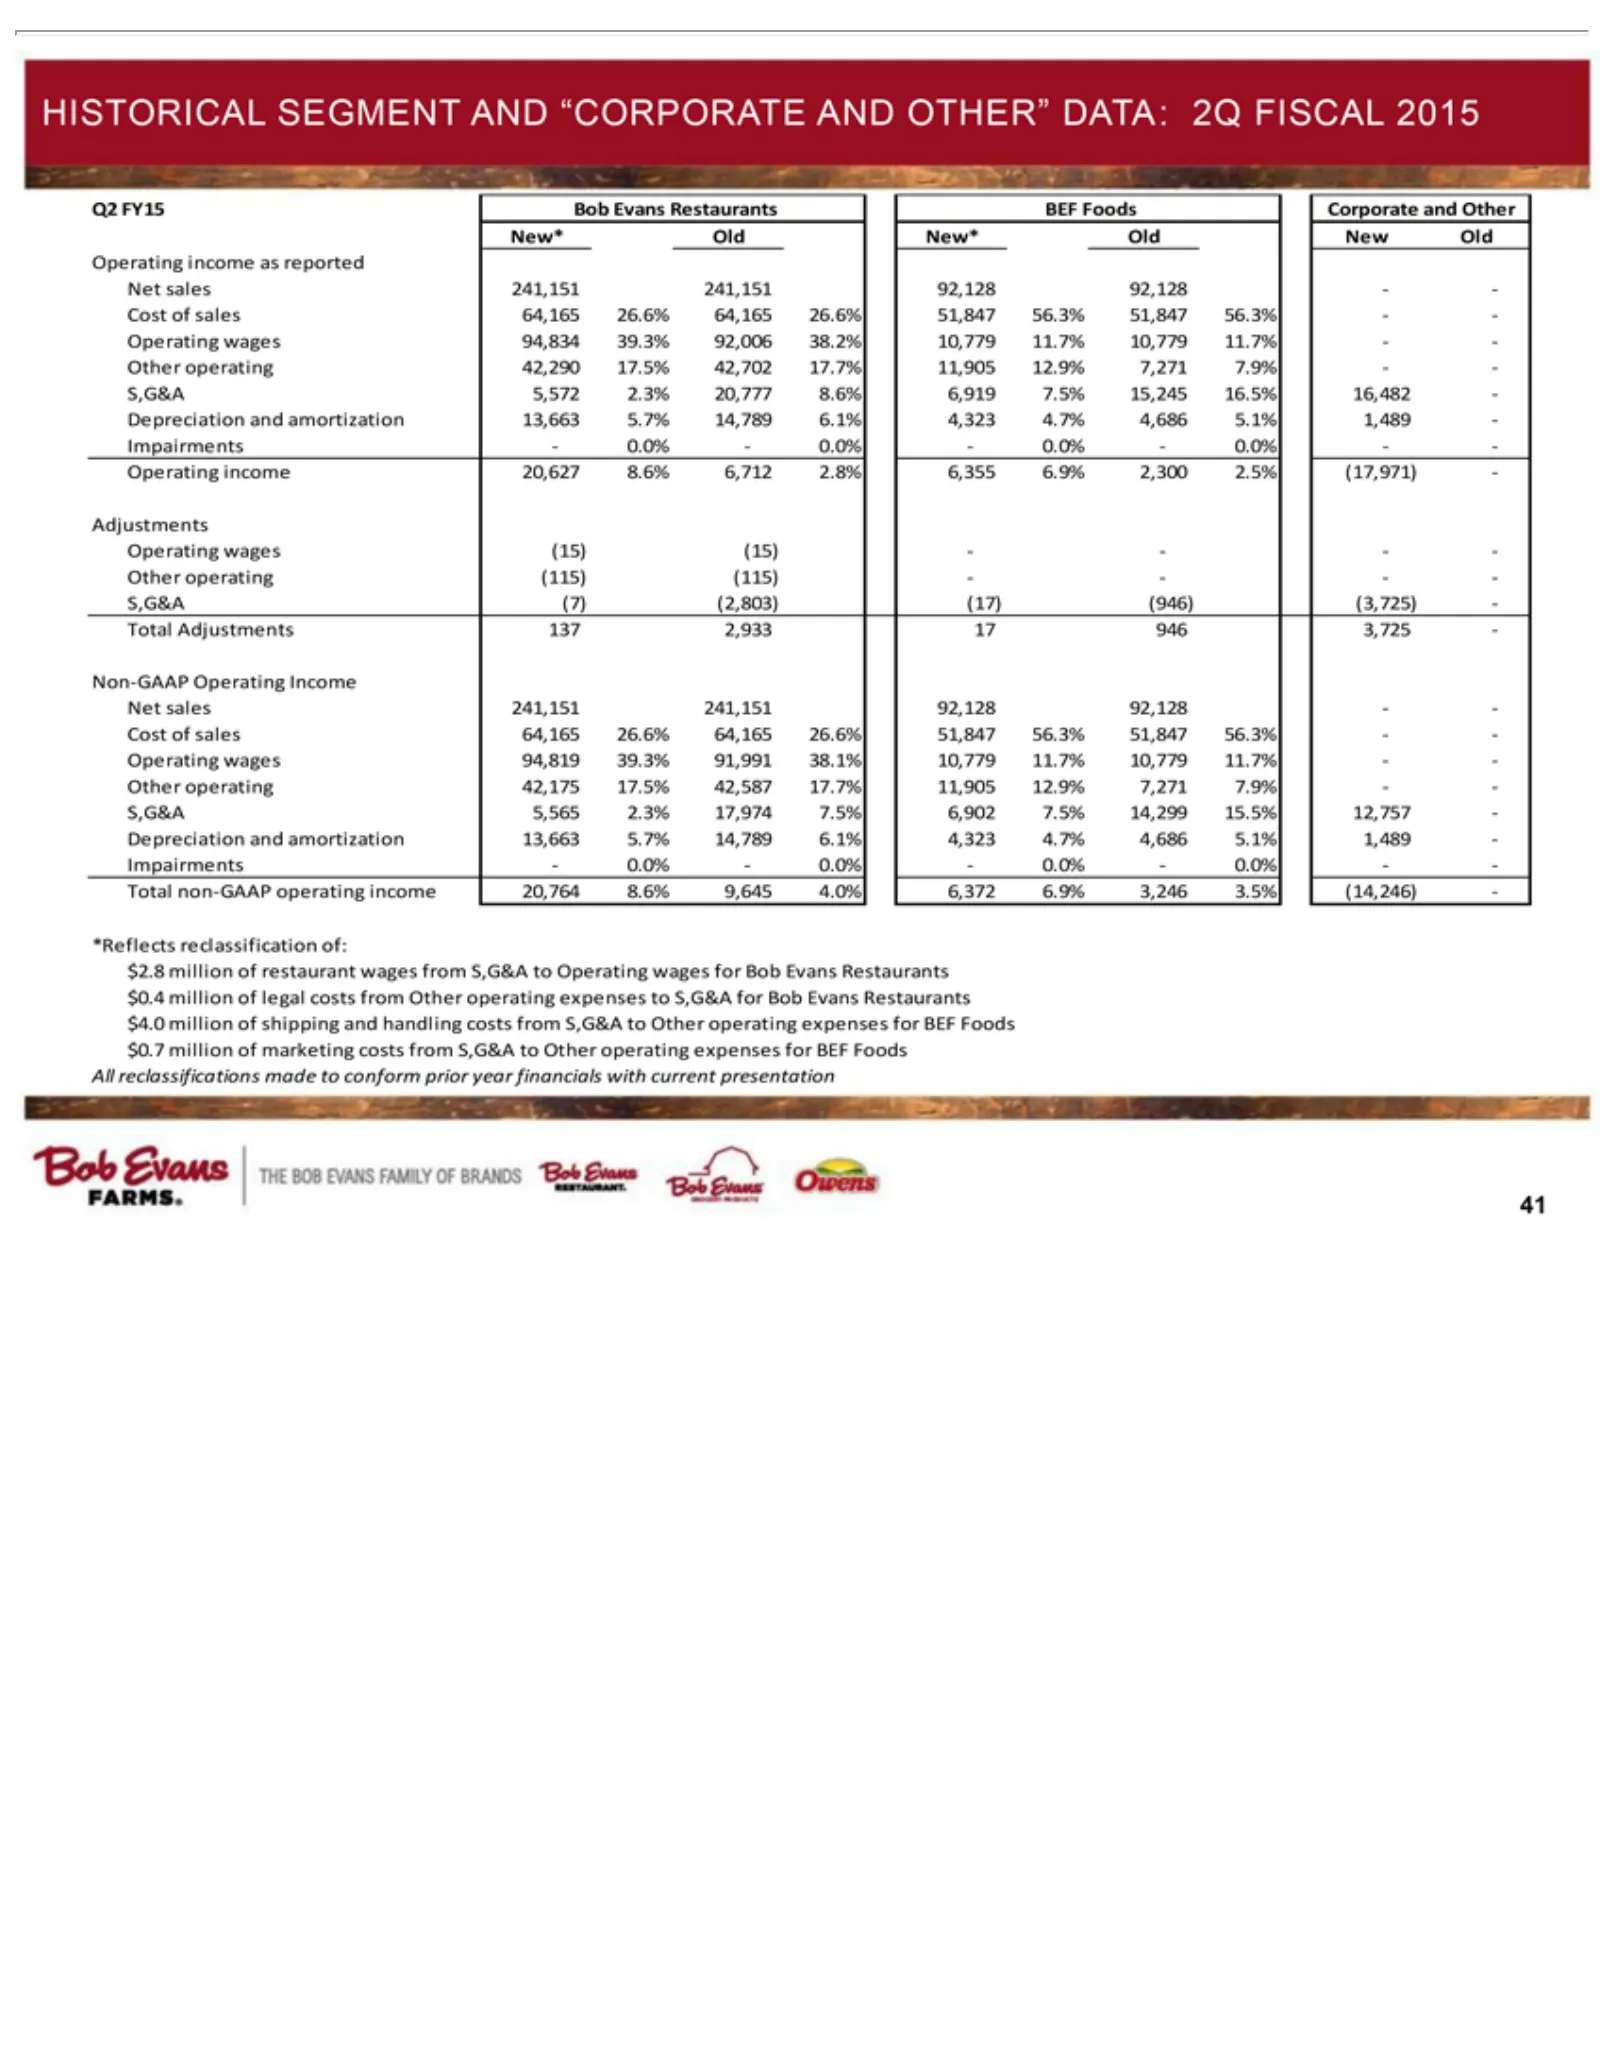
HISTORICAL Q2 Bob Operating Old 38.2% 92,006 94,834 42,702 42,290 16,482 16.5% 15,245 6,919 20,777 5,572 A (17,971) 2.5% 2,300 6,355 2.8% 6,712 20,627 (15) (115) (7) 137 N 241,151 C 56.3% 51,847 26.6% 64,165 O 11.7% 10,779 38.1% 91,991 39.3% 94,819 S 7.9% 7,271 12.9% 11,905 17.7% 42,587 17.5% 42,175
Slide 42: Historical Q3 Segment Results
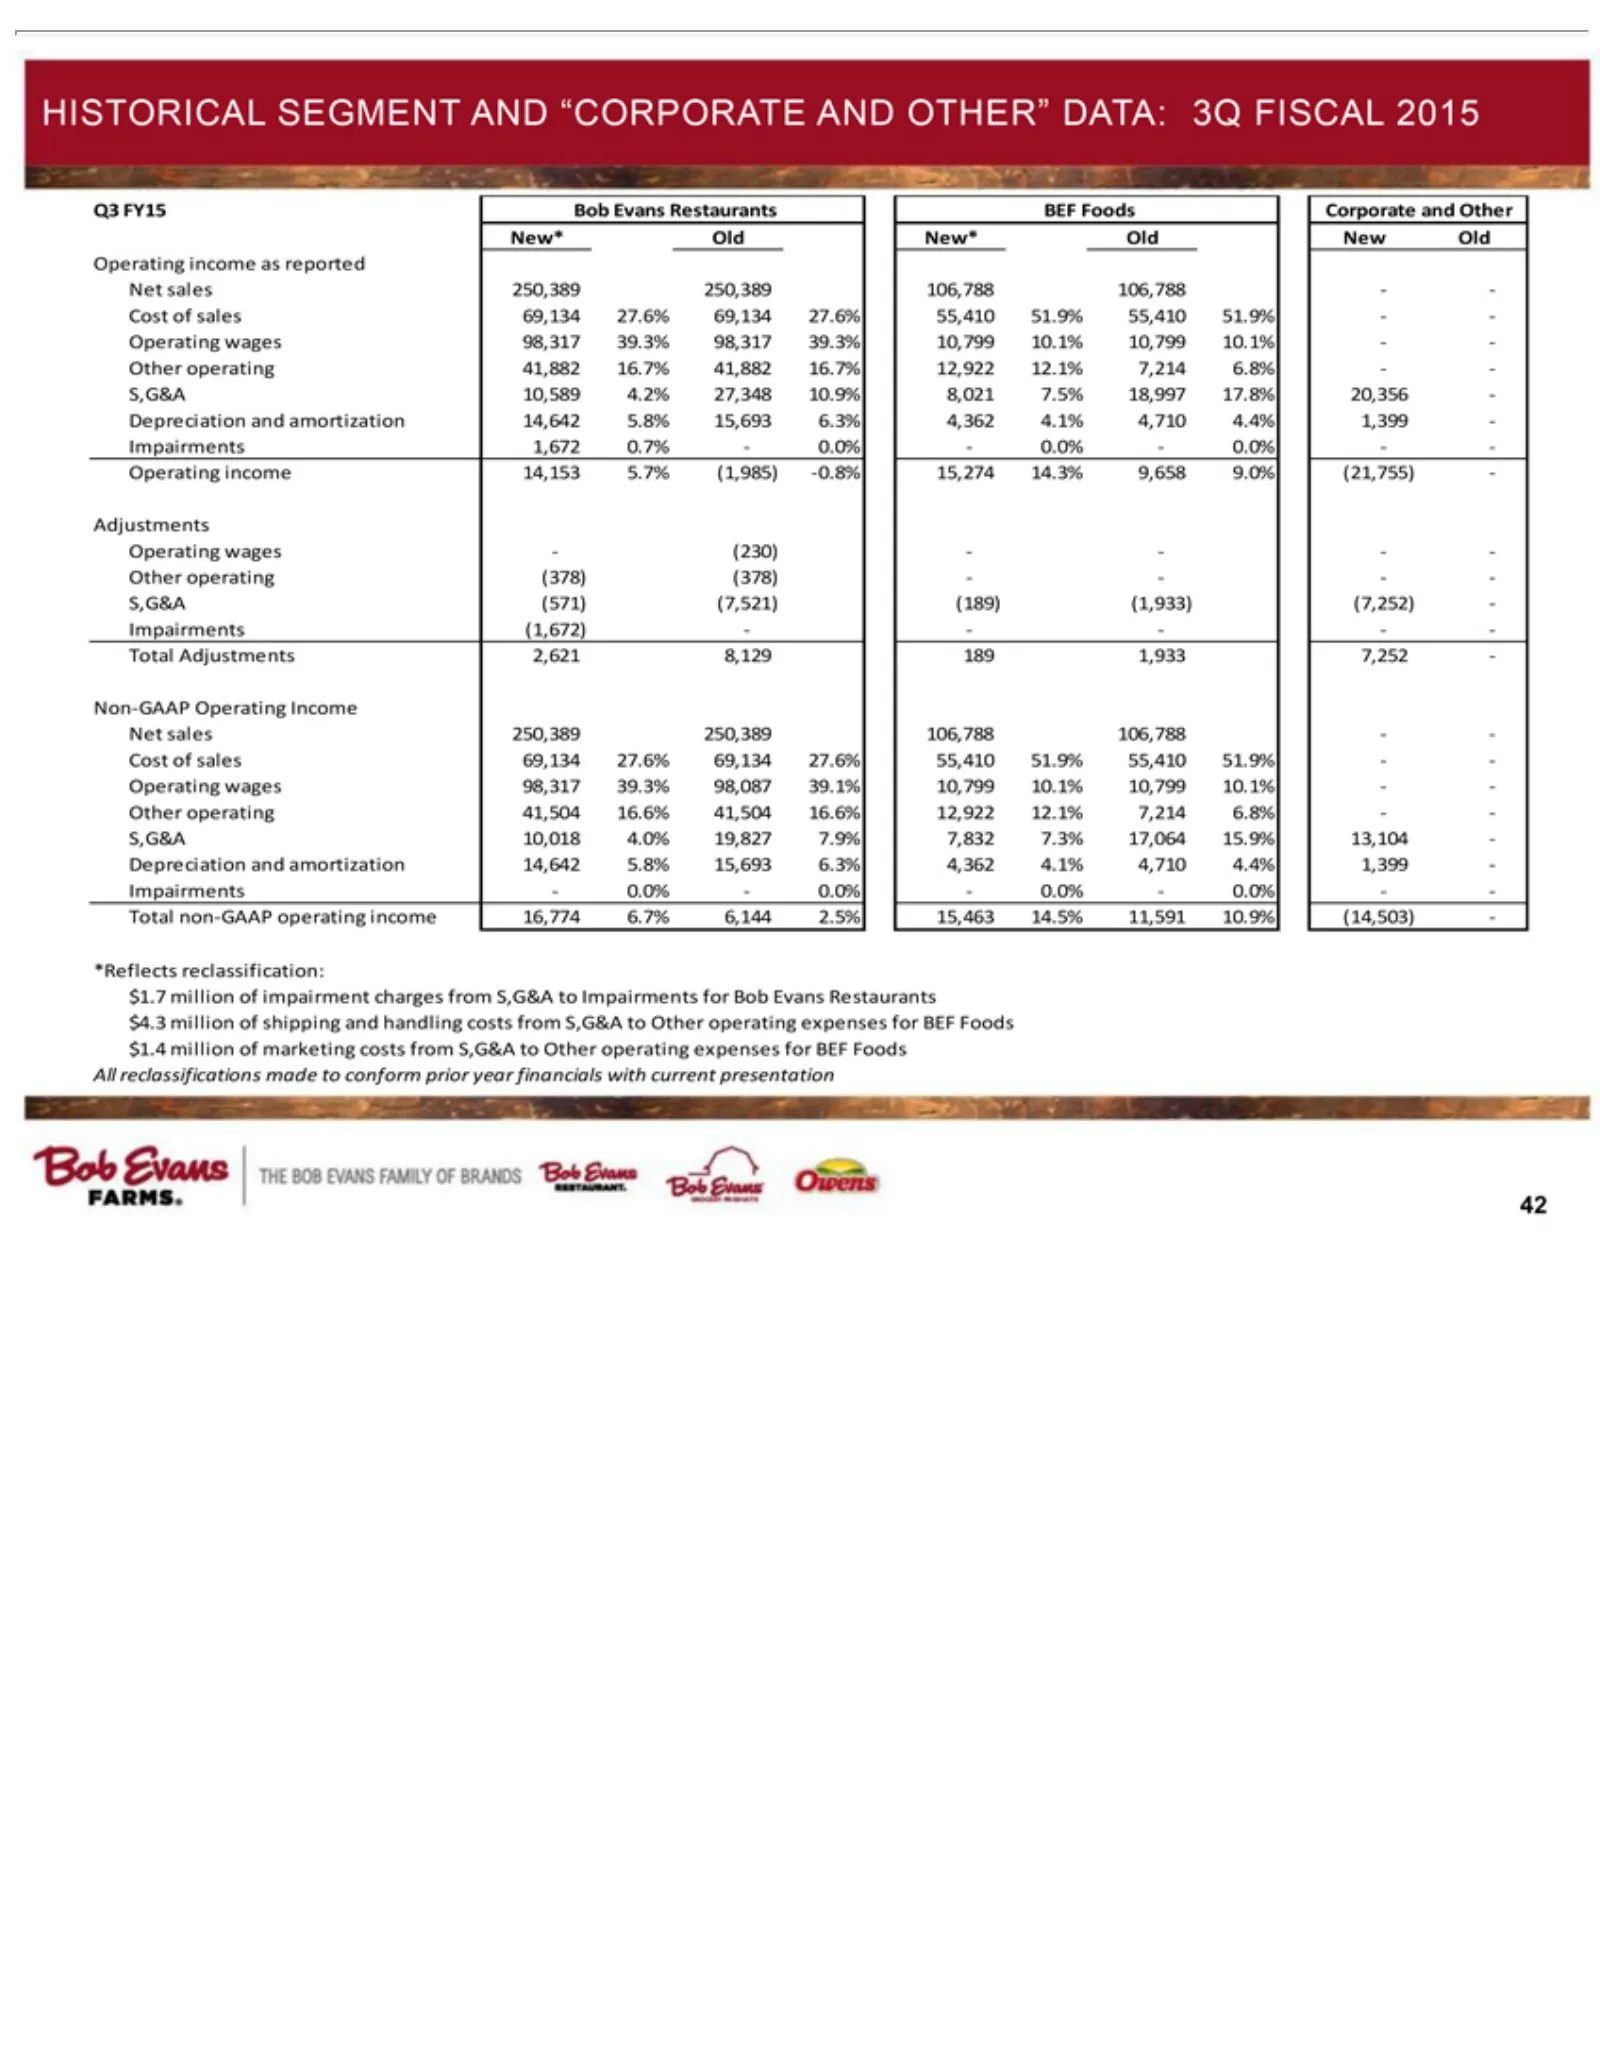
HISTORICAL Q3 Bob Operating Old 16.7% 41,882 20,356 17.8% 18,997 7.5% 8,021 27,348 4.2% 10,589 0.7% 1,672 A (21,755) 9.0% 9,658 14.3% 15,274 -0.8% (1,985) 5.7% 14,153 (378) (571) (1,672) 2,621 N 250,389 C 51.9% 55,410 27.6% 69,134 O 10.1% 10,799 39.1% 98,087 39.3% 98,317 S 6.8% 7,214 12.1% 12,922 16
Slide 43: Historical Q4 Segment Results
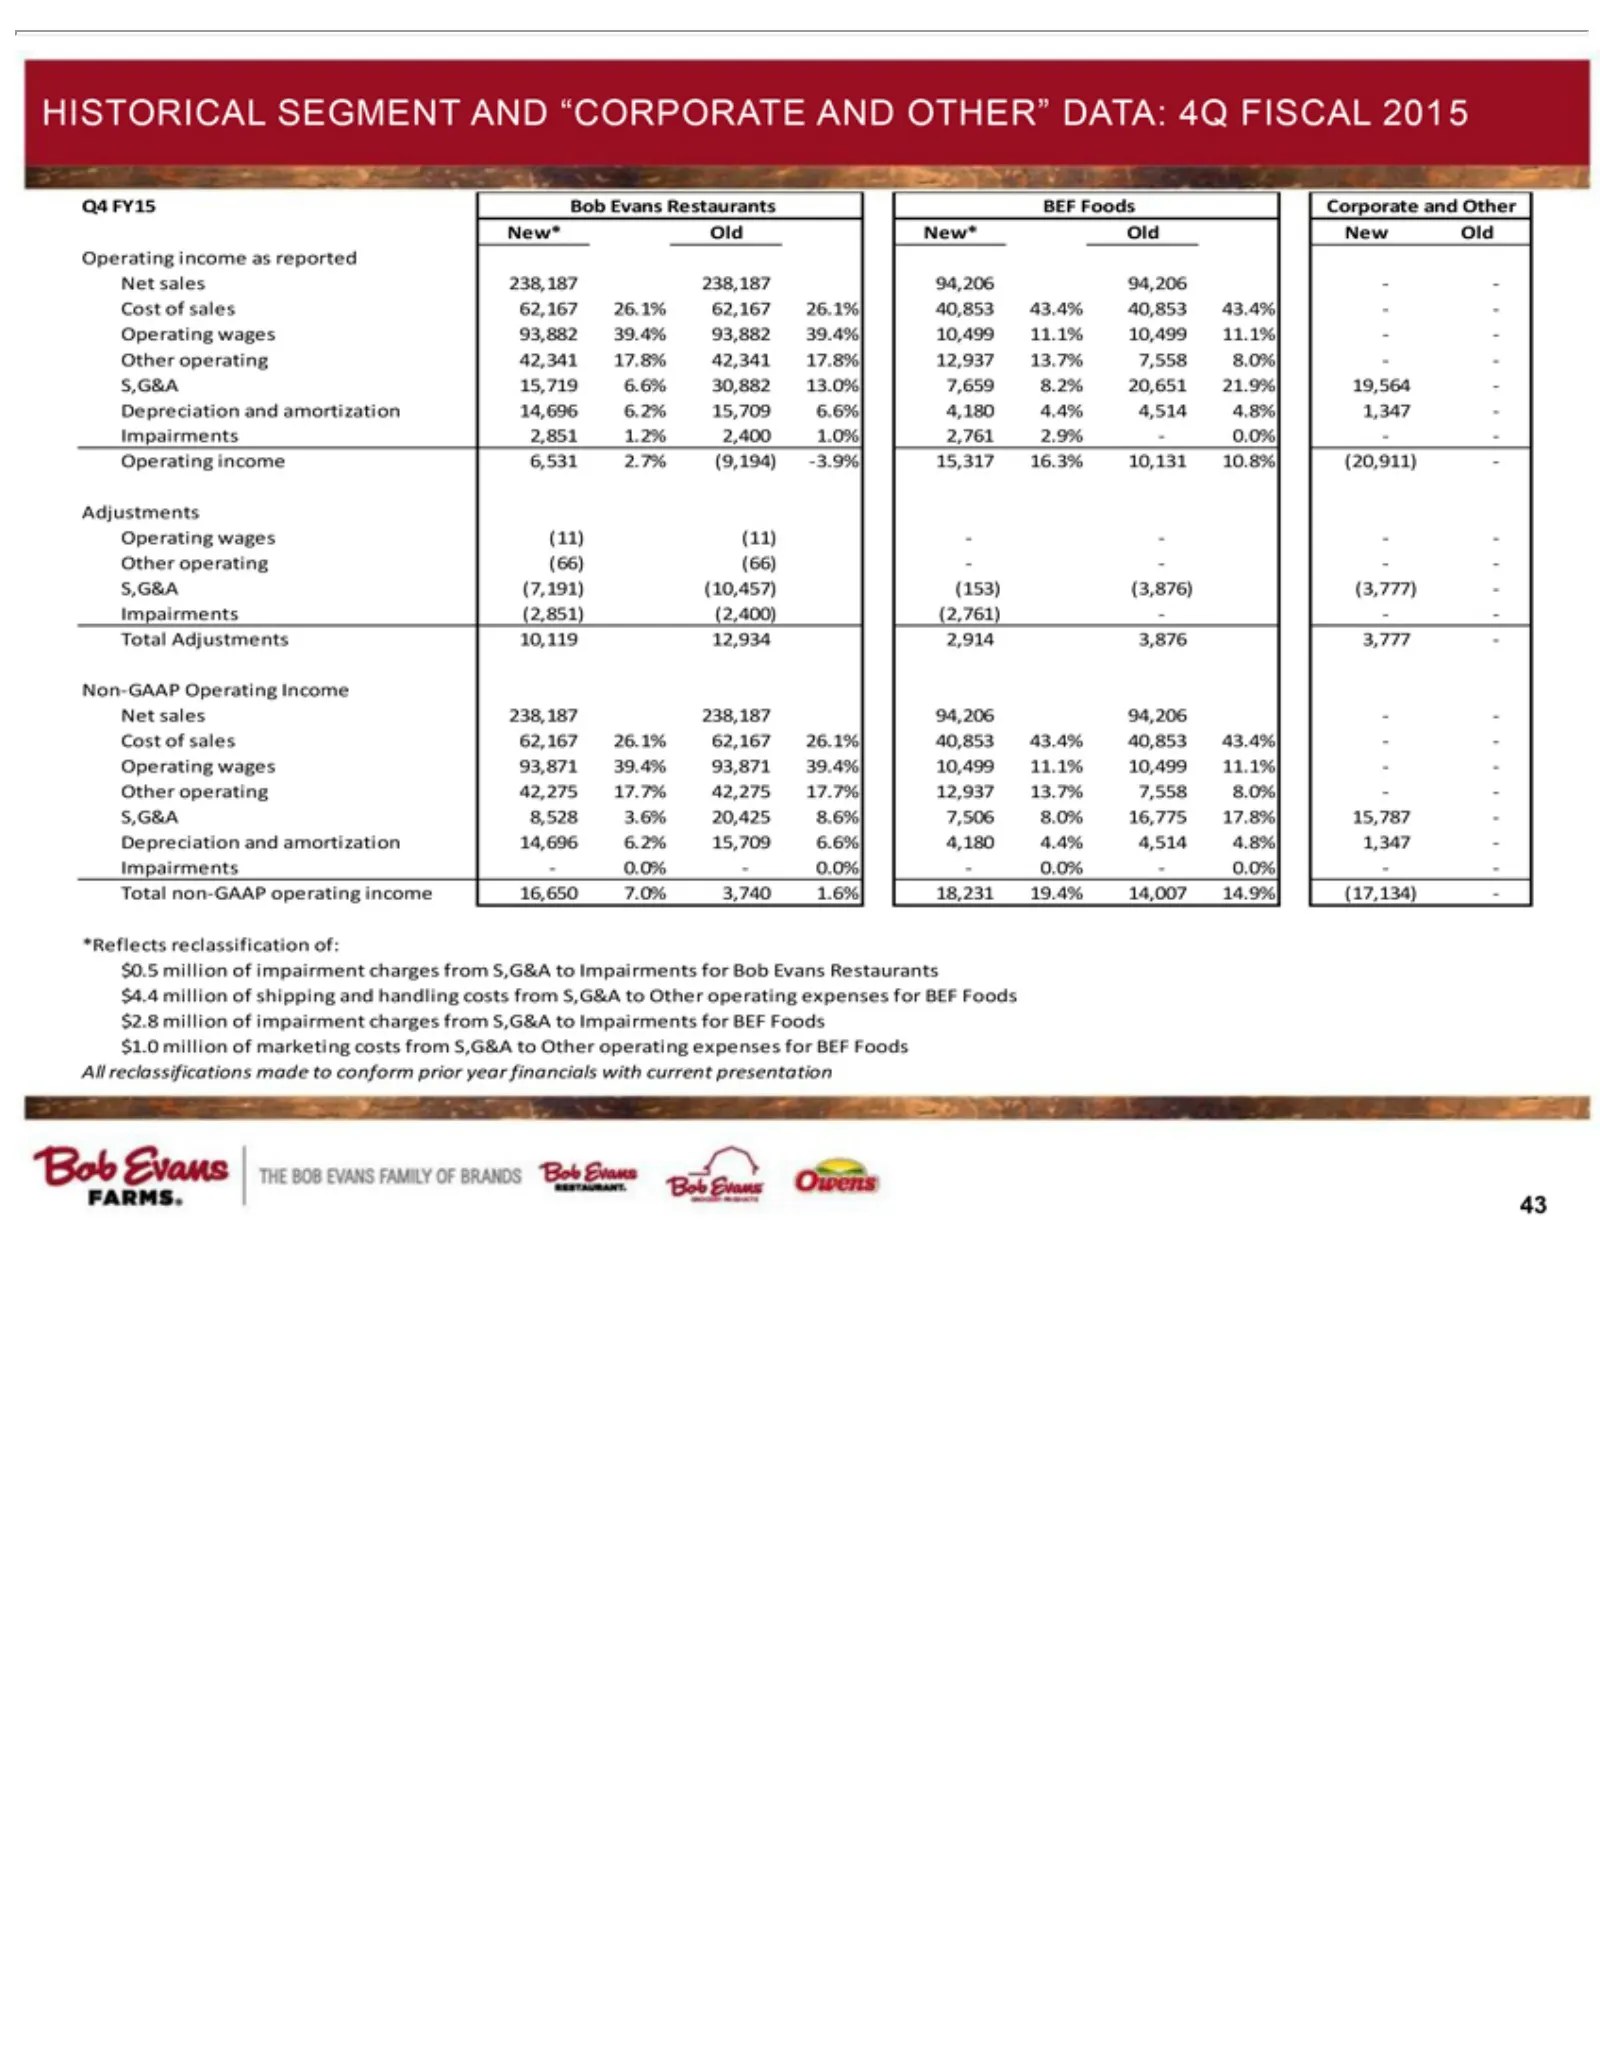
HISTORICAL Q4 Bob Operating Old 93,882 42,341 19,564 21.9% 20,651 8.2% 7,659 13.0% 30,882 15,719 2.9% 2,761 1.0% 2,400 1.2% 2,851 A (20,911) 10.8% 10,131 16.3% 15,317 -3.9% (9,194) 2.7% 6,531 (11) (66) (3,777) (3,876) (153) (10,457) (7,191) (2,851) 10,119 N 238,187 C 43.4% 40,853 26.1% 62,167 O 11.1
Slide 44: Historical FY14 Segment Results
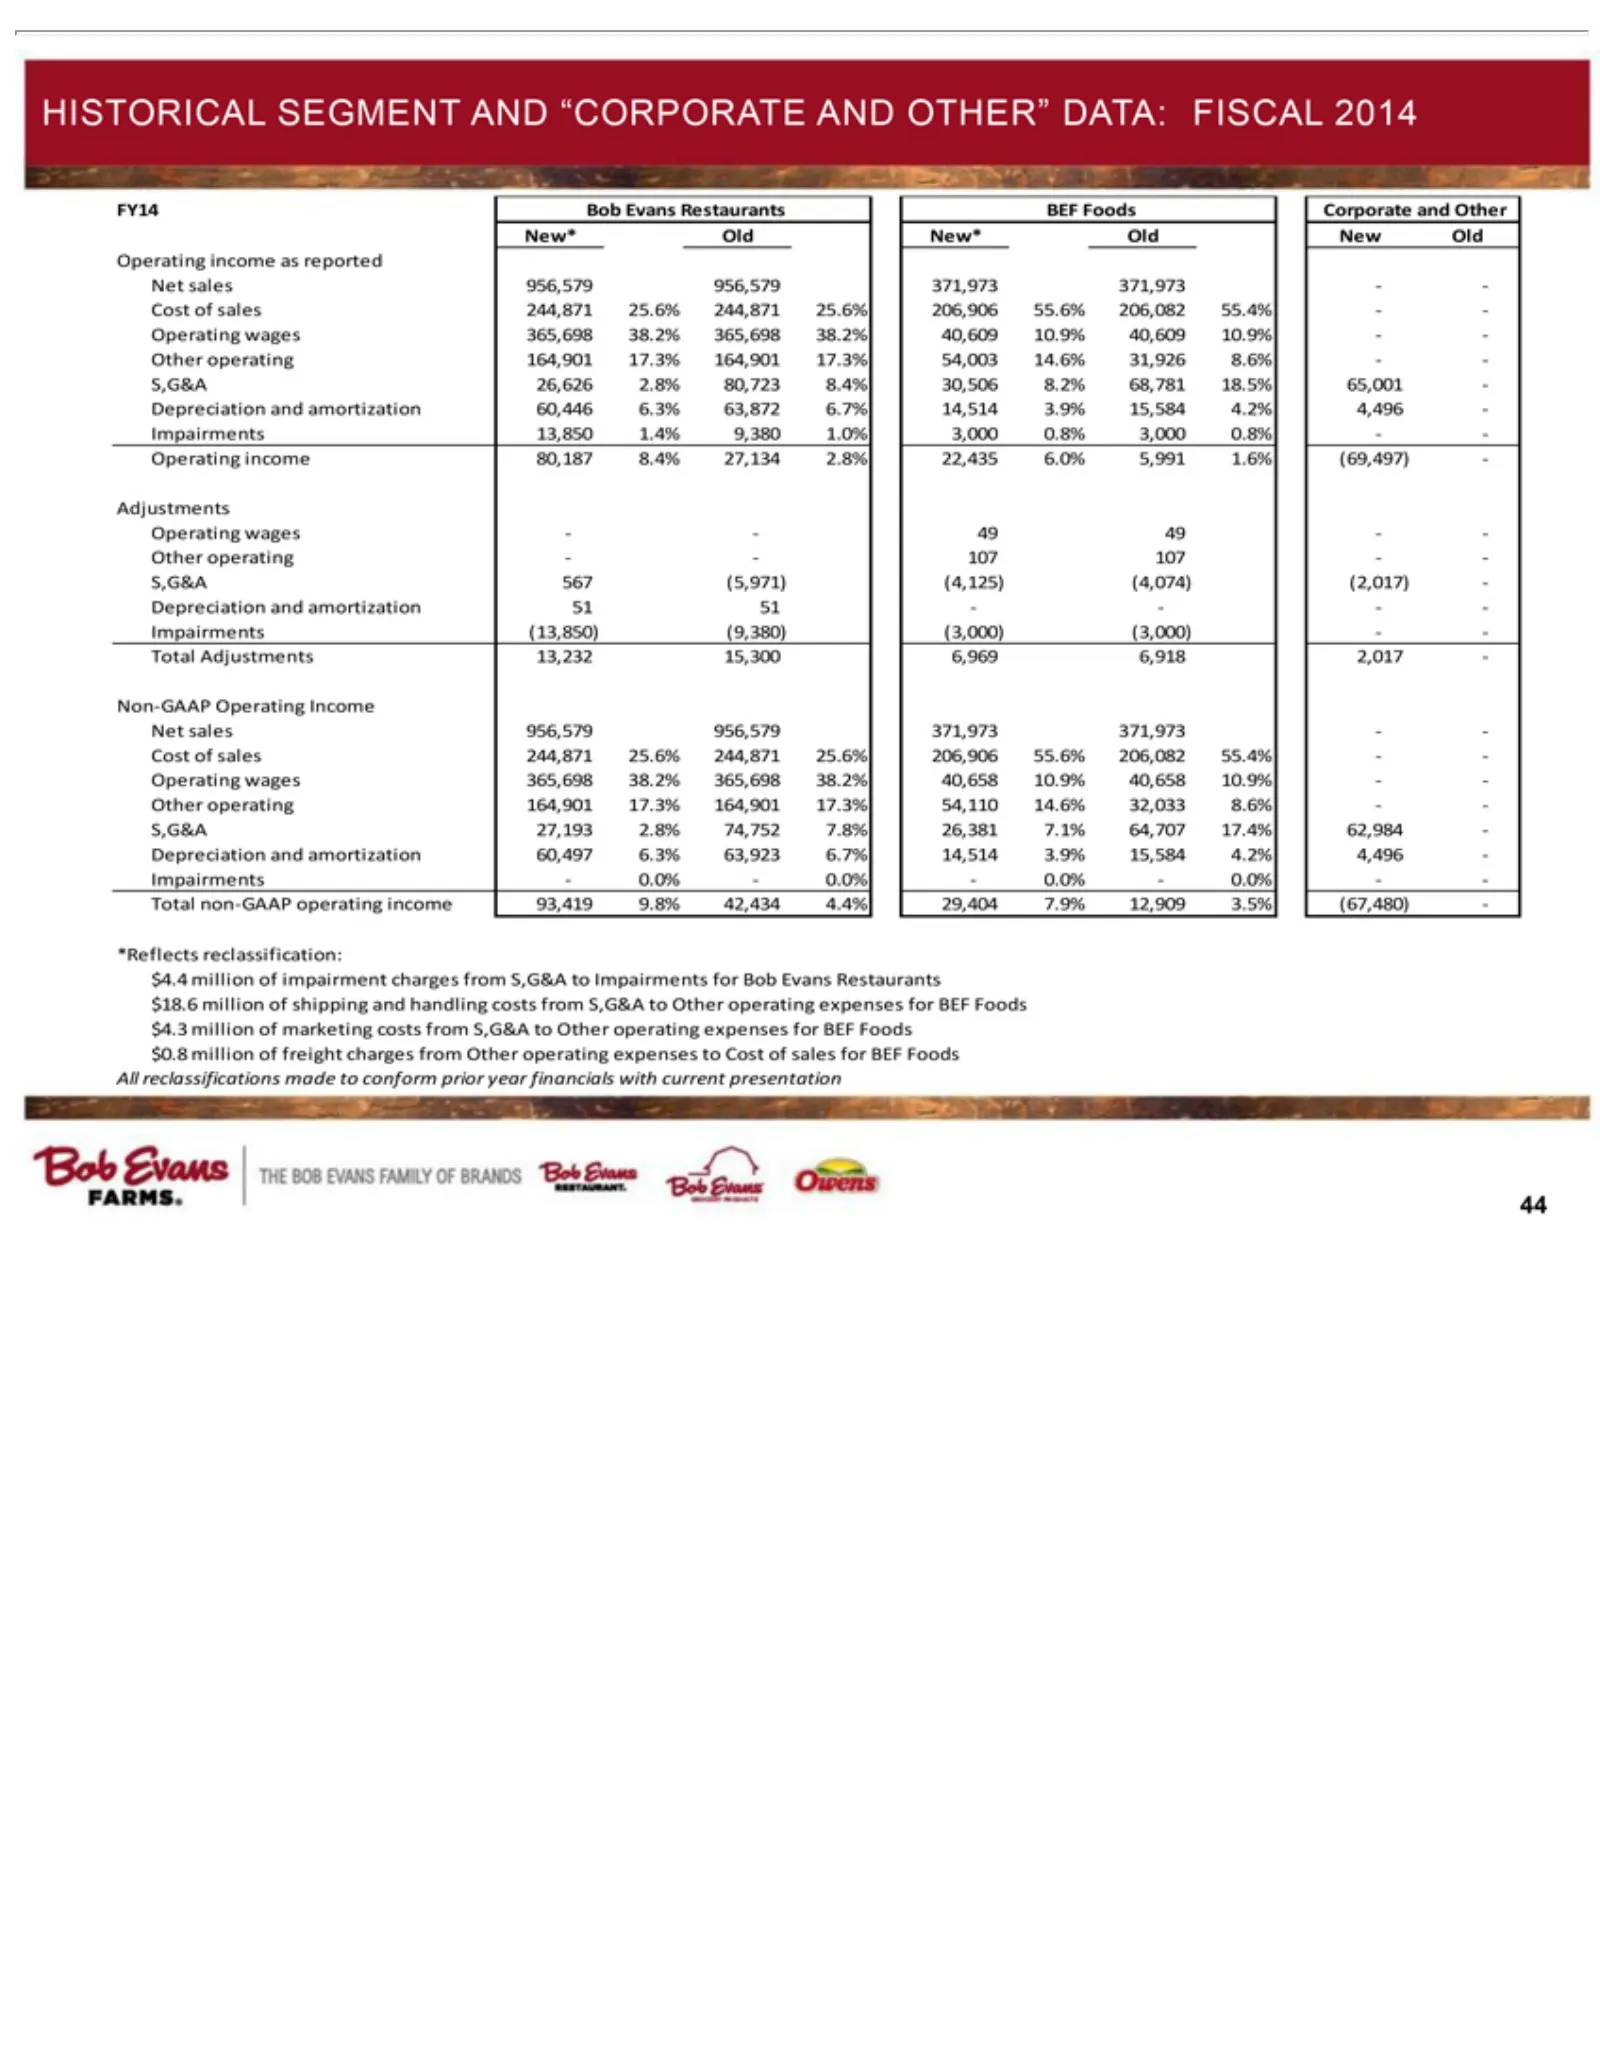
HISTORICAL Bob FY14 Operating Old 40,609 31,926 54,003 65,001 18.5% 68,781 8.2% 30,506 80,723 26,626 63,872 60,446 0.8% 3,000 1.0% 9,380 1.4% 13,850 A (69,497) 1.6% 5,991 6.0% 22,435 27,134 8.4% 80,187 4949 107 -- (2,017) (4,074) (4,125) (5,971) 567 5151 (3,000) (9,380) (13,850) 13,232 N 956,579 C 5
Source: SEC EDGAR · 8-K filed Sep 10, 2015
More decks from Bob Evans Farms Inc
 Merger or Acquisition (September 2017)18 slides · Sep 28, 2017
 Merger or Acquisition (September 2017)12 slides · Sep 19, 2017
 Merger or Acquisition (September 2017)17 slides · Sep 19, 2017
 Merger or Acquisition (September 2017)10 slides · Sep 19, 2017
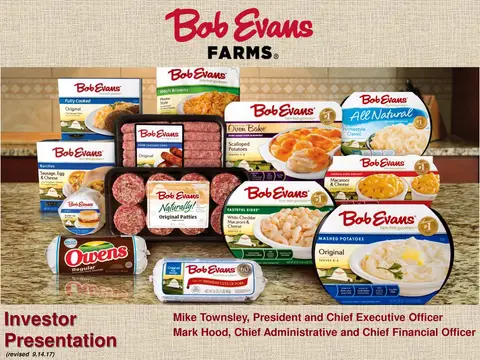 Investor Presentation (September 2017)32 slides · Sep 14, 2017
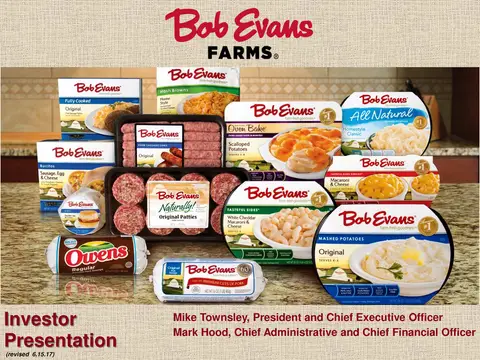 Investor Presentation (June 2017)30 slides · Jun 15, 2017