The Empire District Electric Company
The Empire District Electric — Empire District Electric — Merger or Acquisition (February 2016)
35 slides from The Empire District Electric's merger presentation, Feb 29, 2016
Slide 1: Forward Looking Statements
Forward Looking Statements Certain matters discussed in this presentation are “forward-looking statements” intended to qualify for the safe harbor from liability established by the Private Securities Litigation Reform Act of 1995. Statements that are not historical facts, including statements about
Slide 2: Algonquin Power & Utilities Corp. to Acquire The Empire District Electric Company
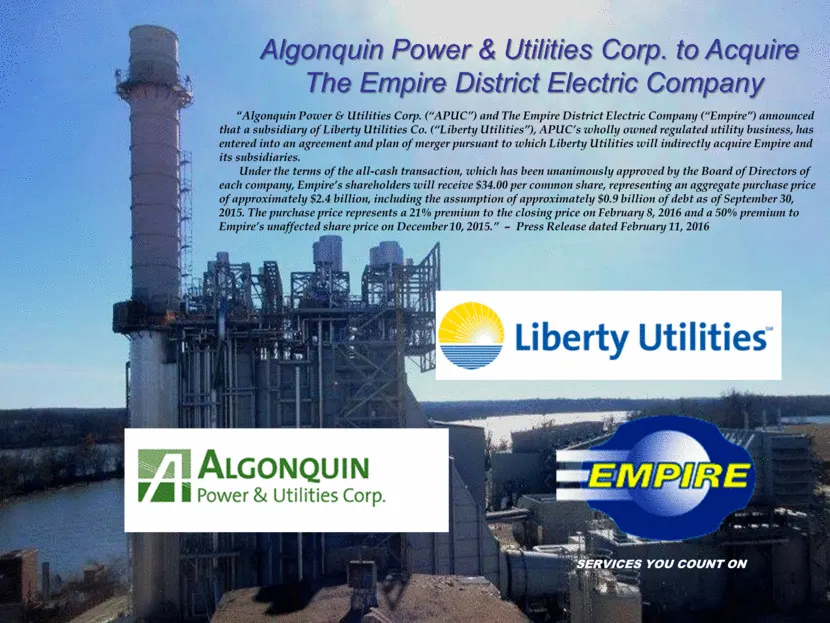
SERVICES YOU COUNT ON Algonquin Power & Utilities Corp. to Acquire The Empire District Electric Company “Algonquin Power & Utilities Corp. (“APUC”) and The Empire District Electric Company (“Empire”) announced that a subsidiary of Liberty Utilities Co. (“Liberty Utilities”), APUC’s wholly owned regu
Slide 3: Transaction Highlights
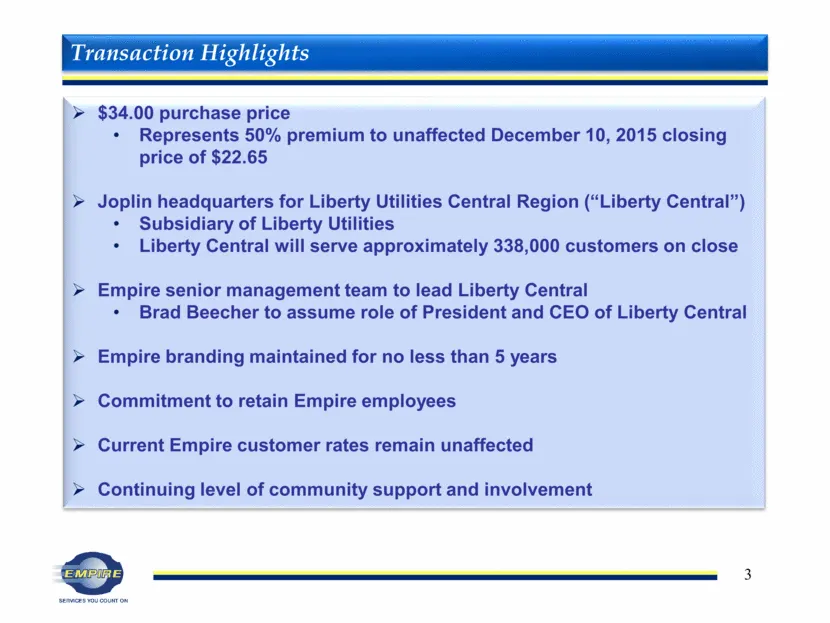
$34.00 purchase price Represents 50% premium to unaffected December 10, 2015 closing price of $22.65 Joplin headquarters for Liberty Utilities Central Region (“Liberty Central”) Subsidiary of Liberty Utilities Liberty Central will serve approximately 338,000 customers on close Empire senior manageme
Slide 4: Overview of Liberty Utilities Central Region
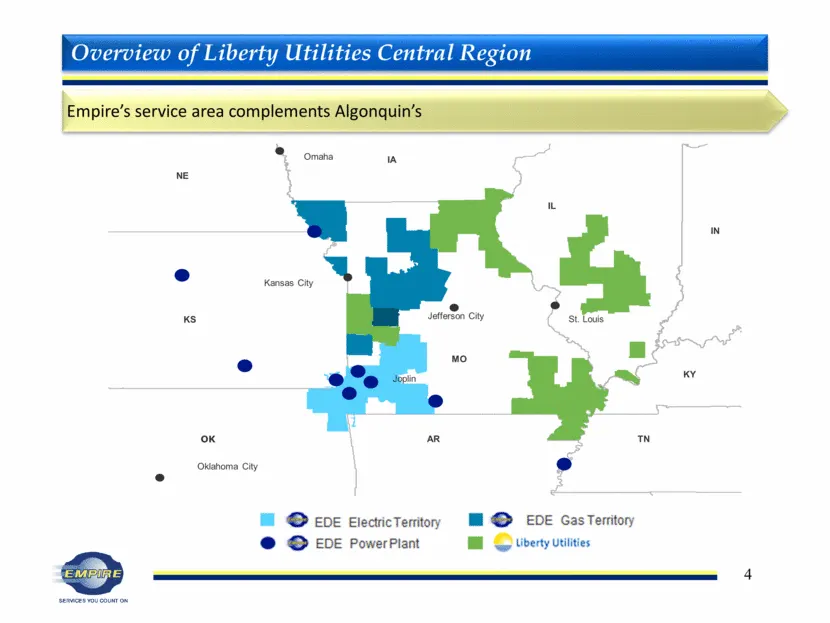
Kansas City Oklahoma City St. Louis Omaha KS NE IA MO OK AR IL Joplin IN KY TN Jefferson City Overview of Liberty Utilities Central Region Empire’s service area complements Algonquin’s
Slide 5: Tentative Transaction Approval Timeline
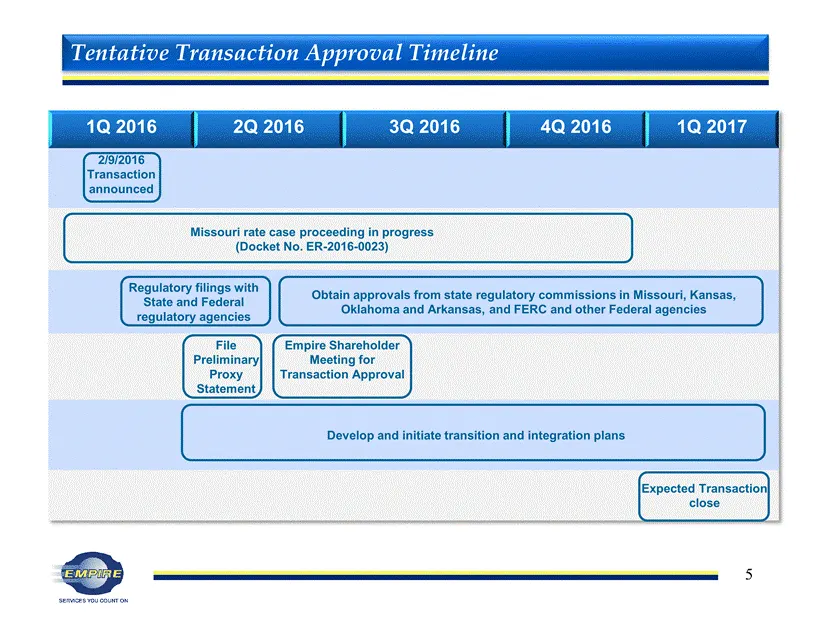
1Q 2016 2Q 2016 3Q 2016 4Q 2016 1Q 2017 2/9/2016 Transaction announced Missouri rate case proceeding in progress (Docket No. ER-2016-0023) Regulatory filings with State and Federal regulatory agencies Obtain approvals from state regulatory commissions in Missouri, Kansas, Oklahoma and Arkansas, and
Slide 6: Who We Are
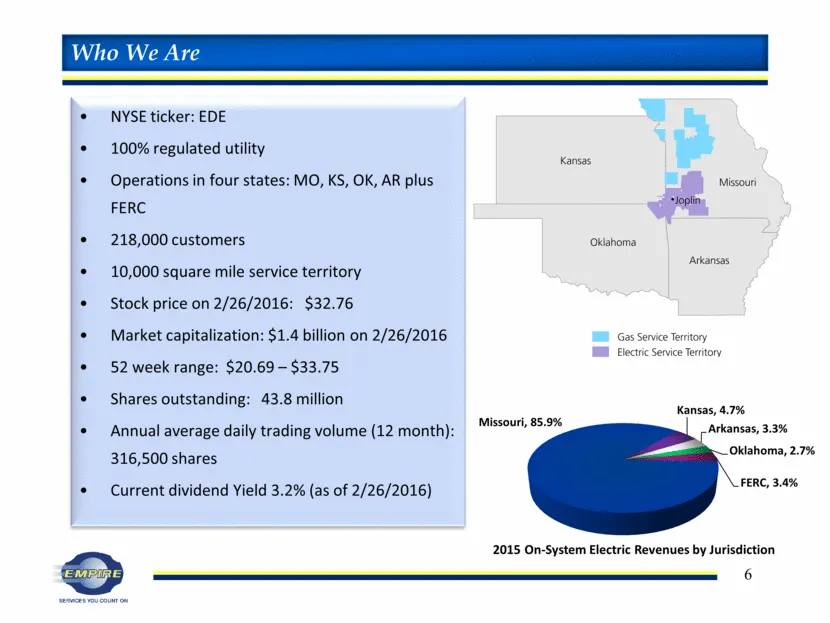
Who We Are NYSE ticker: EDE 100% regulated utility Operations in four states: MO, KS, OK, AR plus FERC 218,000 customers 10,000 square mile service territory Stock price on 2/26/2016: $32.76 Market capitalization: $1.4 billion on 2/26/2016 52 week range: $20.69 – $33.75 Shares outstanding: 43.8 mill
Slide 7: Executive Management and Board of Directors
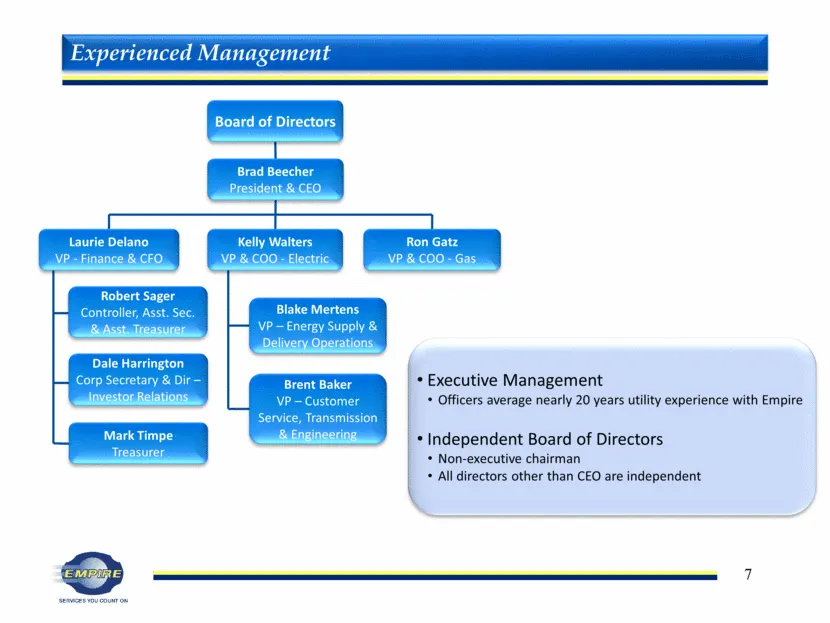
Executive Management Officers average nearly 20 years utility experience with Empire Independent Board of Directors Non-executive chairman All directors other than CEO are independent Experienced Management Board of Directors Brad Beecher President & CEO Laurie Delano VP - Finance & CFO Kelly Walter
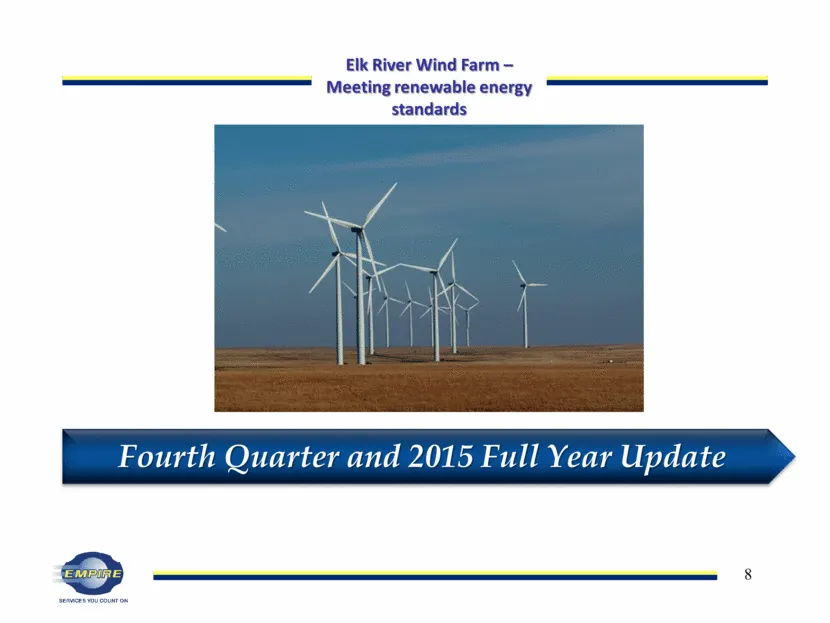
Slide 8: Fourth Quarter and 2015 Full Year Update
Fourth Quarter and 2015 Full Year Update Elk River Wind Farm – Meeting renewable energy standards
Slide 9: Fourth Quarter and Full Year 2015 Results
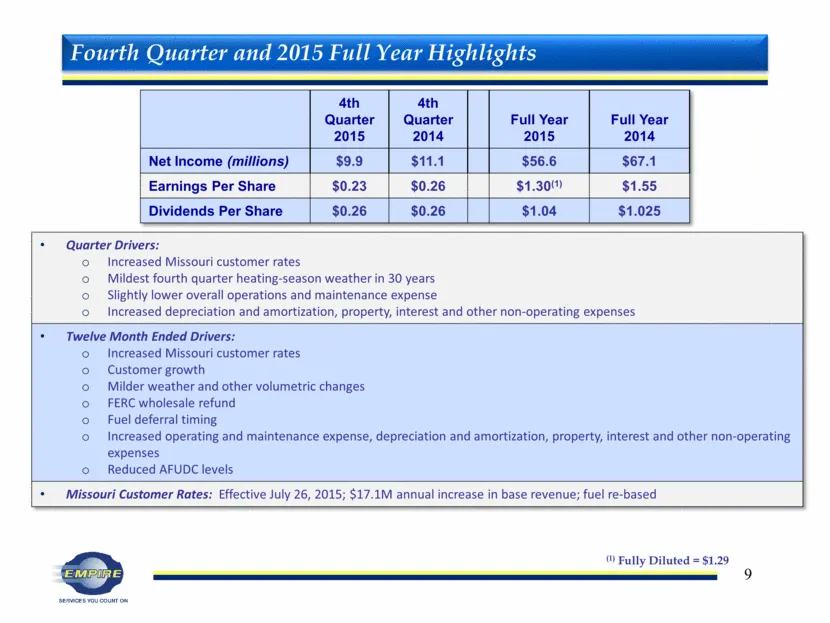
4th Quarter 2015 4th Quarter 2014 Full Year 2015 Full Year 2014 Net Income (millions) $9.9 $11.1 $56.6 $67.1 Earnings Per Share $0.23 $0.26 $1.30(1) $1.55 Dividends Per Share $0.26 $0.26 $1.04 $1.025 Quarter Drivers: Increased Missouri customer rates Mildest fourth quarter heating-season weather in
Slide 10: Fourth Quarter 2015 Highlights: EPS Drivers
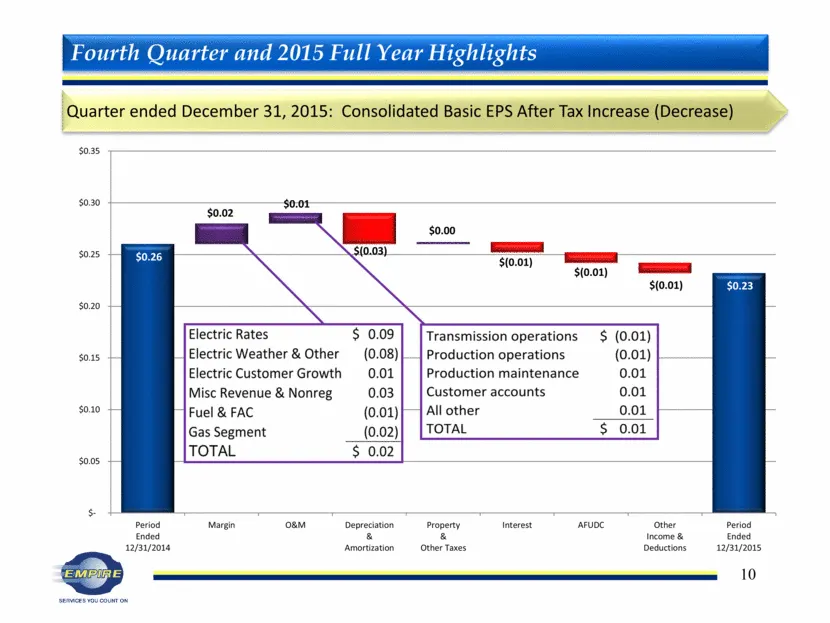
Fourth Quarter and 2015 Full Year Highlights Quarter ended December 31, 2015: Consolidated Basic EPS After Tax Increase (Decrease) $0.02 $0.01 $0.00 $(0.03) $(0.01) $(0.01) $(0.01) $0.26 $0.23 $- $0.05 $0.10 $0.15 $0.20 $0.25 $0.30 $0.35 Period Ended 12/31/2014 Margin O&M Depreciation & Amortization
Slide 11: Full Year 2015 Highlights: EPS Drivers
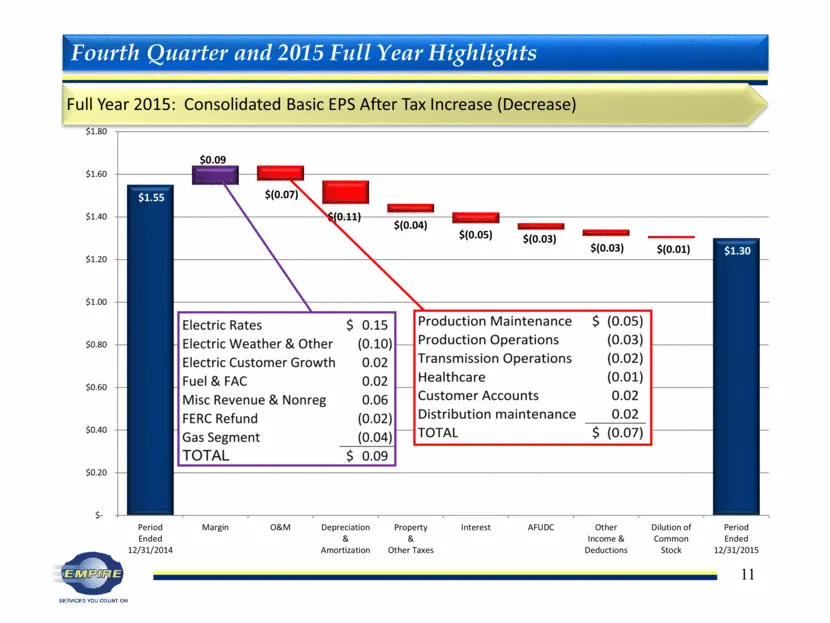
Fourth Quarter and 2015 Full Year Highlights Full Year 2015: Consolidated Basic EPS After Tax Increase (Decrease) $0.09 $(0.07) $(0.11) $(0.04) $(0.05) $(0.03) $(0.03) $(0.01) $1.55 $1.30 $- $0.20 $0.40 $0.60 $0.80 $1.00 $1.20 $1.40 $1.60 $1.80 Period Ended 12/31/2014 Margin O&M Depreciation & Amort
Slide 12: Earnings Per Share 2015 / 2016 Earnings Drivers
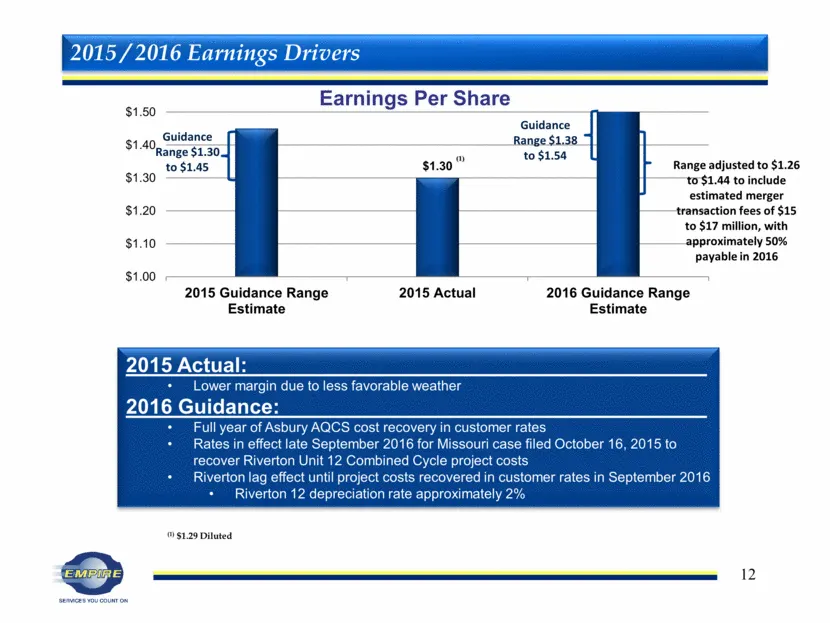
Earnings Per Share 2015 / 2016 Earnings Drivers 2015 Actual: Lower margin due to less favorable weather 2016 Guidance: Full year of Asbury AQCS cost recovery in customer rates Rates in effect late September 2016 for Missouri case filed October 16, 2015 to recover Riverton Unit 12 Combined Cycle proj
Slide 13: Regulatory Update
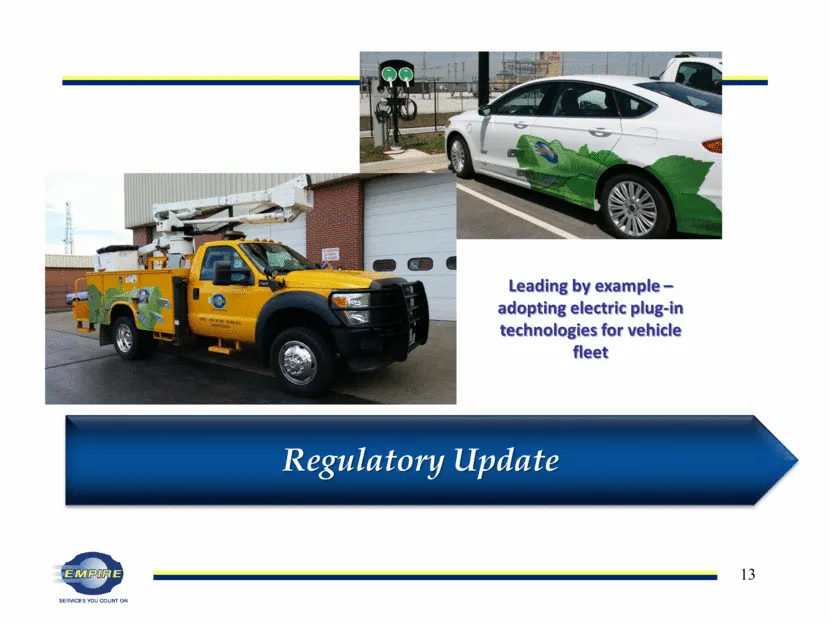
Regulatory Update Leading by example – adopting electric plug-in technologies for vehicle fleet
Slide 14: Missouri Rate Case Highlights
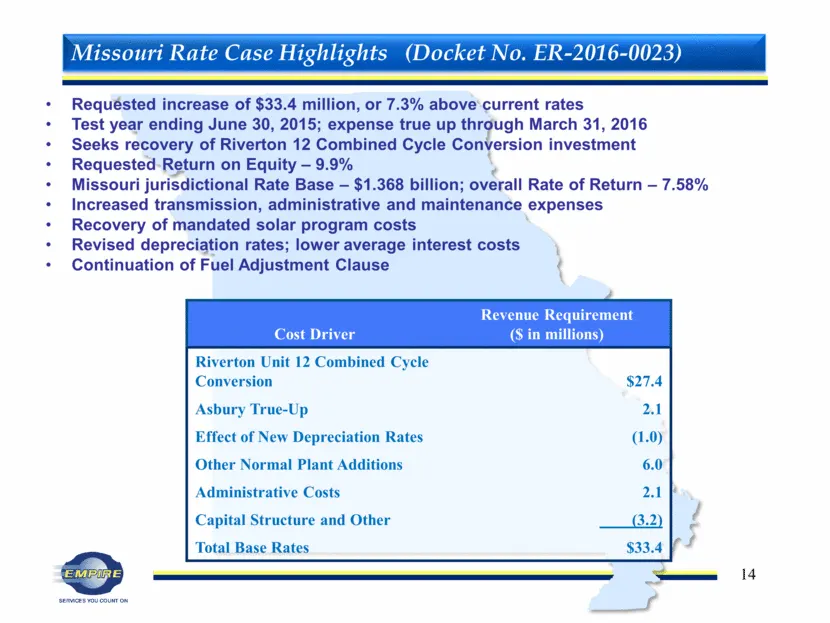
Missouri Rate Case Highlights (Docket No. ER-2016-0023) Requested increase of $33.4 million, or 7.3% above current rates Test year ending June 30, 2015; expense true up through March 31, 2016 Seeks recovery of Riverton 12 Combined Cycle Conversion investment Requested Return on Equity – 9.9% Missour
Slide 15: Missouri Rate Case Projected Timeline
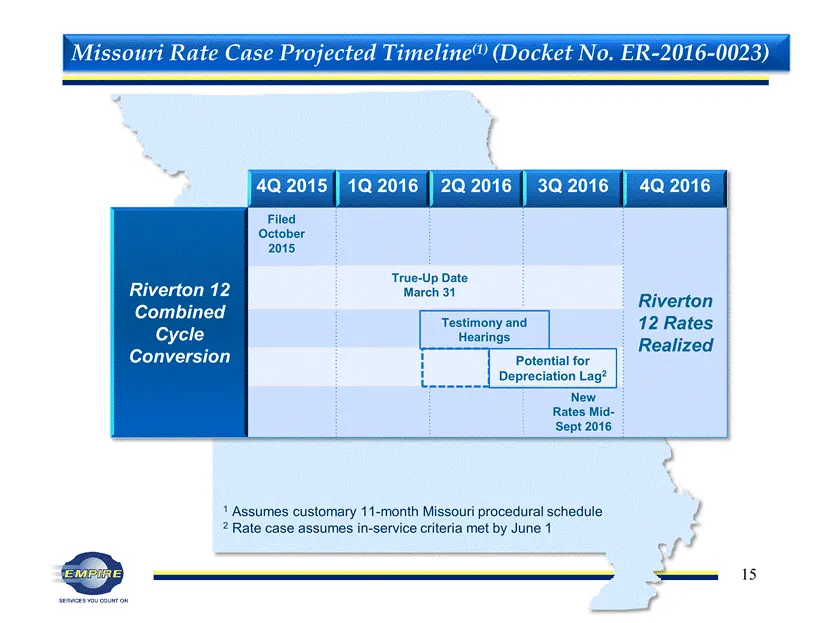
Missouri Rate Case Projected Timeline(1) (Docket No. ER-2016-0023) 4Q 2015 1Q 2016 2Q 2016 3Q 2016 4Q 2016 Riverton 12 Combined Cycle Conversion Filed October 2015 Riverton 12 Rates Realized True-Up Date March 31 New Rates Mid- Sept 2016 Testimony and Hearings Potential for Depreciation Lag2 1 Assum
Slide 16: State Regulatory Updates
Missouri Notice updating Integrated Resource Plan (IRP) Retirement of Riverton Units 8 and 9 – June 30, 2015 Missouri Energy Efficiency Investment Act (MEEIA) application withdrawn – July 24, 2015 Continue recovery of current Energy Efficiency programs through base rates Consider future MEEIA filing
Slide 17: Growth Plan
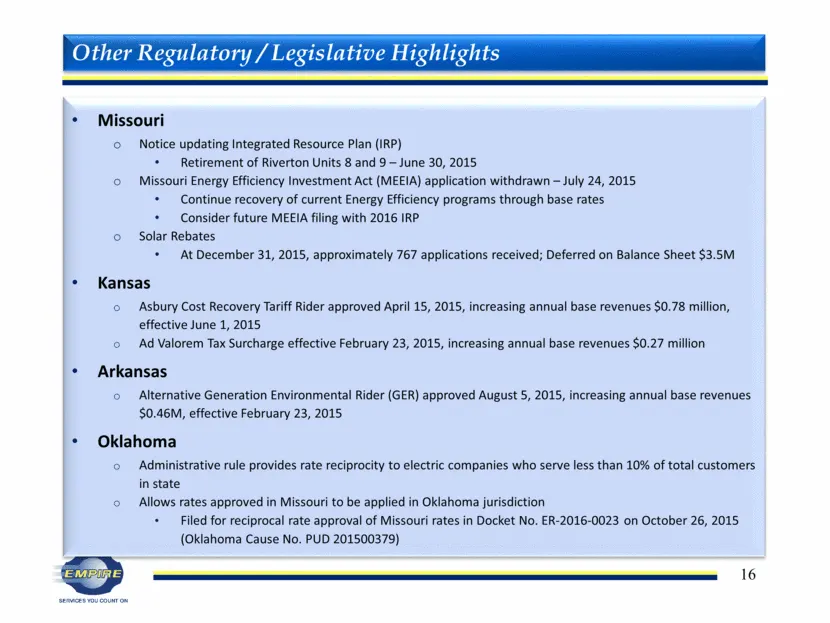
Riverton 12 Combined Cycle Conversion Project – as of December 31, 2015, approximately $160M expenditures, tie-in complete, mechanical completion achieved Growth Plan
Slide 18: Growth Data: Capacity, Peak Demand and System Input
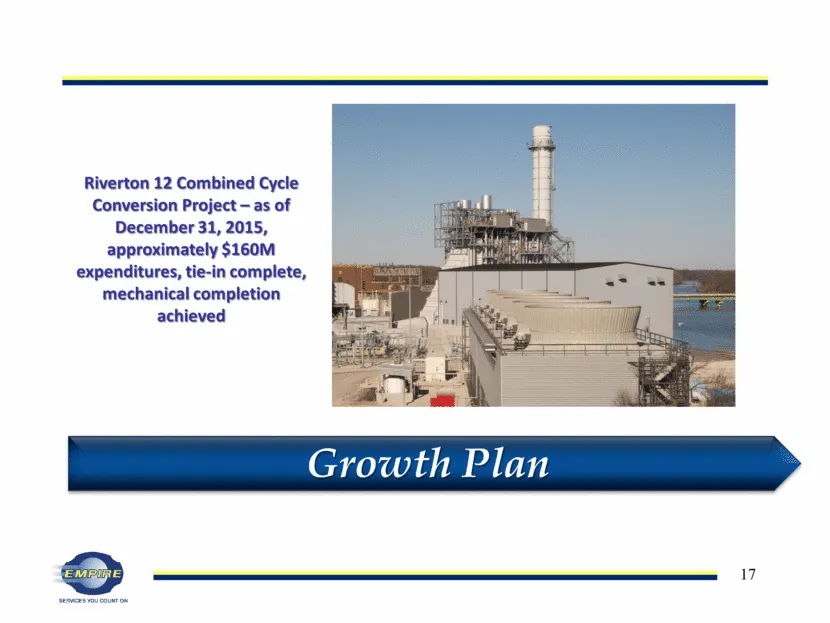
1 Measure of customer usage, excluding losses Actuals include AFUDC, projections exclude AFUDC; Net Plant excludes depreciation recorded as a Cost of Removal regulatory liability Includes effect of Bonus Depreciation through 2019 Growth Data 1 1,100 1,255 1,255 1,257 1,409 1,392 1,391 1,377 1,326 1,
Slide 19: Electric Customer Growth and Average Residential Rates
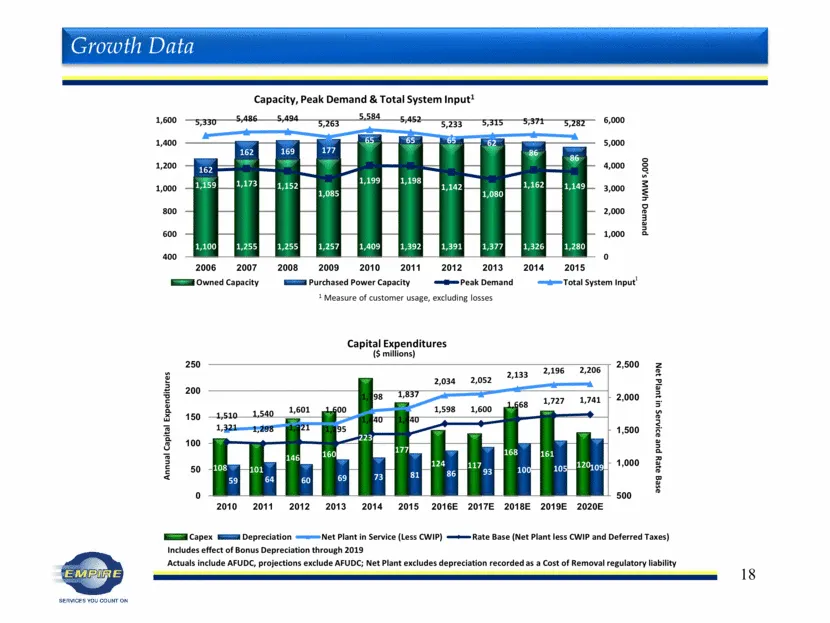
Electric Customer Growth Average Residential Rates 1 Source EEI 2 EEI preliminary 32014 and 2015 EEI not yet available 1 Source: EIA 2 2015 EEI Not yet available Growth Data (cont.) 1 2 -2 -1.5 -1 -0.5 0 0.5 1 1.5 2 2.5 2004 2005 2006 2007 2008 2009 2010 2011 2012 2013 2014 2015 Percent Change EDE I
Slide 20: Financial Metrics
Improving reliability and building rate base with infrastructure improvements Financial Metrics
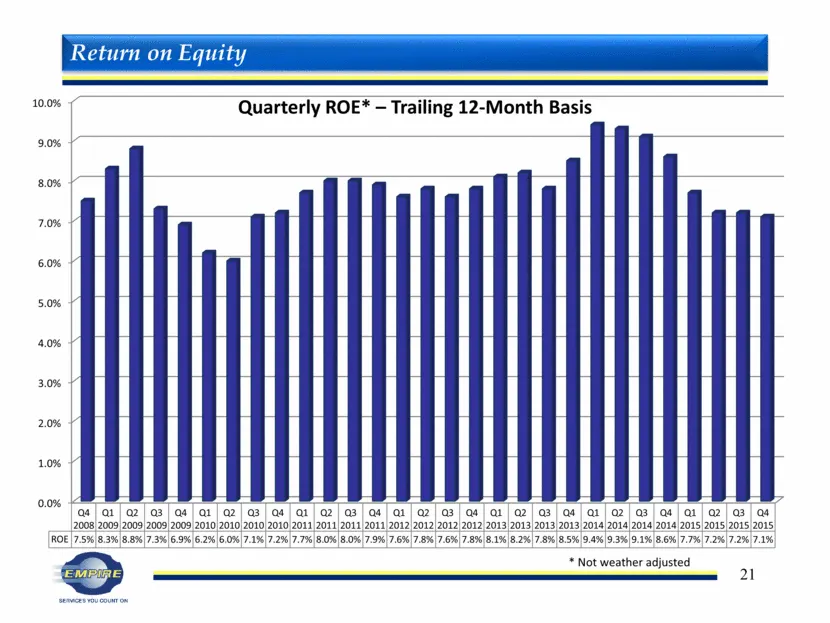
Slide 21: Quarterly ROE – Trailing 12-Month Basis
Quarterly ROE* – Trailing 12-Month Basis * Not weather adjusted Return on Equity 0.0% 1.0% 2.0% 3.0% 4.0% 5.0% 6.0% 7.0% 8.0% 9.0% 10.0% Q4 2008 Q1 2009 Q2 2009 Q3 2009 Q4 2009 Q1 2010 Q2 2010 Q3 2010 Q4 2010 Q1 2011 Q2 2011 Q3 2011 Q4 2011 Q1 2012 Q2 2012 Q3 2012 Q4 2012 Q1 2013 Q2 2013 Q3 2013 Q4
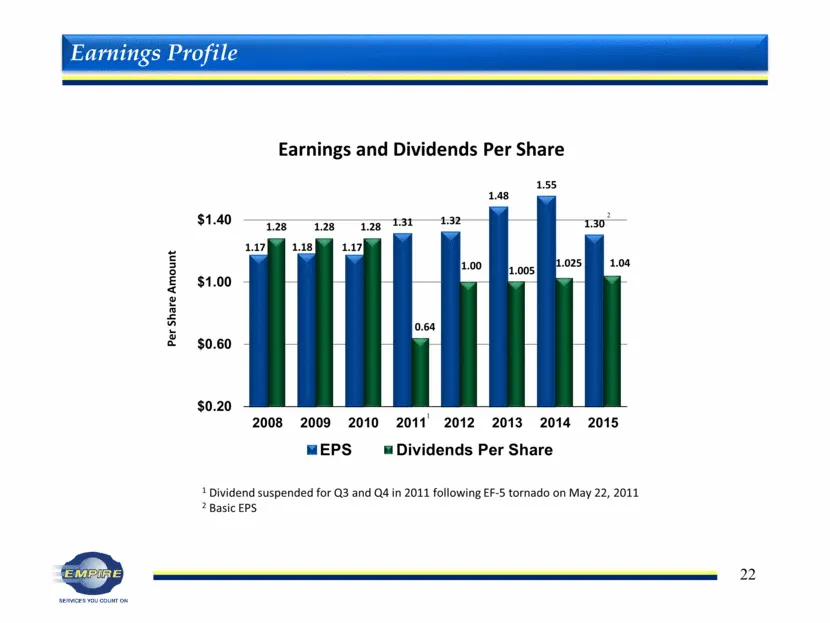
Slide 22: Earnings and Dividends Per Share
Earnings Profile 1 Dividend suspended for Q3 and Q4 in 2011 following EF-5 tornado on May 22, 2011 2 Basic EPS 1.17 1.18 1.17 1.31 1.32 1.48 1.55 1.30 1.28 1.28 1.28 0.64 1.00 1.005 1.025 1.04 $0.20 $0.60 $1.00 $1.40 2008 2009 2010 2011 2012 2013 2014 2015 Earnings and Dividends Per Share EPS Divide
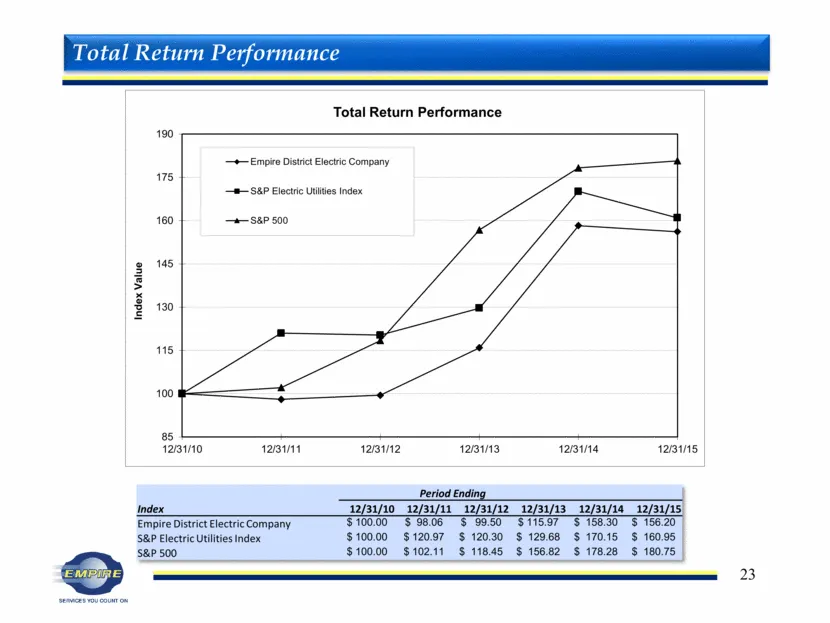
Slide 23: Total Return Performance
Period Ending Index 12/31/10 12/31/11 12/31/12 12/31/13 12/31/14 12/31/15 Empire District Electric Company $ 100.00 $ 98.06 $ 99.50 $ 115.97 $ 158.30 $ 156.20 S&P Electric Utilities Index $ 100.00 $ 120.97 $ 120.30 $ 129.68 $ 170.15 $ 160.95 S&P 500 $ 100.00 $ 102.11 $ 118.45 $ 156.82 $ 178.28 $ 180
Slide 24: Financial Summary
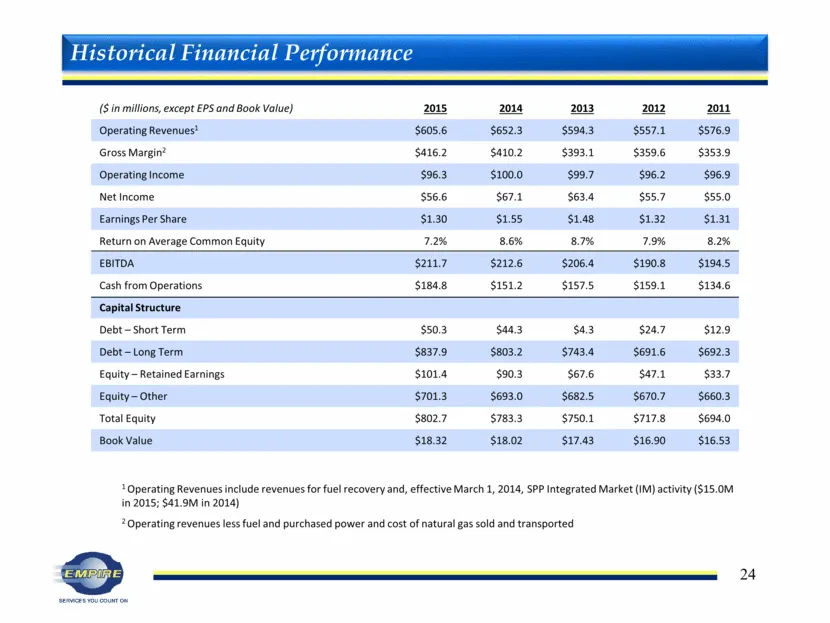
1 Operating Revenues include revenues for fuel recovery and, effective March 1, 2014, SPP Integrated Market (IM) activity ($15.0M in 2015; $41.9M in 2014) 2 Operating revenues less fuel and purchased power and cost of natural gas sold and transported ($ in millions, except EPS and Book Value) 2015 2
Slide 25: Investment Grade Ratings
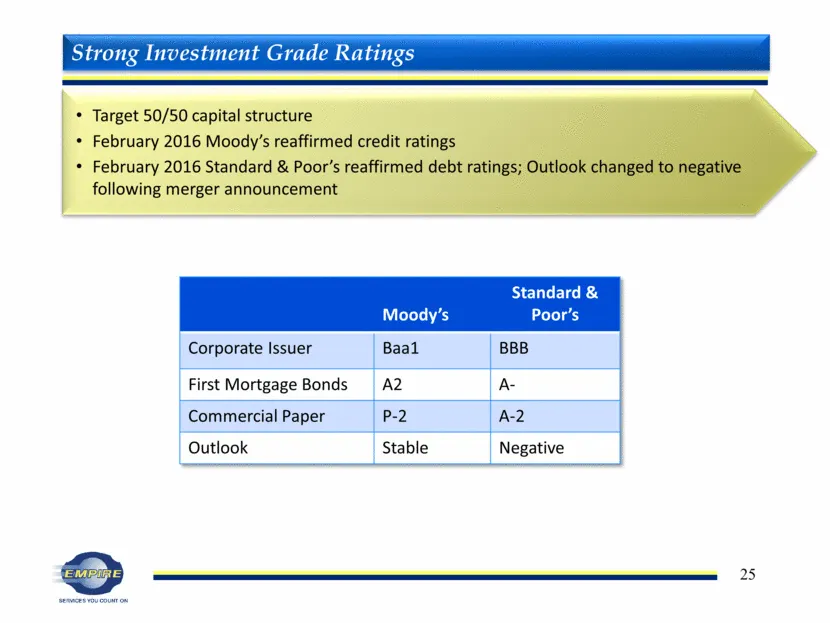
Moody’s Standard & Poor’s Corporate Issuer Baa1 BBB First Mortgage Bonds A2 A- Commercial Paper P-2 A-2 Outlook Stable Negative Strong Investment Grade Ratings Target 50/50 capital structure February 2016 Moody’s reaffirmed credit ratings February 2016 Standard & Poor’s reaffirmed debt ratings; Outl
Slide 26: Financing Outlook and Debt Maturities
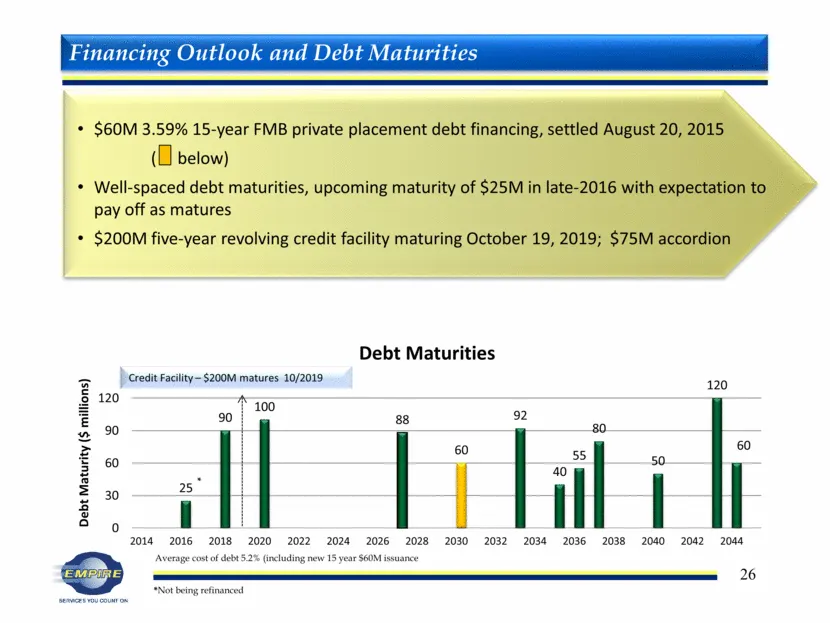
Financing Outlook and Debt Maturities $60M 3.59% 15-year FMB private placement debt financing, settled August 20, 2015 ( below) Well-spaced debt maturities, upcoming maturity of $25M in late-2016 with expectation to pay off as matures $200M five-year revolving credit facility maturing October 19, 20
Slide 27: Supplemental Materials
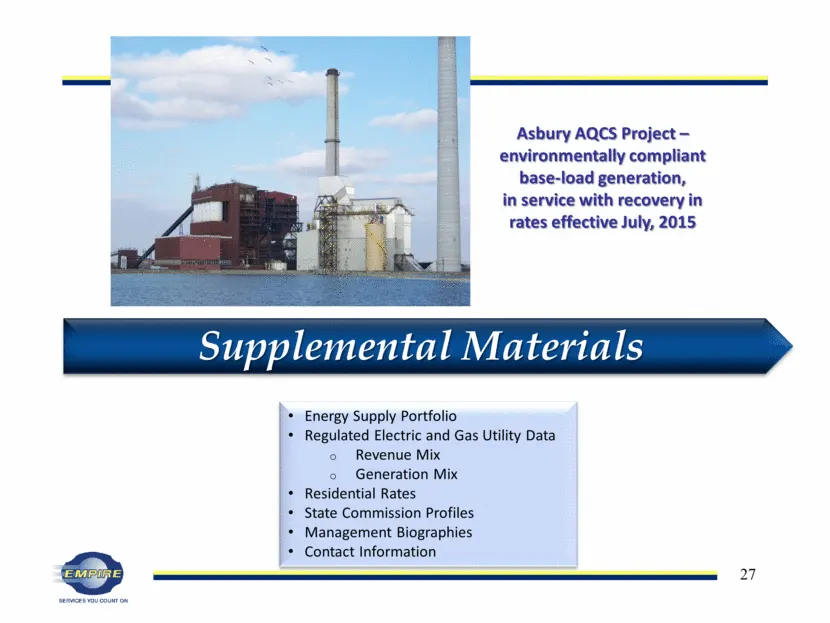
Supplemental Materials Energy Supply Portfolio Regulated Electric and Gas Utility Data Revenue Mix Generation Mix Residential Rates State Commission Profiles Management Biographies Contact Information Asbury AQCS Project –environmentally compliant base-load generation, in service with recovery in ra
Slide 28: Energy Supply
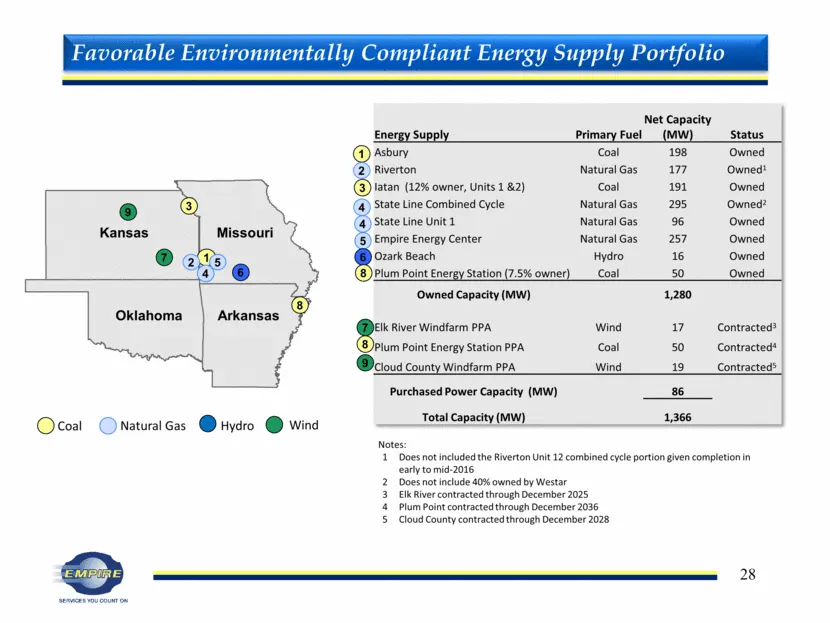
Energy Supply Primary Fuel Net Capacity (MW) Status Asbury Coal 198 Owned Riverton Natural Gas 177 Owned1 Iatan (12% owner, Units 1 &2) Coal 191 Owned State Line Combined Cycle Natural Gas 295 Owned2 State Line Unit 1 Natural Gas 96 Owned Empire Energy Center Natural Gas 257 Owned Ozark Beach Hydro
Slide 29: Regulated Electric and Gas Utility Revenue Source
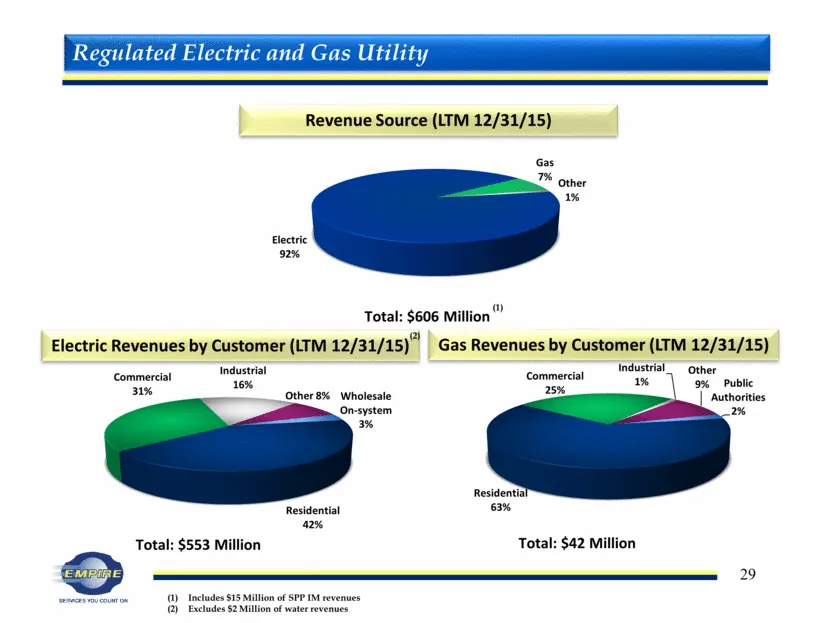
Regulated Electric and Gas Utility Revenue Source (LTM 12/31/15) Electric Revenues by Customer (LTM 12/31/15) Gas Revenues by Customer (LTM 12/31/15) (1) Includes $15 Million of SPP IM revenues Excludes $2 Million of water revenues (2) Electric 92% Gas 7% Other 1% Total: $606 Million Residential 42%
Slide 30: Diverse Generation/Balanced Mix of Resources
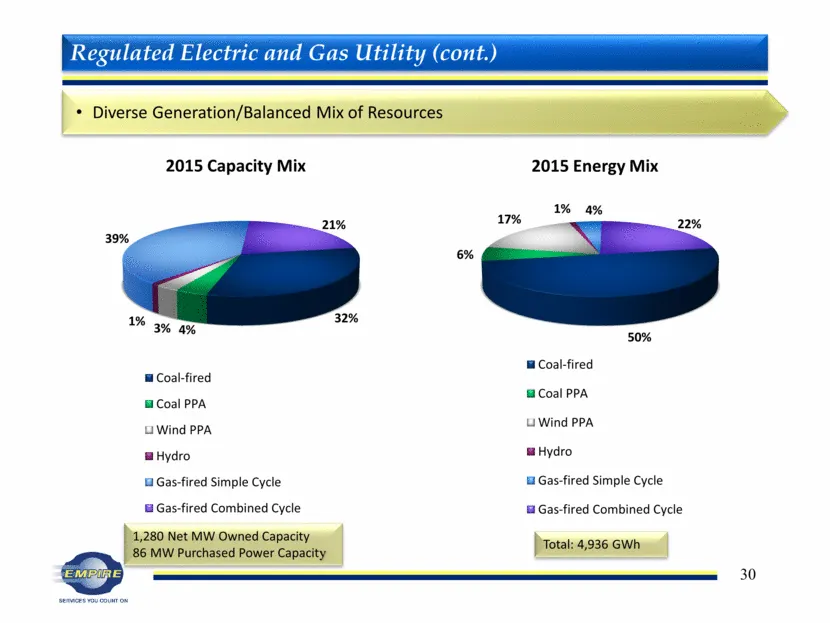
Regulated Electric and Gas Utility (cont.) Diverse Generation/Balanced Mix of Resources 1,280 Net MW Owned Capacity 86 MW Purchased Power Capacity Total: 4,936 GWh 32% 4% 3% 1% 39% 21% 2015 Capacity Mix Coal-fired Coal PPA Wind PPA Hydro Gas-fired Simple Cycle Gas-fired Combined Cycle 50% 6% 17% 1%
Slide 31: State Commission Profiles
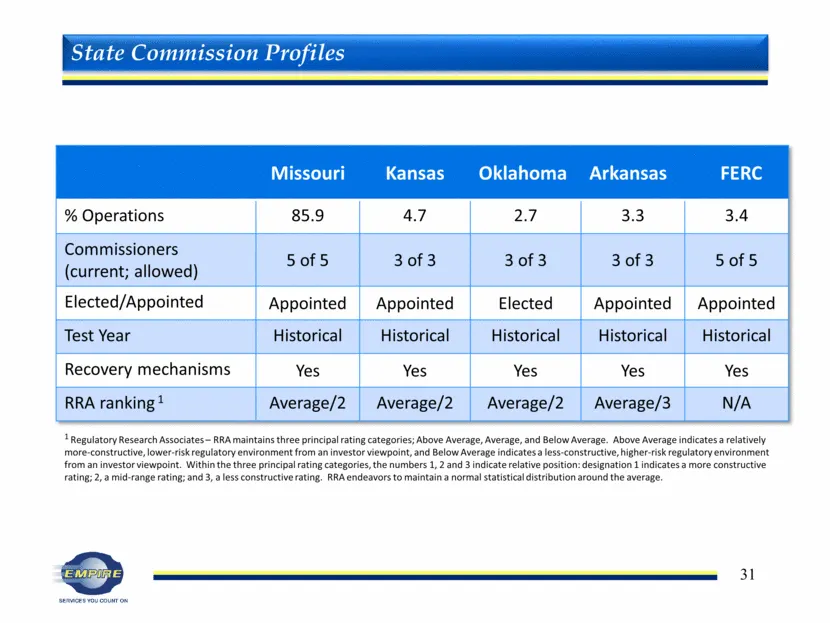
Missouri Kansas Oklahoma Arkansas FERC % Operations 85.9 4.7 2.7 3.3 3.4 Commissioners (current; allowed) 5 of 5 3 of 3 3 of 3 3 of 3 5 of 5 Elected/Appointed Appointed Appointed Elected Appointed Appointed Test Year Historical Historical Historical Historical Historical Recovery mechanisms Yes Yes
Slide 32: Executive Management and Investor Relations Team
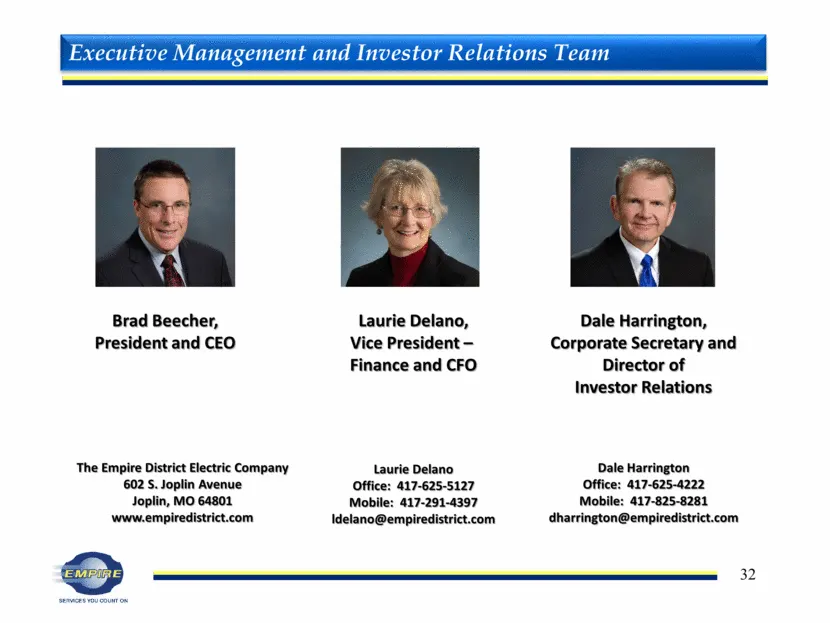
Brad Beecher, President and CEO Laurie Delano, Vice President – Finance and CFO Dale Harrington, Corporate Secretary and Director of Investor Relations The Empire District Electric Company 602 S. Joplin Avenue Joplin, MO 64801 www.empiredistrict.com Laurie Delano Office: 417-625-5127 Mobile: 417-291
Slide 33: Additional Information and Where to Find It
Additional Information and Where to Find It The proposed transaction will be submitted to shareholders of Empire for their consideration. In connection with the transaction, Empire will file a proxy statement and other materials with the U.S. Securities and Exchange Commission (the SEC). This commun
Slide 34: Making lives better every day with reliable energy and service
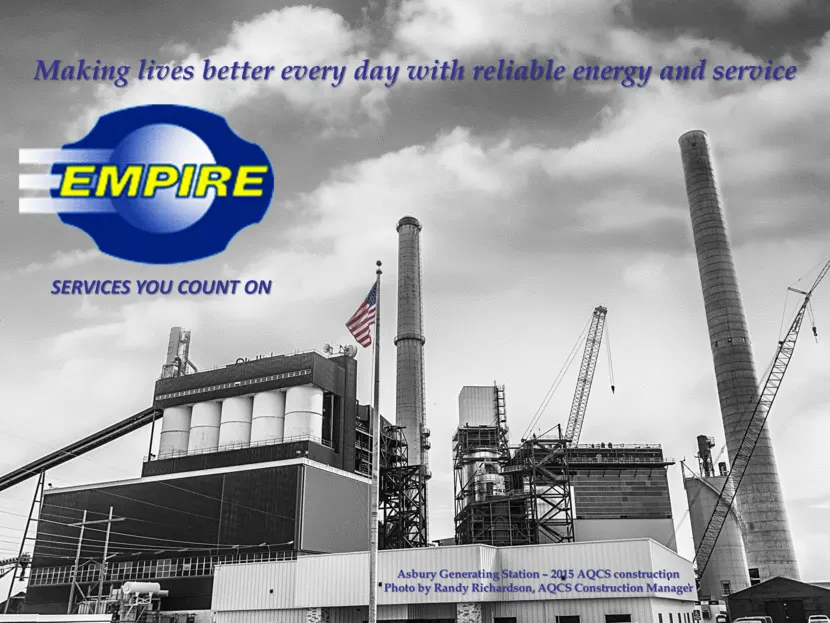
Making lives better every day with reliable energy and service SERVICES YOU COUNT ON Asbury Generating Station – 2015 AQCS construction Photo by Randy Richardson, AQCS Construction Manager
Slide 35: sn ig _ better every ‘ny amelie and ~~
sn ig _ better every ‘ny amelie and ~~ on - 2095 AQCS construction \QCS Construction Manager|
Source: SEC EDGAR · 8-K filed Feb 29, 2016
More decks from The Empire District Electric Company
 Q3 2016 Earnings Presentation32 slides · Nov 7, 2016
 Investor Presentation (September 2016)33 slides · Sep 19, 2016
 Merger or Acquisition (May 2016)35 slides · May 18, 2016
 Q1 2016 Earnings Presentation32 slides · May 6, 2016
 Merger or Acquisition (April 2016)8 slides · Apr 12, 2016
 Merger or Acquisition (March 2016)28 slides · Mar 29, 2016