Santander Consumer USA Holdings Inc
Santander Consumer USA — Investor Day (May 2016)
46 slides from Santander Consumer USA's investor day presentation, May 12, 2016
Slide 1: 2016 ABS Investor Day
May 12, 2016 SANTANDER CONSUMER USA HOLDINGS INC. 2016 ABS Investor Day Exhibit 99.1
Slide 2: Important Information
IMPORTANT INFORMATION Forward-Looking Statements This presentation contains forward-looking statements within the meaning of the Private Securities Litigation Reform Act of 1995. Any statements about our expectations, beliefs, plans, predictions, forecasts, objectives, assumptions, or future events
Slide 3: Agenda
AGENDA ORIGINATIONS, UNDERWRITING AND DEALER MANAGEMENT COMPANY OVERVIEW SERVICING Q&A FINANCIAL HIGHLIGHTS AND FUNDING STRATEGY
Slide 4: 1Q16 Highlights
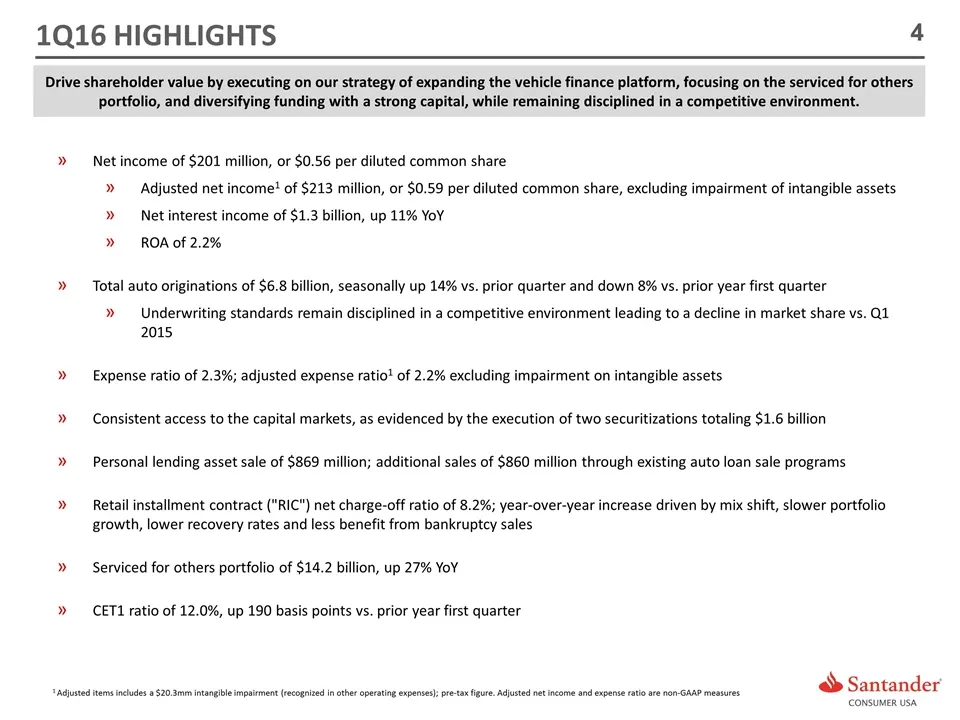
1Q16 HIGHLIGHTS Net income of $201 million, or $0.56 per diluted common share Adjusted net income1 of $213 million, or $0.59 per diluted common share, excluding impairment of intangible assets Net interest income of $1.3 billion, up 11% YoY ROA of 2.2% Total auto originations of $6.8 billion, season
Slide 5: Economic Indicators
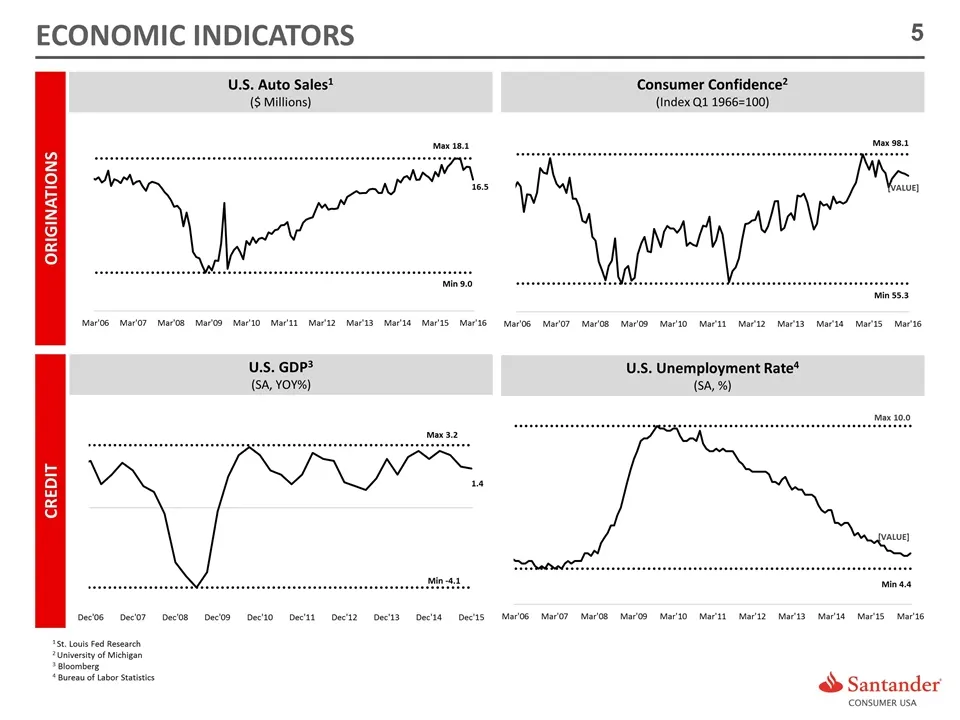
ECONOMIC INDICATORS U.S. Auto Sales1 ($ Millions) 1 St. Louis Fed Research 2 University of Michigan 3 Bloomberg 4 Bureau of Labor Statistics Consumer Confidence2 (Index Q1 1966=100) U.S. GDP3 (SA, YOY%) U.S. Unemployment Rate4 (SA, %) ORIGINATIONS CREDIT
Slide 6: Auto Industry Analysis
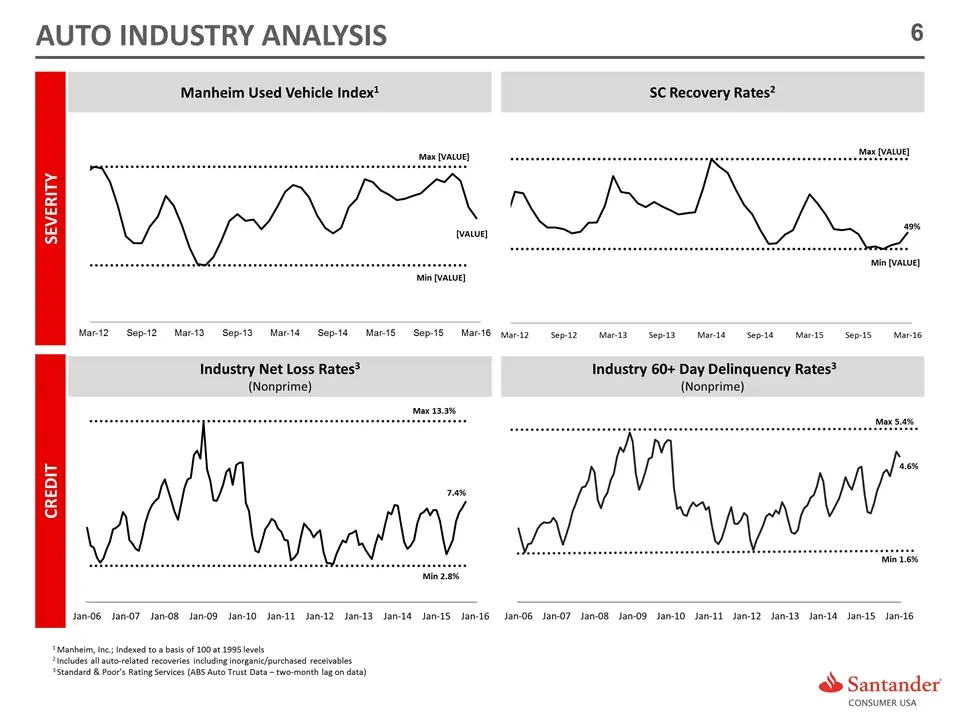
AUTO INDUSTRY ANALYSIS Manheim Used Vehicle Index1 1 Manheim, Inc.; Indexed to a basis of 100 at 1995 levels 2 Includes all auto-related recoveries including inorganic/purchased receivables 3 Standard & Poor’s Rating Services (ABS Auto Trust Data – two-month lag on data) SC Recovery Rates2 Industry
Slide 7: Focused Business Model
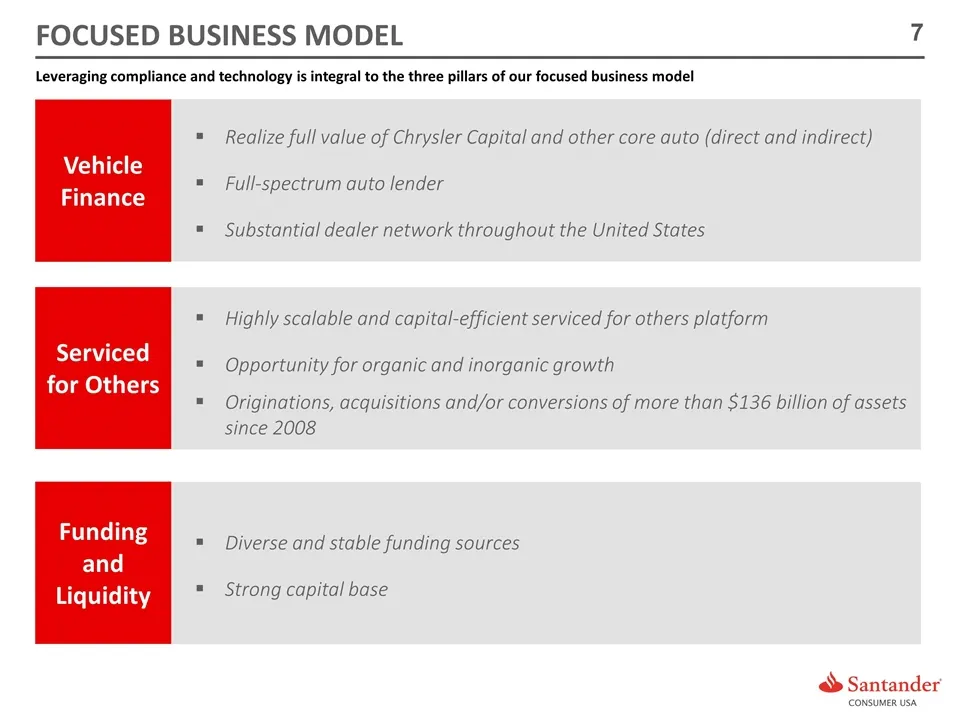
FOCUSED BUSINESS MODEL Realize full value of Chrysler Capital and other core auto (direct and indirect) Full-spectrum auto lender Substantial dealer network throughout the United States Vehicle Finance Highly scalable and capital-efficient serviced for others platform Opportunity for organic and ino
Slide 8: Disciplined Loan Underwriting Continues in 2016
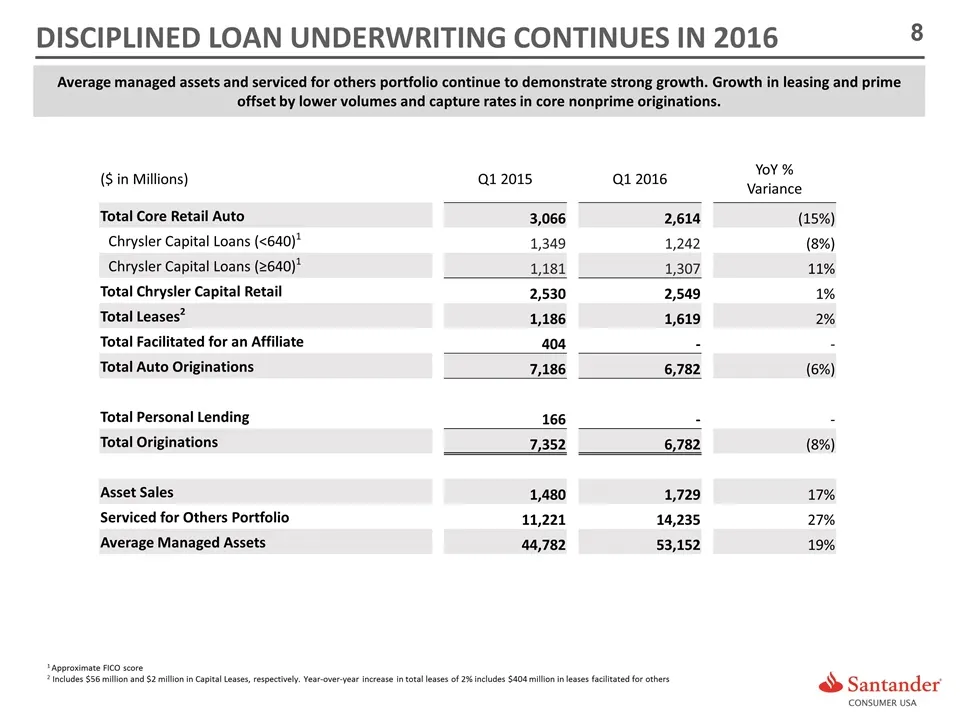
($ in Millions) Q1 2015 Q1 2016 YoY % Variance Total Core Retail Auto 3,066 2,614 (15%) Chrysler Capital Loans (<640)1 1,349 1,242 (8%) Chrysler Capital Loans (≥640)1 1,181 1,307 11% Total Chrysler Capital Retail 2,530 2,549 1% Total Leases2 1,186 1,619 2% Total Facilitated for an Affiliate 404 - -
Slide 9: Recent Trends Exhibit Higher Credit Quality
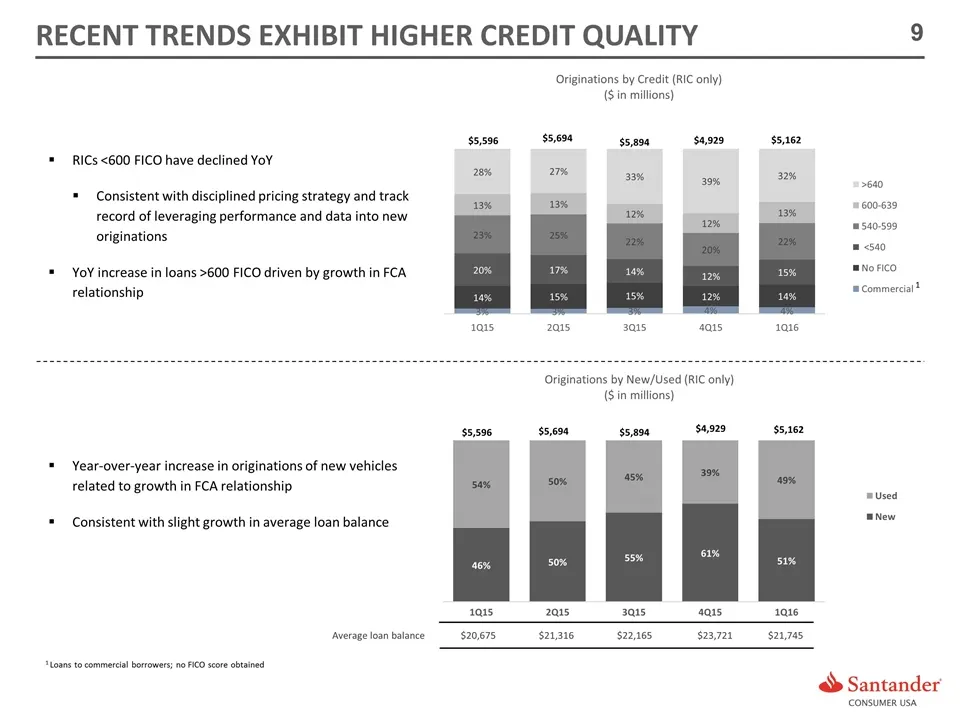
RECENT TRENDS EXHIBIT HIGHER CREDIT QUALITY $5,596 $5,694 $4,929 $5,162 $5,894 $5,596 $5,694 $4,929 $5,162 $5,894 1 Loans to commercial borrowers; no FICO score obtained 1 RICs <600 FICO have declined YoY Consistent with disciplined pricing strategy and track record of leveraging performance and dat
Slide 10: Chrysler Capital
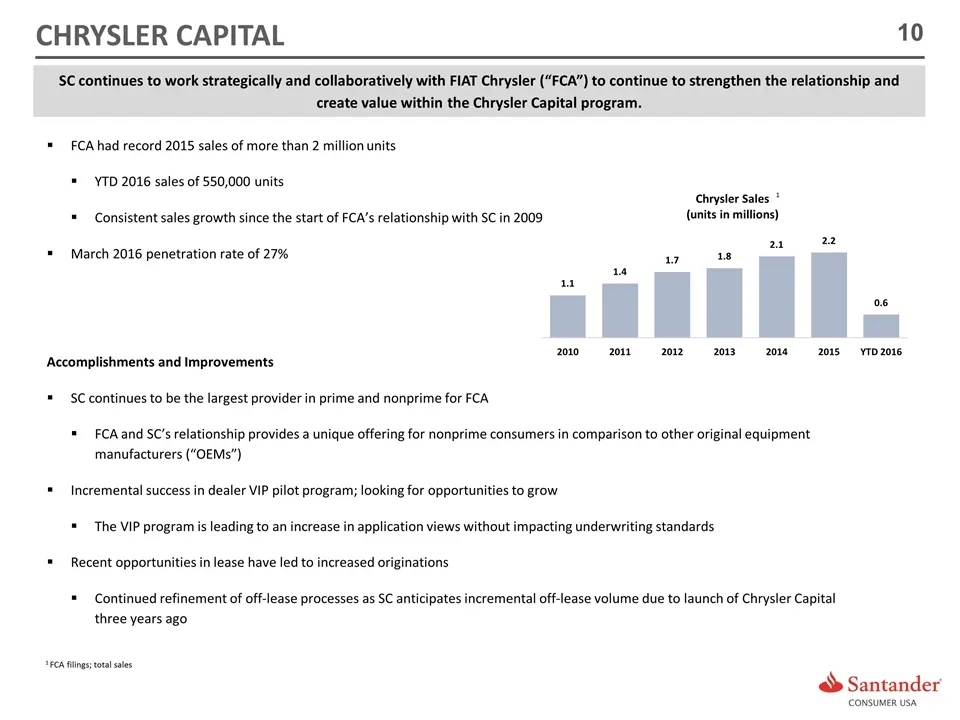
FCA had record 2015 sales of more than 2 million units YTD 2016 sales of 550,000 units Consistent sales growth since the start of FCA’s relationship with SC in 2009 March 2016 penetration rate of 27% Accomplishments and Improvements SC continues to be the largest provider in prime and nonprime for F
Slide 11: Serviced for Others Platform
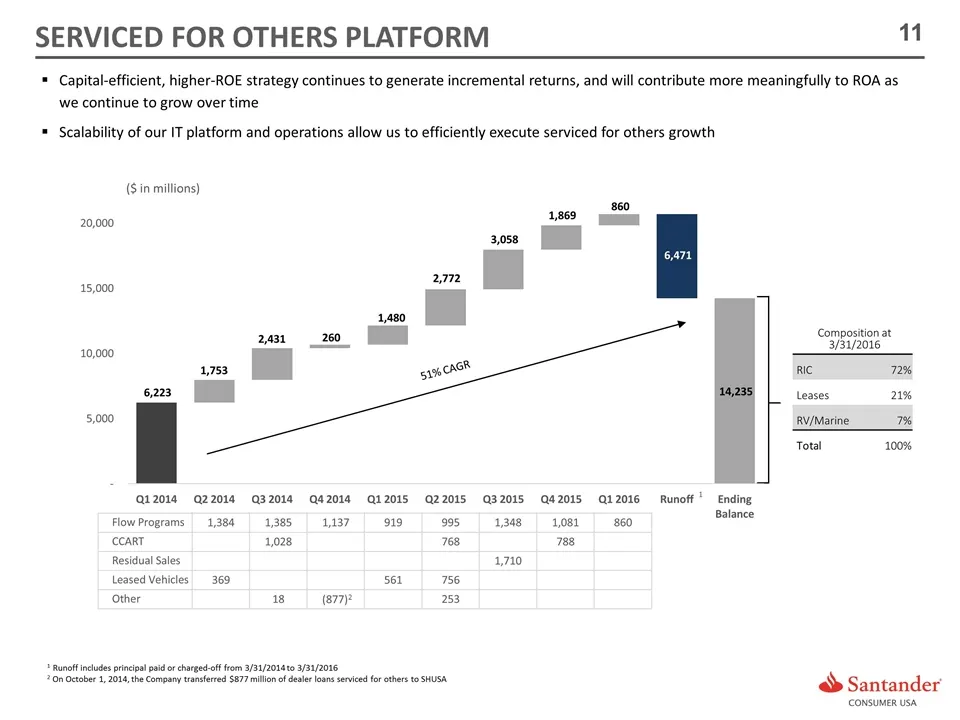
(877)2 Capital-efficient, higher-ROE strategy continues to generate incremental returns, and will contribute more meaningfully to ROA as we continue to grow over time Scalability of our IT platform and operations allow us to efficiently execute serviced for others growth SERVICED FOR OTHERS PLATFORM
Slide 12: Agenda
AGENDA ORIGINATIONS, UNDERWRITING AND DEALER MANAGEMENT COMPANY OVERVIEW SERVICING Q&A FINANCIAL HIGHLIGHTS AND FUNDING STRATEGY
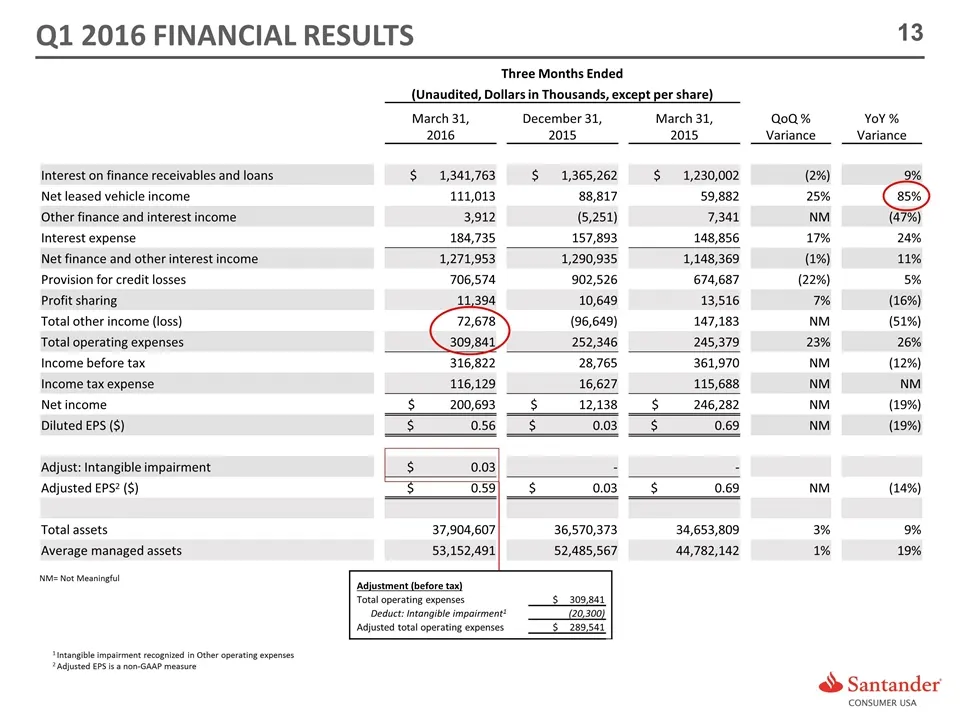
Slide 13: Income Statement Summary
Three Months Ended (Unaudited, Dollars in Thousands, except per share) March 31, 2016 December 31, 2015 March 31, 2015 QoQ % Variance YoY % Variance Interest on finance receivables and loans $ 1,341,763 $ 1,365,262 $ 1,230,002 (2%) 9% Net leased vehicle income 111,013 88,817 59,882 25% 85% Other fin
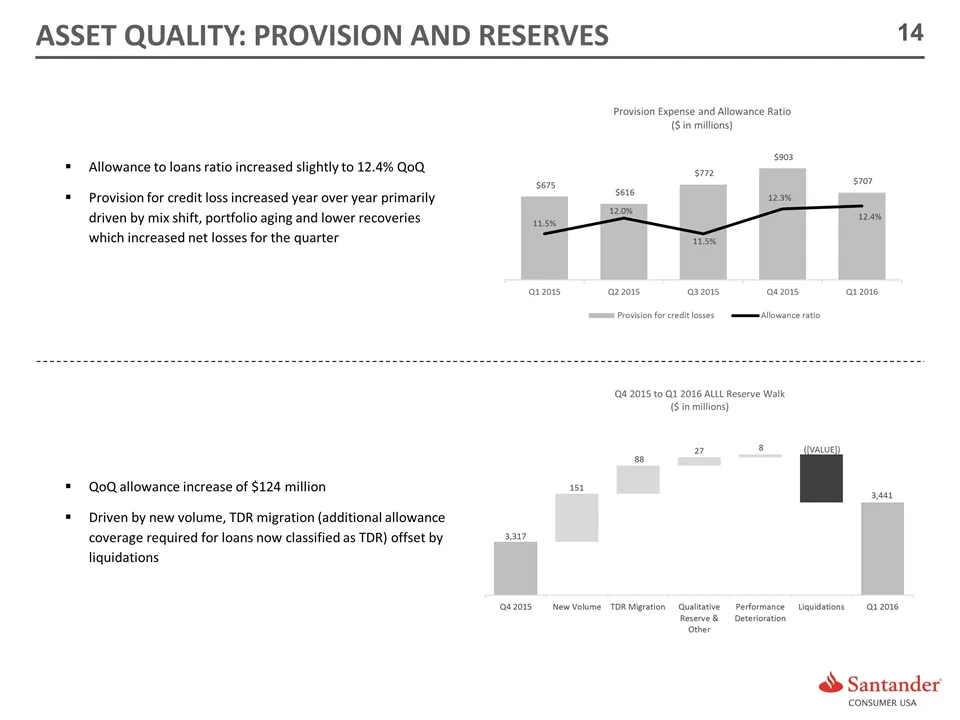
Slide 14: Asset Quality: Provision and Reserves
ASSET QUALITY: PROVISION AND RESERVES Allowance to loans ratio increased slightly to 12.4% QoQ Provision for credit loss increased year over year primarily driven by mix shift, portfolio aging and lower recoveries which increased net losses for the quarter QoQ allowance increase of $124 million Driv
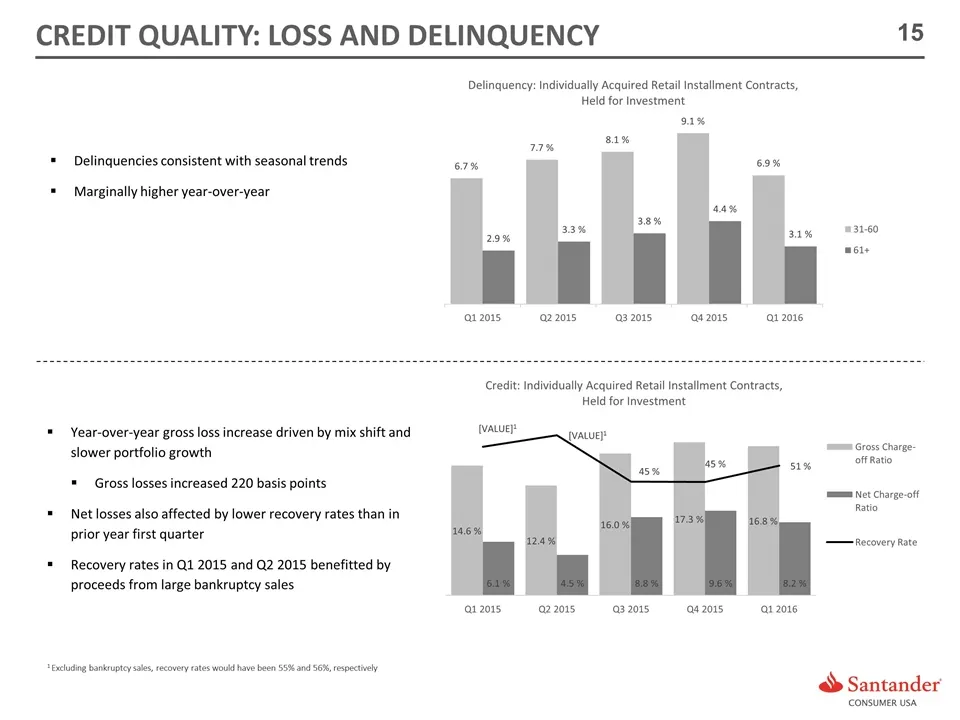
Slide 15: Credit Quality: Loss and Delinquency
CREDIT QUALITY: LOSS AND DELINQUENCY Delinquencies consistent with seasonal trends Marginally higher year-over-year Year-over-year gross loss increase driven by mix shift and slower portfolio growth Gross losses increased 220 basis points Net losses also affected by lower recovery rates than in prio
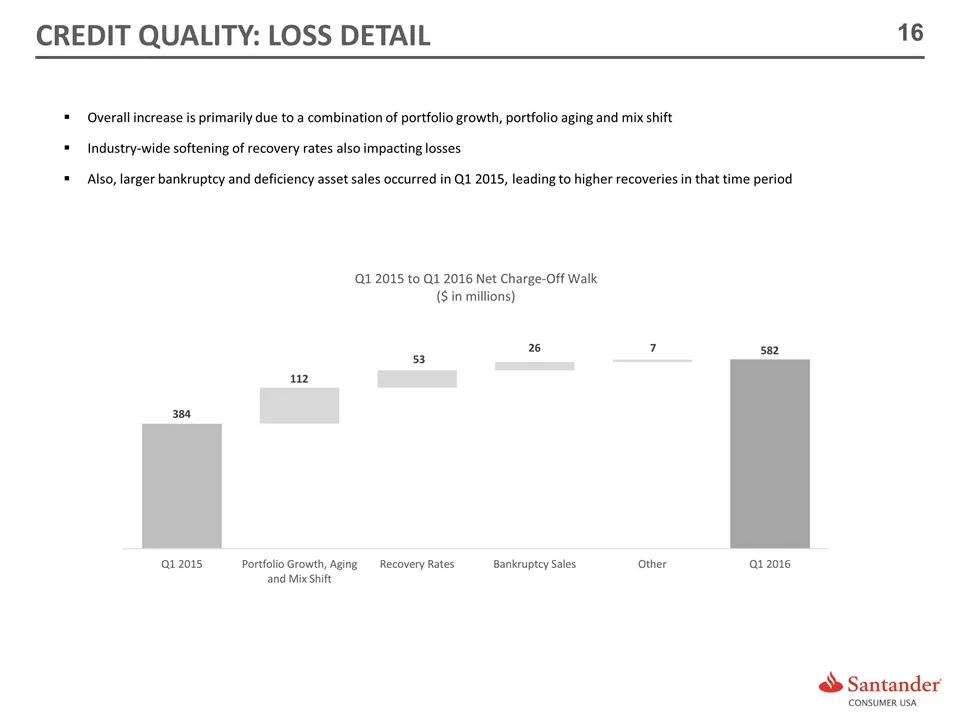
Slide 16: Credit Quality: Loss Detail
CREDIT QUALITY: LOSS DETAIL Overall increase is primarily due to a combination of portfolio growth, portfolio aging and mix shift Industry-wide softening of recovery rates also impacting losses Also, larger bankruptcy and deficiency asset sales occurred in Q1 2015, leading to higher recoveries in th
Slide 17: Expense Management
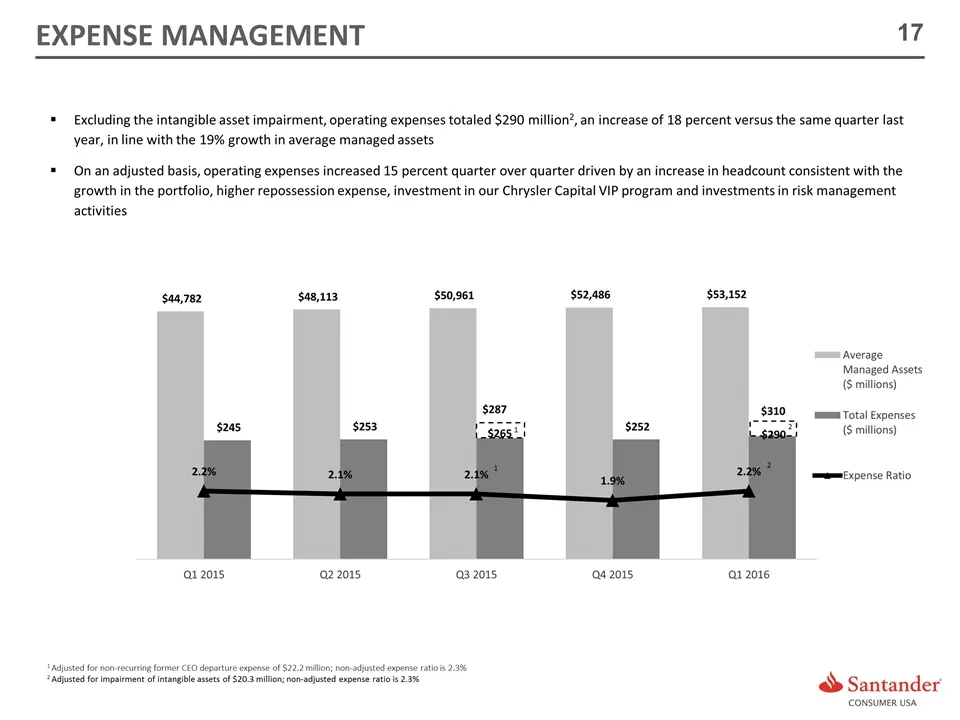
EXPENSE MANAGEMENT 1 Adjusted for non-recurring former CEO departure expense of $22.2 million; non-adjusted expense ratio is 2.3% 2 Adjusted for impairment of intangible assets of $20.3 million; non-adjusted expense ratio is 2.3% Excluding the intangible asset impairment, operating expenses totaled
Slide 18: Funding and Liquidity
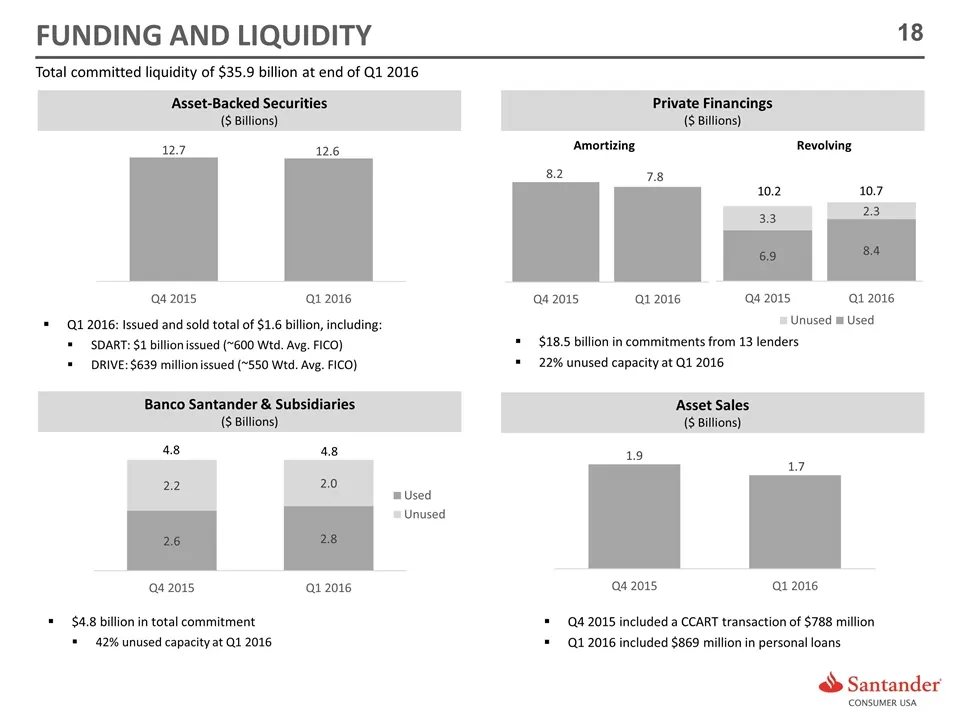
FUNDING AND LIQUIDITY Total committed liquidity of $35.9 billion at end of Q1 2016 Asset-Backed Securities ($ Billions) Private Financings ($ Billions) Banco Santander & Subsidiaries ($ Billions) Asset Sales ($ Billions) Q1 2016: Issued and sold total of $1.6 billion, including: SDART: $1 billion is
Slide 19: Consistent Capital Generation
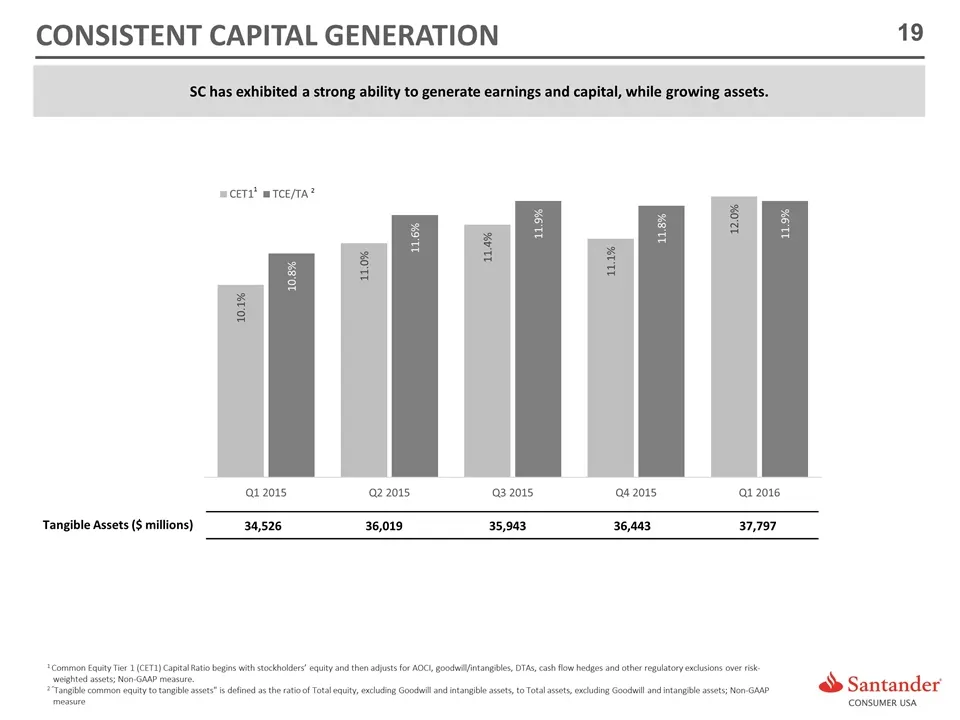
CONSISTENT CAPITAL GENERATION 1 Common Equity Tier 1 (CET1) Capital Ratio begins with stockholders’ equity and then adjusts for AOCI, goodwill/intangibles, DTAs, cash flow hedges and other regulatory exclusions over risk-weighted assets; Non-GAAP measure. 2 “Tangible common equity to tangible assets
Slide 20: Three Distinct ABS Platforms
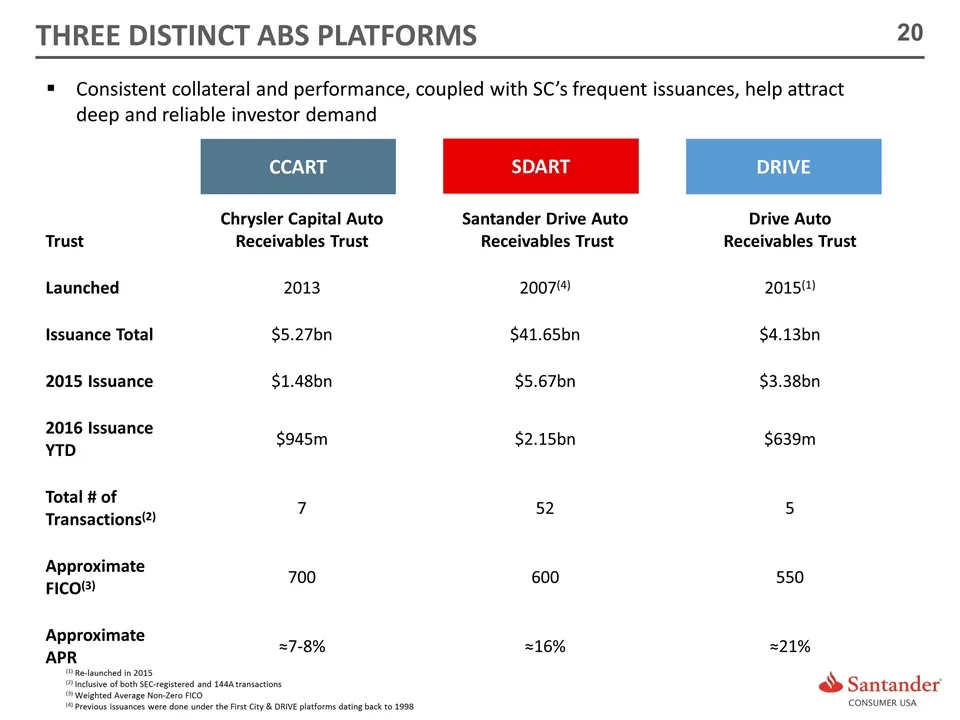
CCART DRIVE SDART (1) Re-launched in 2015 (2) Inclusive of both SEC-registered and 144A transactions (3) Weighted Average Non-Zero FICO (4) Previous issuances were done under the First City & DRIVE platforms dating back to 1998 Consistent collateral and performance, coupled with SC’s frequent issuan
Slide 21: Market Leadership in Retail Auto ABS Issuance
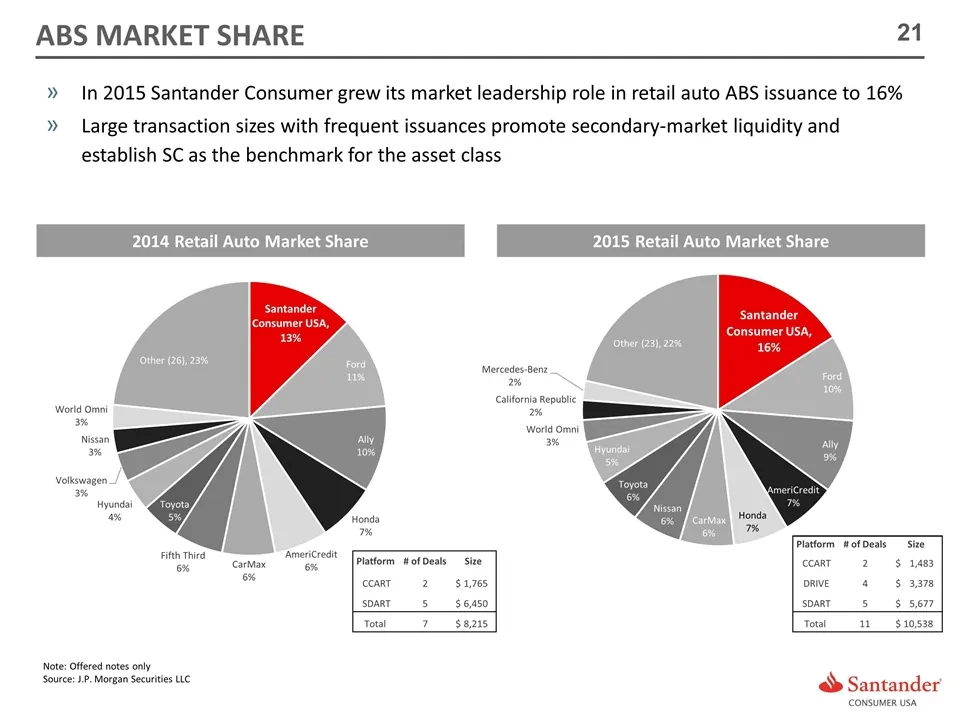
In 2015 Santander Consumer grew its market leadership role in retail auto ABS issuance to 16% Large transaction sizes with frequent issuances promote secondary-market liquidity and establish SC as the benchmark for the asset class 2014 Retail Auto Market Share 2015 Retail Auto Market Share Platform
Slide 22: Agenda
AGENDA ORIGINATIONS, UNDERWRITING AND DEALER MANAGEMENT COMPANY OVERVIEW SERVICING Q&A FINANCIAL HIGHLIGHTS AND FUNDING STRATEGY
Slide 23: Originations Management Team
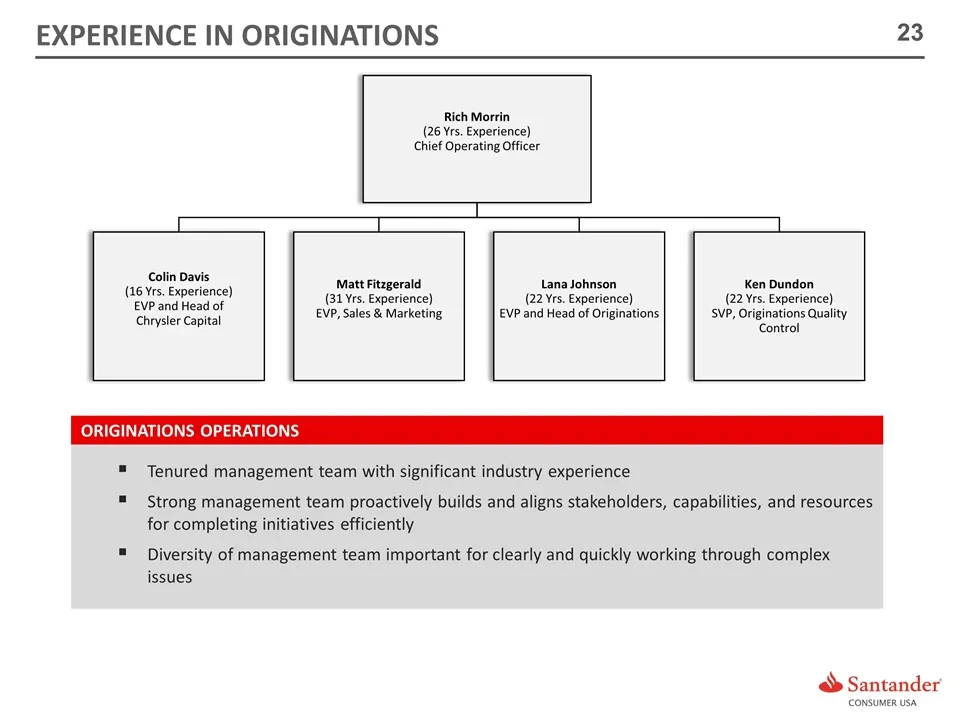
Tenured management team with significant industry experience Strong management team proactively builds and aligns stakeholders, capabilities, and resources for completing initiatives efficiently Diversity of management team important for clearly and quickly working through complex issues ORIGINATION
Slide 24: Diverse Channels / Consistent Decisioning
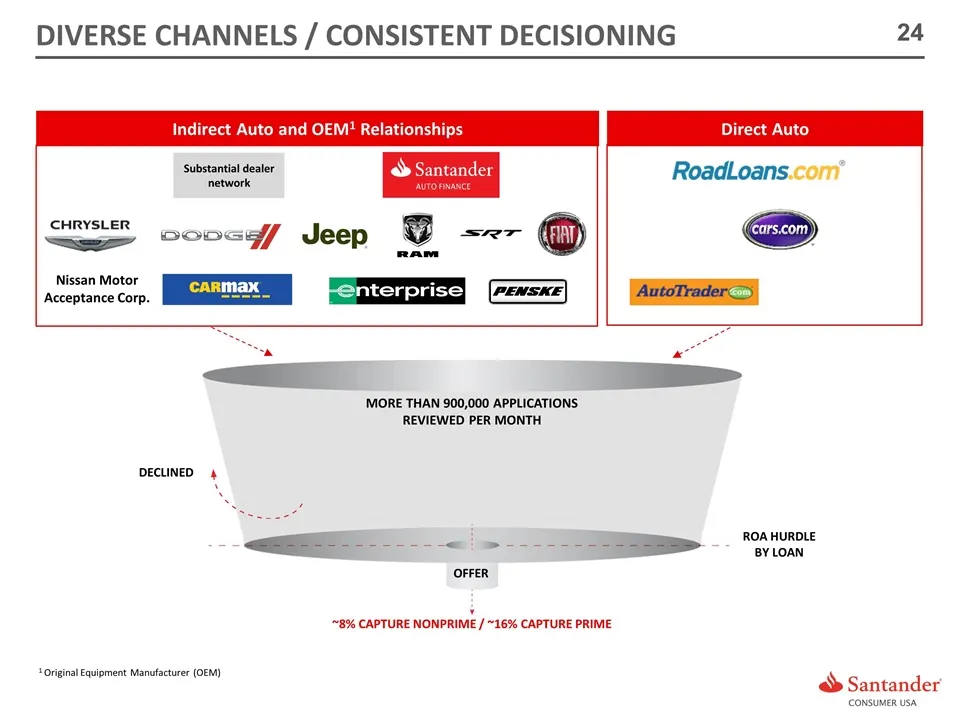
DIVERSE CHANNELS / CONSISTENT DECISIONING ~8% capture nonprime / ~16% capture prime More than 900,000 applications reviewed per month ROA HURDLE BY LOAN DECLINED OFFER Substantial dealer network 1 Original Equipment Manufacturer (OEM) Direct Auto Indirect Auto and OEM1 Relationships Nissan Motor Acc
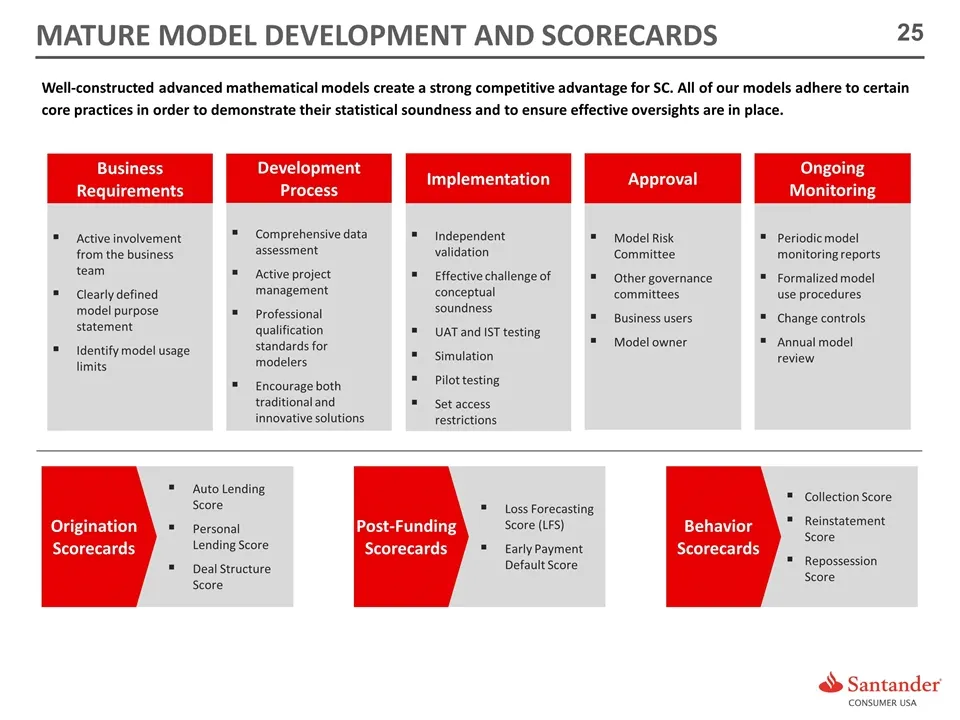
Slide 25: Advanced Mathematical Models
Well‐constructed advanced mathematical models create a strong competitive advantage for SC. All of our models adhere to certain core practices in order to demonstrate their statistical soundness and to ensure effective oversights are in place. Active involvement from the business team Clearly define
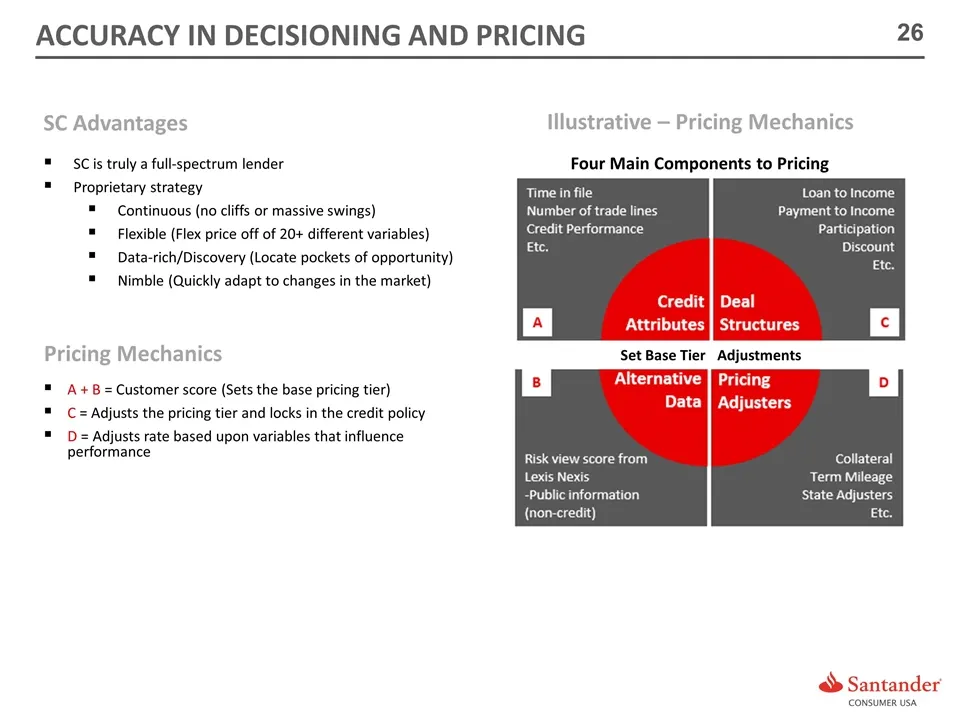
Slide 26: Accuracy in Decisioning and Pricing
SC Advantages SC is truly a full-spectrum lender Proprietary strategy Continuous (no cliffs or massive swings) Flexible (Flex price off of 20+ different variables) Data-rich/Discovery (Locate pockets of opportunity) Nimble (Quickly adapt to changes in the market) Illustrative – Pricing Mechanics A +
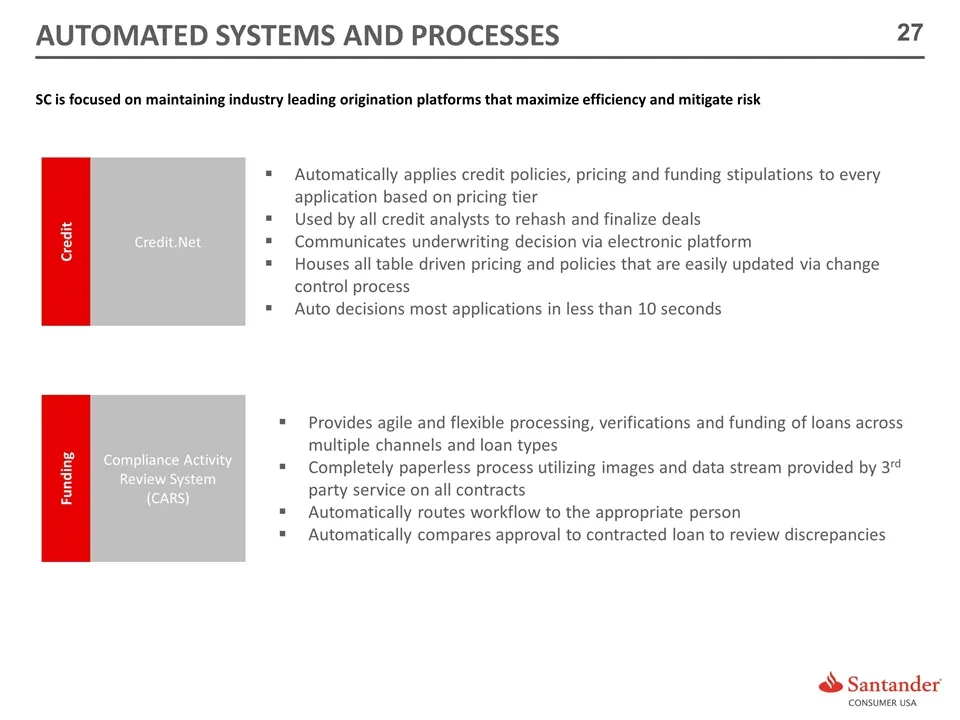
Slide 27: Origination Platforms
Provides agile and flexible processing, verifications and funding of loans across multiple channels and loan types Completely paperless process utilizing images and data stream provided by 3rd party service on all contracts Automatically routes workflow to the appropriate person Automatically compar
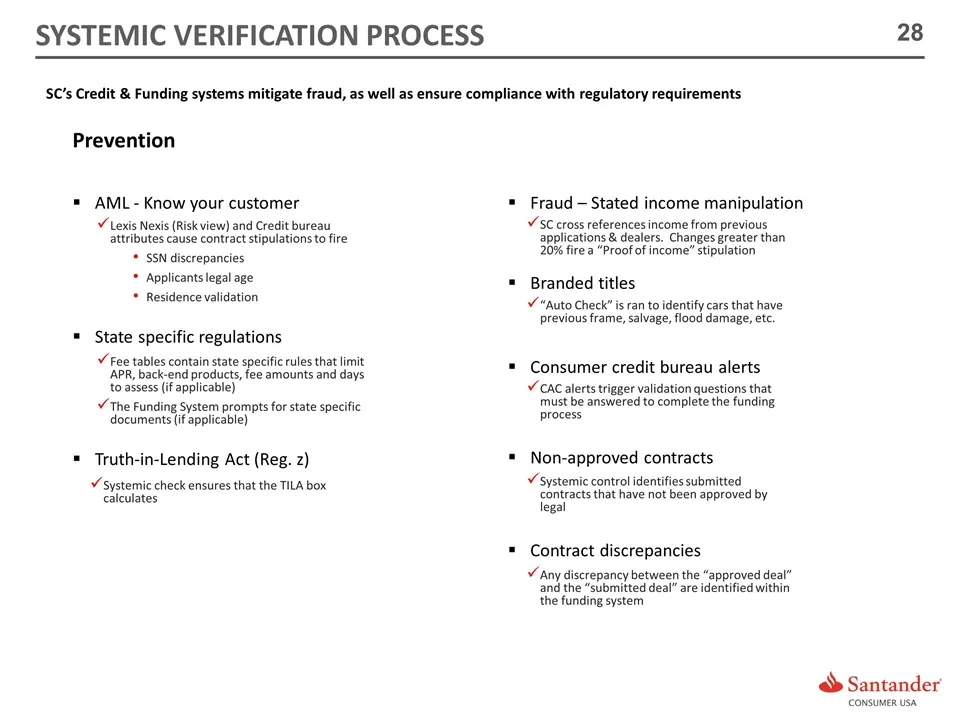
Slide 28: Fraud Prevention and Compliance Controls
Lexis Nexis (Risk view) and Credit bureau attributes cause contract stipulations to fire SSN discrepancies Applicants legal age Residence validation SC’s Credit & Funding systems mitigate fraud, as well as ensure compliance with regulatory requirements Prevention AML - Know your customer State speci
Slide 29: Formation of Dealer Services
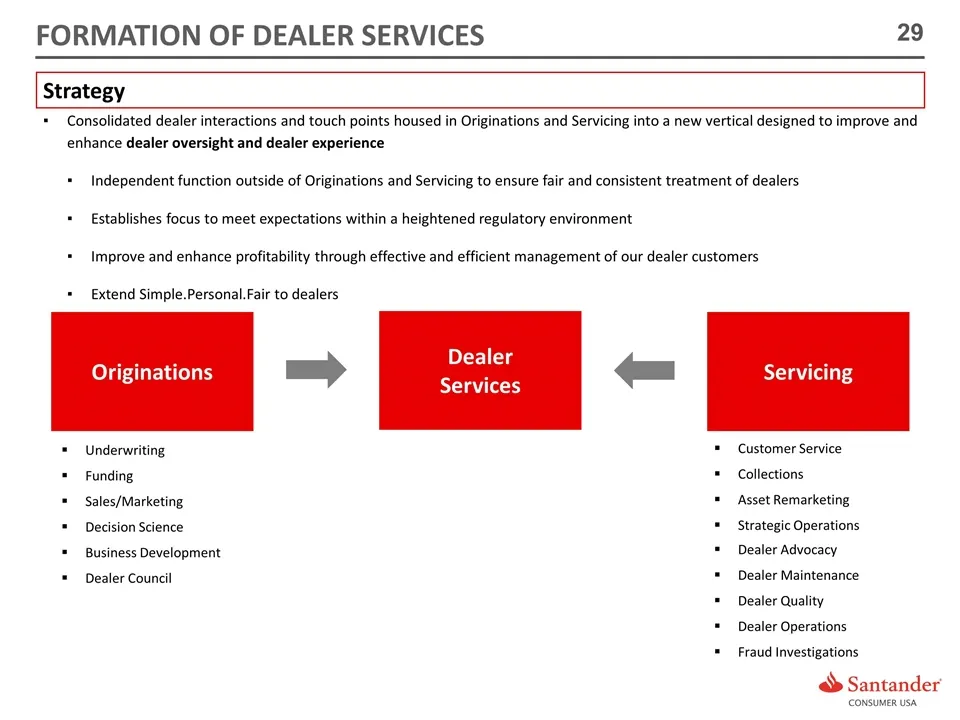
Formation of Dealer Services Originations Strategy Dealer Services Servicing Underwriting Funding Sales/Marketing Decision Science Business Development Dealer Council Customer Service Collections Asset Remarketing Strategic Operations Consolidated dealer interactions and touch points housed in Origi
Slide 30: Dealer Oversight
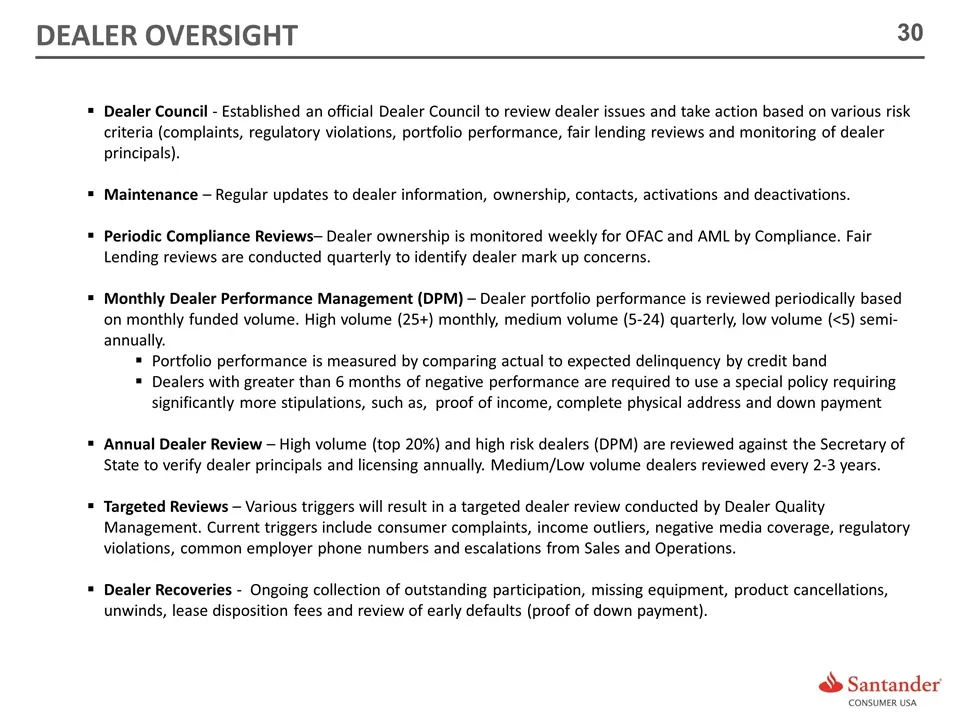
Dealer oversight Dealer Council - Established an official Dealer Council to review dealer issues and take action based on various risk criteria (complaints, regulatory violations, portfolio performance, fair lending reviews and monitoring of dealer principals). Maintenance – Regular updates to deale
Slide 31: Control Framework
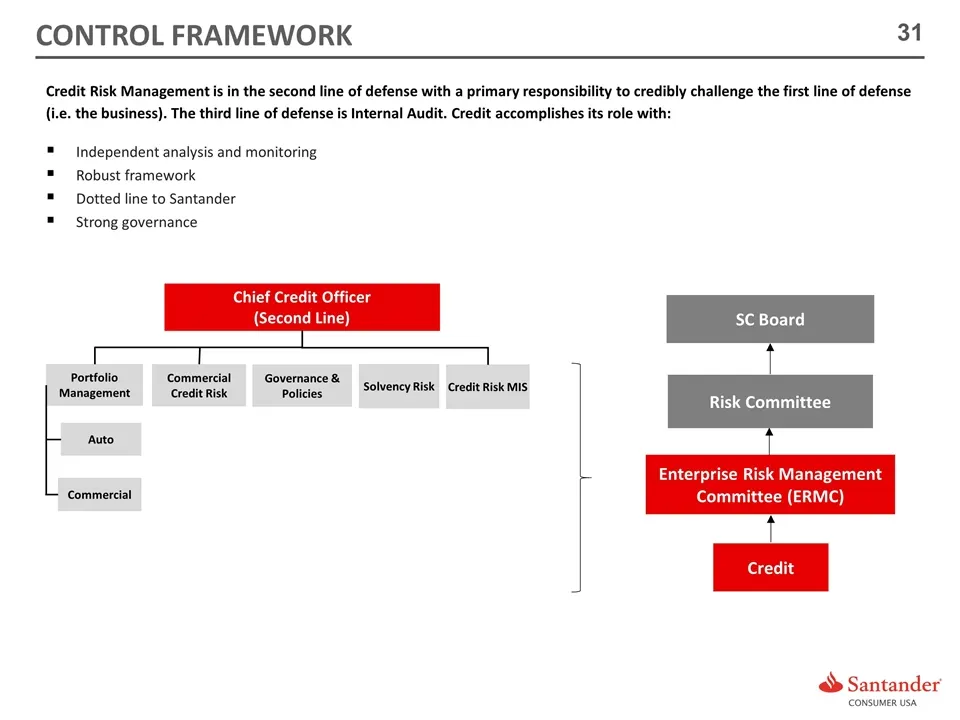
Credit Risk Management is in the second line of defense with a primary responsibility to credibly challenge the first line of defense (i.e. the business). The third line of defense is Internal Audit. Credit accomplishes its role with: Independent analysis and monitoring Robust framework Dotted line
Slide 32: Quality Assurance and Quality Control
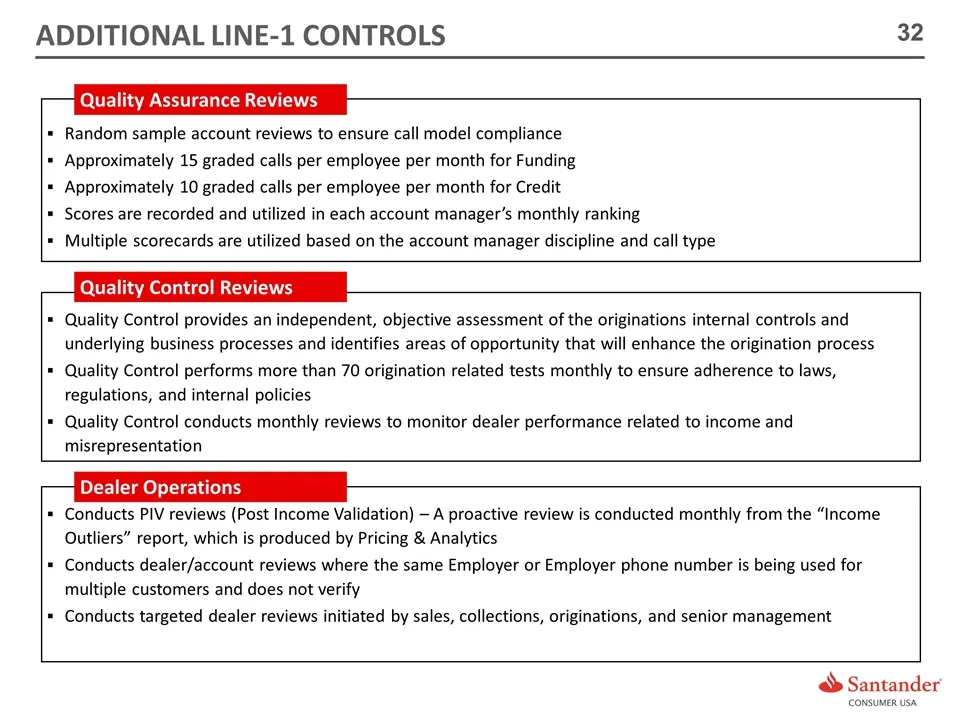
Random sample account reviews to ensure call model compliance Approximately 15 graded calls per employee per month for Funding Approximately 10 graded calls per employee per month for Credit Scores are recorded and utilized in each account manager’s monthly ranking Multiple scorecards are utilized b
Slide 33: Agenda
AGENDA ORIGINATIONS, UNDERWRITING AND DEALER MANAGEMENT COMPANY OVERVIEW SERVICING Q&A FINANCIAL HIGHLIGHTS AND FUNDING STRATEGY
Slide 34: Servicing Management Team
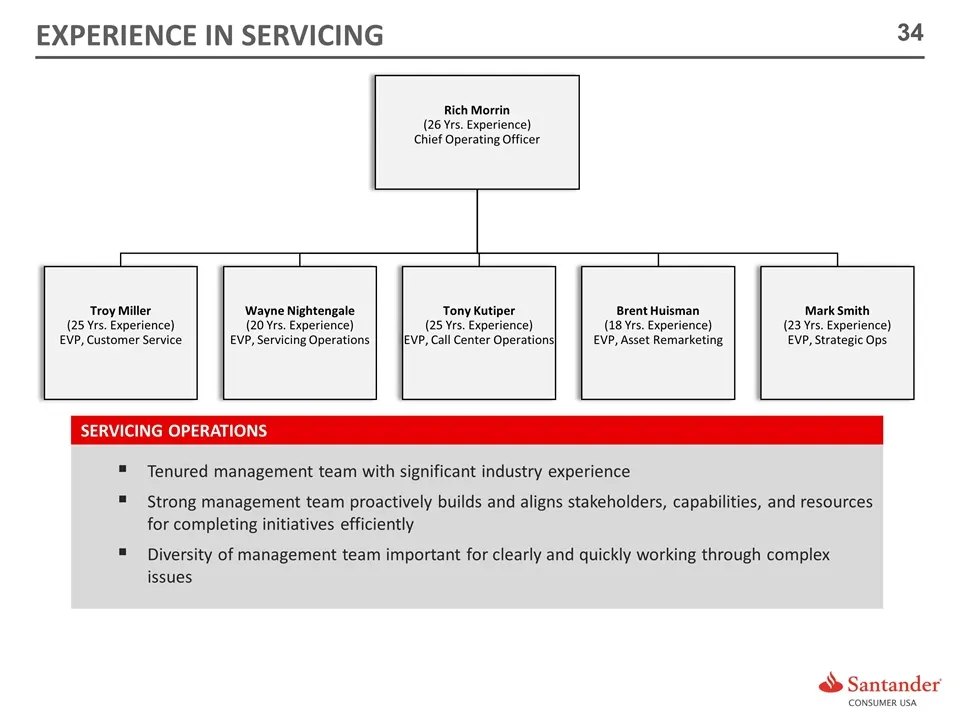
Tenured management team with significant industry experience Strong management team proactively builds and aligns stakeholders, capabilities, and resources for completing initiatives efficiently Diversity of management team important for clearly and quickly working through complex issues SERVICING O
Slide 35: Servicing Overview
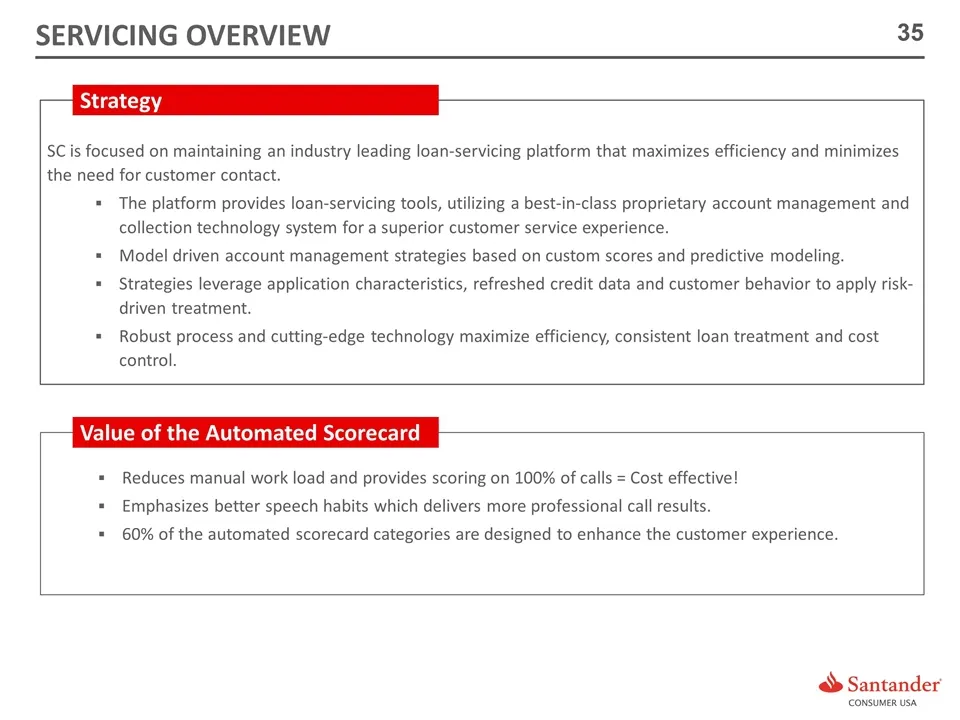
SERVICING OVERVIEW SC is focused on maintaining an industry leading loan-servicing platform that maximizes efficiency and minimizes the need for customer contact. The platform provides loan-servicing tools, utilizing a best-in-class proprietary account management and collection technology system for
Slide 36: Call Center Expansion in 2016
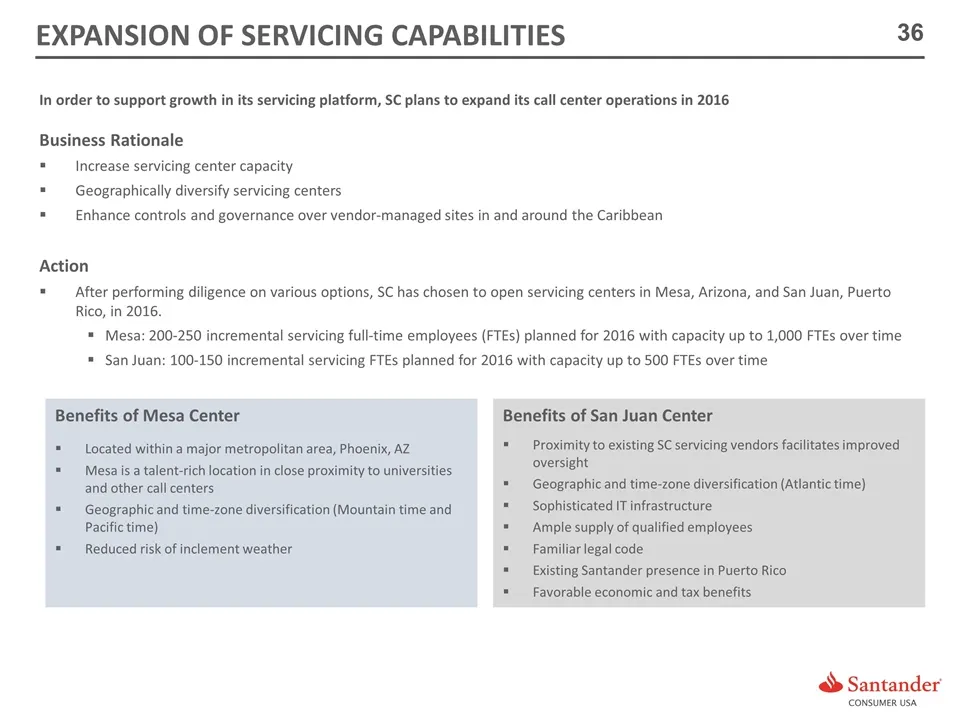
In order to support growth in its servicing platform, SC plans to expand its call center operations in 2016 Business Rationale Increase servicing center capacity Geographically diversify servicing centers Enhance controls and governance over vendor-managed sites in and around the Caribbean Action Af
Slide 37: Geographic & Timezone Diversification
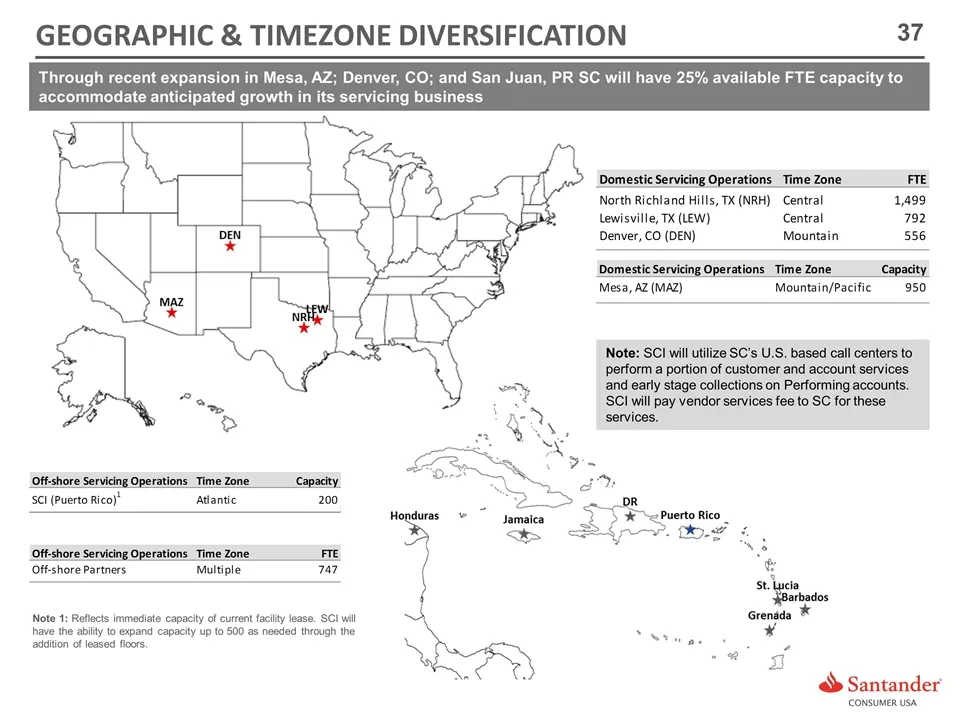
GEOGRAPHIC & TIMEZONE DIVERSIFICATION Note: SCI will utilize SC’s U.S. based call centers to perform a portion of customer and account services and early stage collections on Performing accounts. SCI will pay vendor services fee to SC for these services. Through recent expansion in Mesa, AZ; Denver,
Slide 38: Welcome New Customers
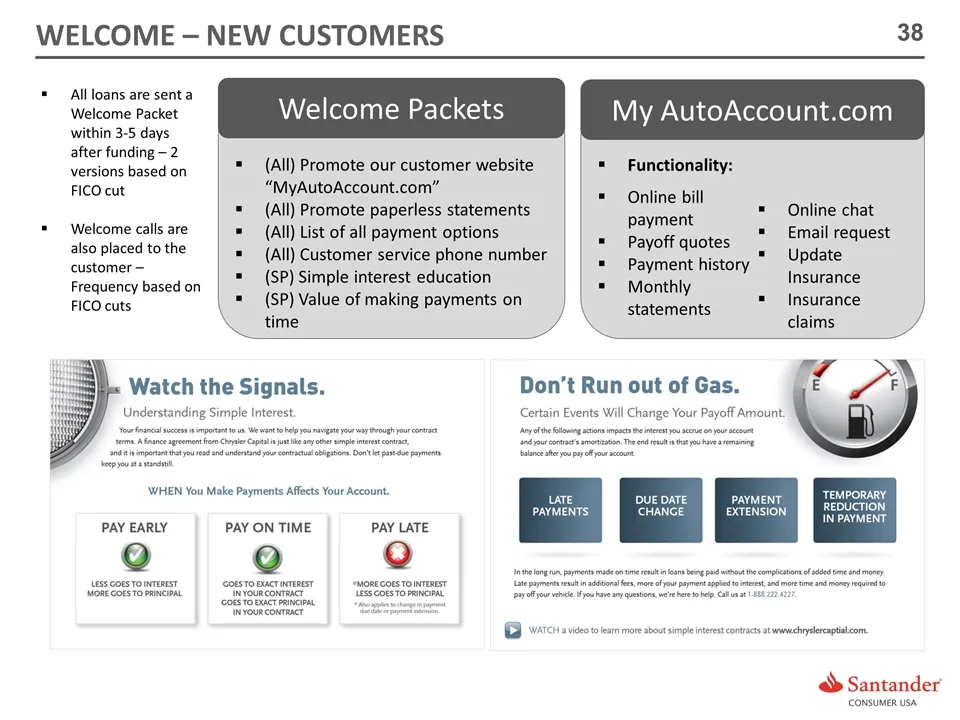
All loans are sent a Welcome Packet within 3-5 days after funding – 2 versions based on FICO cut Welcome calls are also placed to the customer – Frequency based on FICO cuts (All) – Promote (All) Promote our customer website “MyAutoAccount.com” (All) Promote paperless statements (All) List of all pa
Slide 39: Speech Analytics
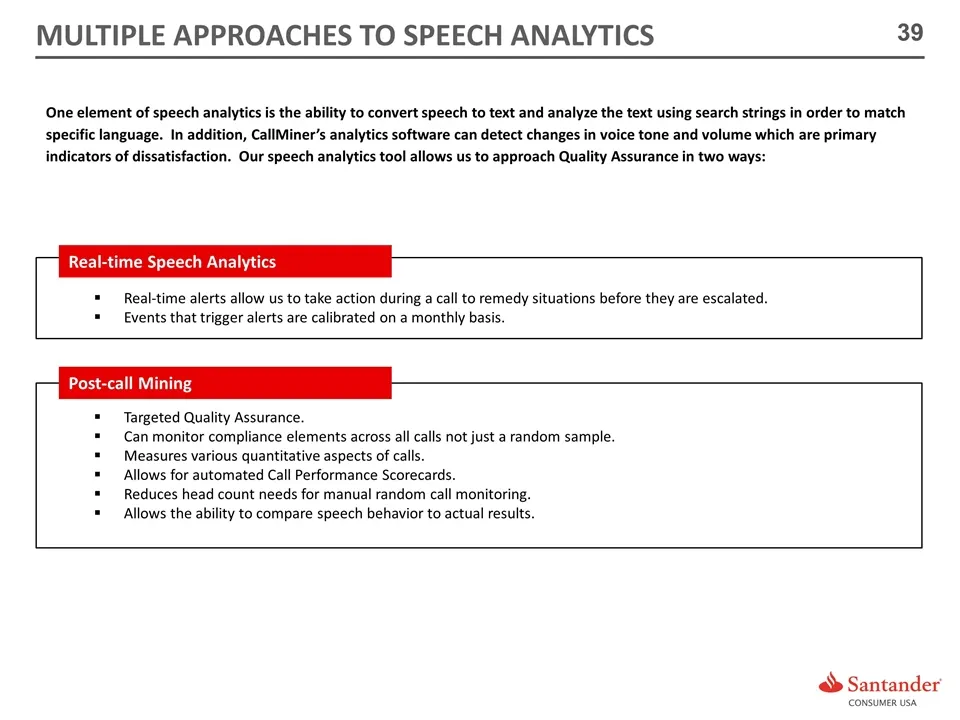
One element of speech analytics is the ability to convert speech to text and analyze the text using search strings in order to match specific language. In addition, CallMiner’s analytics software can detect changes in voice tone and volume which are primary indicators of dissatisfaction. Our speech
Slide 40: CallMiner Real-Time Speech Analytics Software
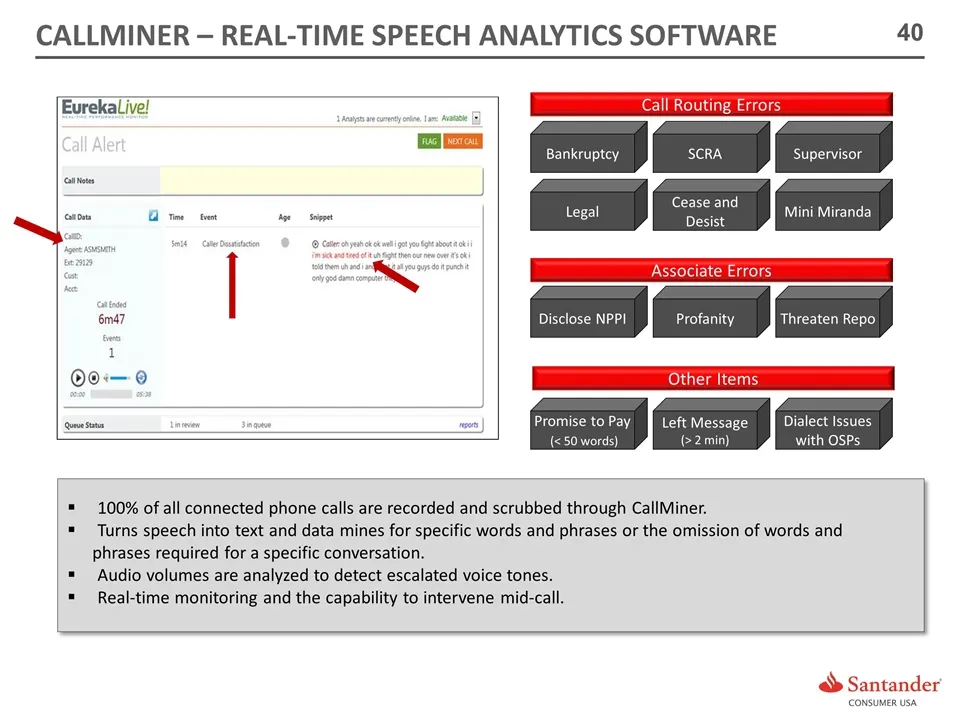
Bankruptcy SCRA Supervisor Cease and Desist Mini Miranda Legal Call Routing Errors Profanity Threaten Repo Disclose NPPI Promise to Pay (< 50 words) Left Message (> 2 min) Dialect Issues with OSPs Associate Errors Other Items 100% of all connected phone calls are recorded and scrubbed through CallMi
Slide 41: Quality Assurance
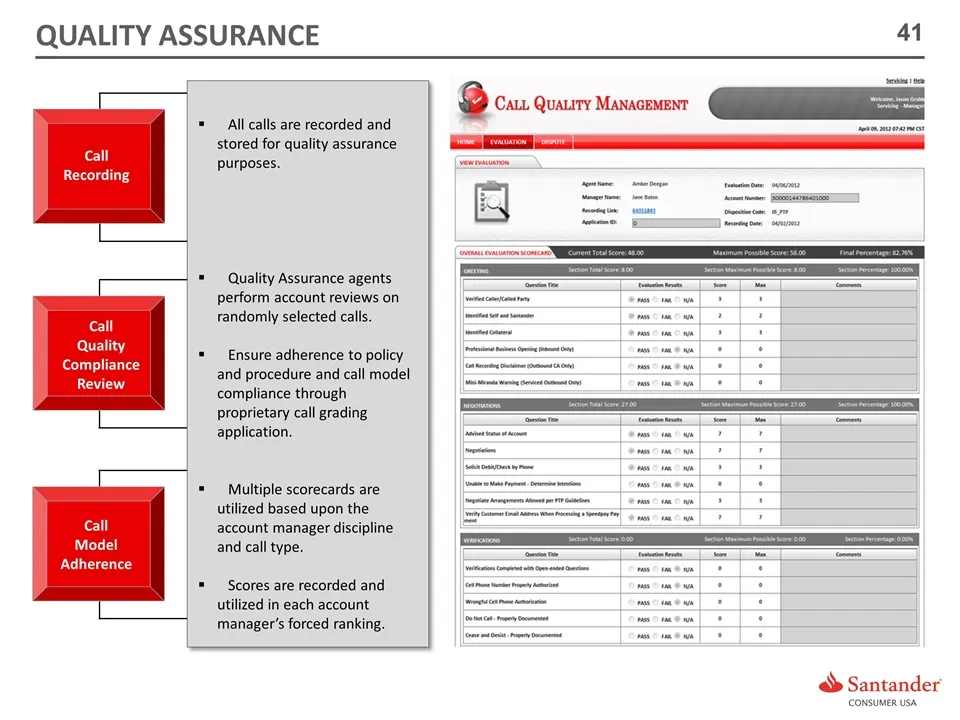
Call Recording All calls are recorded and stored for quality assurance purposes. Quality Assurance agents perform account reviews on randomly selected calls. Ensure adherence to policy and procedure and call model compliance through proprietary call grading application. Multiple scorecards are utili
Slide 42: Collections Scoring Models
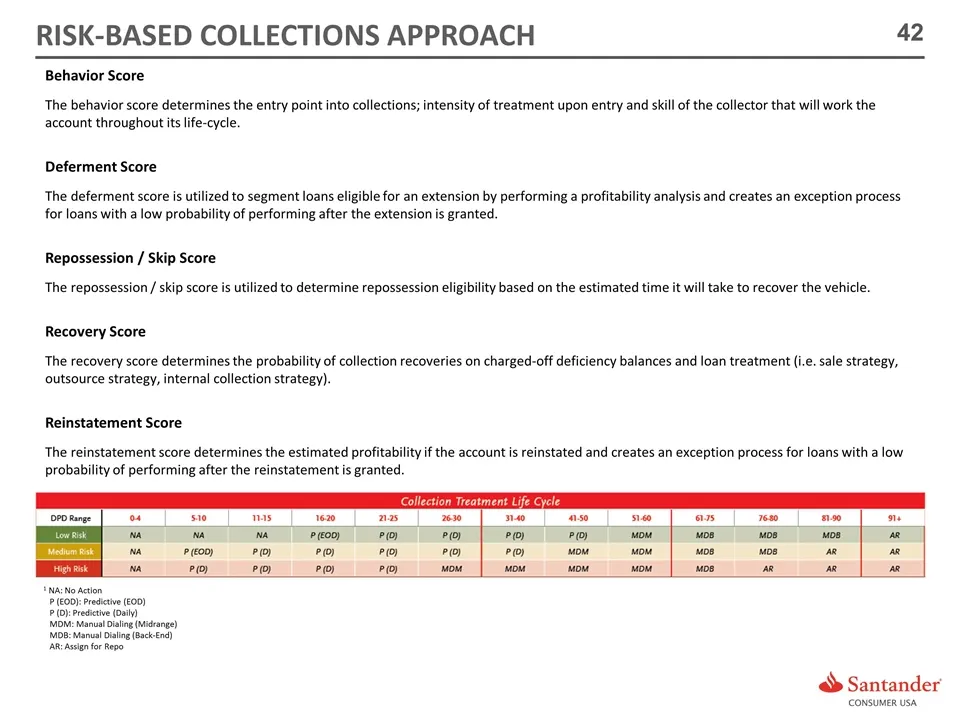
Behavior Score The behavior score determines the entry point into collections; intensity of treatment upon entry and skill of the collector that will work the account throughout its life-cycle. Deferment Score The deferment score is utilized to segment loans eligible for an extension by performing a
Slide 43: Repossession and Collections Process
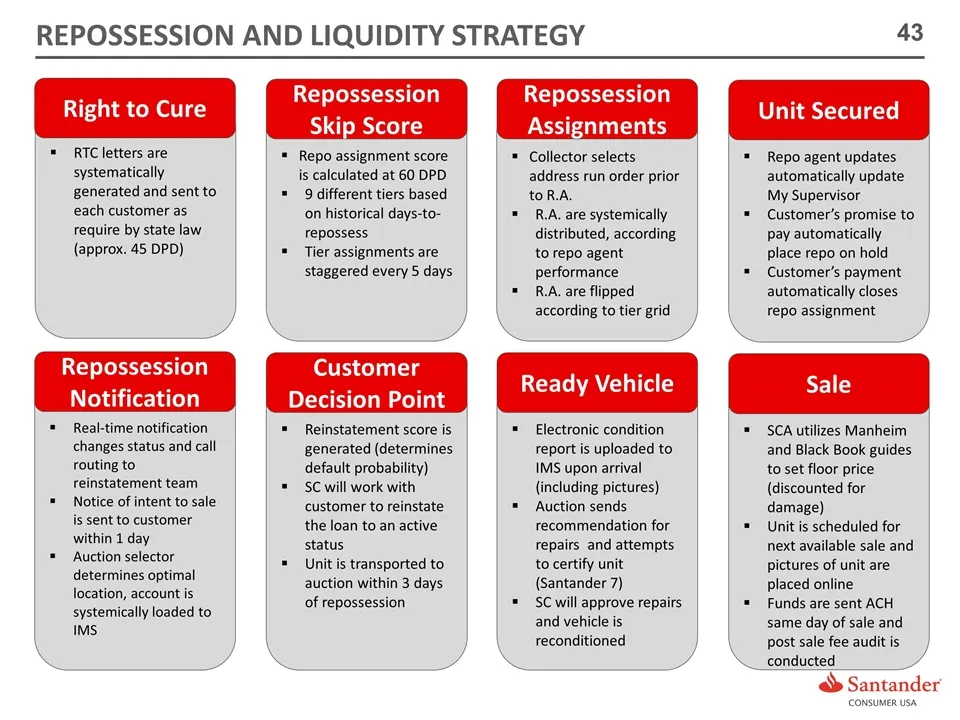
RTC letters are systematically generated and sent to each customer as require by state law (approx. 45 DPD) Right to Cure (All) – Promote Repo assignment score is calculated at 60 DPD 9 different tiers based on historical days-to-repossess Tier assignments are staggered every 5 days Repossession Ski
Slide 44: Competitive Strength – Proprietary Servicing System
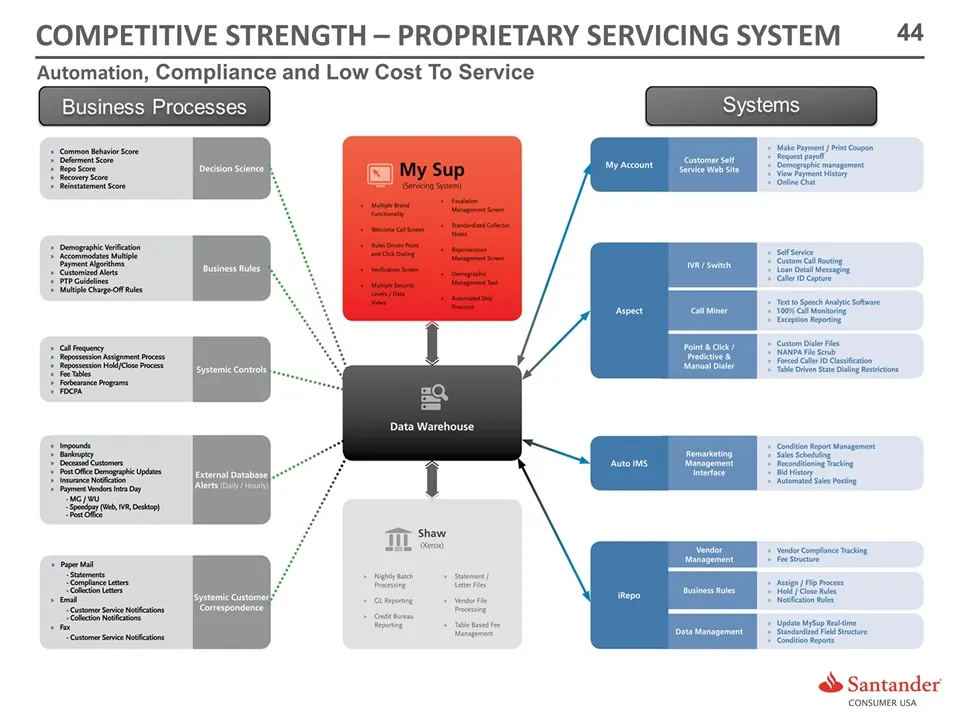
Automation, Compliance and Low Cost To Service COMPETITIVE STRENGTH – PROPRIETARY SERVICING SYSTEM
Slide 45: Agenda
AGENDA ORIGINATIONS, UNDERWRITING AND DEALER MANAGEMENT COMPANY OVERVIEW SERVICING Q&A FINANCIAL HIGHLIGHTS AND FUNDING STRATEGY

Slide 46: Santander Consumer USA
® Santander CONSUMER USA
Source: SEC EDGAR · 8-K filed May 12, 2016
More decks from Santander Consumer USA Holdings Inc
 Q3 2021 Earnings Presentation24 slides · Oct 27, 2021
 Q2 2021 Earnings Presentation24 slides · Jul 28, 2021
 Q1 2021 Earnings Presentation24 slides · Apr 28, 2021
 FY2020 Earnings Presentation28 slides · Feb 3, 2021
 Q3 2020 Earnings Presentation25 slides · Oct 28, 2020
 Q2 2020 Earnings Presentation26 slides · Jul 29, 2020