Temple-Inland — UBS Global Paper & Forest Products Conference 2004
36 slides from Temple-Inland's conference presentation, Sep 23, 2004

Slide 1: UBS Global Paper & Forest Products Conference
UBS Global Paper & Forest Products Conference September 23, 2004
Slide 2: Forward-looking statements
This presentation contains forward-looking statements that involve risks and uncertainties. The actual results of Temple-Inland may differ significantly from the results discussed in the forward-looking statements. Factors that might cause such differences include general economic, market, or busine
Slide 3: Our Focus: Investments In Businesses That Will Generate Superior Returns
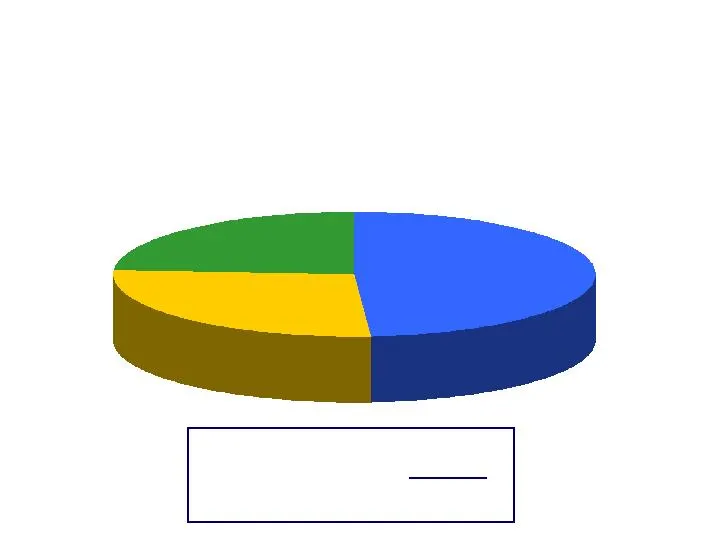
Our Focus: Investments In Businesses That Will Generate Superior Returns Over Economic Cycles 24% 27% 49% Forest Products ($1.0 billion) Financial Services ($1.1 billion) Corrugated Packaging ($2.0 billion) Business Segments Revenue: $ 4.7 billion Operating Income: $ 265 million

Slide 4: TIN Strategy
TIN Strategy Market Driven, Customer-Oriented Company Focus On Corrugated Packaging From An Integrated Platform Maximize The Value Of Timberlands Through Alignment Of Well-Located Converting Operations With Accelerated Fiber Growth, And Development Of Significant Real Estate Opportunities On High-Va

Slide 5: Our Primary Goal: Deliver Superior Returns To Our Shareholders
Our Primary Goal: Deliver Superior Returns To Our Shareholders Primary Driver Of Shareholder Value Creation Is ROI Established ROI Pre-Tax Target Of 18.5% (EBIT/Investment) Compensation Tied To ROI
Slide 6: Focus On Corrugated Packaging Because Of Fundamental Industry Changes
Focus On Corrugated Packaging Because Of Fundamental Industry Changes Best Positioned Paper Grade Large market Significant consolidation Net capacity reductions Better inventory management Domestic business (U.S. & Mexico) Softwood fiber advantage Historic growth in demand
Slide 7: Containerboard: Largest U.S. Paper Grade Market
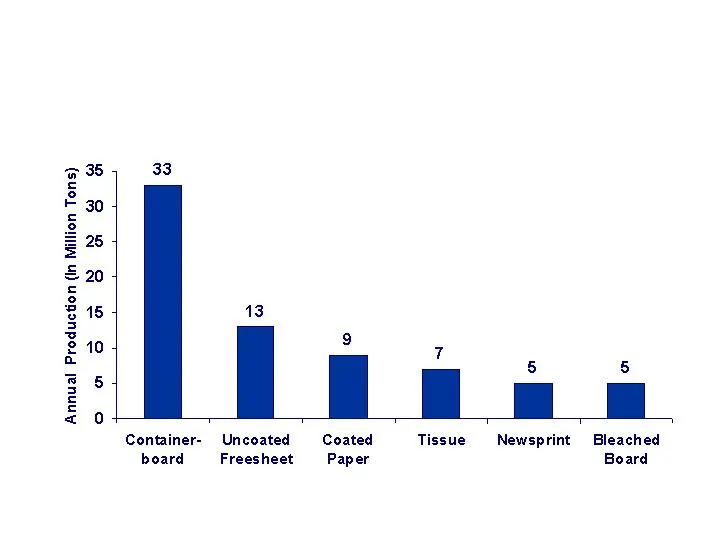
Containerboard: Largest U.S. Paper Grade Market

Slide 8: Significant Consolidation Has Improved Industry Discipline
Significant Consolidation Has Improved Industry Discipline Corrugated Packaging Market Shares Temple-Inland Is #3 In Corrugated Packaging In North America Stone Container % Weyerhaeuser Temple-Inland Jefferson Smurfit Tenneco Packaging Total Smurfit-Stone % Weyerhaeuser Temple-Inland International P
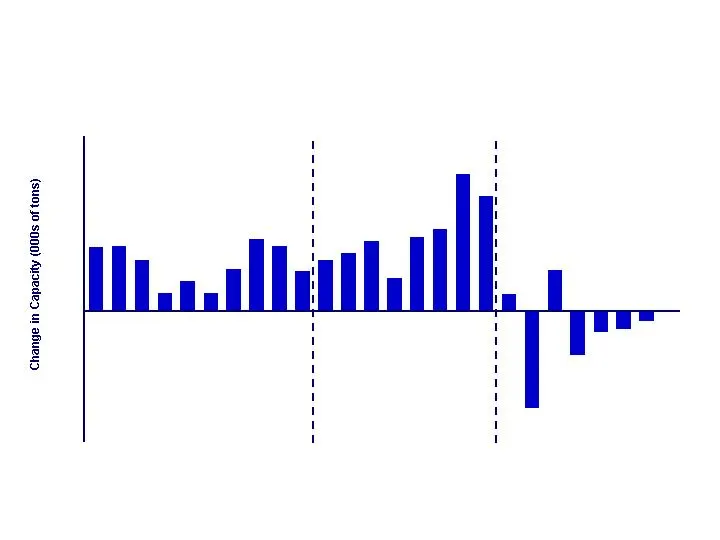
Slide 9: Restraint in New Domestic Capacity
Restraint in New Domestic Capacity Source: AFPA and Citigroup Smith Barney Research. (1,500) (1,000) (500) 1,000 1,500 2,000 2004E 1980 – 1989 Average: 529,000 1990 – 1997 Average: 882,000 1998 – 2005E Average: (166,000)
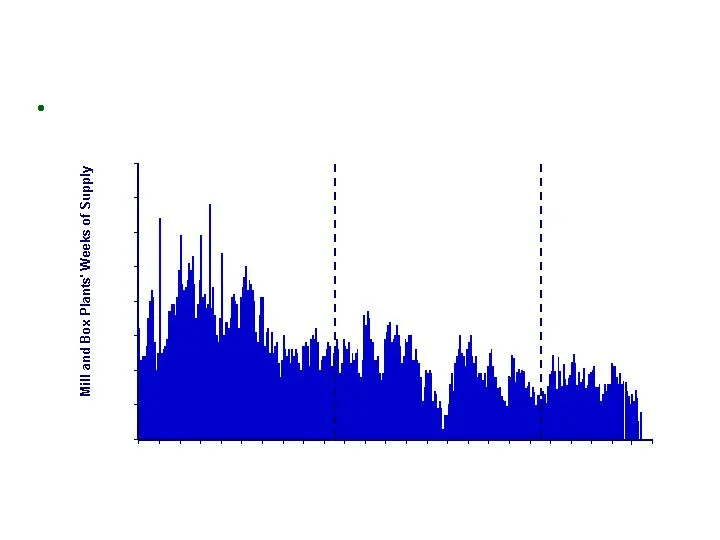
Slide 10: Better Inventory Management
3.0 4.0 5.0 6.0 7.0 8.0 9.0 10.0 11.0 Better Inventory Management Inventory Levels Continue to Decline Source: Pulp & Paper Week and Citigroup Smith Barney Research. (1) As of June, 2004. 1980 – 1989 Average: 6.4 Weeks 1990 – 1999 Average: 5.1 Weeks 2000 – Present (1) Average: 4.6 Weeks
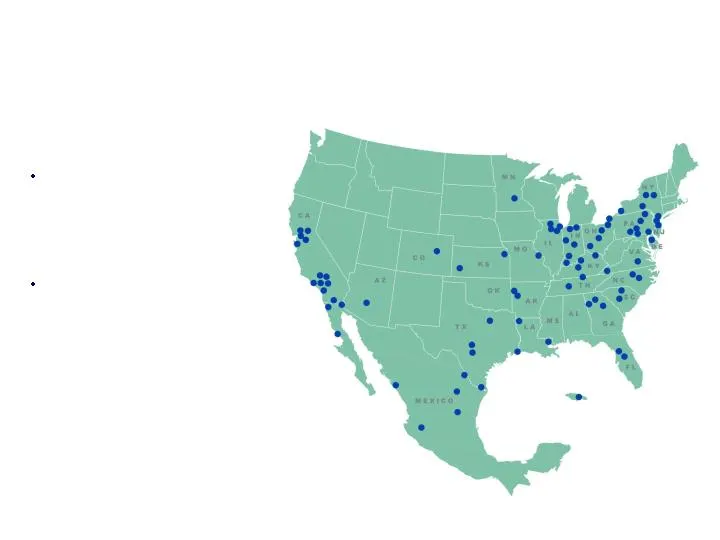
Slide 11: Domestic Business – U.S. & Mexico
Domestic Business – U.S. & Mexico Corrugated Packaging not subject to same import pressure as other paper grades Low-cost shipping alternative
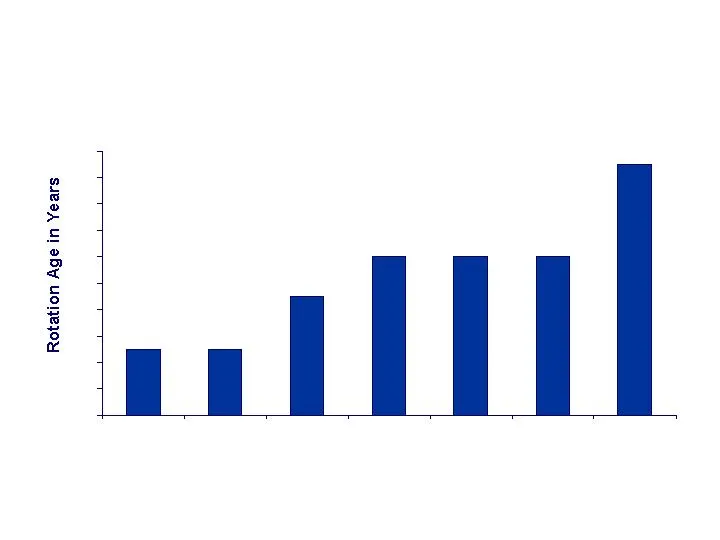
Slide 12: Softwood Fiber Advantage
Softwood Fiber Advantage U.S. South Southern Hemisphere U.S. Pacific Northwest Coastal U.S. Pacific Northwest Interior U.S. Northeast Europe Boreal
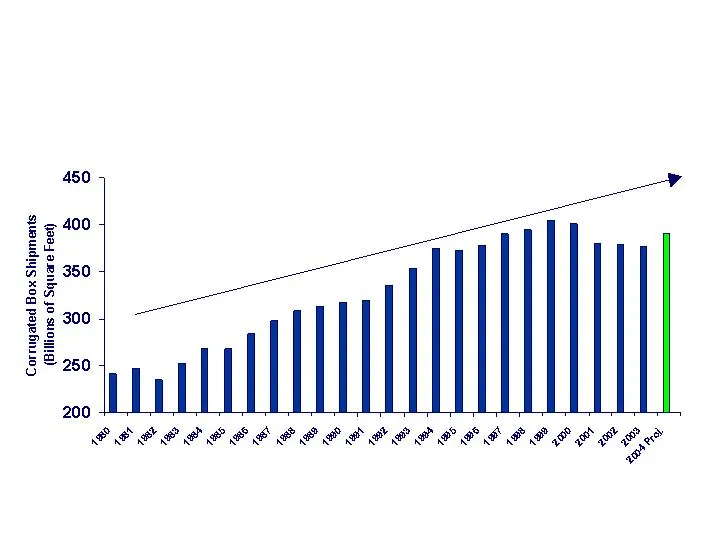
Slide 13: Historical Domestic Demand Growth Rate
Historical Domestic Demand Growth Rate CAGR 1980-2003 = 2% Note: 2004 Proj. based on first half 2004 3.7% industry growth in box shipments.

Slide 14: Our Key Actions in Corrugated Packaging
Our Key Actions in Corrugated Packaging Achieve Full Integration Levels Reduce Mill Cost Per Ton Reduce Box Plant Cost Project TIP Virgin Fiber Orientation – Reduced Reliance on OCC
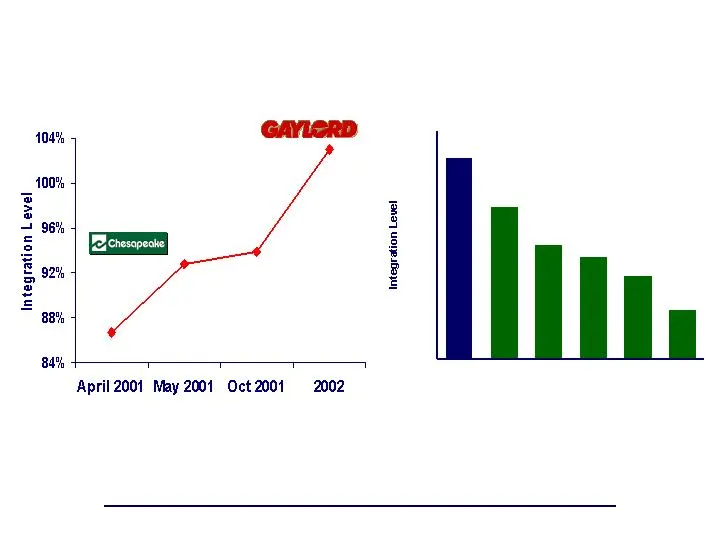
Slide 15: Increased Integration Through Acquisitions
Increased Integration Through Acquisitions ELGIN BOX PLANTS COMPRO ACQUISITION OF GAYLORD INCREASED TEMPLE-INLAND’S INTEGRATION LEVEL TO 103% Source: Miller Freeman and Management estimates. 103% 90% 80% 77% 72% 63% 50% 60% 70% 80% 90% 100% 110% TIN WY PKG SSCC GP IP
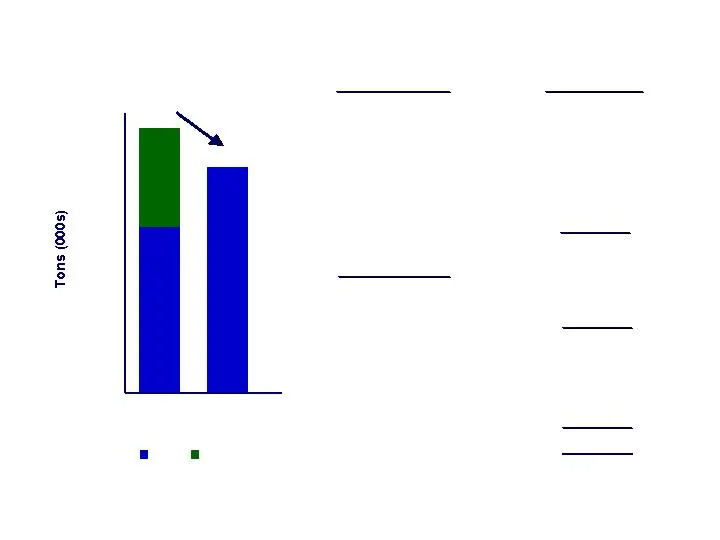
Slide 16: Capacity Rationalization
2,395 1,454 3,254 Capacity Rationalization Note: Excludes mill in Newport, IN (50% owned through JV) which has been converted to produce lightweight gypsum facing paper. (170) Bogalusa, LA (#2, #5, #6) (595) Total Capacity Closures Permanent Closures (425) Antioch, CA 1,029 Bogalusa, LA Antioch, CA
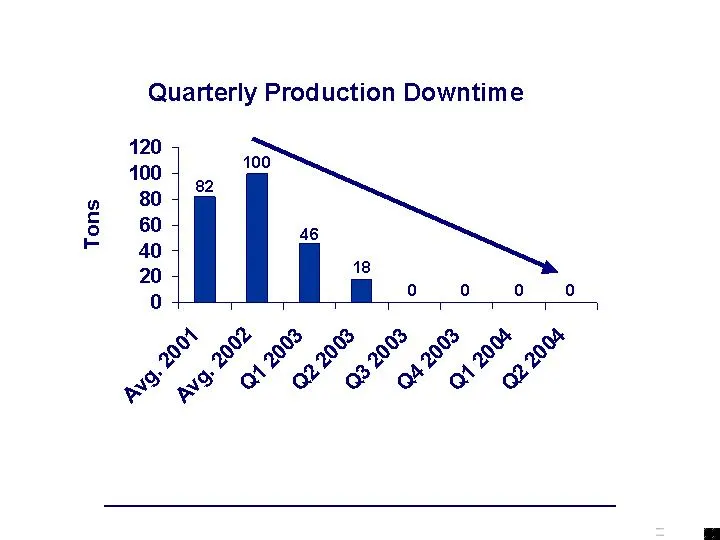
Slide 17: Mill Cost Reduction
Mill Cost Reduction Our high level of integration has allowed us to eliminate the need for downtime, allowing the mills to run full, providing opportunities to operate more efficiently and lower mill cost per ton.
Slide 18: Corrugated Packaging Facilities
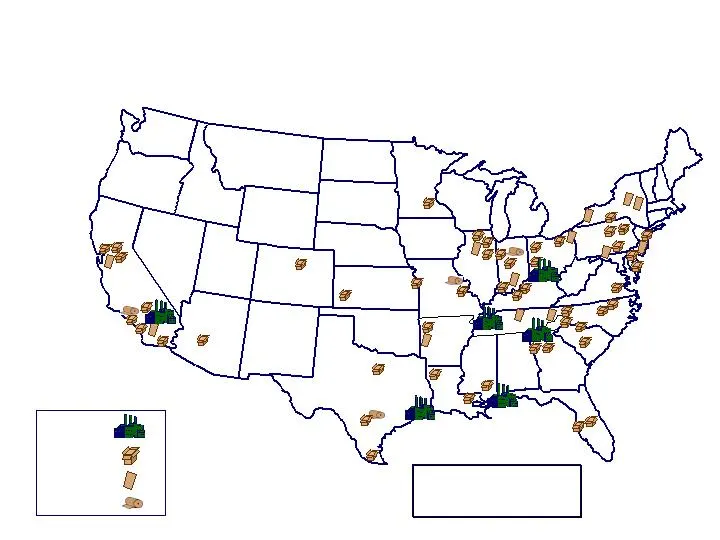
Corrugated Packaging Facilities 6 Mills 72 Converting facilities Bogalusa, LA Maysville, KY Ontario, CA Orange, TX New Johnsonville, TN Rome, GA Sheet feeder Box plant Sheet plant Mill Mexico Monterrey Guanajuato Sinaloa Guadalajara (Sheet Plant) Nuevo Laredo (Sheet Plant) Tiajuana (Sheet Plant)
Slide 19: Growth In Box Shipments
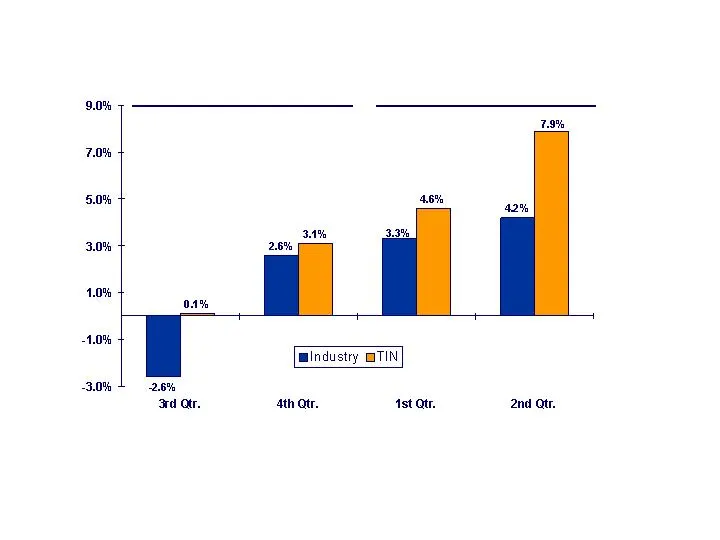
Growth In Box Shipments 2003 2004 Our growth in box shipments has exceeded industry growth rates for the past four quarters. Temple-Inland’s box shipments increased 7.9% in 2nd qtr. 2004 compared with 2nd qtr. 2003 with four less box plants.

Slide 20: Box Plant System Savings
Box Plant System Savings * Annual savings of $36 million in place during 2nd Qtr. 2004 Key Actions Status Annual Benefits - Elimination of 300 positions Complete $20 million during 4th Qtr. 2003 - Consolidation of converting In progress $40 million – YE 2005 facilities Total $60 million – YE 2005

Slide 21: Project TIP – Consolidation & Supply Chain
Project TIP – Consolidation & Supply Chain (Transformation – Innovation – Performance) Key Actions - Move corrugated packaging to Austin - Admin consolidation / shared services - Supply chain initiatives Benefits - Shared services – $35 million by year end 2004 - Supply chain - $40 million by year e
Slide 22: Reduced Reliance on OCC
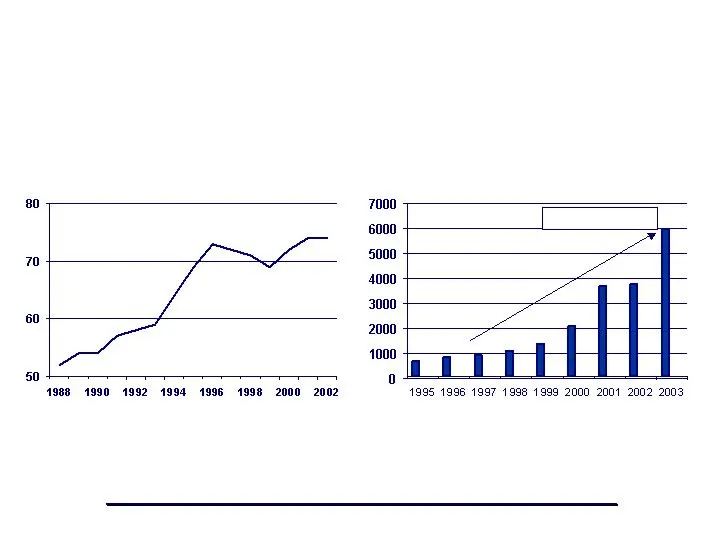
ACQUISITION OF GAYLORD AND CLOSURE OF ANTIOCH LOWERED TEMPLE-INLAND’S RELIANCE ON OCC FROM 40% TO 34%, INCREASING VIRGIN FIBER TO 66%. U.S. Recovered Paper Exports to China OCC Recovery Rate (%) Tons (000’s) Source: AF&PA Reduced Reliance on OCC Up 62% in 2003

Slide 23: Projected Annual Benefits
Projected Annual Benefits ($ In Millions) Project TIP Total Box Plant Savings Total Annual Savings By In Place Year-End Q2 2004
Slide 24: Housing Starts
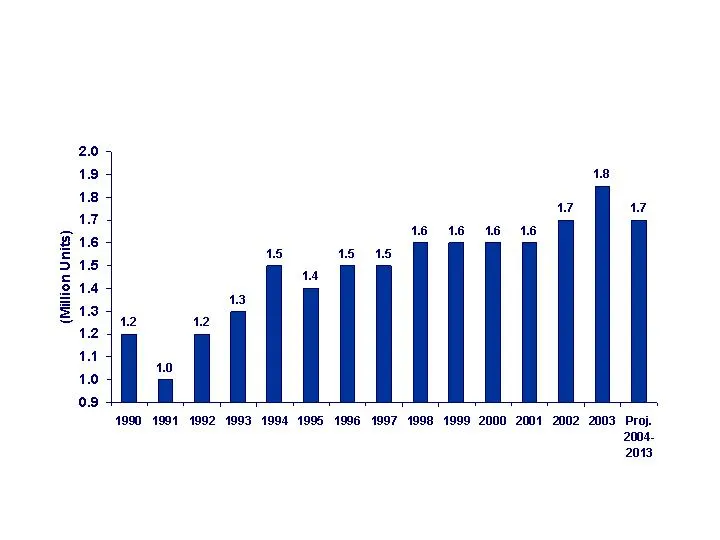
Housing Starts Source: Fannie Mae

Slide 25: Forest Products Strategy
Forest Products Strategy Maximize the value of timberlands through alignment of well-located converting operations with accelerated fiber growth Development of significant real-estate opportunities on high-value land
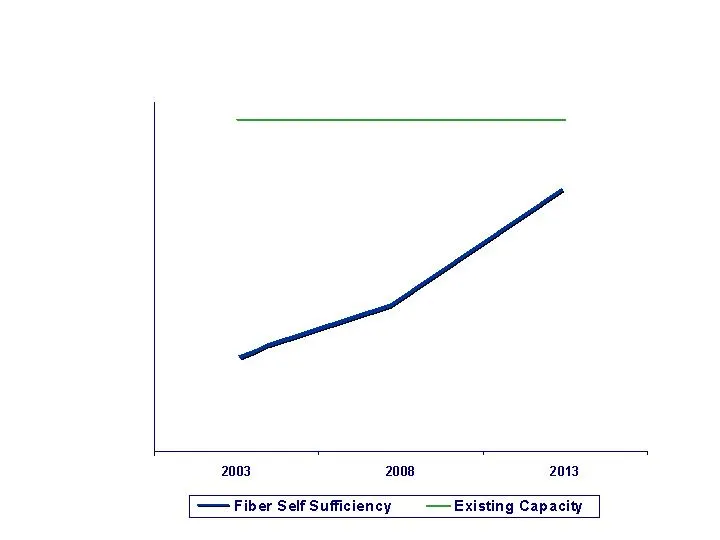
Slide 26: Pine Timber Self-Sufficiency
Pine Timber Self-Sufficiency Combined Operations 59% 66% 89% 100% 80% 60% 40%
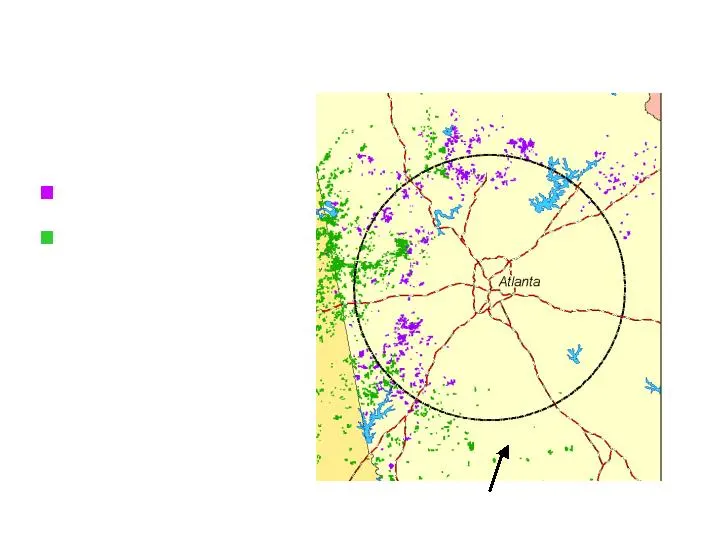
Slide 27: High-Value Land
High-Value Land ( 173,000 Acres) High Value lands Strategic lands 50 mile radius - Developing user value by creating infrastructure: roads, water, sewer, etc. - Average sales price per acre: 2003: $6000 2004: $7000

Slide 28: Financial Services Strategy
Financial Services Strategy Realization Of Earnings And Cash Flow Low-Risk Asset Profile Low-Cost Operations
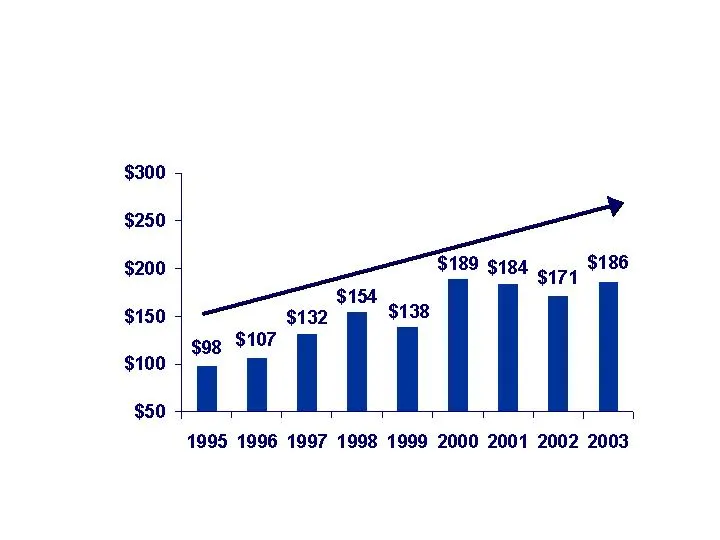
Slide 29: Financial Services: Earnings Growth & High Returns
Financial Services: Earnings Growth & High Returns Earnings (1995 - 2003) = $1.4 billion Average ROI = 18% ($ in millions) Note: 1996 excludes one-time SAIF assessment of $44 million.

Slide 30: Financial Services
Financial Services As a % of earning assets Housing Construction 16% 19% 23% Non-residential Real Estate 7% 12% 18% Corporate 11% 12% 14% Single-family Mortgage Assets 66 % 57 % 45 % Total earning assets 100% 100% 100% At Year End Loan Portfolio Rebalanced to include higher percentage of single- fam

Slide 31: Financial Services
Financial Services Benefits From Cost Reduction Initiatives Are $35 Million Over The Last Two Years 2002 : $20 million in annual savings from reducing personnel and canceling non-productive technology investments 2003 : $15 million additional savings from workforce reduction and consolidation of off

Slide 32: Financial Services Earnings
Financial Services Earnings ($ Millions) $112 $83 1 st Qtr $ $ 2 nd Qtr 3 rd Qtr - 4 th Qtr - Total $ 2003 Dividends $ 167 First Half 2004 Dividends $ ROI - 2003 18% ROI - 2004 (Annualized) 20%

Slide 33: Balance Sheet Data – Financial Flexibility
Balance Sheet Data – Financial Flexibility ($ Millions) 7/3/2004 Total assets 4,650 Long term debt 1,215 Upper DECS Total debt 1,560 Shareholders equity 2,065 Debt / total cap 43.0% Debt / total cap 34.0% (with Upper DECS converted) Liquidity – over $800 million availability under long term lines of
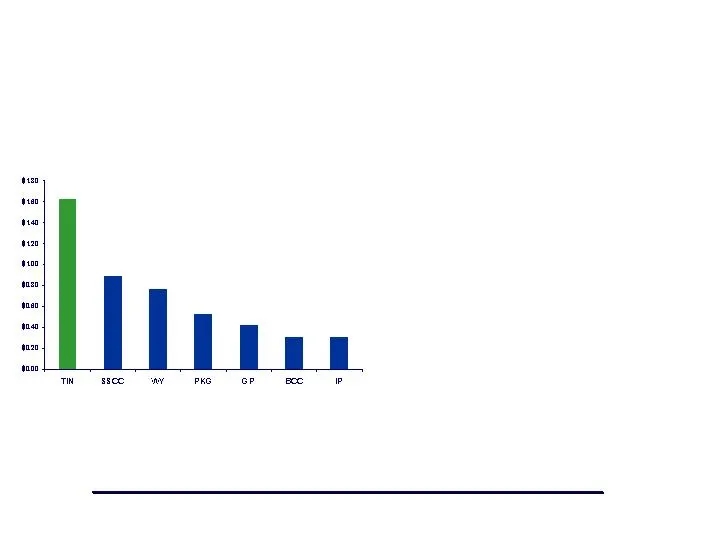
Slide 34: EPS & ROI Leverage
EPS & ROI Leverage Source: JP Morgan & UBS EPS ROI Fully-integrated system Capacity - 3.3 million tons Investment = $619 / ton Temple-Inland offers investors the highest EPS and ROI leverage to changes in containerboard pricing and cost improvement initiatives on a relative basis.
Slide 35: Temple-Inland
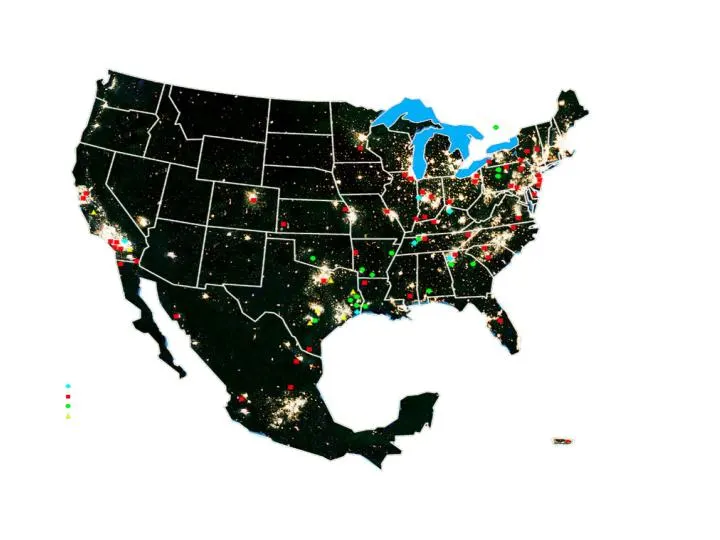
TEMPLE-INLAND Paper Mills Packaging Plants Building Products Financial Services Puerto Rico
Slide 36: Kenneth M. Jastrow, II
Kenneth M. Jastrow, II Chairman and Chief Executive Officer Christopher L. Nines Director of Investor Relations 512-434-5587
Source: SEC EDGAR · 8-K filed Sep 23, 2004
More decks from Temple-Inland Inc
 Q2 2011 Earnings Presentation17 slides · Jul 21, 2011
 Proxy Contest (June 2011)43 slides · Jun 20, 2011
 Merger or Acquisition (June 2011)38 slides · Jun 6, 2011
 Q1 2011 Earnings Presentation16 slides · Apr 20, 2011
 Investor Presentation (February 2011)35 slides · Feb 14, 2011
 Q4 2010 Earnings Presentation28 slides · Feb 8, 2011