Novelis — Q2 FY2010 Earnings Presentation
27 slides from Novelis's earnings presentation, Nov 3, 2009
Slide 1: Novelis Second Quarter Fiscal Year 2010 Earnings Conference Call
Brighter ideas with aluminum Novelis Second Quarter Fiscal Year 2010 Earnings Conference Call November 3, 2009 Philip Martens President & Chief Operating Officer Steve Fisher Senior Vice President & Chief Financial Officer
Slide 2: Safe Harbor Statement
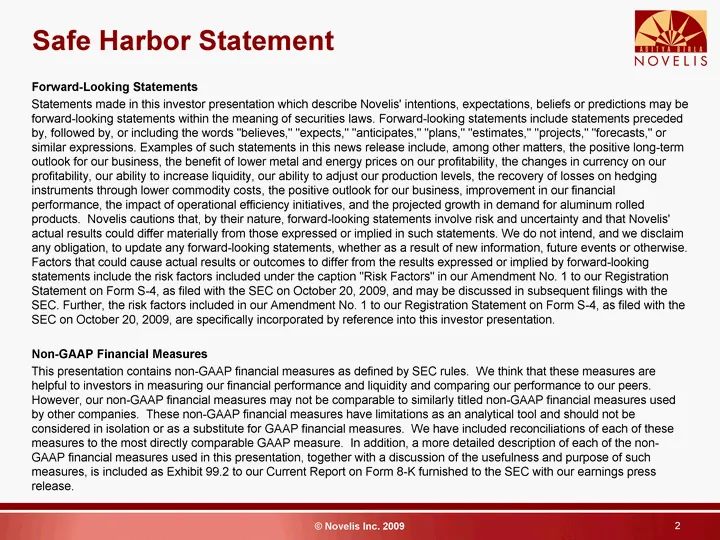
Safe Harbor Statement 2 Forward-Looking Statements Statements made in this investor presentation which describe Novelis' intentions, expectations, beliefs or predictions may be forward-looking statements within the meaning of securities laws. Forward-looking statements include statements preceded by
Slide 3: Agenda
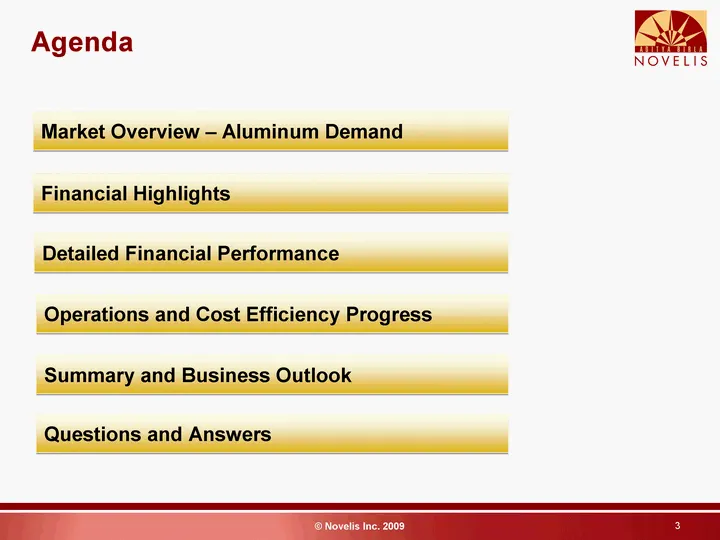
3 Agenda Market Overview - Aluminum Demand Financial Highlights Detailed Financial Performance Summary and Business Outlook Operations and Cost Efficiency Progress Questions and Answers
Slide 4: Current Trends in Aluminum Demand
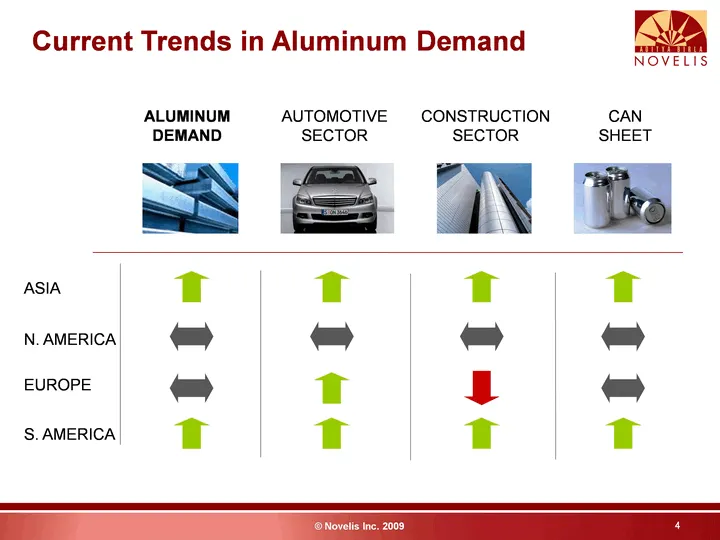
4 4 CONSTRUCTION SECTOR AUTOMOTIVE SECTOR CAN SHEET N. A. EUROPE S. A. ASIA ALUMINUM DEMAND Current Trends in Aluminum Demand
Slide 5: Shipments & Sales
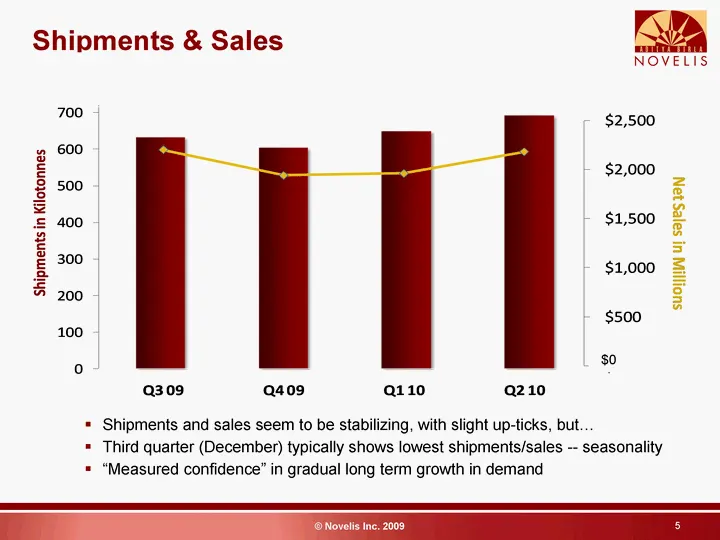
Shipments & Sales $0 Shipments and sales seem to be stabilizing, with slight up-ticks, but... Third quarter (December) typically shows lowest shipments/sales -- seasonality "Measured confidence" in gradual long term growth in demand 5
Slide 6: Shipments by Region
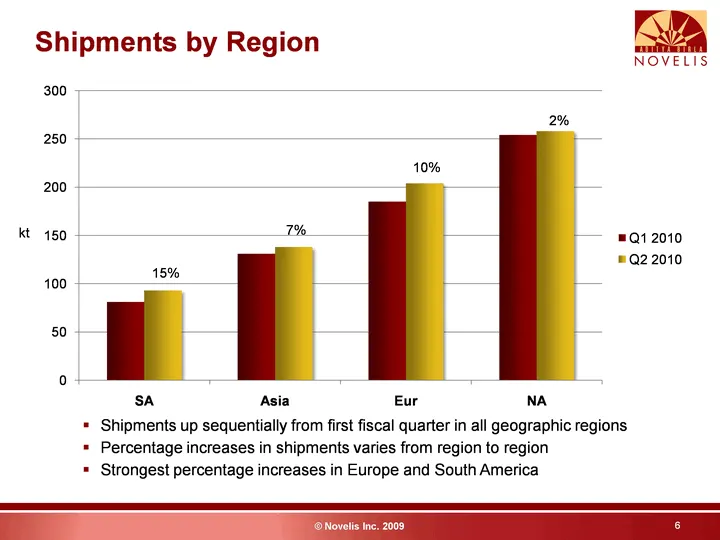
6 Shipments by Region Shipments up sequentially from first fiscal quarter in all geographic regions Percentage increases in shipments varies from region to region Strongest percentage increases in Asia and South America Strongest percentage increases in Asia and South America Strongest percentage in
Slide 7: Quarterly Financial Performance
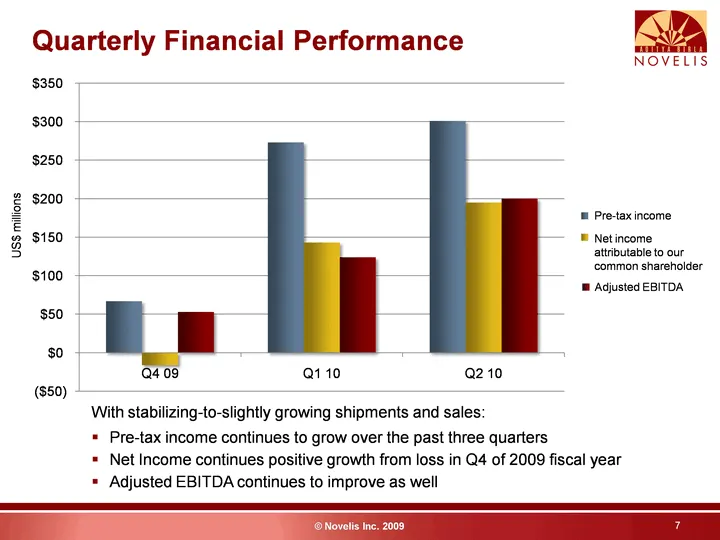
7 Quarterly Financial Performance Against stabilizing-to-slightly growing shipments and sales: Pre-tax income continues to grow over the past three quarters Net Income continues positive growth from loss in Q4 of 2009 fiscal year Adjusted EBITDA continues to improve as well
Slide 8: Second Quarter Financial Highlights
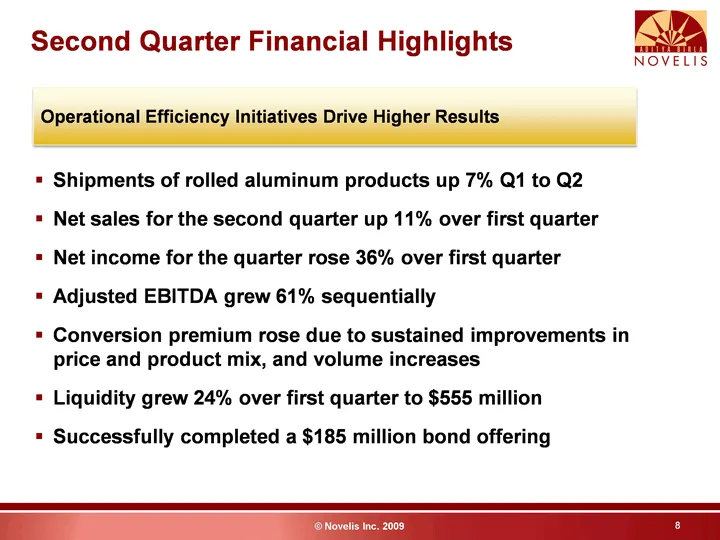
8 Second Quarter Financial Highlights Shipments of rolled aluminum products up 7% Q1 to Q2 Net sales for the second quarter up 11% over first quarter Net income for the quarter rose 36% over first quarter Adjusted EBITDA grew 61% sequentially Conversion premium rose in all four regions due to price
Slide 9: Financial Performance
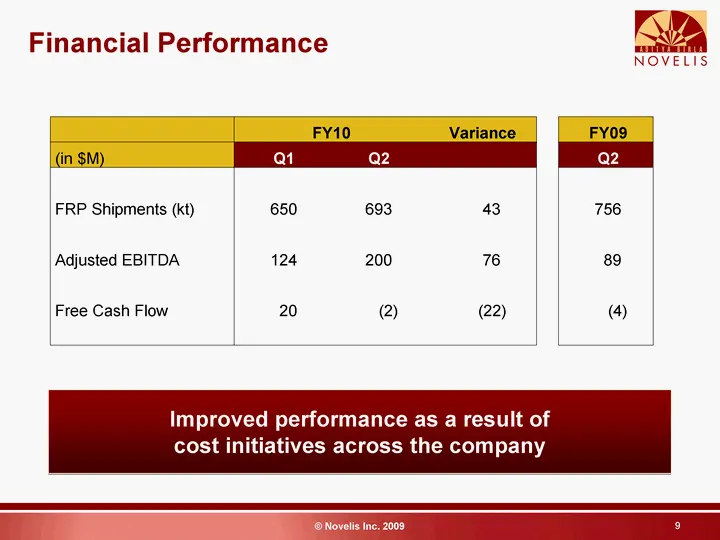
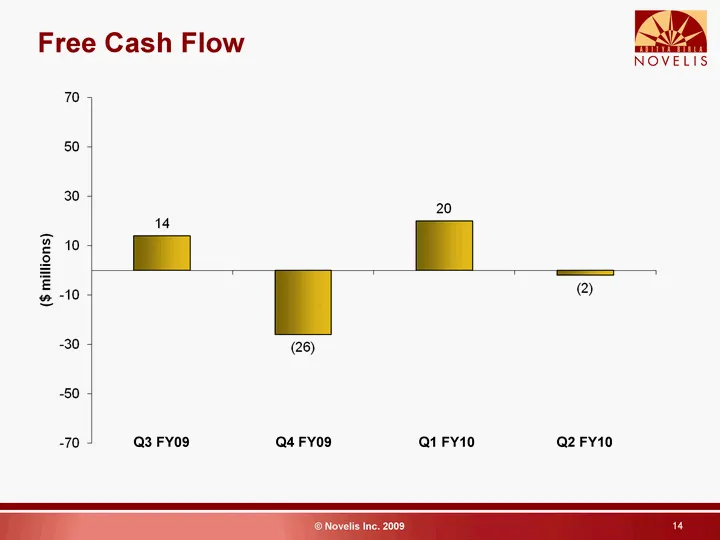
9 Financial Performance Improved performance as a result of cost initiatives across the company FY10 FY10 Variance FY09 (in $M) Q1 Q2 Q2 FRP Shipments (kt) 650 693 43 756 Adjusted EBITDA 124 200 76 89 Free Cash Flow 20 (2) (22) (4)
Slide 10: Sequential Income Statement
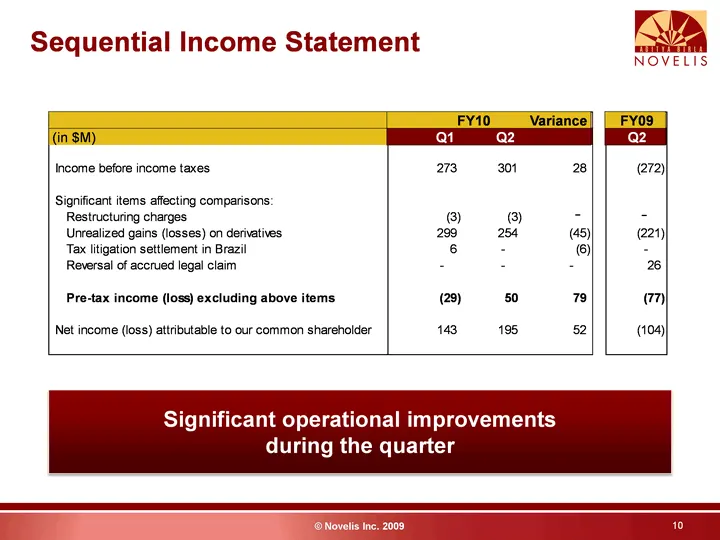
10 Sequential Income Statement Significant operational improvements during the quarter FY10 FY10 Variance FY09 (in $M) Q1 Q2 Q2
Slide 11: Adjusted EBITDA Q2 FY10 vs Q1 FY10
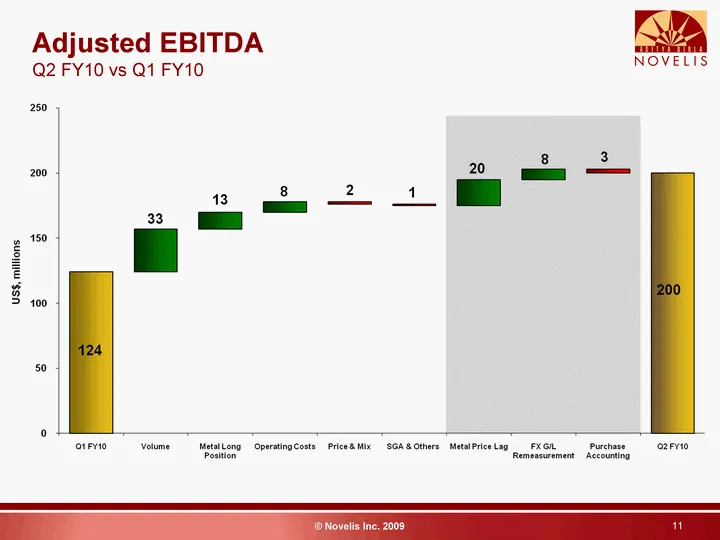
11 Adjusted EBITDA Q2 FY10 vs Q1 FY10
Slide 12: Adjusted EBITDA Q2 FY10 vs PY
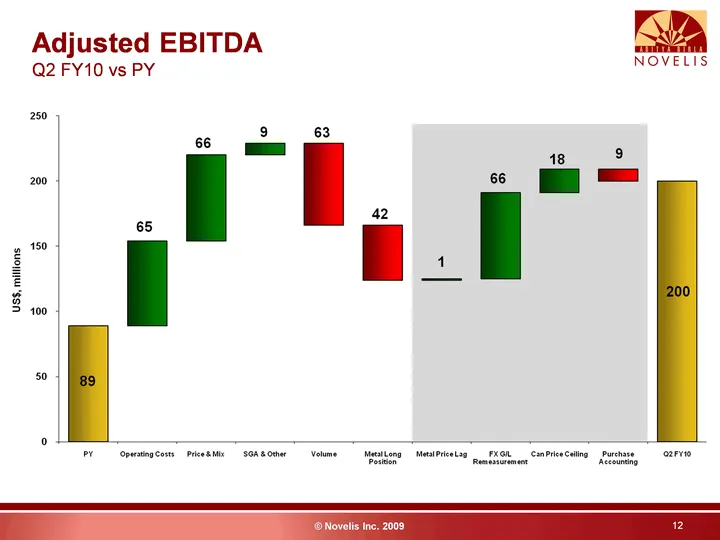
12 Adjusted EBITDA Q2 FY10 vs PY
Slide 13: Sequential Segment Adjusted EBITDA
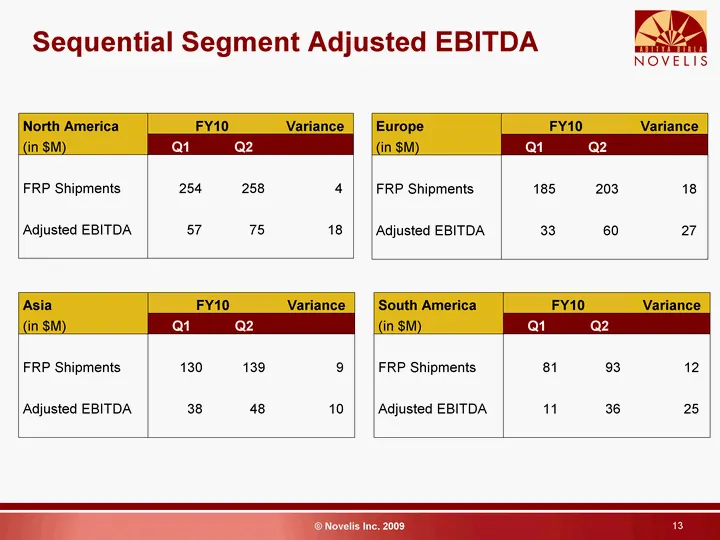
13 Sequential Segment Adjusted EBITDA North America FY10 FY10 Variance (in $M) Q1 Q2 FRP Shipments 254 258 4 Adjusted EBITDA 57 75 18 Europe FY10 FY10 Variance (in $M) Q1 Q2 FRP Shipments 185 203 18 Adjusted EBITDA 33 60 27 Asia FY10 FY10 Variance (in $M) Q1 Q2 FRP Shipments 130 139 9 Adjusted EBITD
Slide 14: Free Cash Flow
14 Free Cash Flow Q3 FY09 Q4 FY09 Q1 FY10 Q2 FY10
Slide 15: Adequate Liquidity
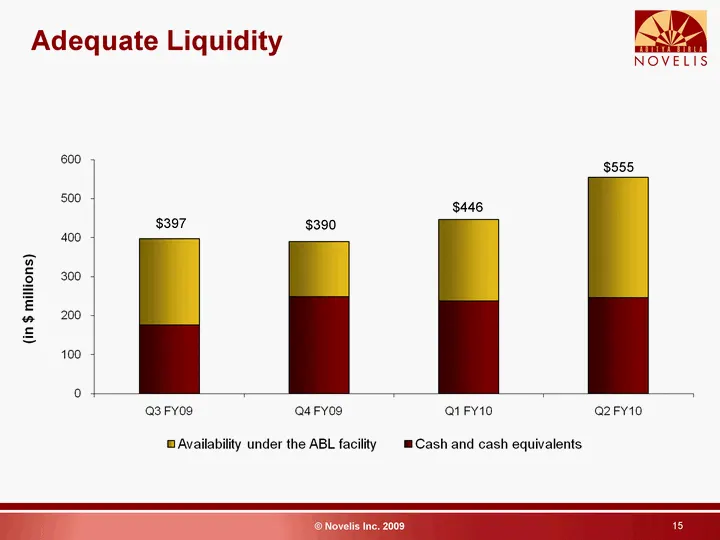
15 Adequate Liquidity $397 $390 $446 $555
Slide 16: Capital Expenditures
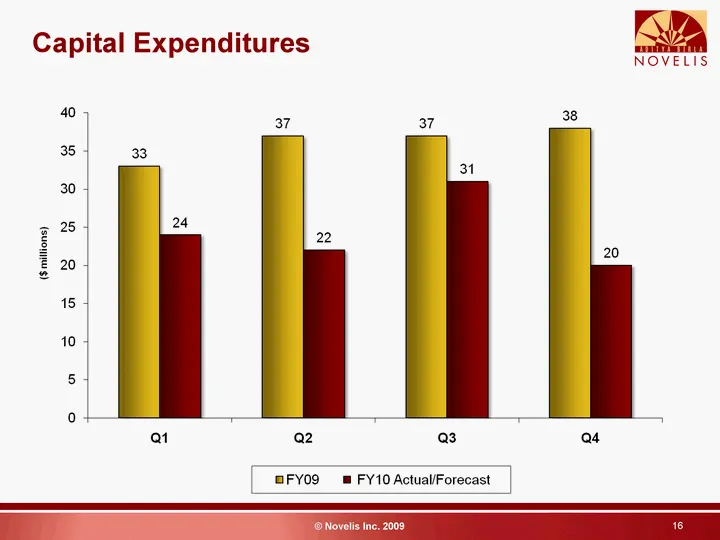
Capital Expenditures NOVELIS 38 33 34 25 24 {mitions) 8 at a2 Qs a4 BFYOS @ FY10 Actual/Forecast
Slide 17: Strategic Initiatives
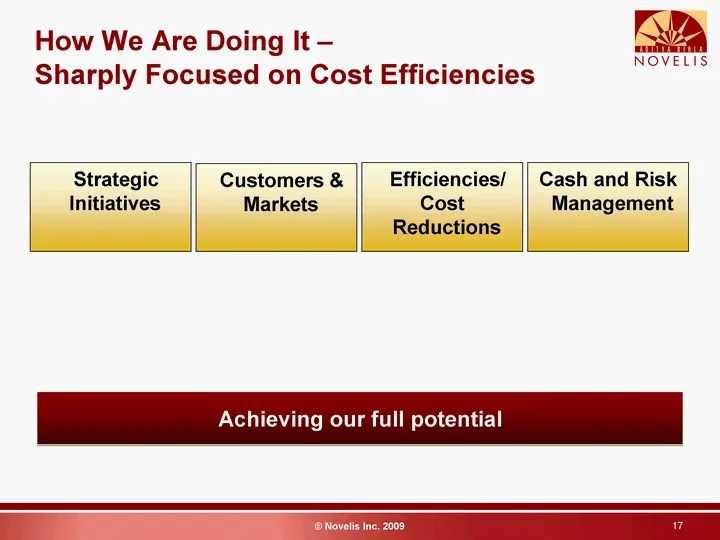
17 Strategic Initiatives How We Are Doing It - Sharply Focused on Cost Efficiencies Achieving our full potential Customers & Markets Efficiencies/ Cost Reductions Cash and Risk Management
Slide 18: How We Are Doing It: Strengthening senior management team
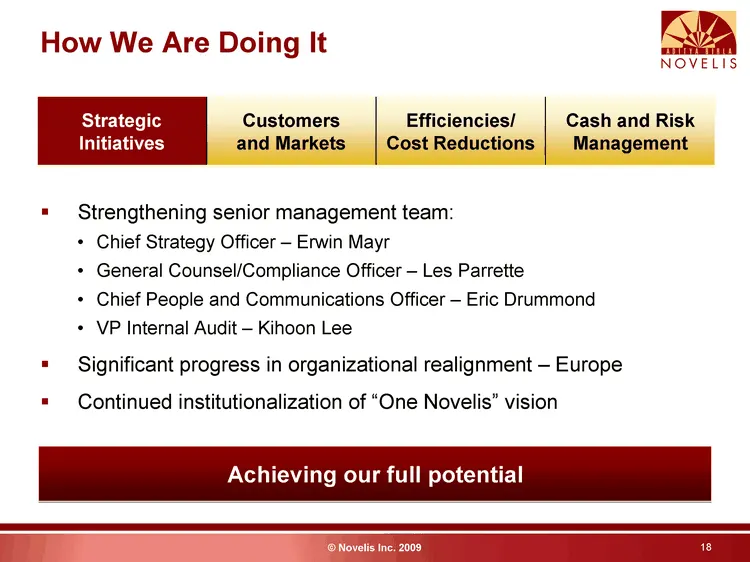
18 How We Are Doing It Achieving our full potential Strengthening senior management team Chief Strategy Officer - Erwin Mayr General Counsel/Compliance Officer - Les Parrette Chief People and Communications Officer - Eric Drummond Significant progress in organizational realignment - Europe Continued
Slide 19: How We Are Doing It: Contract pricing discipline
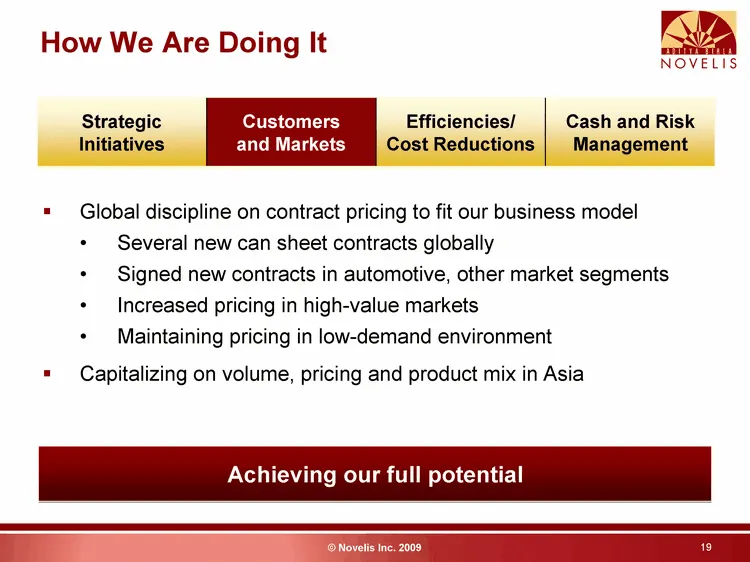
19 How We Are Doing It Achieving our full potential Global discipline on contract pricing to fit our business model Several new can sheet contracts globally Signed new contracts in automotive, other market segments Maintaining pricing in low-demand environment Increasing pricing in high-value market
Slide 20: How We Are Doing It: Efficiencies and cost reductions
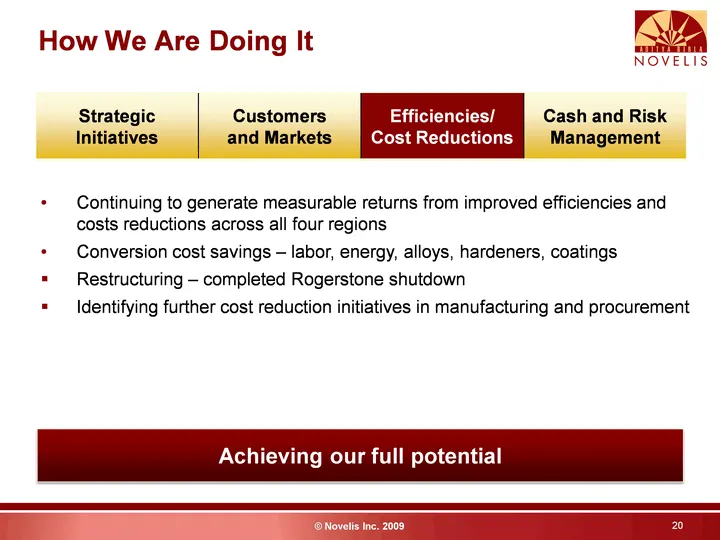
20 How We Are Doing It Achieving our full potential Continuing to generate measurable returns from improved efficiencies and costs reductions across all four regions Cost controls - standardizing procurement processes Conversion cost savings - labor, energy, alloys, hardeners, coatings Restructuring
Slide 21: How We Are Doing It: Cash and risk management
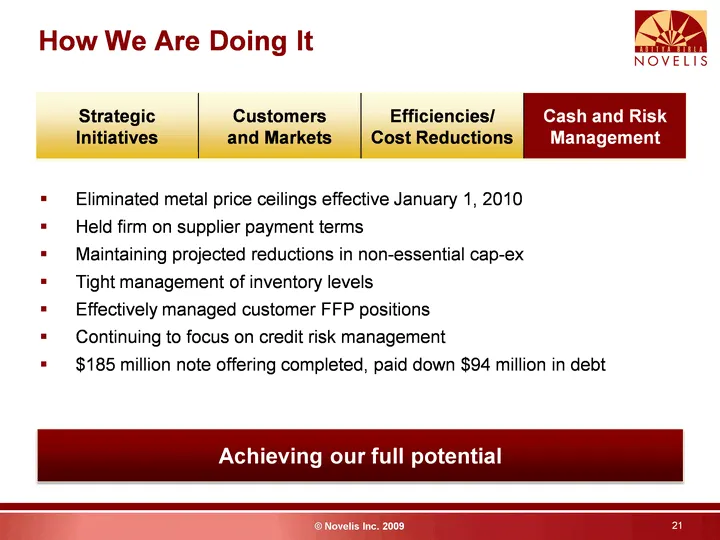
21 How We Are Doing It Achieving our full potential Eliminated metal price ceilings effective January 1, 2010 Held firm on supplier payment terms Maintaining projected reductions in non-essential cap-ex Managing inventory levels to match production levels Effectively managed customer FFP positions C
Slide 22: Business Summary and Outlook
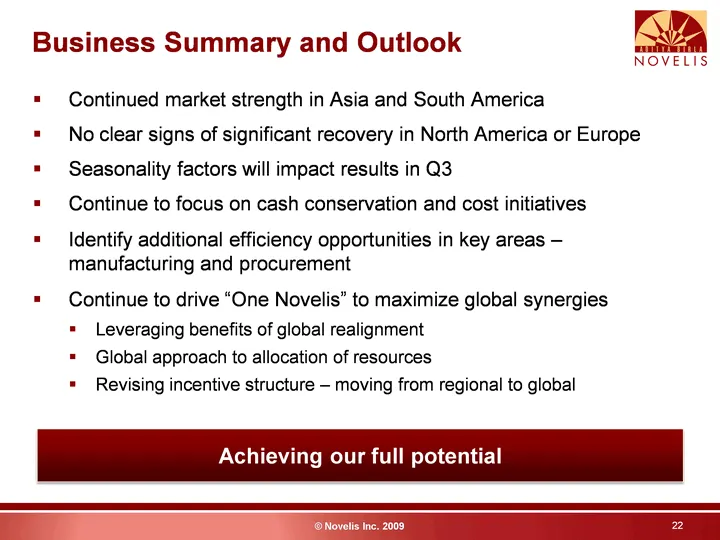
22 Business Summary and Outlook Asia and South America continue to be strong No clear signs of significant recovery in North America or Europe Seasonality factors will impact results in Q3 Continue to focus on cash conservation and cost initiatives Identify additional efficiency opportunities in key
Slide 23: Questions?
23 Questions?

Slide 24: Appendix
24 Appendix
Slide 25: Income Statement Reconciliation to Adjusted EBITDA
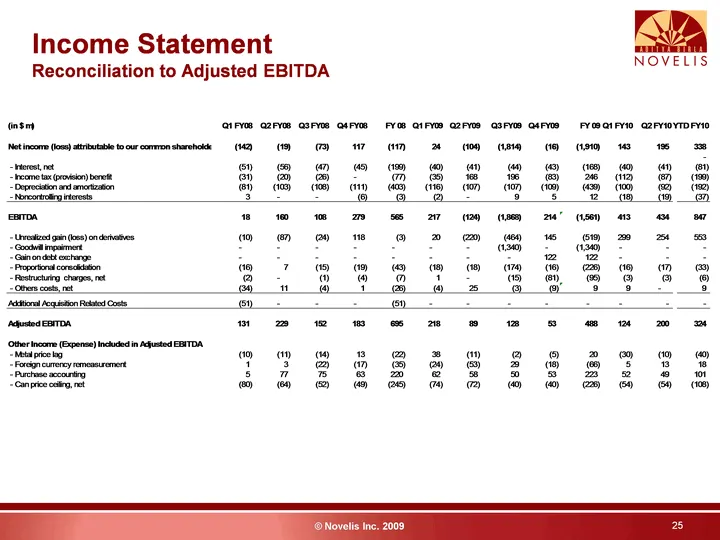
25 Income Statement Reconciliation to Adjusted EBITDA
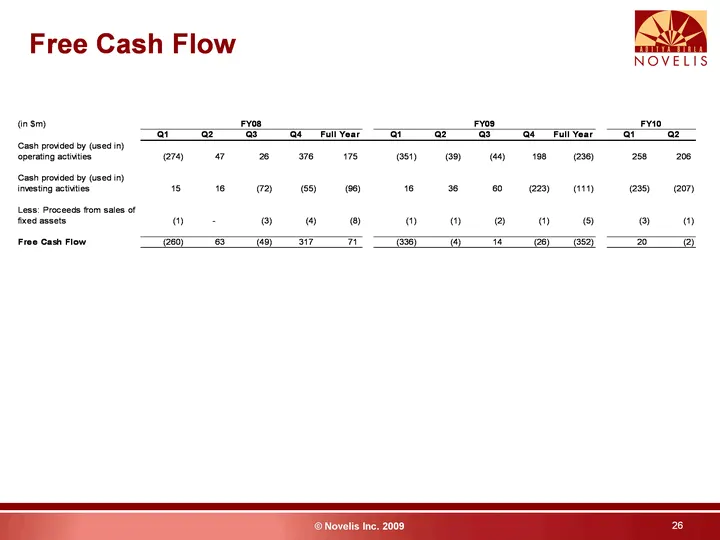
Slide 26: Free Cash Flow
Free Cash Flow NOVELIS dn sm Fs Fv08 evio ‘aia ae ai—aa "as ae raver ara ‘cash proved by (sed in) operating acts a Cd ‘cash proved by (sein) Investing actives 5 eS) ey Less: Proceeds tom eats of red acts oo o © @ o 9 @ 7 © oe o Free cash Flow a a a 2
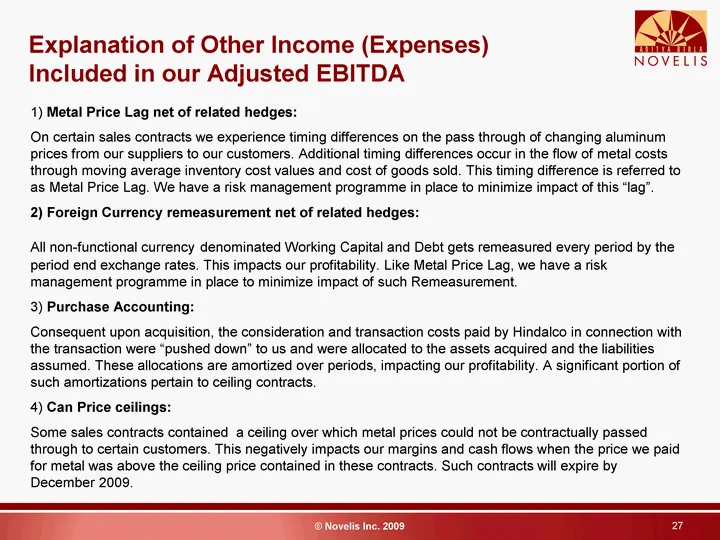
Slide 27: Explanation of Other Income (Expenses) Included in Adjusted EBITDA
27 Explanation of Other Income (Expenses) Included in our Adjusted EBITDA 1) Metal Price Lag net of related hedges: On certain sales contracts we experience timing differences on the pass through of changing aluminum prices from our suppliers to our customers. Additional timing differences occur in
Source: SEC EDGAR · 8-K filed Nov 3, 2009
More decks from Novelis Inc.
 Q2 FY2027 Earnings Presentation20 slides · Nov 5, 2026
 Q2 FY2027 Earnings Presentation31 slides · Nov 5, 2026
 Q1 FY2027 Earnings Presentation21 slides · Aug 5, 2026
 Q1 FY2027 Earnings Presentation31 slides · Aug 5, 2026
 Q4 FY2026 Earnings Presentation33 slides · May 19, 2026
 Q3 FY2026 Earnings Presentation33 slides · Feb 11, 2026